How to create a choropleth map
A choropleth map is a map in which areas (like states or countries) are filled with colors according to your data. Let's assume you want to map the age structure in Australia. The darker the color, the higher the share of people who are 75 years old or older:

This tutorial walks you through the steps to prepare and import data for a choropleth map in Datawrapper. We have a separate tutorial on how to create a symbol map.
Choose a map
To create a map, go to app.datawrapper.de/create/map and select Choropleth map.
The first question that Datawrapper will ask you after you've decided on a choropleth map, is: "What type of map do you want to create?"
Even if you know that you want a map of Australia, you can still decide between different levels – e.g. postal areas, suburbs, and electoral districts – and sometimes even different years.

We know that we want to make a map of Australia Local Government Areas (LGA) so we'll search for "Australia LGA", click on Australia » LGA and then click Proceed.
Prepare the data
Before we can visualize our age data, we need to bring them in the right format. Datawrapper will need a table with at least two columns:
- The key of each region you want to fill with a color. Most often, that's the name, like county names. But some regions have specific IDs, e.g. the FIPS-Code for counties in the US, or the LGA Code (which we'll use for our map).
- The value for each region. The values can be percentages (43.4%), full numbers (38430), or categories (yes/no/maybe). Our table will have the column called "75 or older" with numerical values: the share of people who are 75 years old or older.
Here is our table. As you can see, we have two more columns, "States" and "LGA name". In fact, we can have as many columns as we like, as long as one of them has a map key and one of them has some kind of value. Extra information like the state can be useful for tooltips, so we want to keep them in our table.
| LGA Code | LGA Name | 75 or older | States |
| 10050 | Albury | 8.12 | New South Wales |
| 10130 | Armidale Regional | 7.94 | New South Wales |
| 10250 | Ballina | 11.84 | New South Wales |
| 10300 | Balranald | 7.78 | New South Wales |
| ... | ... | ... | ... |
Import the data
Once you prepared the data, let's add it to your map! You'll find all the options to do so in the Upload tab in step 2: Add your data:

Here are all the ways to import your table:
- Write your values directly into the Datawrapper table. This takes a long time, so this works best for maps with only a few regions.
- Upload a CSV or Excel file. To do so, click on Upload file.
- Copy & paste your data into the text field in the Upload tab, e.g. from Excel or Google Sheets. This is the most convenient option for lots of our users.
- Link an external dataset. That's the best option if your data keeps updating (e.g. election results during election night), and you want your embedded map to always show the latest numbers. Learn more in our article "How to create a live-updating choropleth map".
- Import a Google Spreadsheet. That's a good option if you or a coworker is changing the data by hand a lot and you want to make sure that your map shows the latest numbers when visualizing it. Learn more in our article "How to connect your choropleth map to Google Sheets".
Below all that, you find the option to fill the table with random data (if you just want to try out our tool).
Match your data with the map
Once you upload your data, Datawrapper automatically tries to match your columns with the matching keys it has stored for each map. In the case of the Australia map, Datawrapper accepts the LGA code or the LGA name. We uploaded both, and you can choose either in Match > Matching key.
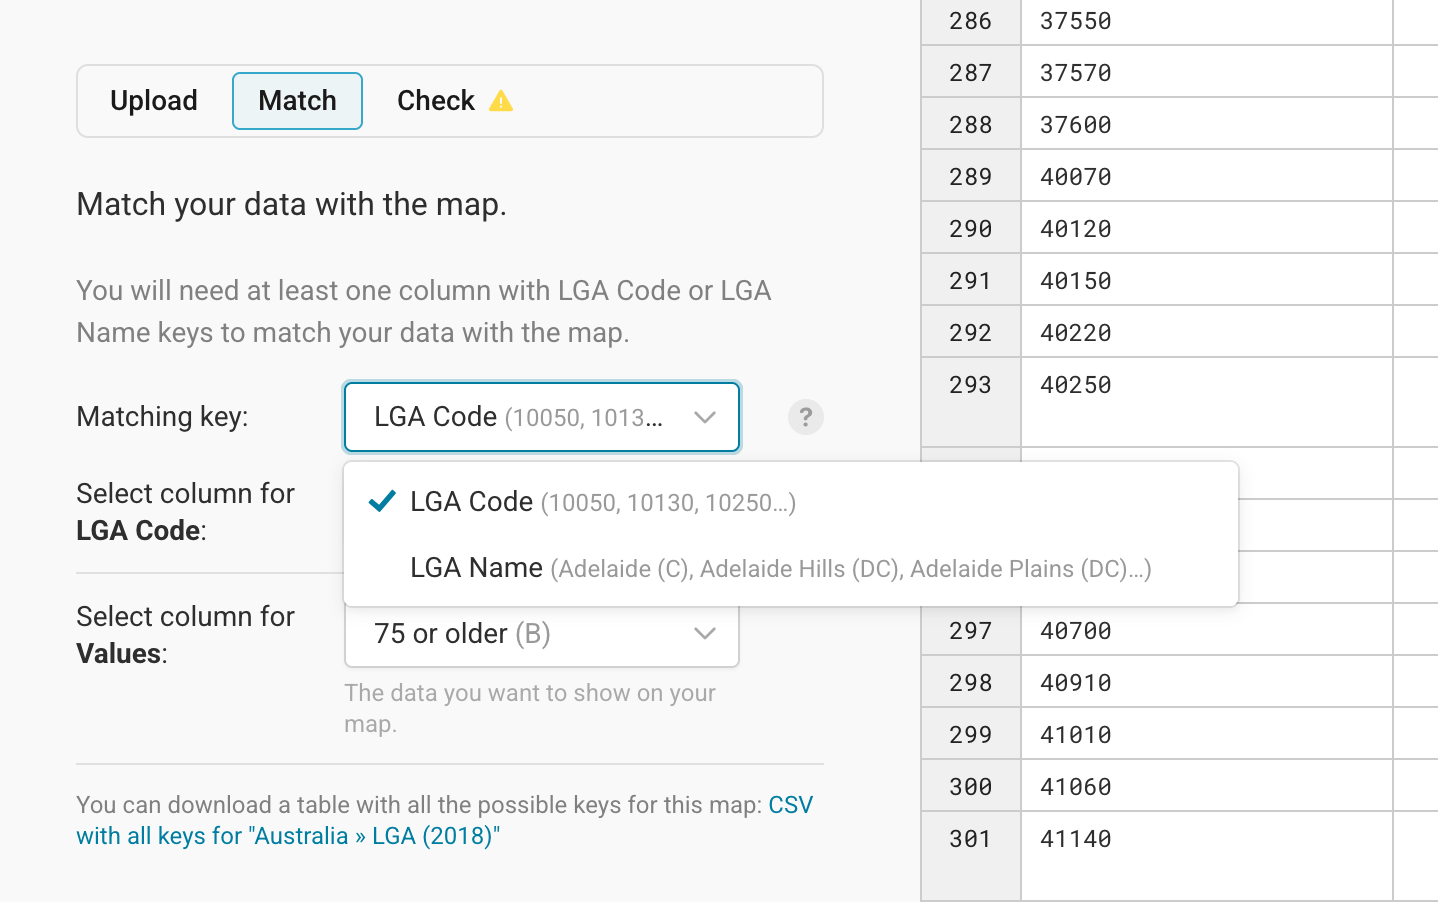
We recommend to check which matching keys are accepted at the beginning of your data preparation process. You can download a CSV with all possible keys for the map directly from the Match tab (see the bottom of the screenshot above).
Names can be fuzzy because they might have abbreviations, extra spaces, more details, etc. So an ID is often the safer bet to make sure that as many areas as possible get matched correctly.
If Datawrapper didn't match your columns correctly, you can select the column that has the matching key (LGA code, in our case) and the columns for values (you can still change this later) yourself in the Match tab.
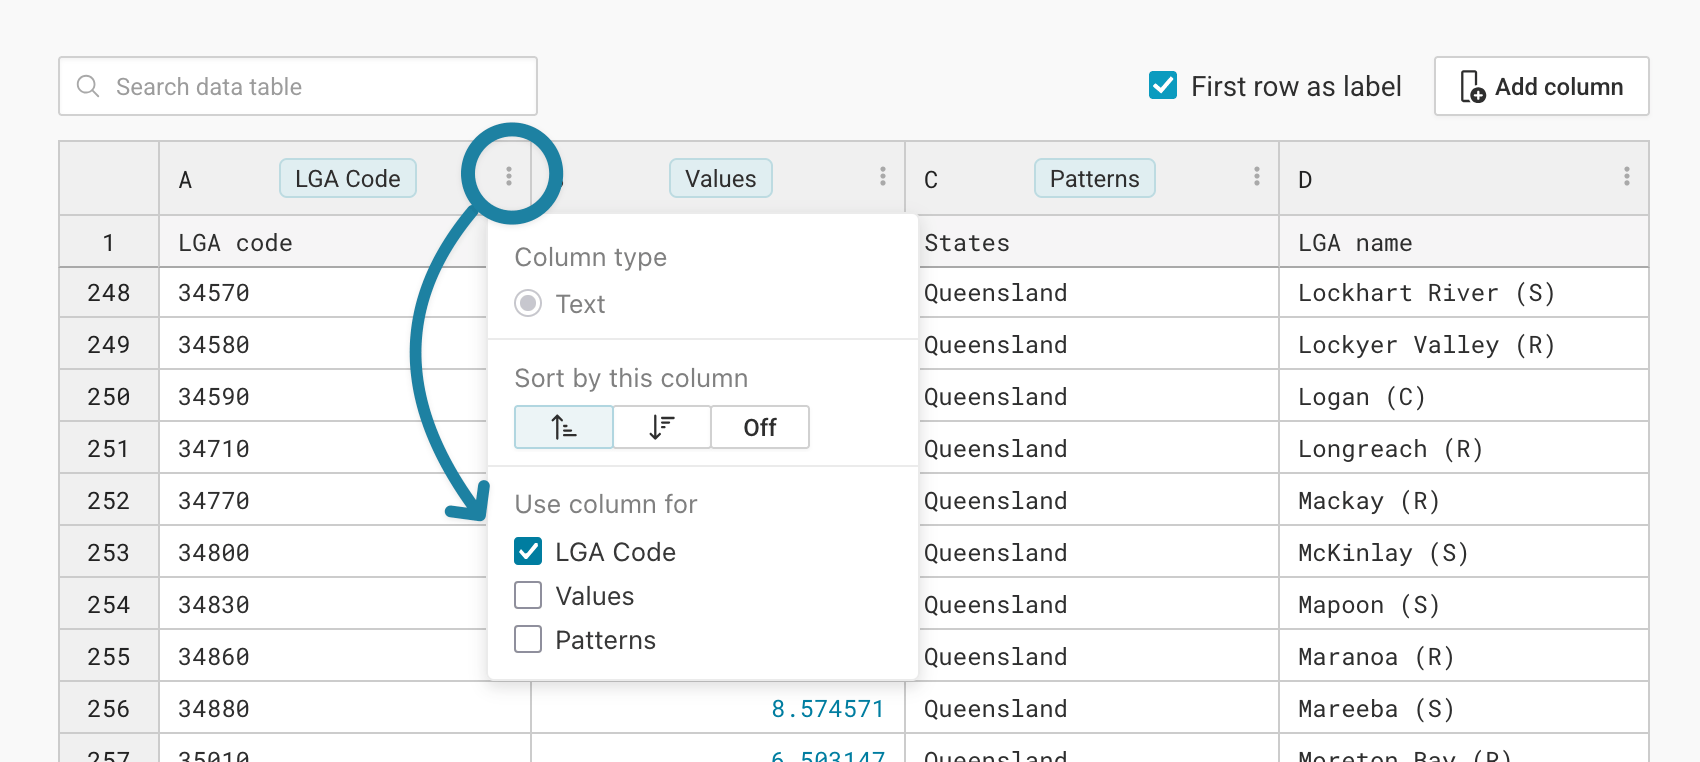
You can also define what your columns should be used for directly in the table. To do so, click on the three dots next to the column ID ("A", "B", etc.), then check any of the check boxes below Use column for:
Check and correct your data
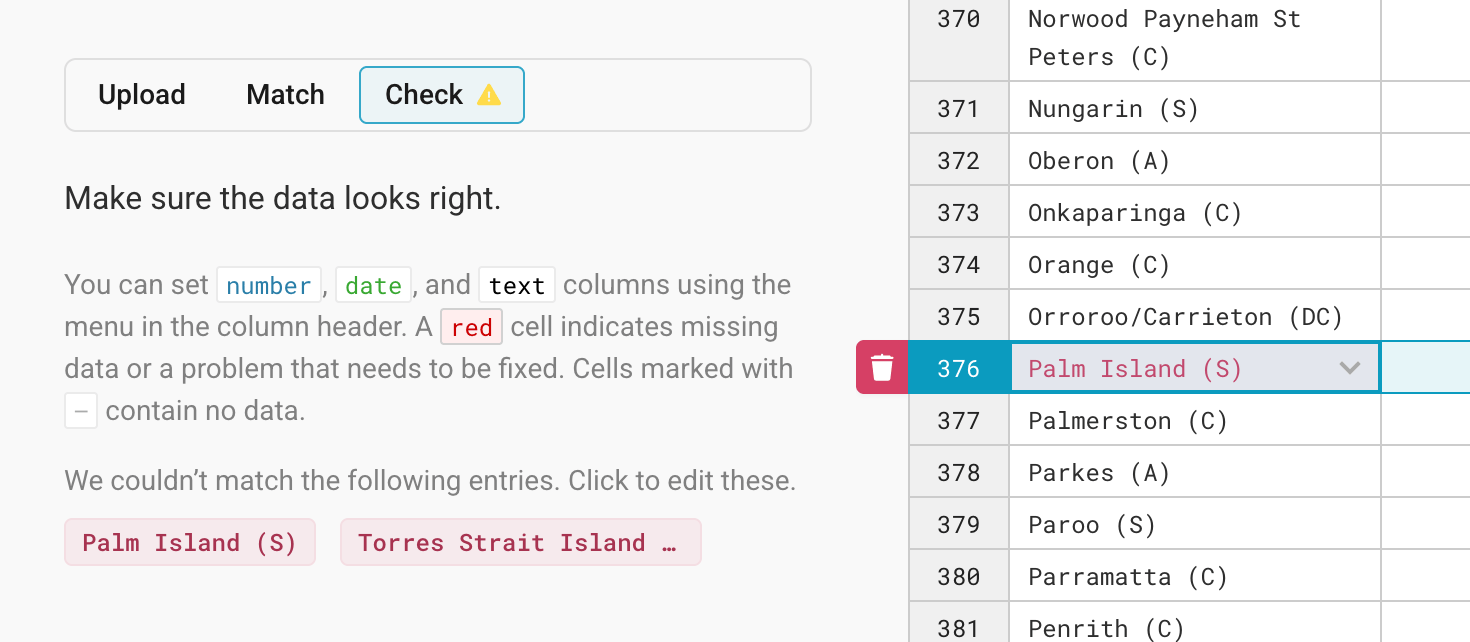
Some of your regions might have a different key in your data than in our map – e.g. "Czechia" instead of "Czech Republic" in a map about Europe. Datawapper will highlight the regions it couldn't match in your data set in the Check tab, and lets you correct them.
Click on one of the highlighted entries in the Check tab, and you'll see the corresponding row in the table with all yet-unmatched regions. Here's how that looks like if we choose the LGA names as our matching keys:
If Datawrapper (and you) can't find the correct matching key for a region, it will be ignored in the final map. To delete a row, click on the row number and the little trash icon that appears next to it:
That's it!
If you successfully imported and matched the data, click on Proceed to go to step 3: Visualize. Here you can tweak the colors, title, map key, zoom buttons etc. We will cover this part in the next tutorial: Customizing your choropleth map.