Show your data clearly with tables
Explore data tables, heatmaps and tables with mini-charts table types in Datawrapper.
Data tables:
Let readers explore your data.
1/3
Edit visualization
Open visualization in the Datawrapper app
Responsive and interactive data tables
Help readers get the most out of your table through powerful interactions and on any device.

Make your table searchable for easier navigation of large datasets.
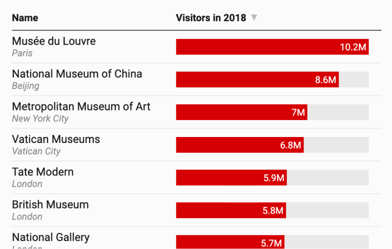
Make selected columns sortable.
Choose a compact layout.
Add pagination and choose how many rows to show per page.
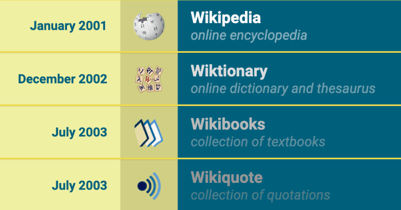
Replace country codes with flags. Learn more in the Academy
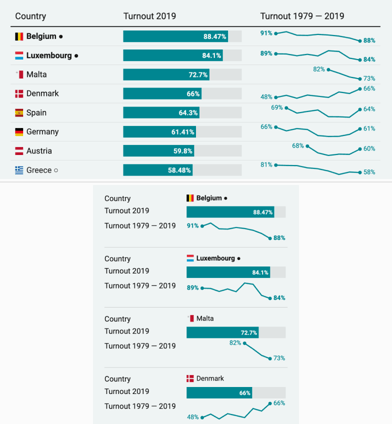
Turn on a mobile fallback.
Make the first column sticky for very wide tables.
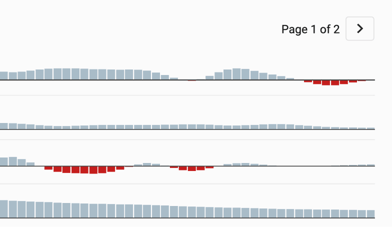
Go beyond the grid by adding visualizations
Visualize data within your table by creating heatmaps or adding line, bar, and column charts.
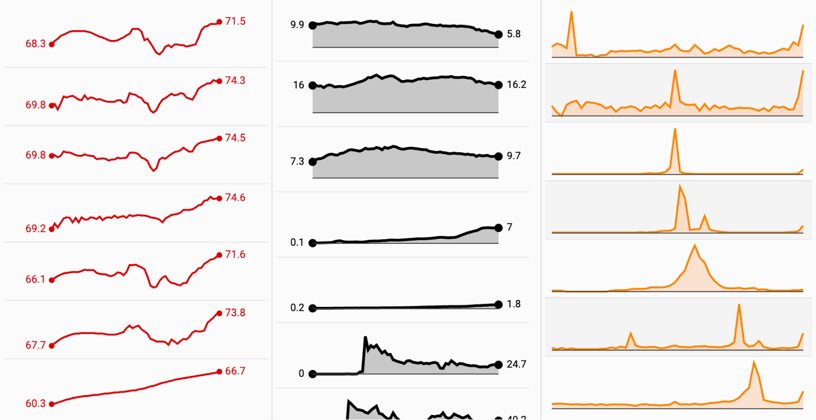
Add line charts. Learn more in the Academy
Add bar charts.
Add column charts.
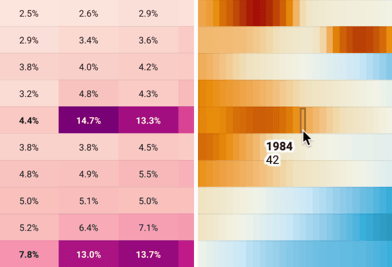
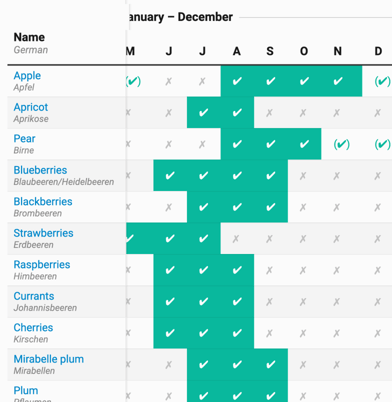
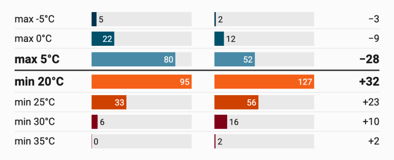
Create Heatmaps. Learn more in the Academy
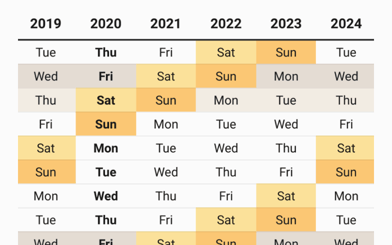
Color cells based on categories – even from another column. Learn more in the Academy
Customize your table further
Fine-tune the appearance of your table by adding images and customizing styles and localization.
Style each row and column (format, color, background color, alignment, border).
Translate all table elements with a click. Learn more in the Academy
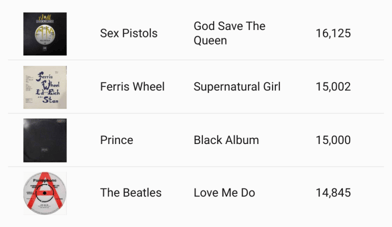
Add images to tables.