Product

Dark mode
with one click

A Datawrapper range plot in bright mode and in dark mode next to each other. In dark mode, the background becomes black and the text becomes white.
Datawrapper visualizations are easy on the eyes day and night, thanks to our own color contrast algorithm.
Try dark mode in Datawrapper
It’s free, with no sign-up required.
Switch off the lights, as easy as at home

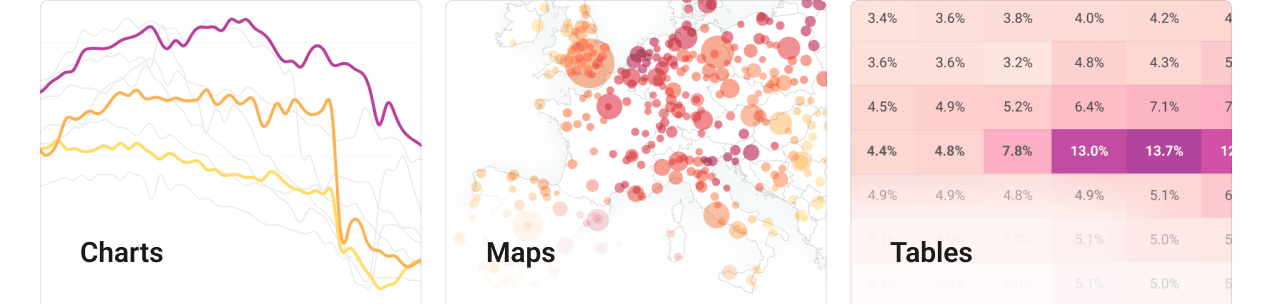
It’s really that simple to turn on dark mode for all Datawrapper chart types, map types, and tables.

Just activate “Automatic dark mode,” and the colors in your visualization will adapt automatically to your readers’ own dark mode settings. The background turns dark, and the colors of your text and chart elements turn brighter.

Curious what your readers will see? You can preview dark mode for each visualization in the Datawrapper app.

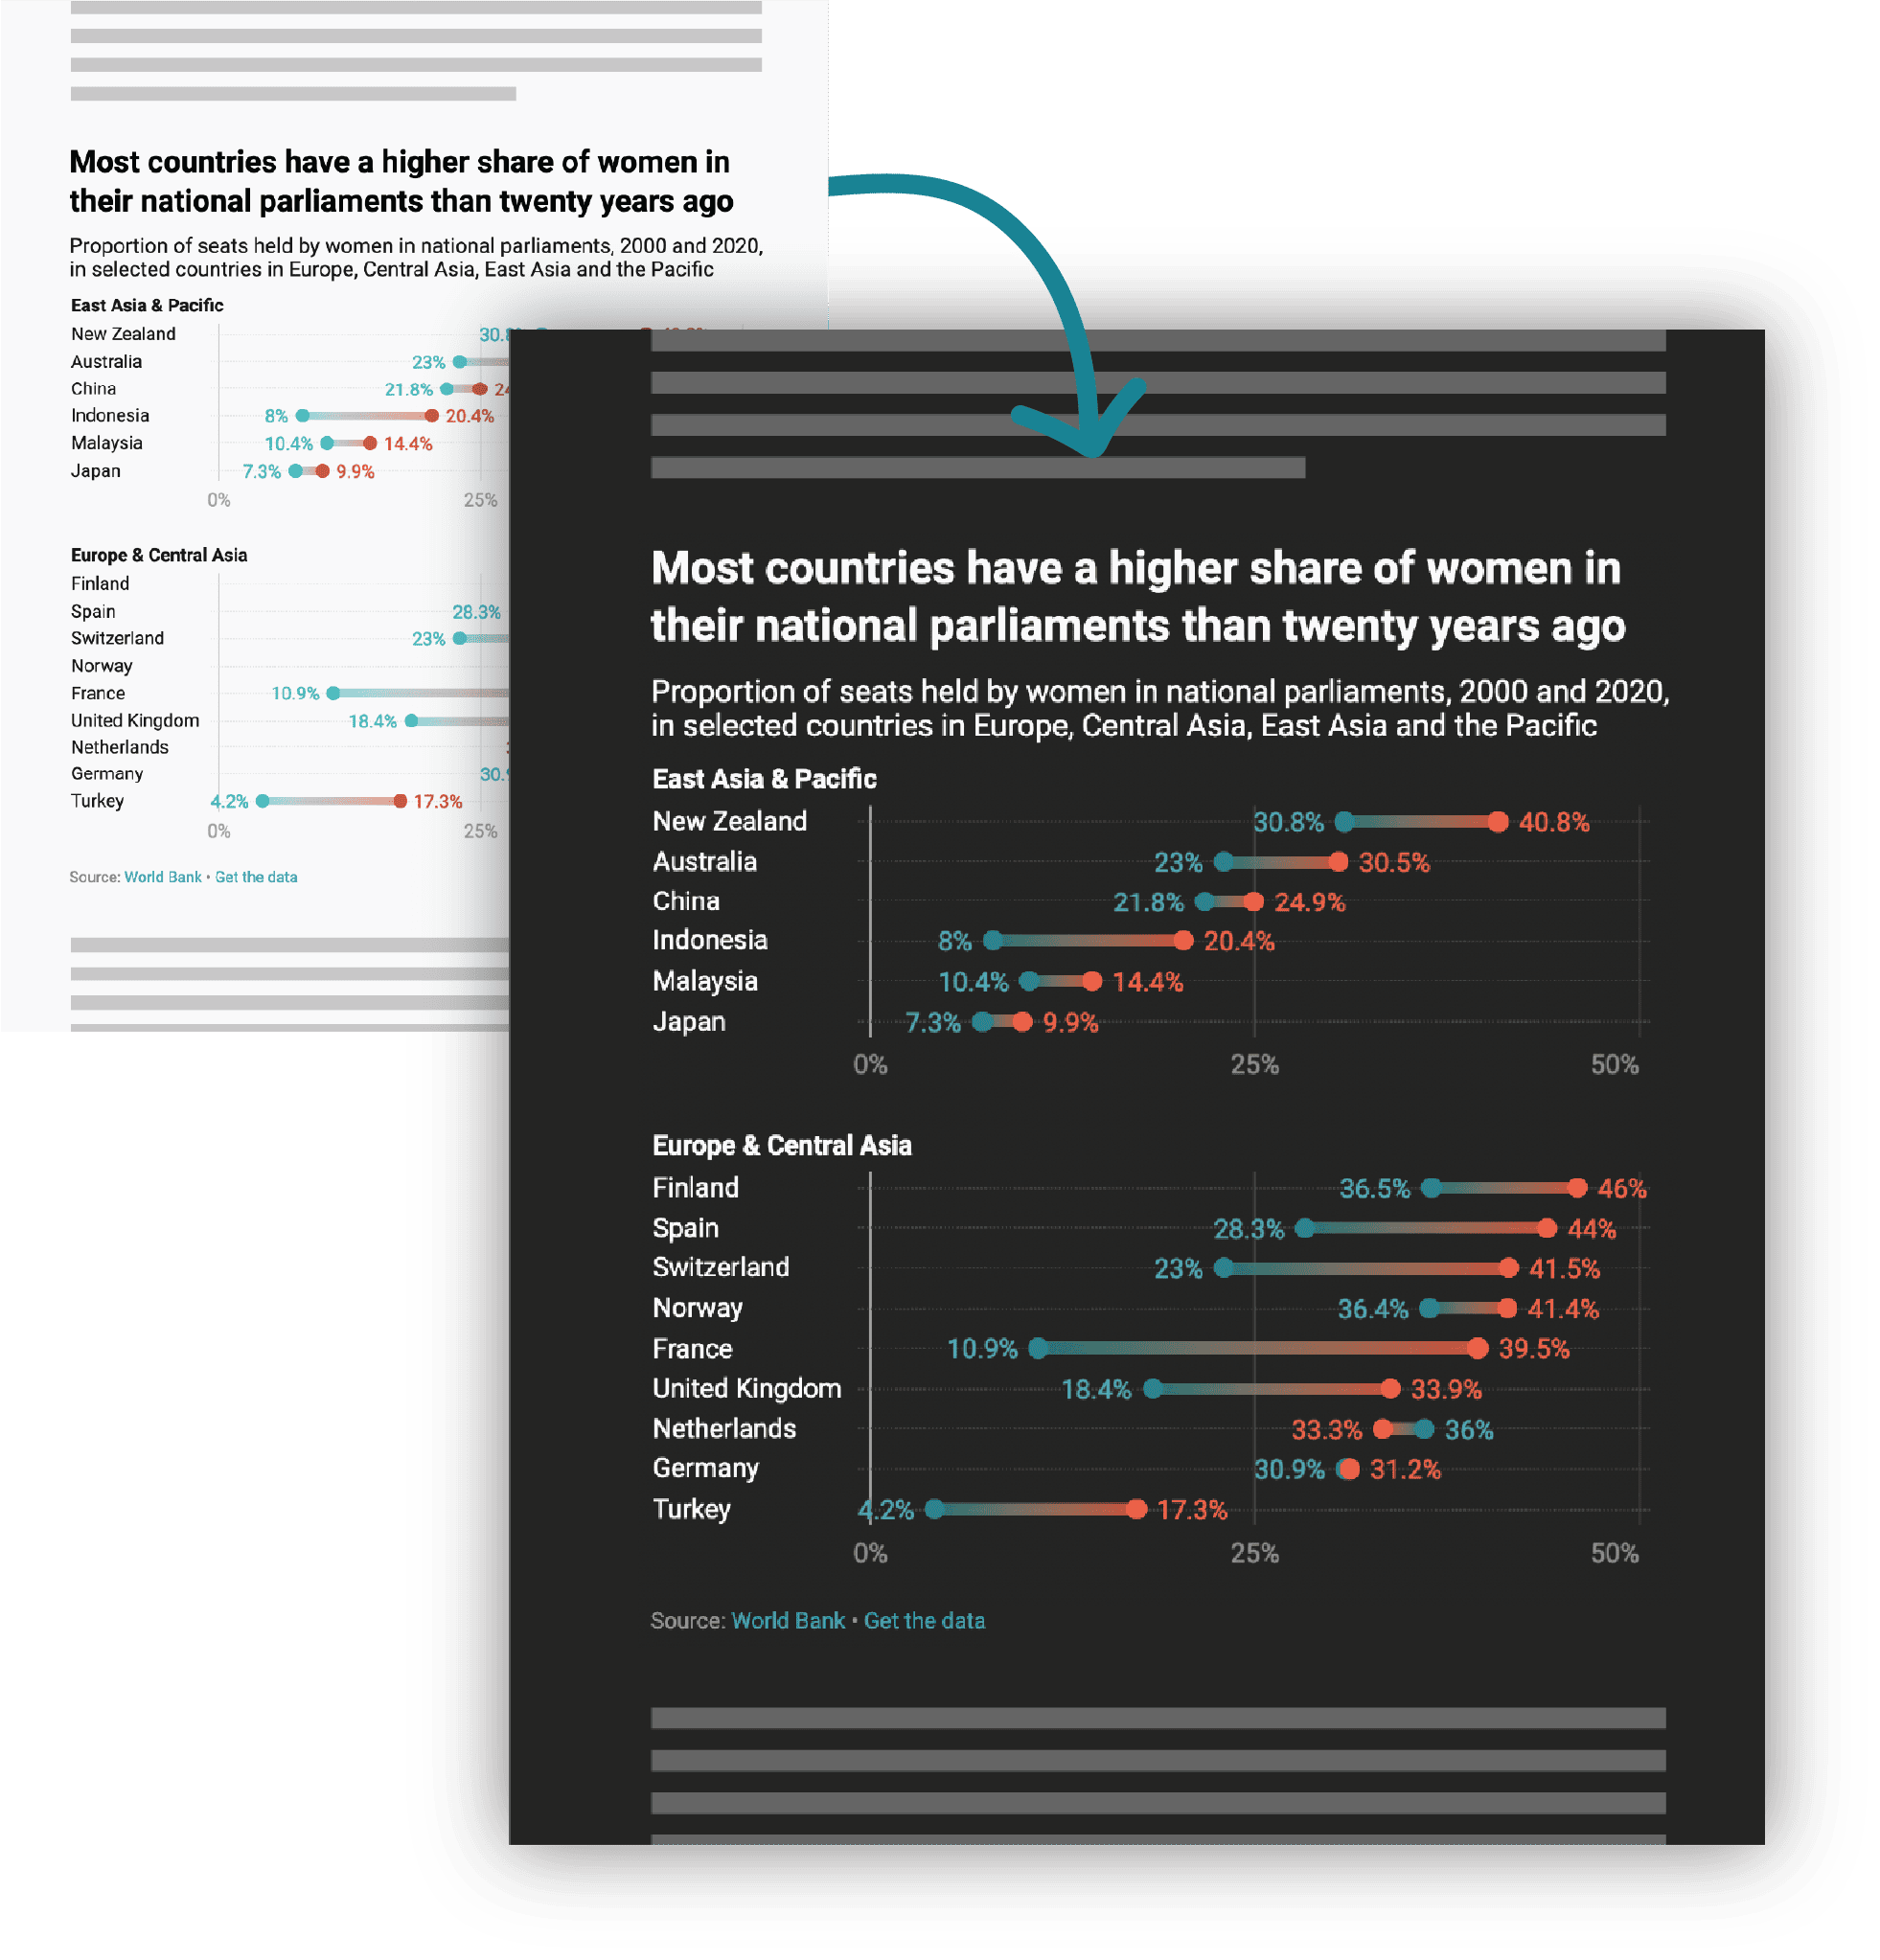
When your website is dark, your visualizations should be too

If your website supports dark mode, you don’t want white charts, maps, and tables to stick out against a black background. Or the other way around.

When “Automatic dark mode” is turned on, you only need to put one embed code on your page. The embedded visualization will adjust to your readers’ system settings — showing a bright background when they view your website in “day mode” and a dark background at “night.”

Learn more in our dark mode announcement post
Datawrapper scatterplot with an annotation in dark mode (with a black background) in an article from the German newsroom SPIEGEL.

Datawrapper chart in dark mode in an article from the German newsroom SPIEGEL

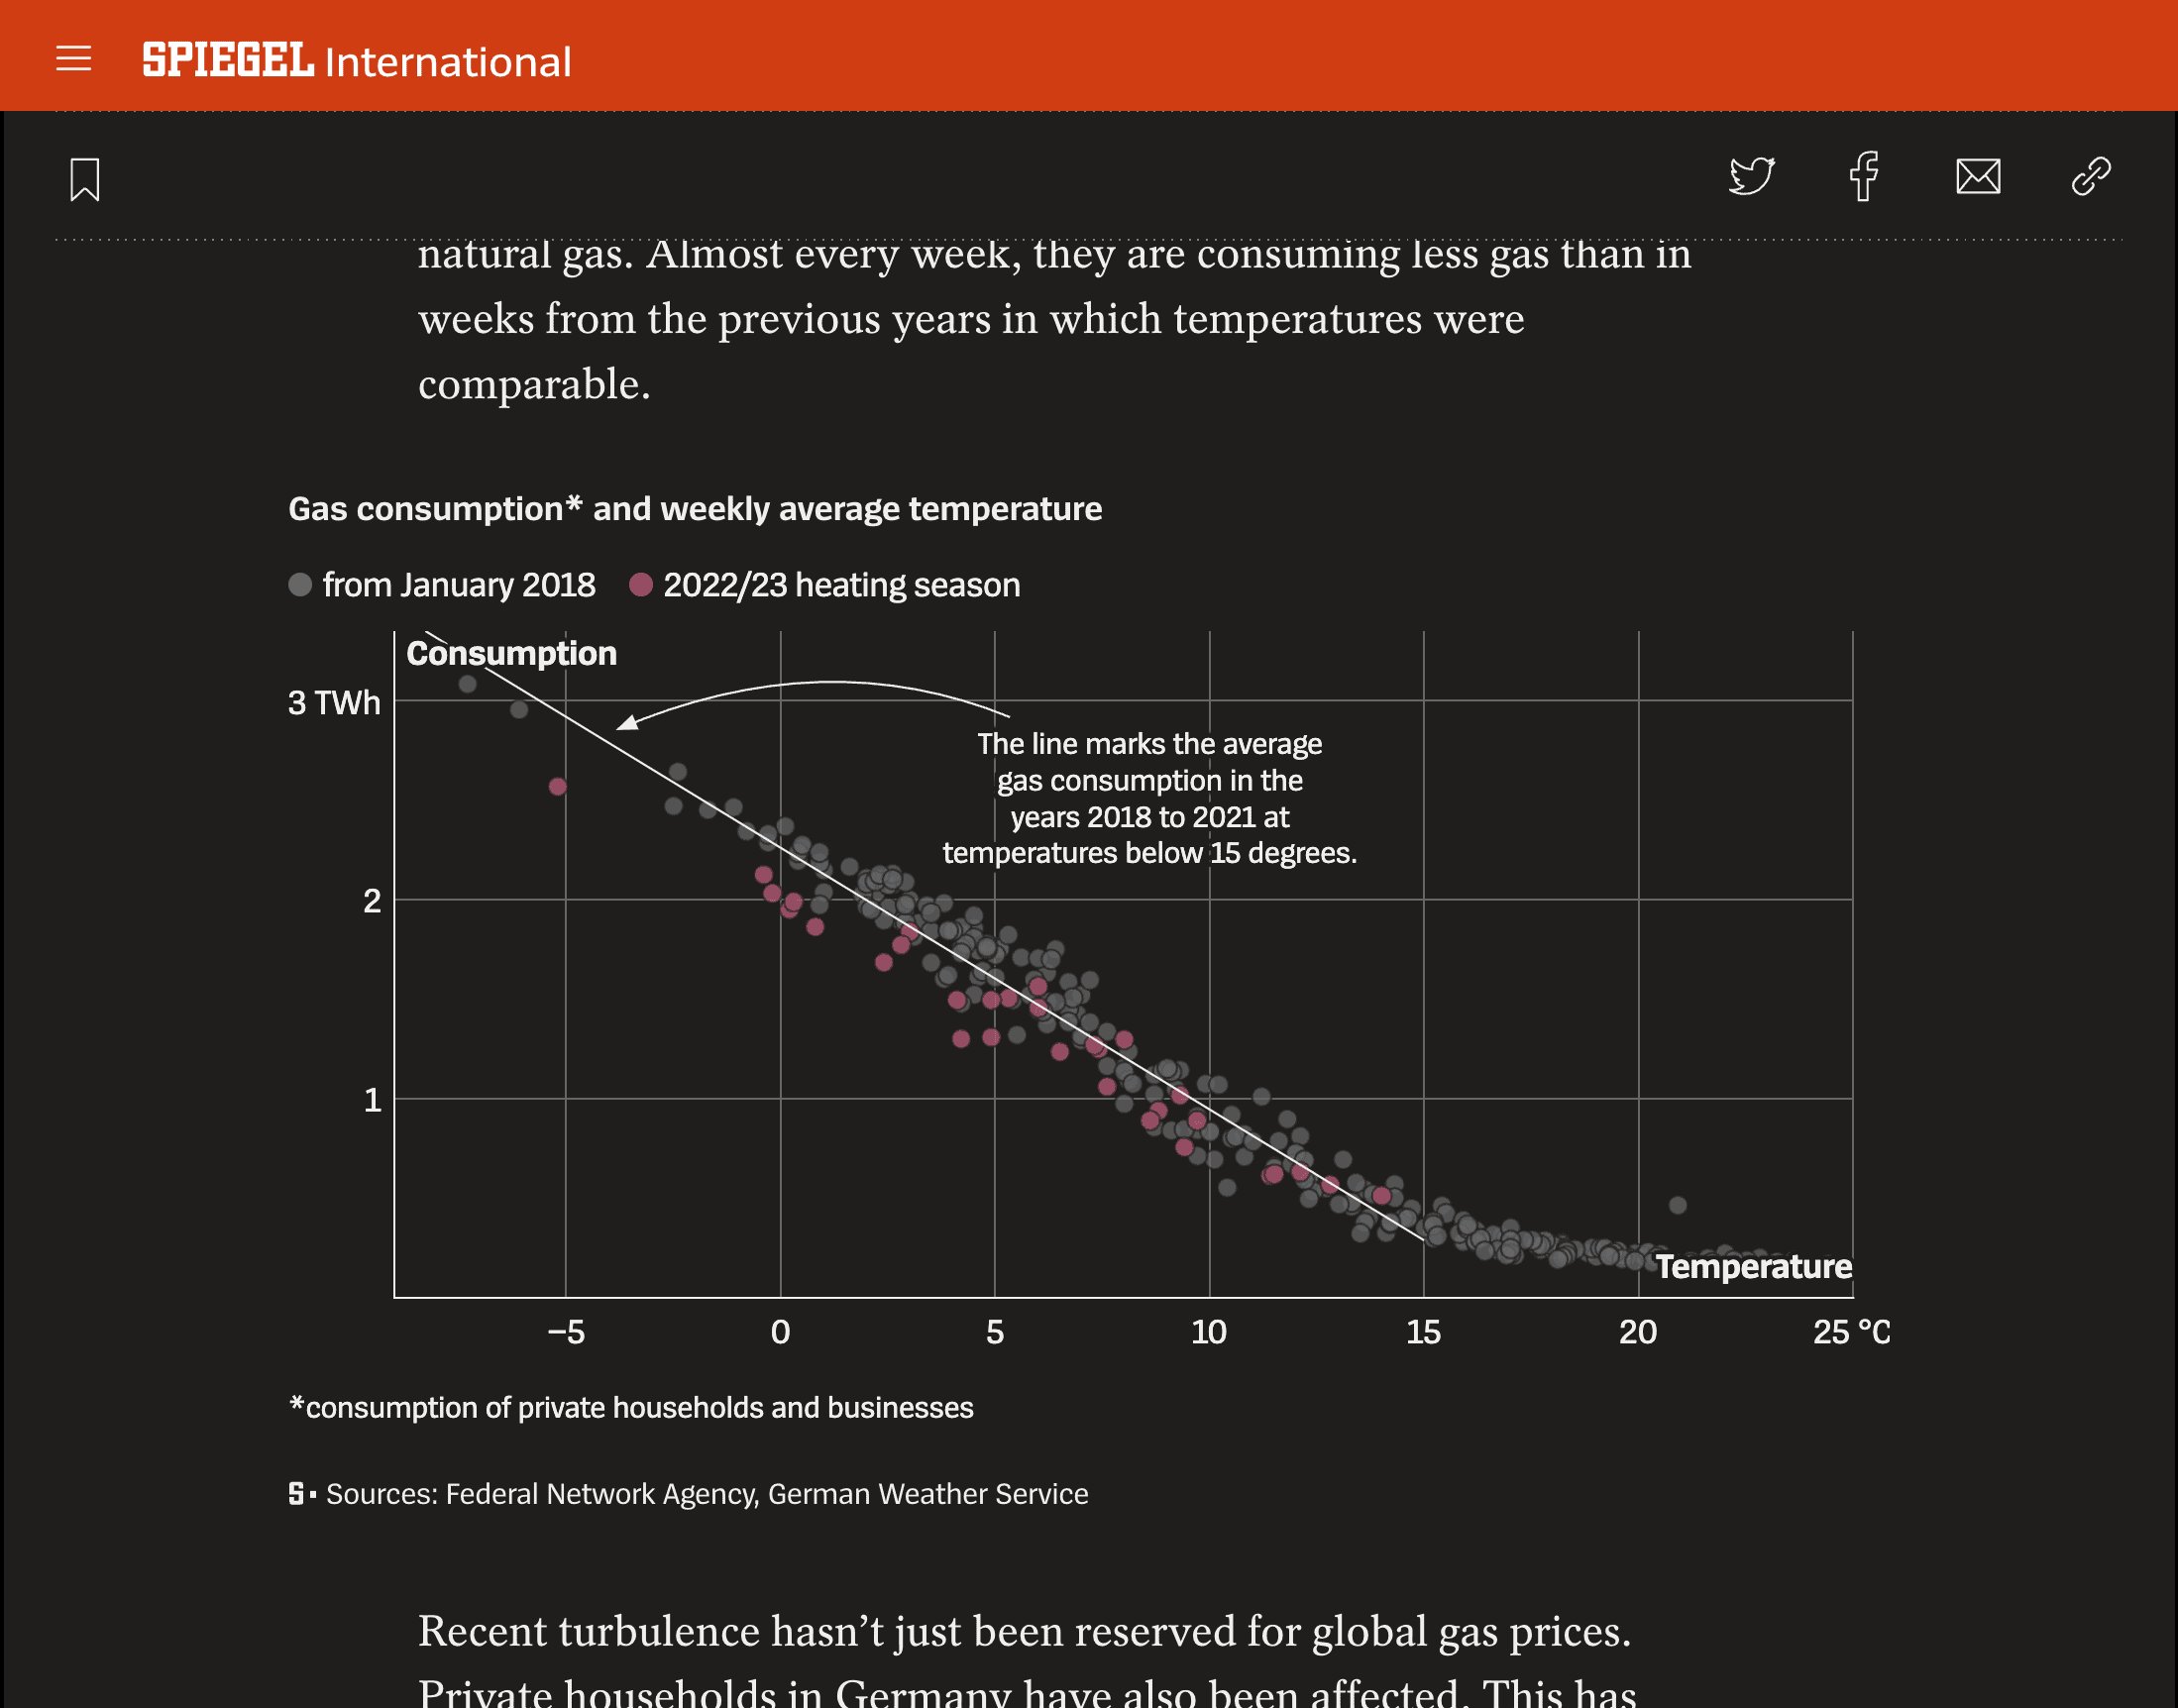
Making sure your colors work — even at night

All the elements of your charts, maps, and tables remain legible in dark mode. We wrote an algorithm that automatically finds suitable colors for your visualization elements, gridlines, title, description, source, byline, color key, highlight ranges, table text, table heatmaps, annotations, etc.

Important elements will stick out in dark mode, too: Colors that are very dark on the white background will be very bright on the black background, and vice versa.

If you want to keep the bright mode colors, you can choose to do so in the layout options.

Datawrapper scatterplot in bright mode with a white background. Next to it is the same chart in dark mode with a black background. The image highlights that the colors are adjusted for dark mode: For example, pink is brighter in dark mode to have the same contrast to the background as in bright mode.
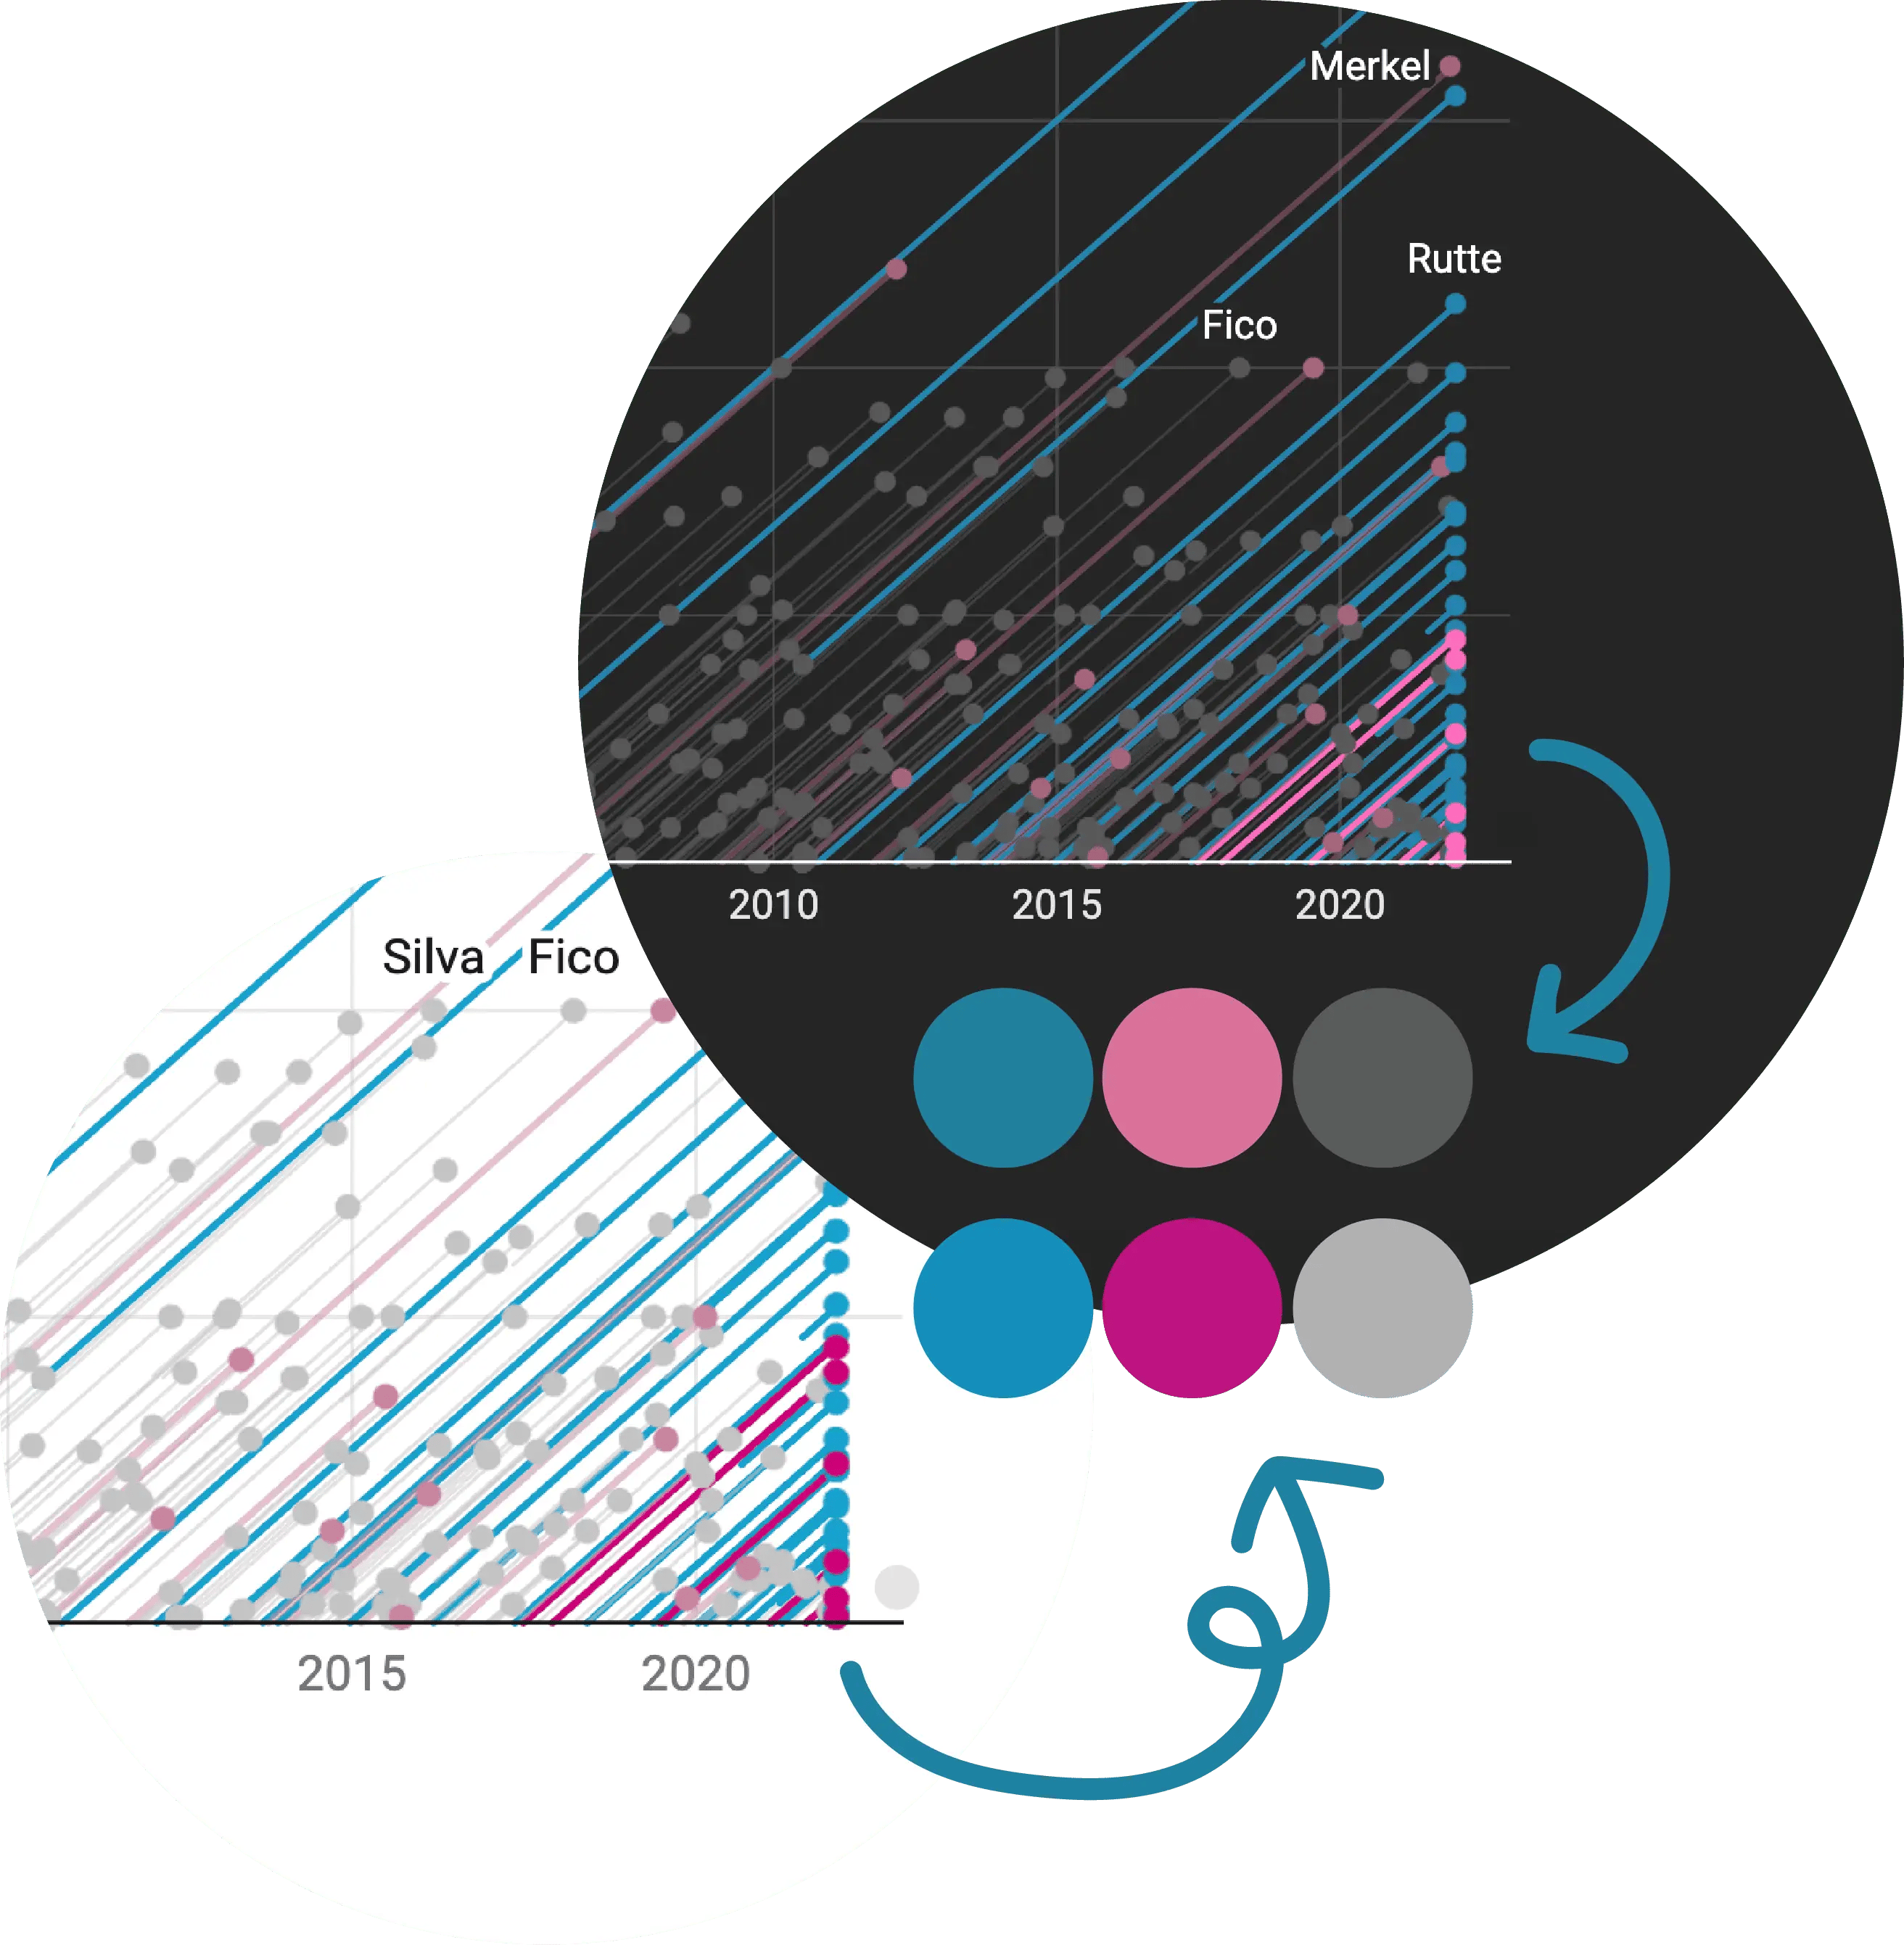
The dark side comes with a customized color palette

If your team uses a custom Datawrapper theme, you can define a custom dark mode counterpart for every color in your bright palette. This way, you’ll never need to think about the look of your visualizations in dark mode ever again — all the colors will be exactly as you chose.

Not a fan of the dark side? Just permanently disable automatic dark mode for all team members.

Ask our Support team about dark mode adjustments

Here's what else Datawrapper has to offer

Everything your organization needs to visualize data professionally

Print export
Export print-ready PDFs with custom layouts, pre-defined CMYK colors, and pre-defined sizes. Learn more.
Localization
Use over 50 languages, right-to-left format, and multiple number formats for your visualizations. Learn more.
Comes in your design
Send us your style guide and we'll create a custom design theme for your brand, 100% white-labeled. Learn more.
Accessibility
Create more accessible visualizations – thanks to e.g. keyboard navigation and automatic alt texts. Learn more.
Privacy
No tracking, no cookies, no third-party scripts: Datawrapper embeds don't compromise your website visitors’ privacy. Learn more.
Security
ISO 27001 certification, hosting in Europe, backups: Confidential data and visualizations are safe with Datawrapper. Learn more.
Show all Features

You're in good company

Find out how other teams use Datawrapper to improve their data-driven communication

Investopedia: “Datawrapper is taking our content to the next level”

How Datawrapper keeps 20 years of charts looking beautiful, consistent, and up-to-date.

Learn more
New America: “Dammit, why didn’t we just pay for Datawrapper a year ago?”

How and why the US-American think tank switched from an in-house charting tool to Datawrapper

Learn more
Aftenposten: “An article with a chart feels like a better article.”

How Datawrapper helped in Aftenposten’s transition from a print newspaper to “digital-first”

Learn more

Do you have questions? Let’s talk!

Contact us here so we can help
image Contact Sales
Skip to content
We have updated our Privacy Policy to reflect the new EU regulations. It is written with the goal of clarity. Please give it a read and accept it.Accept