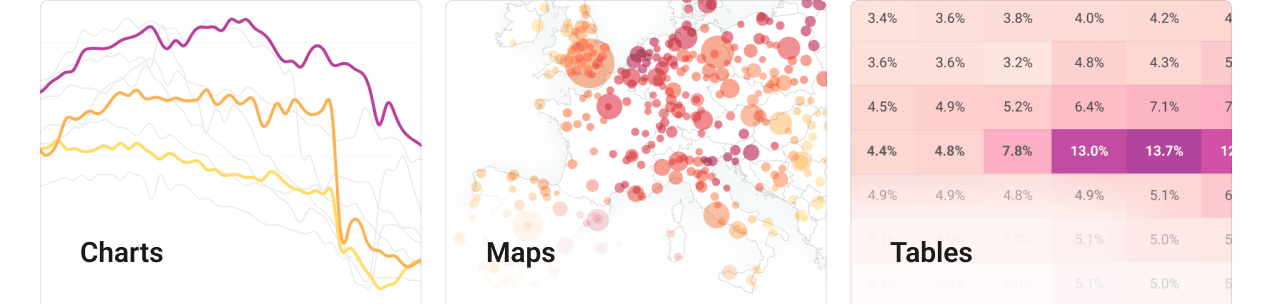
Create data visualizations in teams
Stay on the same page chart
Never miss an edit, chase an email attachment, or get lost in duplicate files again.
Datawrapper automatically saves all edits to your charts, maps, and tables and makes them available to the rest of your team.
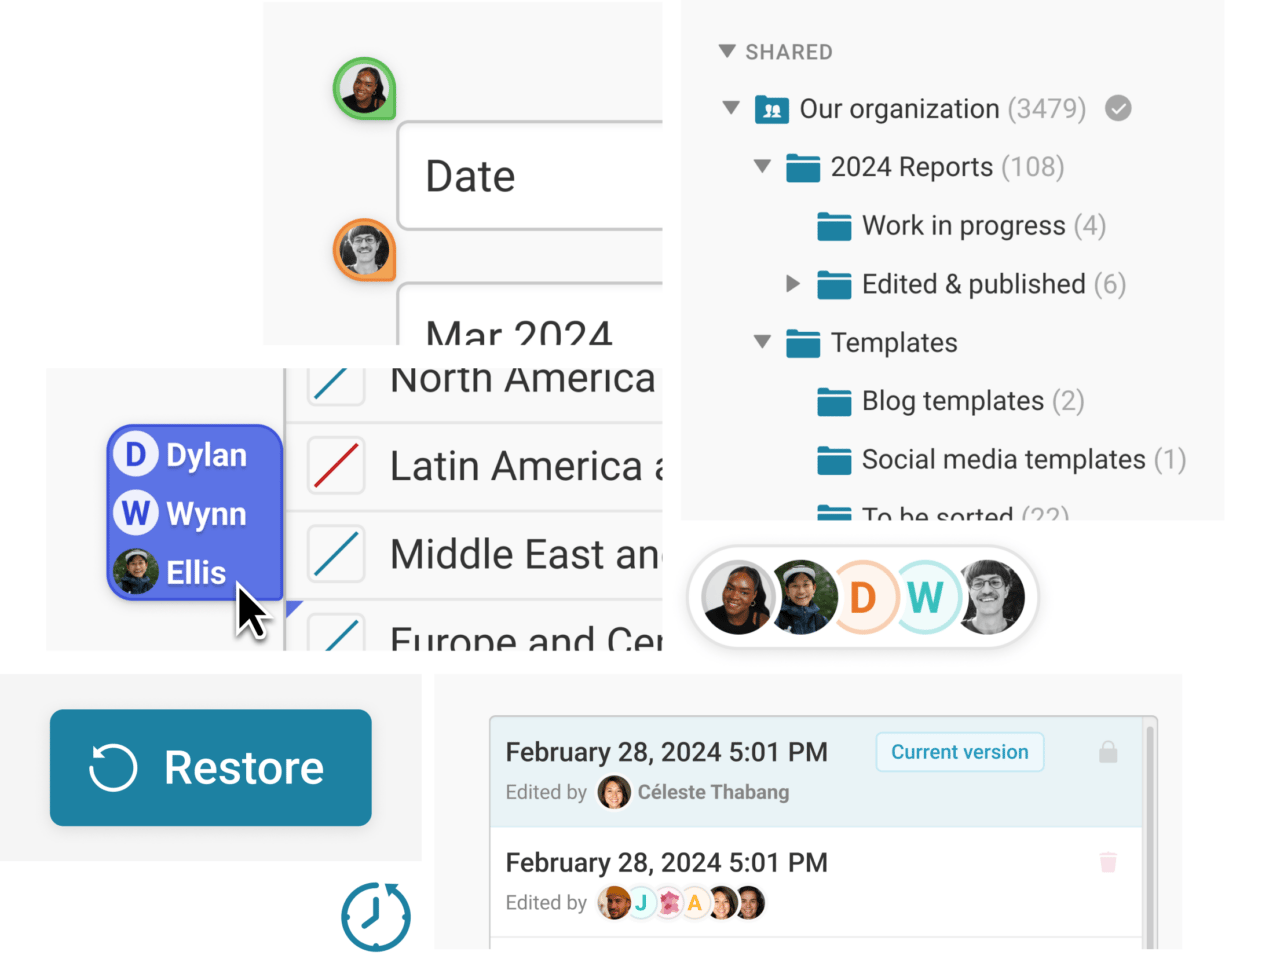
Work together in real time
With live collaboration, you and your team members can all work on the same visualization at once. Edits are immediately visible to every other team member.
Avatars indicate who’s making which changes, so you’ll never get in each other’s way.
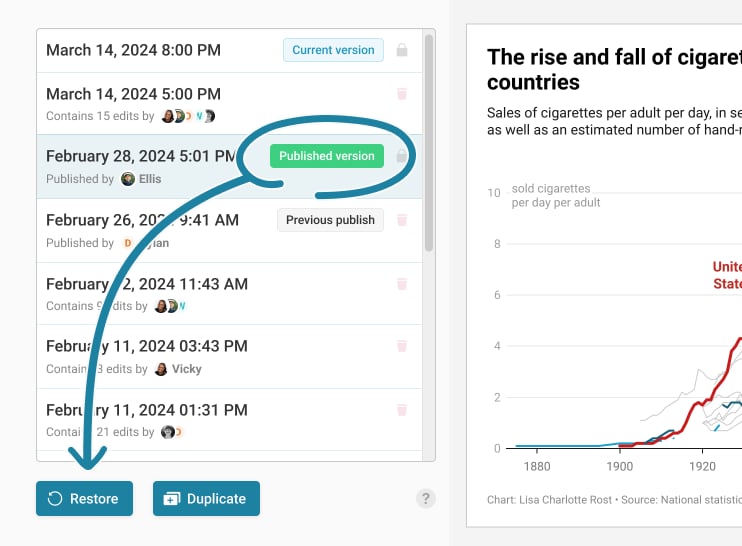
Go back in time
Don’t worry about colleagues making changes to your visualization: You can always restore past versions with edit history.
See who edited when, view their changes, then restore any past version you need — or turn it into a new visualization of its own.
Published versions of your visualization are highlighted, so you can easily stay aligned with what your readers see.
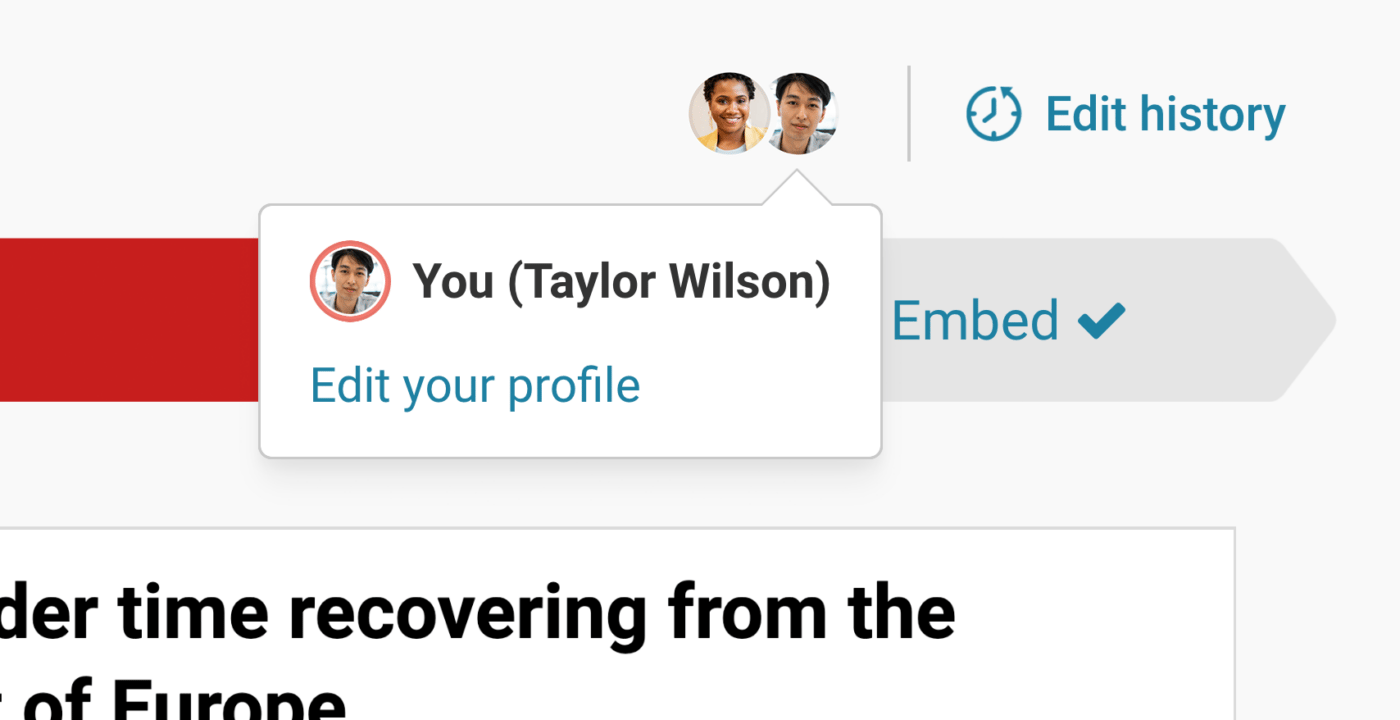
Know who you’re working with
Every team member can personalize their Datawrapper account with a name, picture, and profile color.
This way, you can see at a glance who’s working on your visualization.
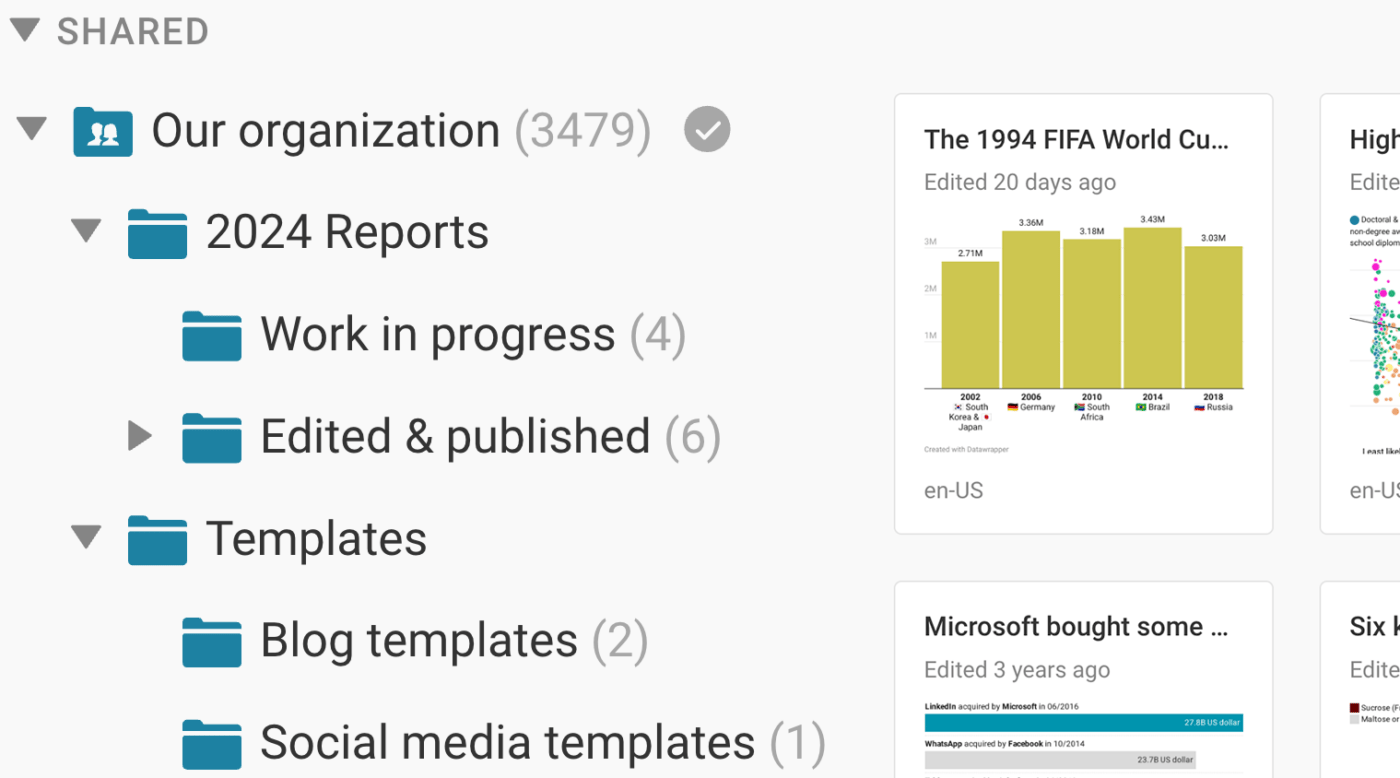
Organize your teamwork in folders
Set up folders and subfolders that mirror your workflows – for steps in the chart creation process, collaborations with clients, or keeping track of student assignments.
Not ready to share your work? Every Datawrapper user has a private workspace that no one else can access.
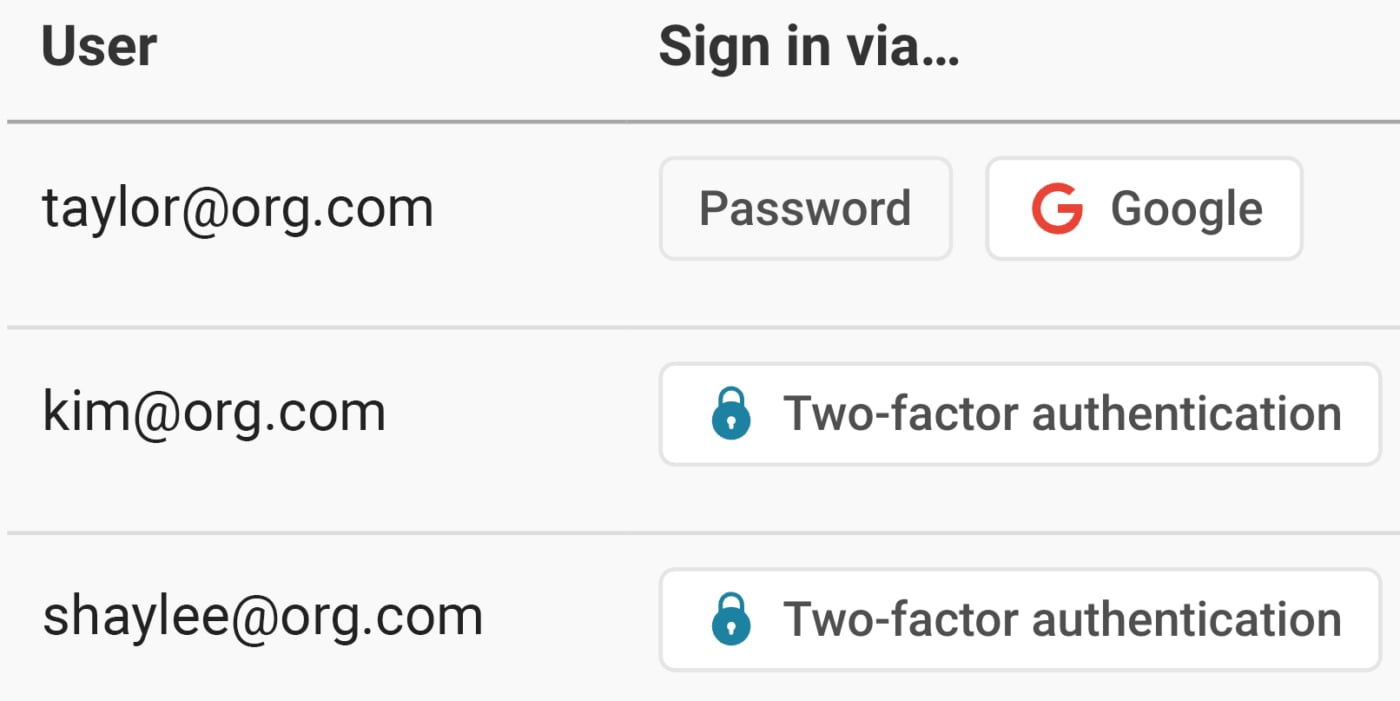
Ensure security compliance with SSO, 2FA, and team permissions
As a team admin, you can review each member’s sign-in method. Are they using single-sign-on (SSO), two-factor authentication (2FA), or just a password? You’re in the loop.
You can also set each member’s permissions, managing who can change your team’s settings and invite new members.