

Eliminate guesswork and stay on brand.
Custom themes, templates, and shared default settings ensure consistency and quality across your team’s output. Learn more
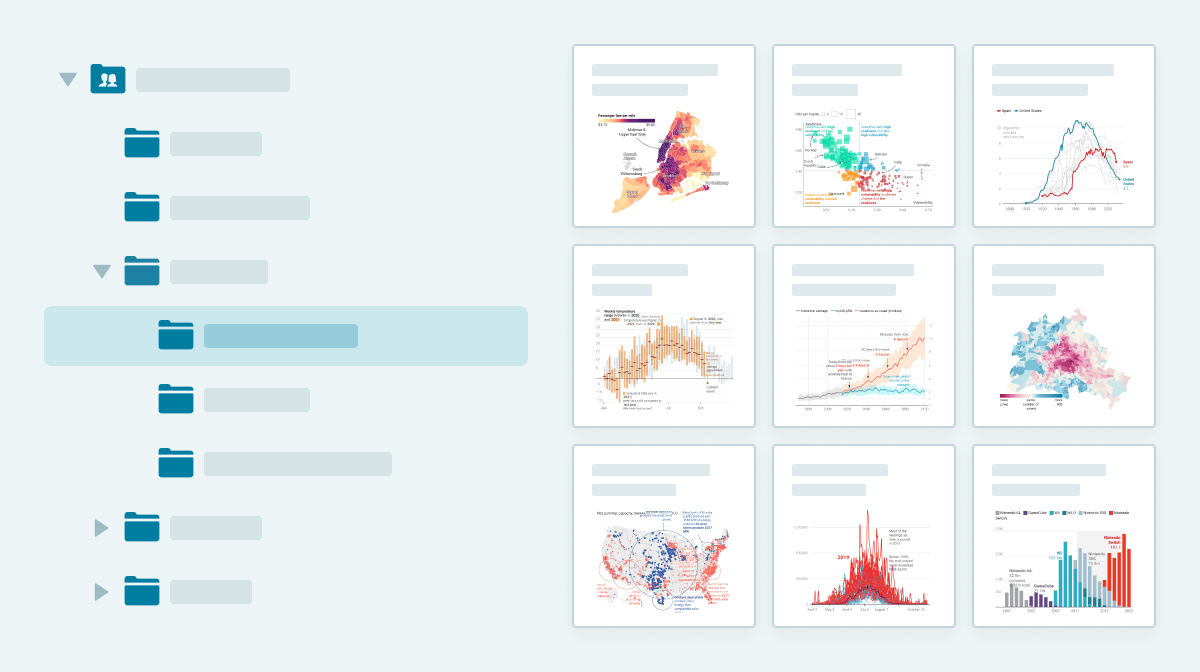
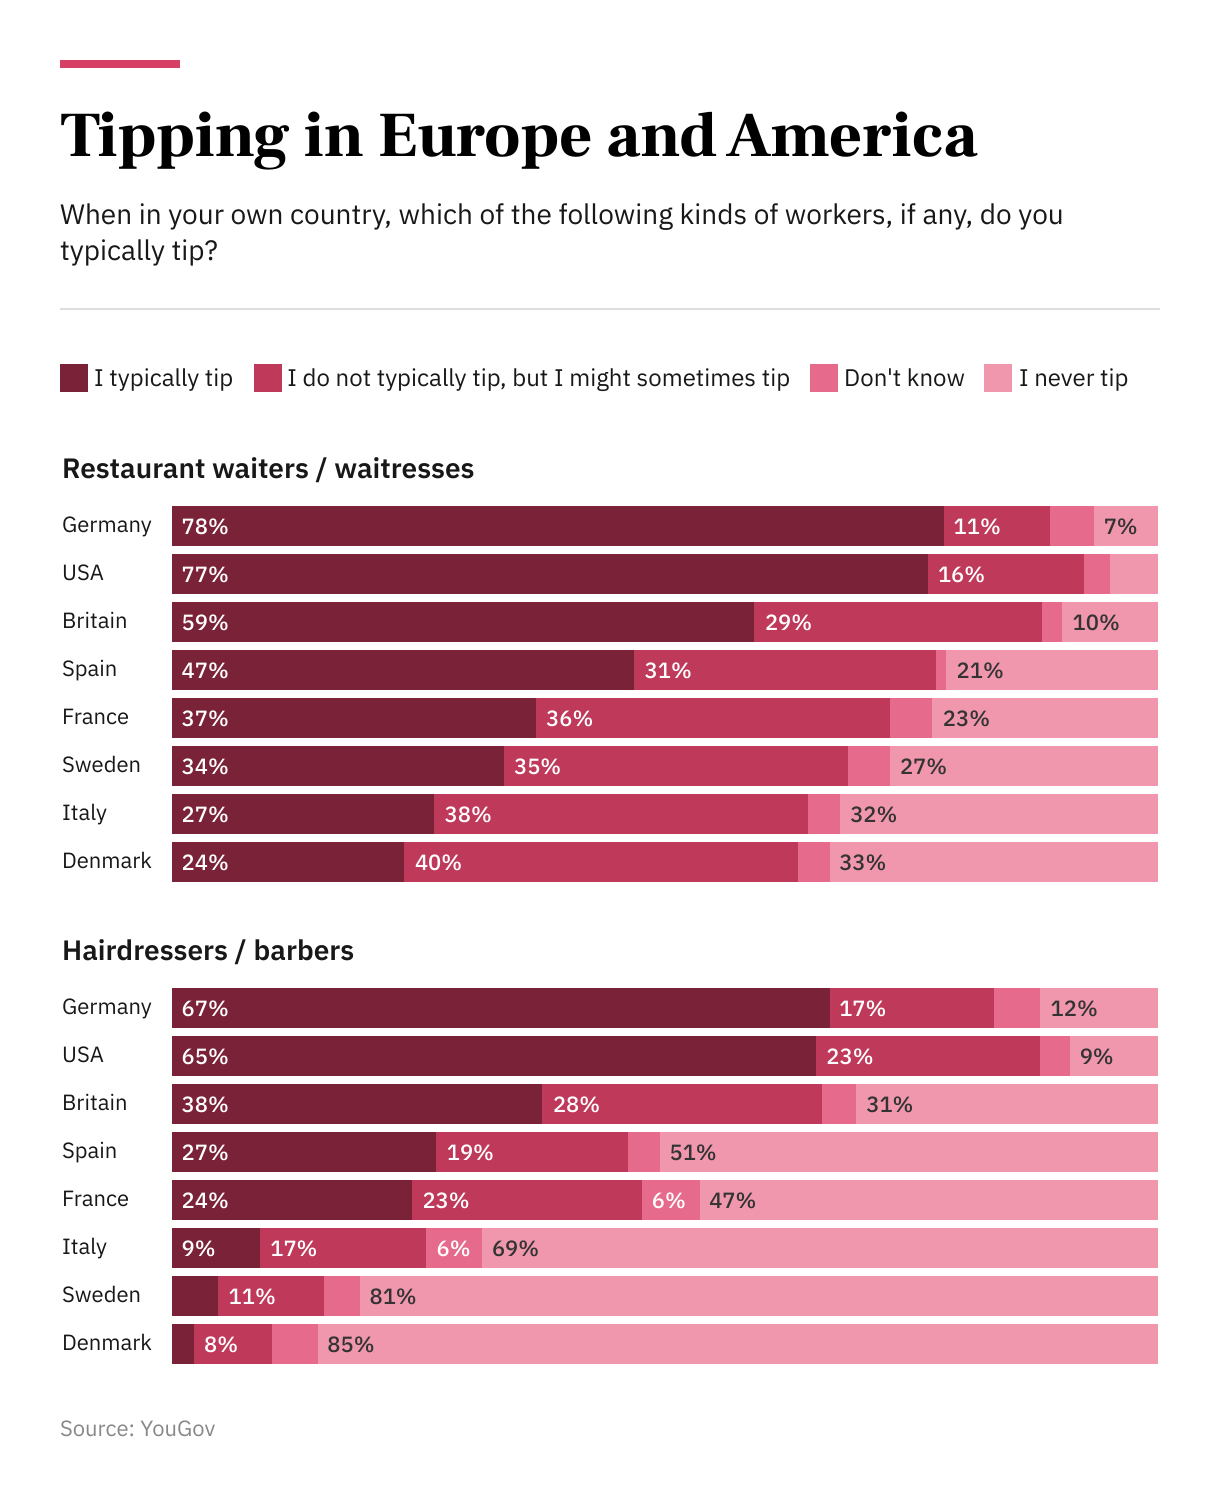
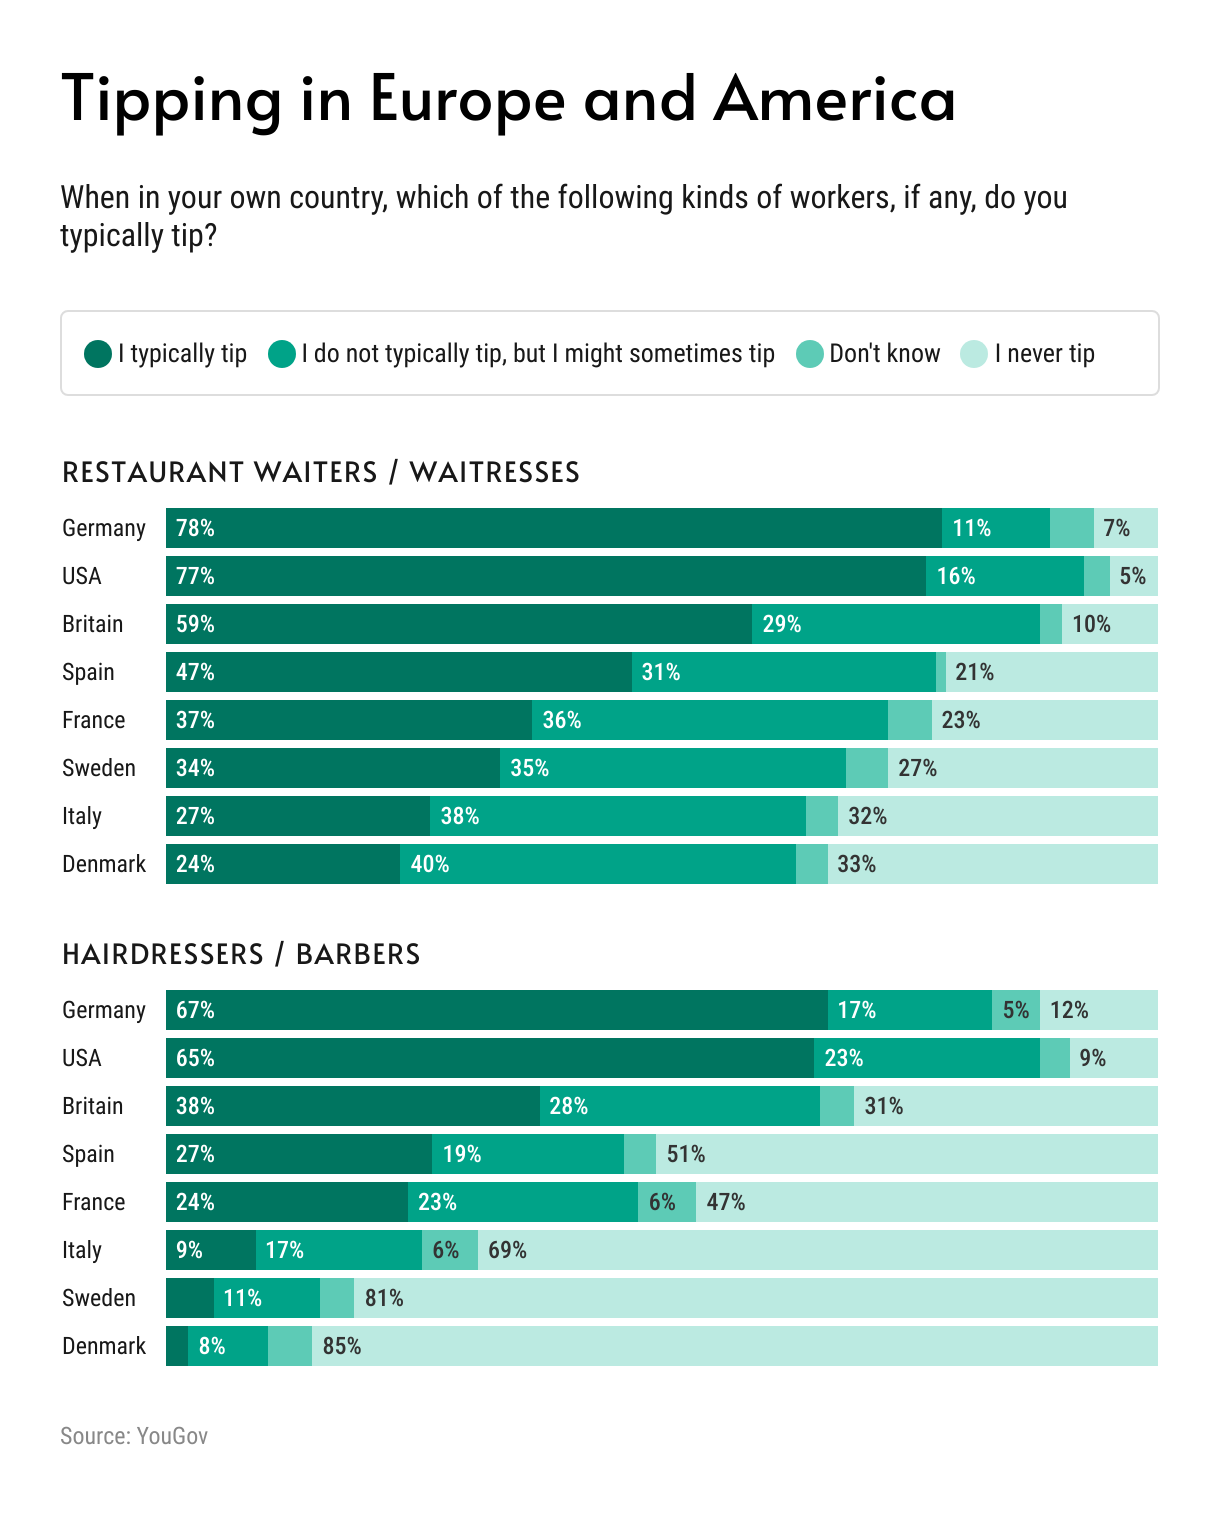
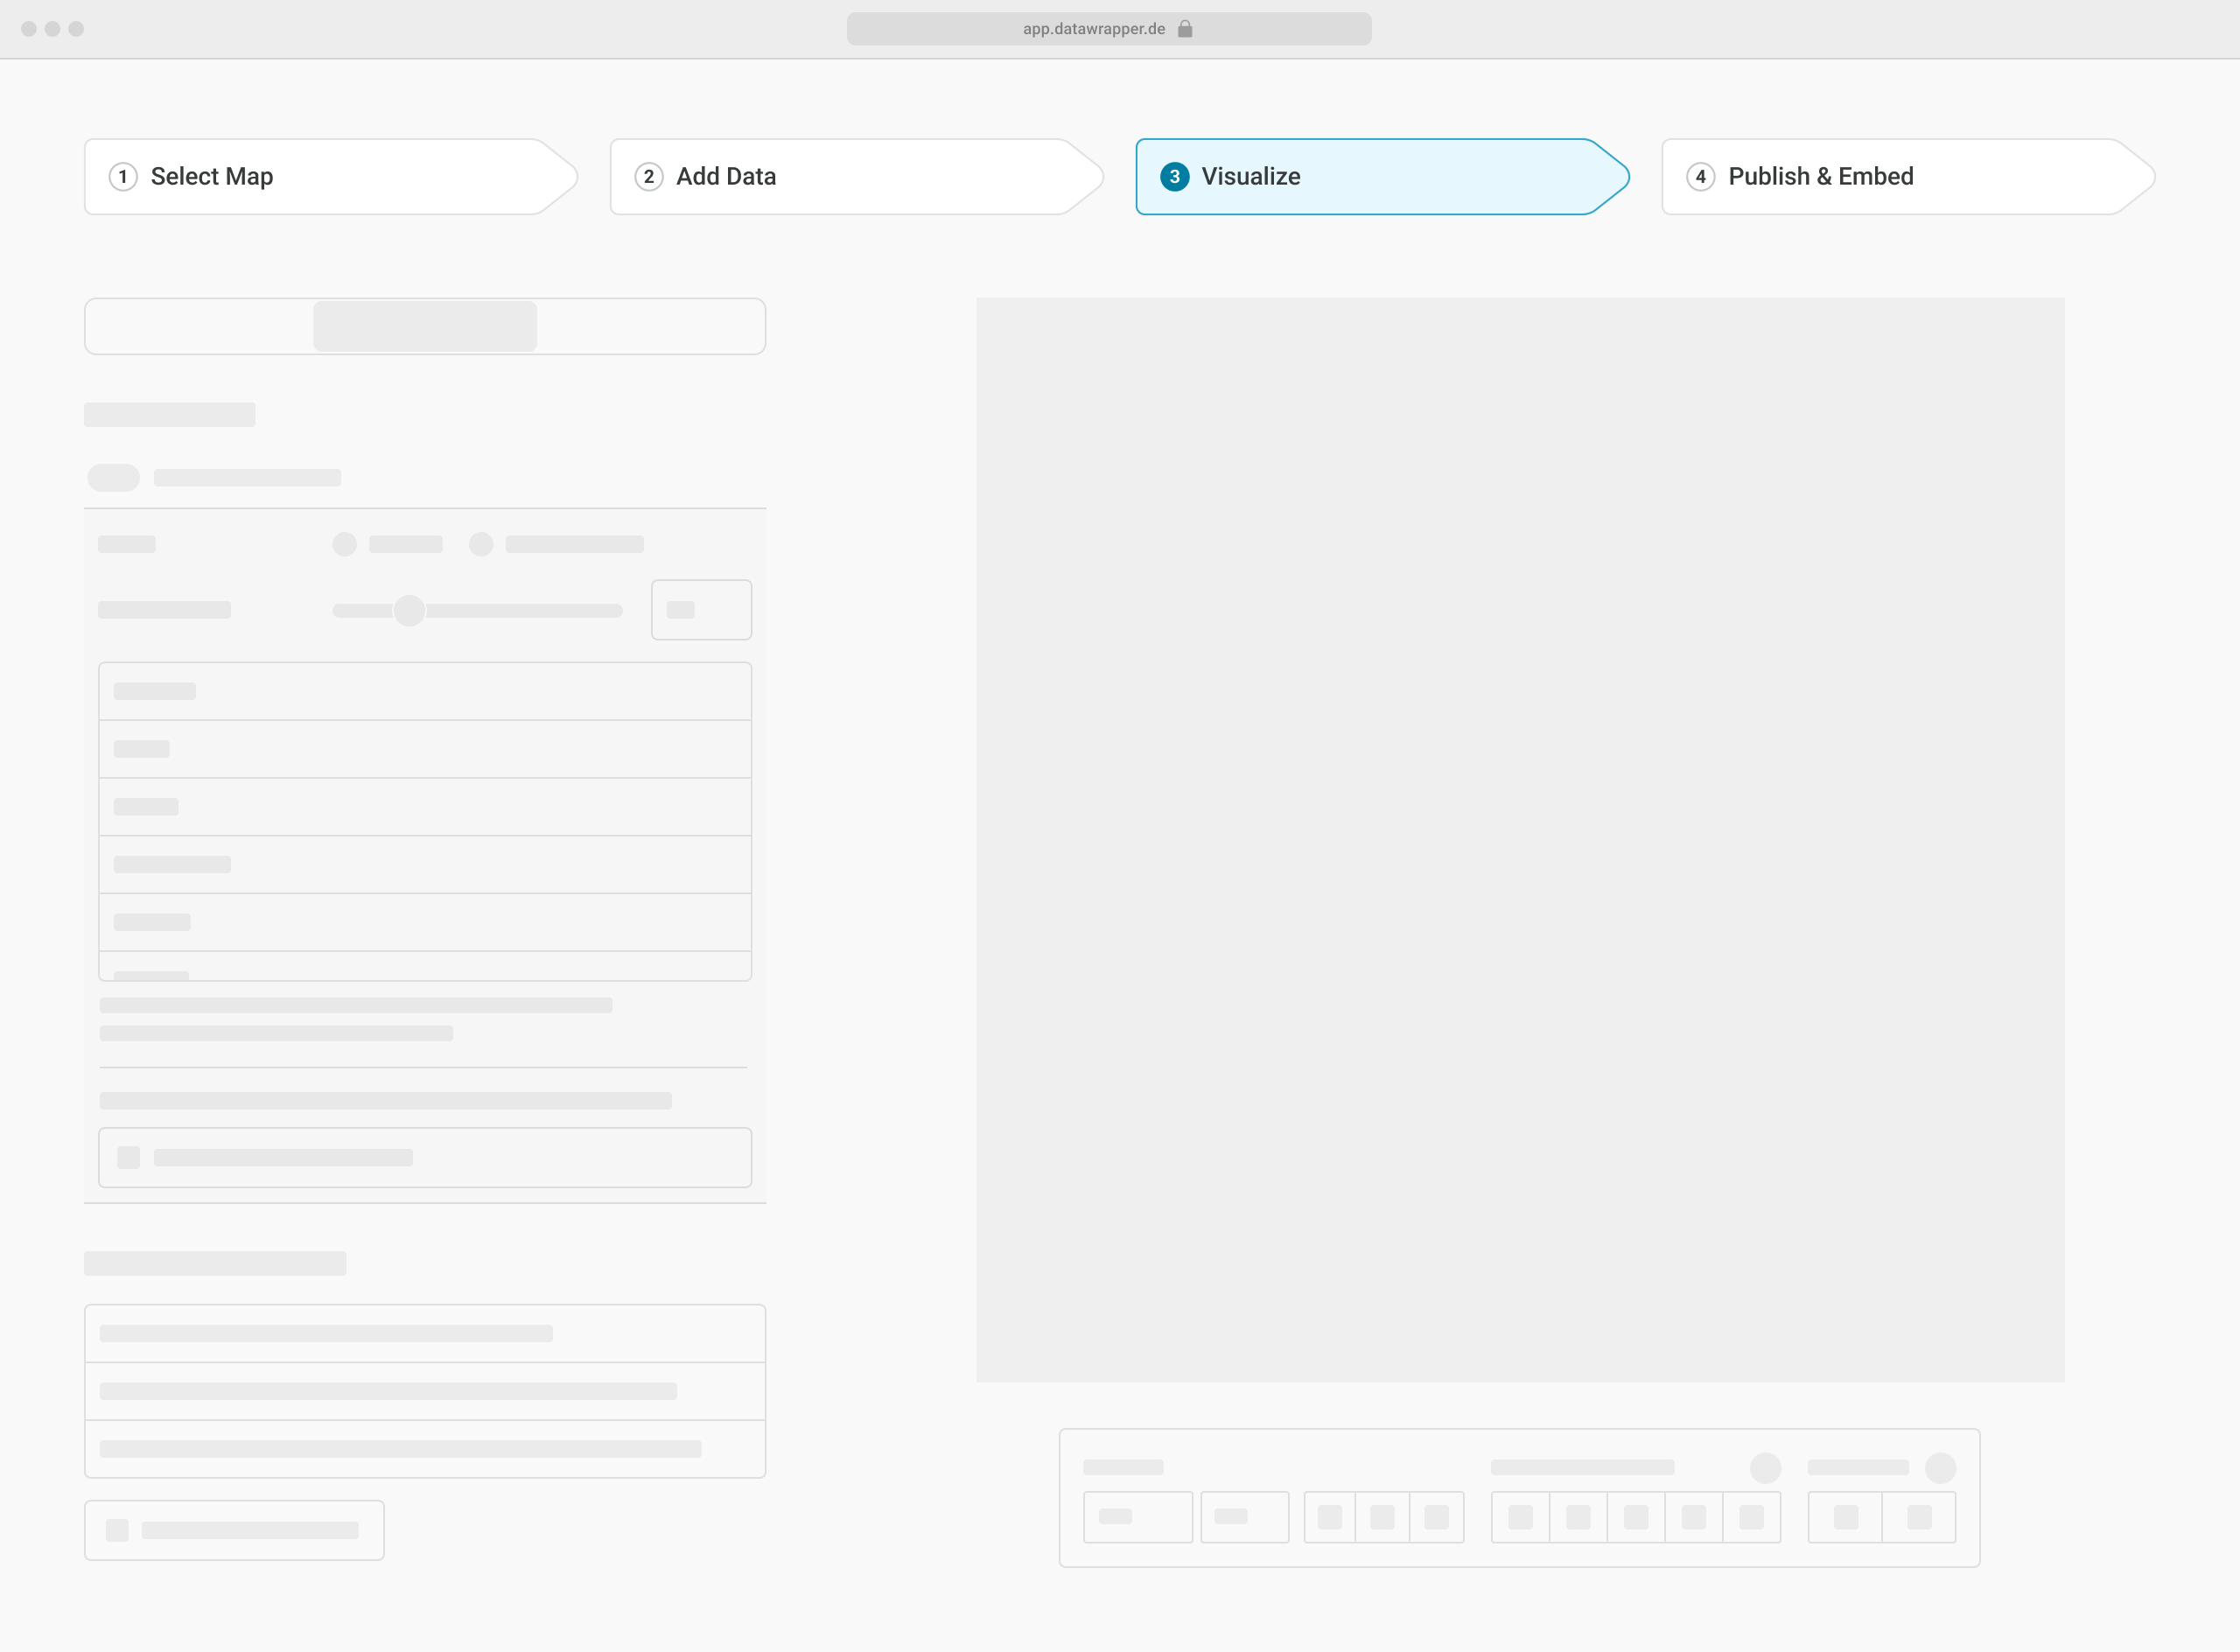
Design and publish high-quality data visualizations with a single, powerful web app.
Start creatingYou can try it, no account needed.
Design and publish high-quality data visualizations with a single, powerful web app.
Embed your visualizations on any platform, in any format.
From websites to presentations, printed publications, and more.