Product

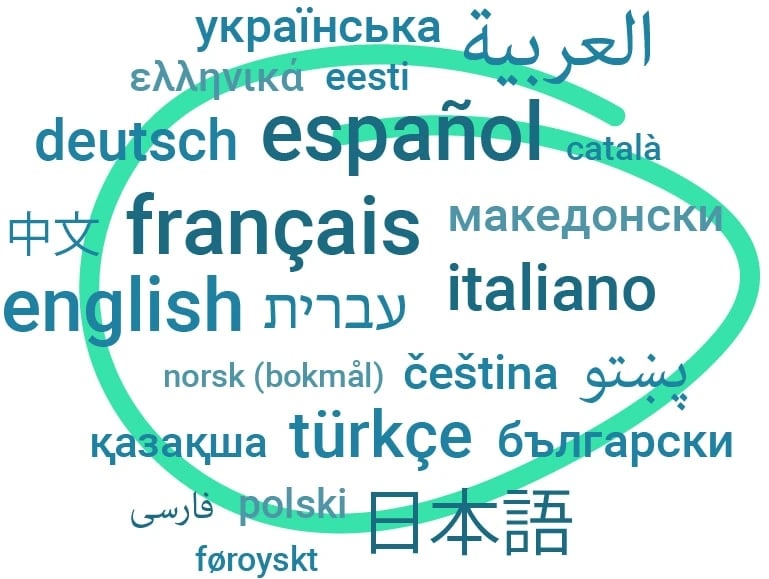
Speak your
readers’ language

Word cloud of many languages that Datawrapper offers for data visualization creation, like french, english, hebrew, spanish, turkish, japanese, and many more.
Datawrapper supports over 50 languages, right-to-left format, and multiple number formats.
GET RID OF THIS BUTTON
More than 50 output languages

Datawrapper visualizations can be published in more than 50 languages, and our localization options don’t end with words: number formats, dates, and other visualization elements are automatically adjusted for your target audience when you choose an output locale.

Here’s what changing the locale does exactly:

GIF of a table with three rows including a line chart, flag icons, and a bar chart, in different languages. It's visible that elements like
Datawrapper’s output locale adjusts numbers…

Number formats that work in one country may look strange or even wrong in another. Datawrapper adjusts number formats based on your output locale so no one will mistake thousands for decimals when it matters.

For example, the German locale (de-DE) will turn thousands separators into dots (10.000), while choosing Swiss German (de-CH) will convert them into spaces (10 000).

Screenshot of a tooltip in a Datawrapper scatterplot in Spanish. It shows that the decimal separator is a comma (57,1 años) and the thousands separator is a space (1 176 dólares).
…dates…

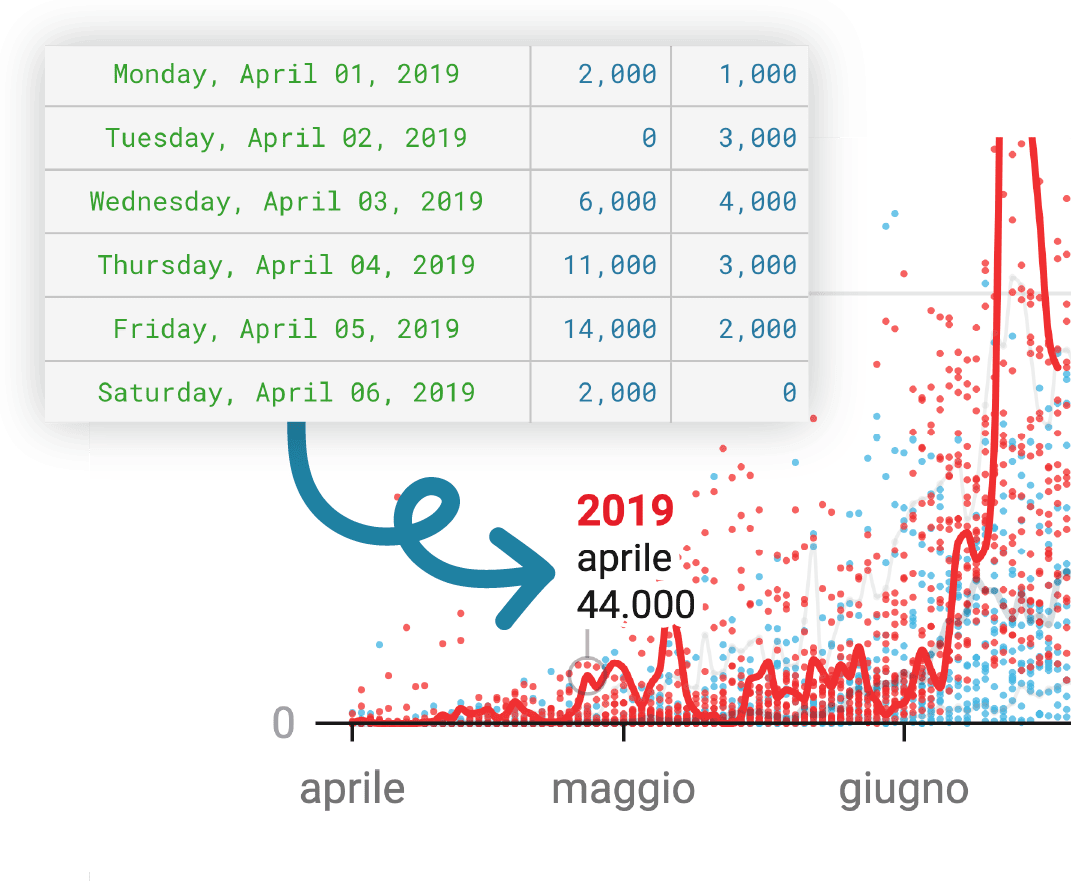
There’s no need to manually add month or weekday names in your language to a dataset — Datawrapper will simply translate them.

For example, if you upload the date “23/04/2019,” Datawrapper can make an Italian “Aprile” out of that month.

Or a Chinese “四月.”

Or a Finnish “huhtikuu.”

Screenshot of a Datawrapper line chart showing translated month names (
…and built-in text in all visualization types.

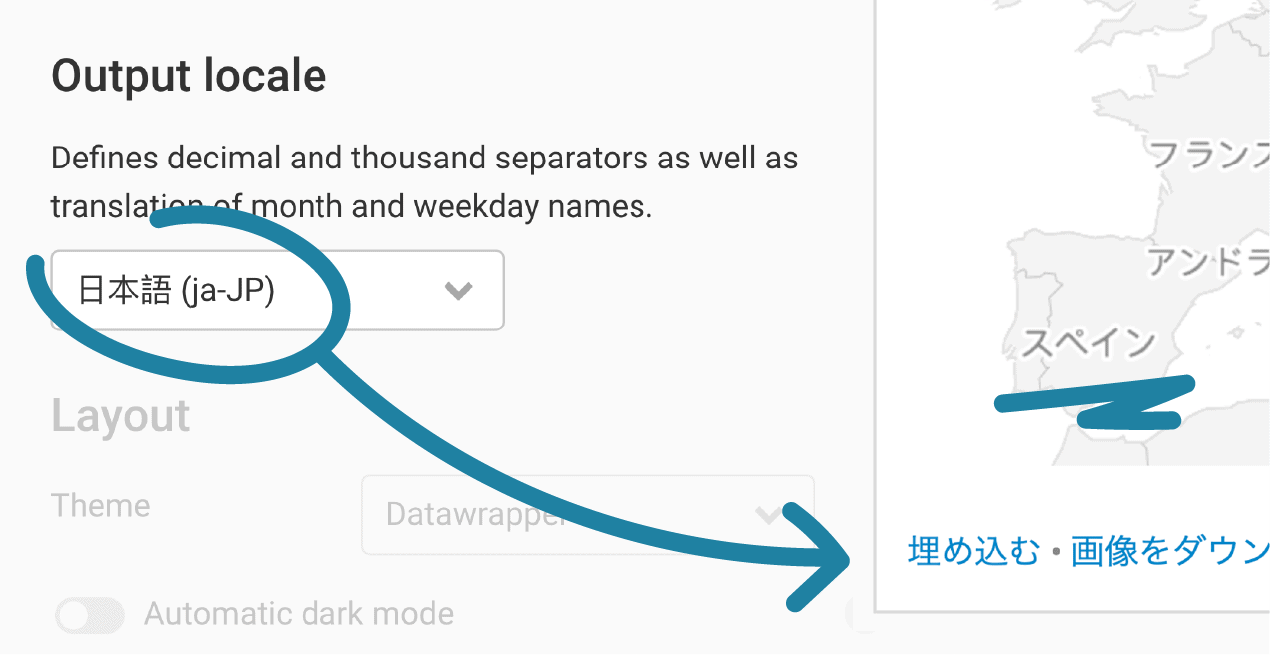
We care about the details, so we don’t stop at month and weekday names. The output locale translates labels in locator maps, footer elements such as “Source,” “Get the data,” or “Download image,” and table elements such as “Search in table,” “Page 1 of 5,” and “Show 10 more.”

Screenshot of the Datawrapper interface showing Japanese as the chosen Output locale, and that the footer elements (like
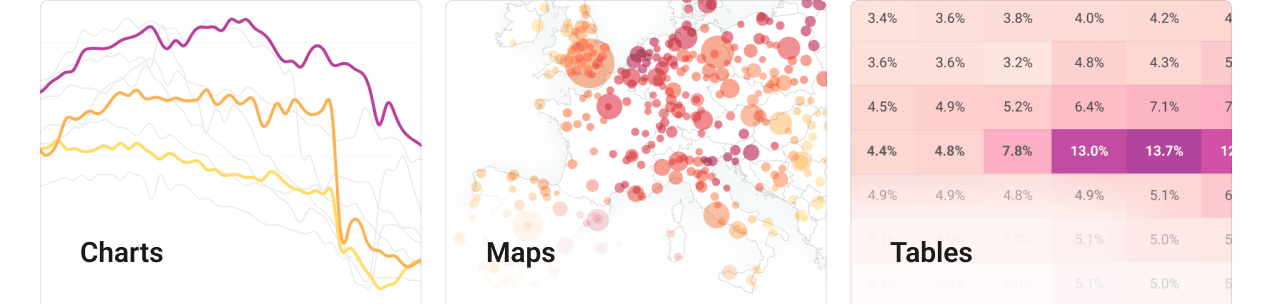
Beautiful charts any way you like

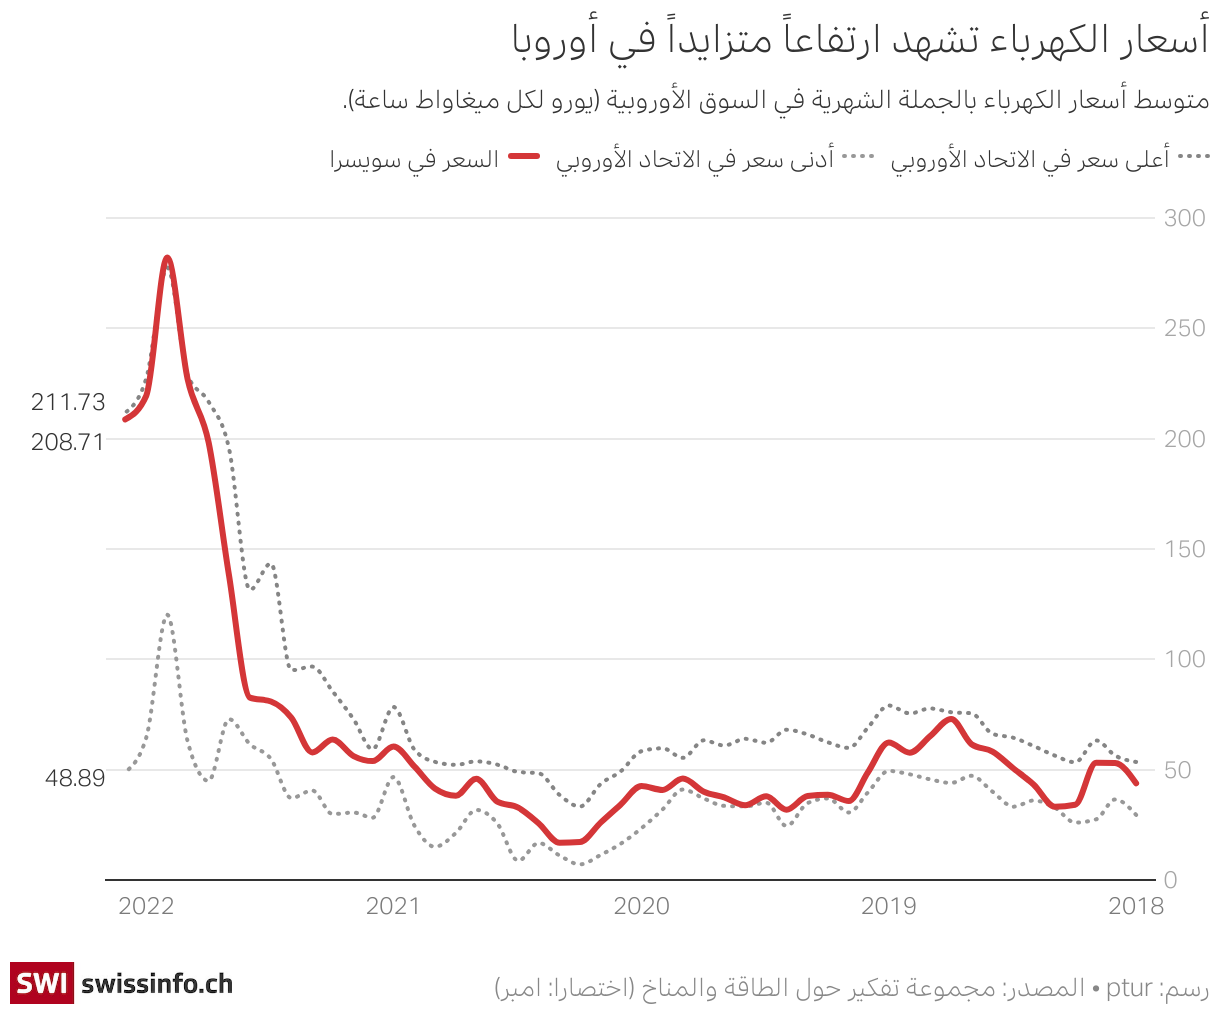
Hebrew? Arabic? Persian? No problem for Datawrapper. We support right-to-left languages in all our chart and map types. When selected, visualization elements automatically reverse their alignment – including text, x-axes, and table columns.

You can see for yourself in this chart from SwissInfo.

Read more about right-to-left languages on our blog
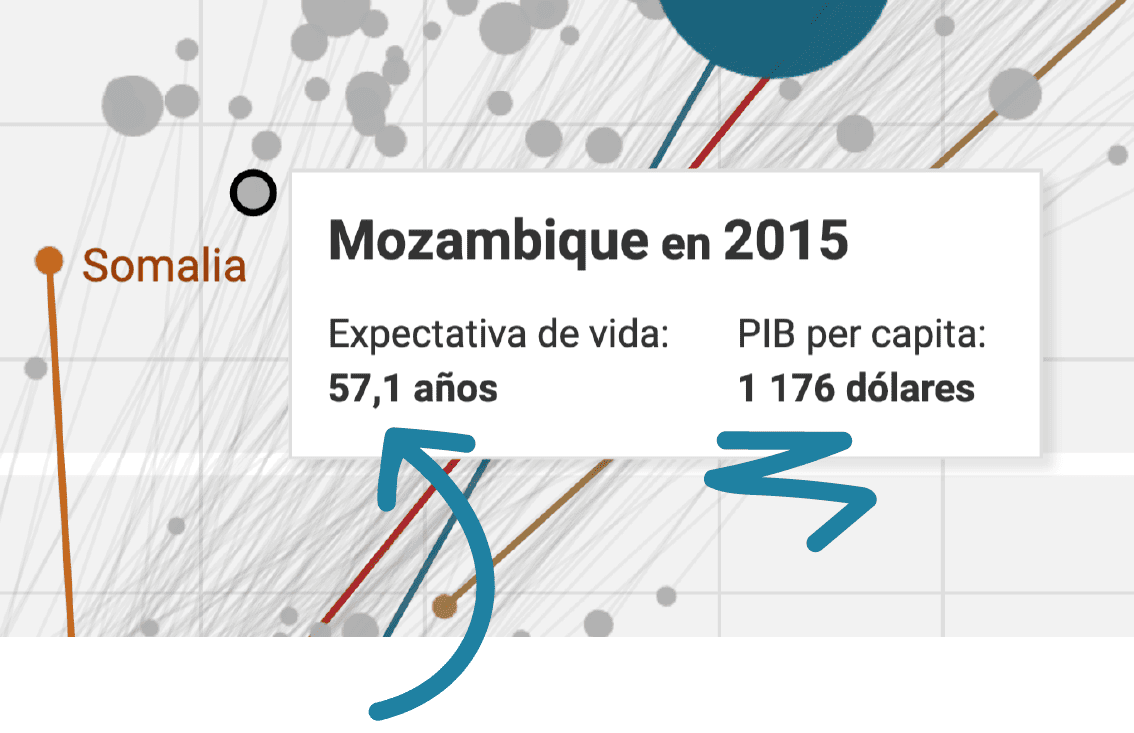
¿Habla español? Datawrapper does.

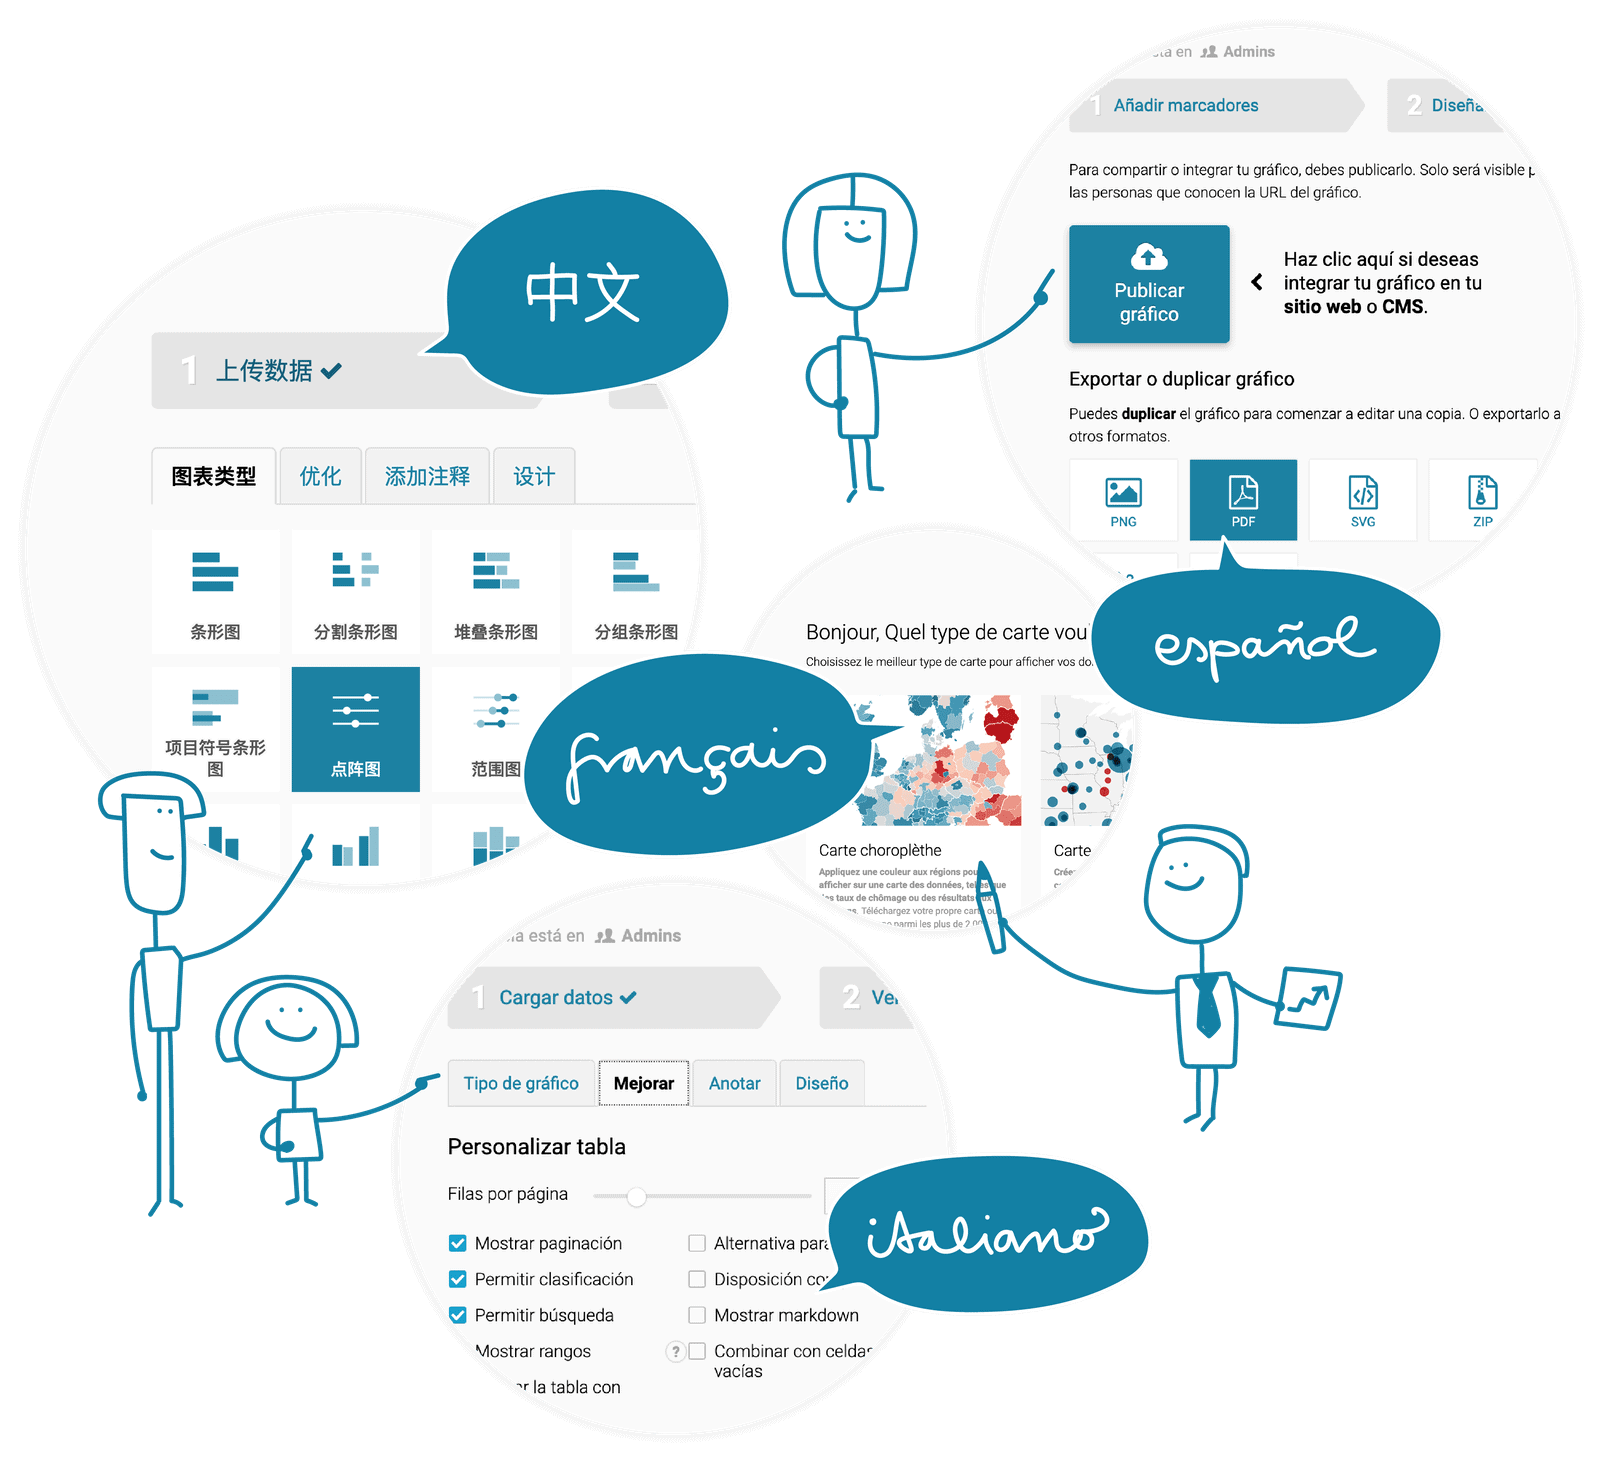
We want to make it as easy as possible to create beautiful charts, maps, and tables. For many people, that means doing so in their native language.

That’s why you can use the Datawrapper app in six different languages: English, German, French, Italian, Spanish, and Chinese.

Read more about our app languages on our blog
image

Here's what else Datawrapper has to offer

Everything your organization needs to visualize data professionally

Dark mode
All visualizations work seamlessly in both light and dark mode, adapting to your readers' preferences. Learn more.
Print export
Export print-ready PDFs with custom layouts, pre-defined CMYK colors, and pre-defined sizes. Learn more.
Comes in your design
Send us your style guide and we'll create a custom design theme for your brand, 100% white-labeled. Learn more.
Accessibility
Create more accessible visualizations – thanks to e.g. keyboard navigation and automatic alt texts. Learn more.
Privacy
No tracking, no cookies, no third-party scripts: Datawrapper embeds don't compromise your website visitors’ privacy. Learn more.
Security
ISO 27001 certification, hosting in Europe, backups: Confidential data and visualizations are safe with Datawrapper. Learn more.
Show all Features

You're in good company

Find out how other teams use Datawrapper to improve their data-driven communication

SWI swissinfo.ch: “Datawrapper is the perfect tool for our work”

Ten languages, five scripts, two data journalists — one charting tool

Learn more
Statistics Flanders: "We want to reach everyone."

How Statistics Flanders in Belgium makes statistics a public good with Datawrapper

Learn more
New York City Department of Health: “Datawrapper was the backbone of our COVID reporting”

How Datawrapper is helping a big public health department to meet the challenges of the pandemic.

Learn more

Do you have questions? Let’s talk!

Contact us here so we can help
image Contact Sales
Skip to content
We have updated our Privacy Policy to reflect the new EU regulations. It is written with the goal of clarity. Please give it a read and accept it.Accept