Product

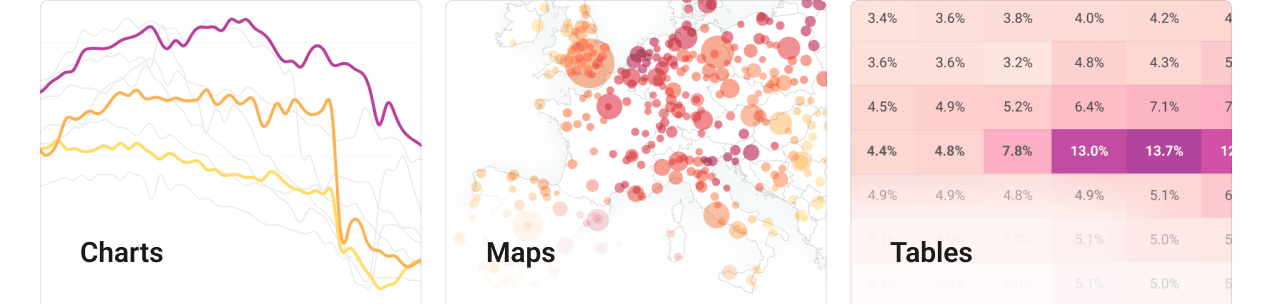
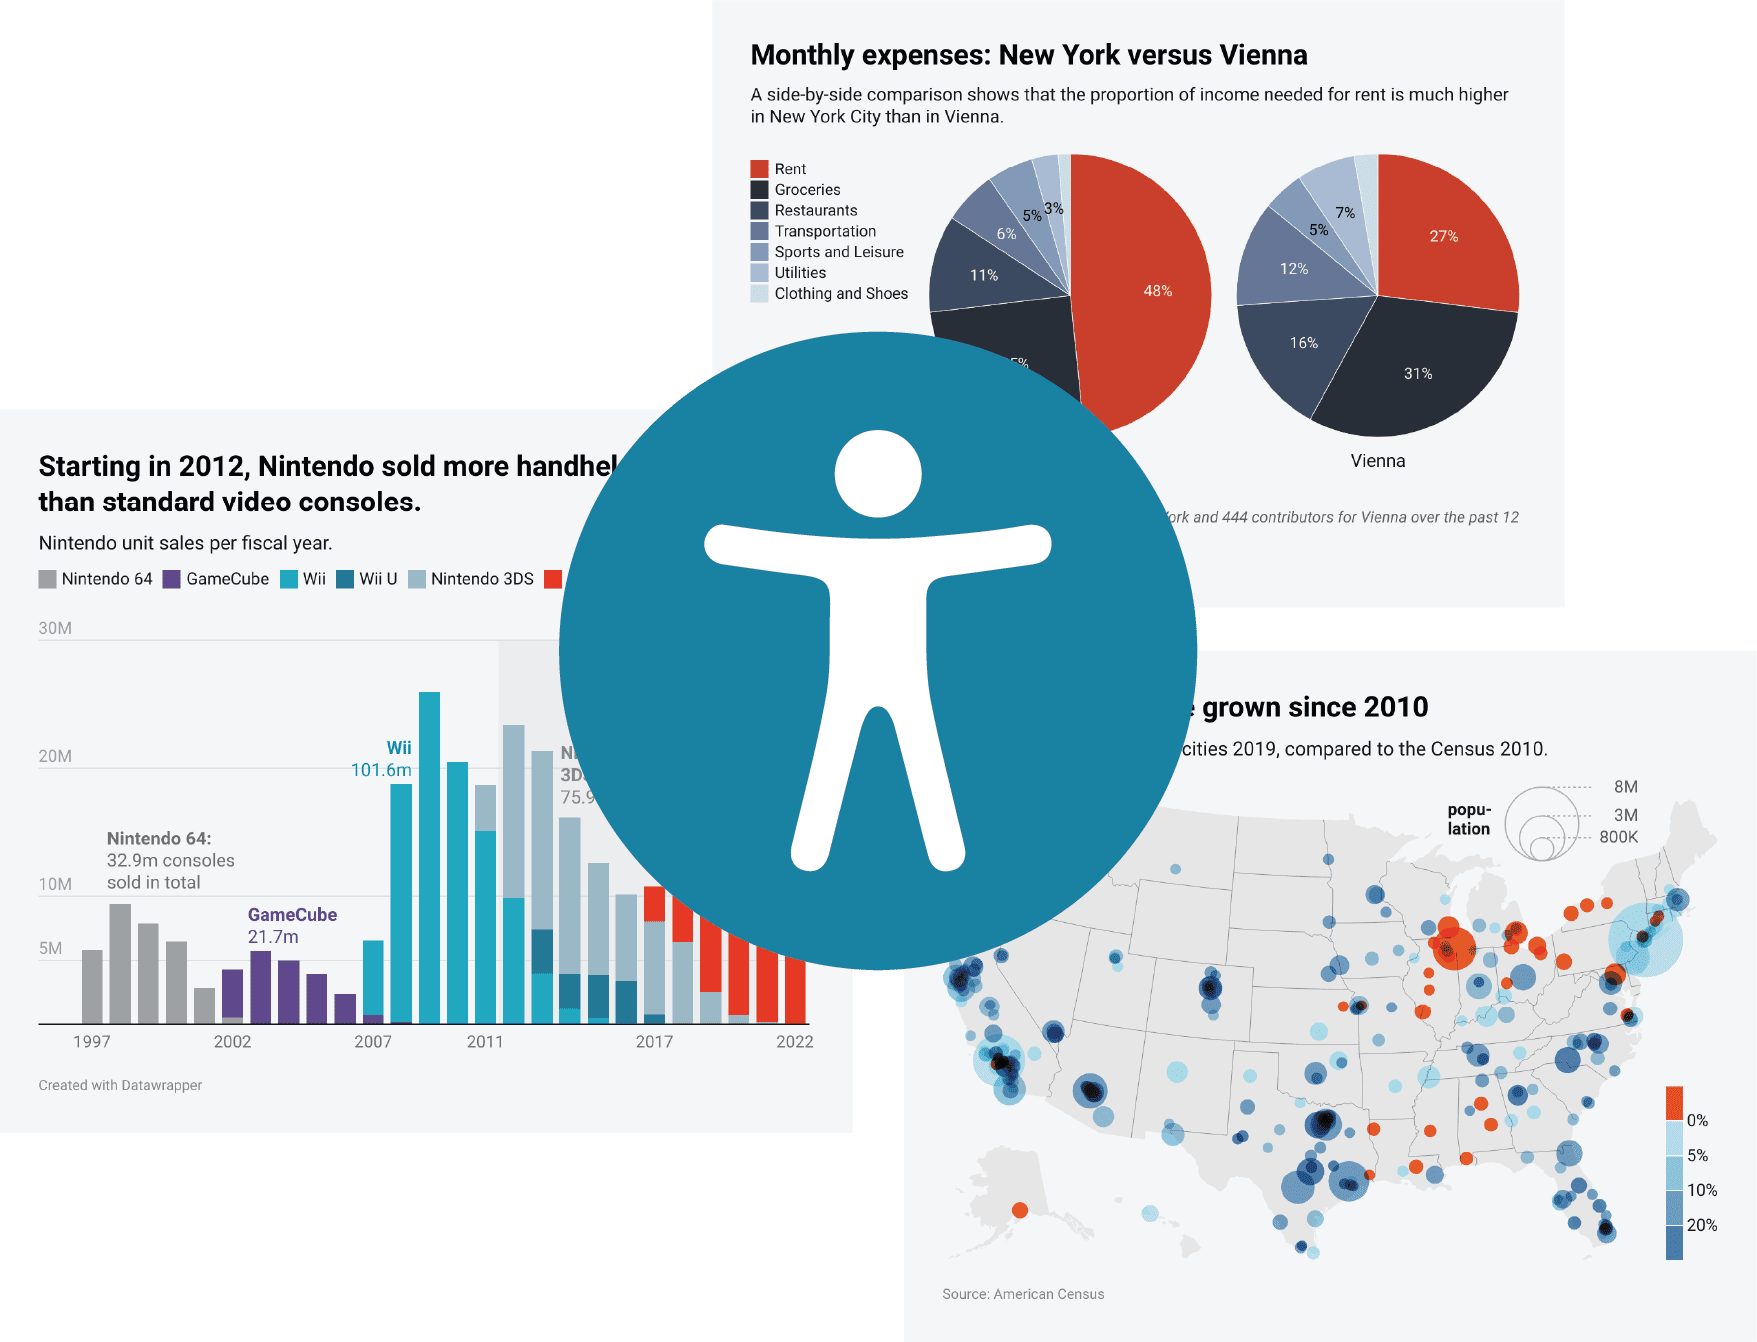
Accessibility: Data visualizations for more of your visitors.

image
Accessibility is not an afterthought for us. It’s a built-in feature in all visualizations.
Create your own accessible chart
It’s free, with no sign-up required.

When you embed an interactive Datawrapper visualization, it’s more accessible than the same chart embedded as an image or screenshot.

That’s because your site visitors can access it via keyboard navigation, download the data themselves, and have their screen readers read out what the visualization is about. Let’s explore some of that:

Image of an eye, an ear, and hands
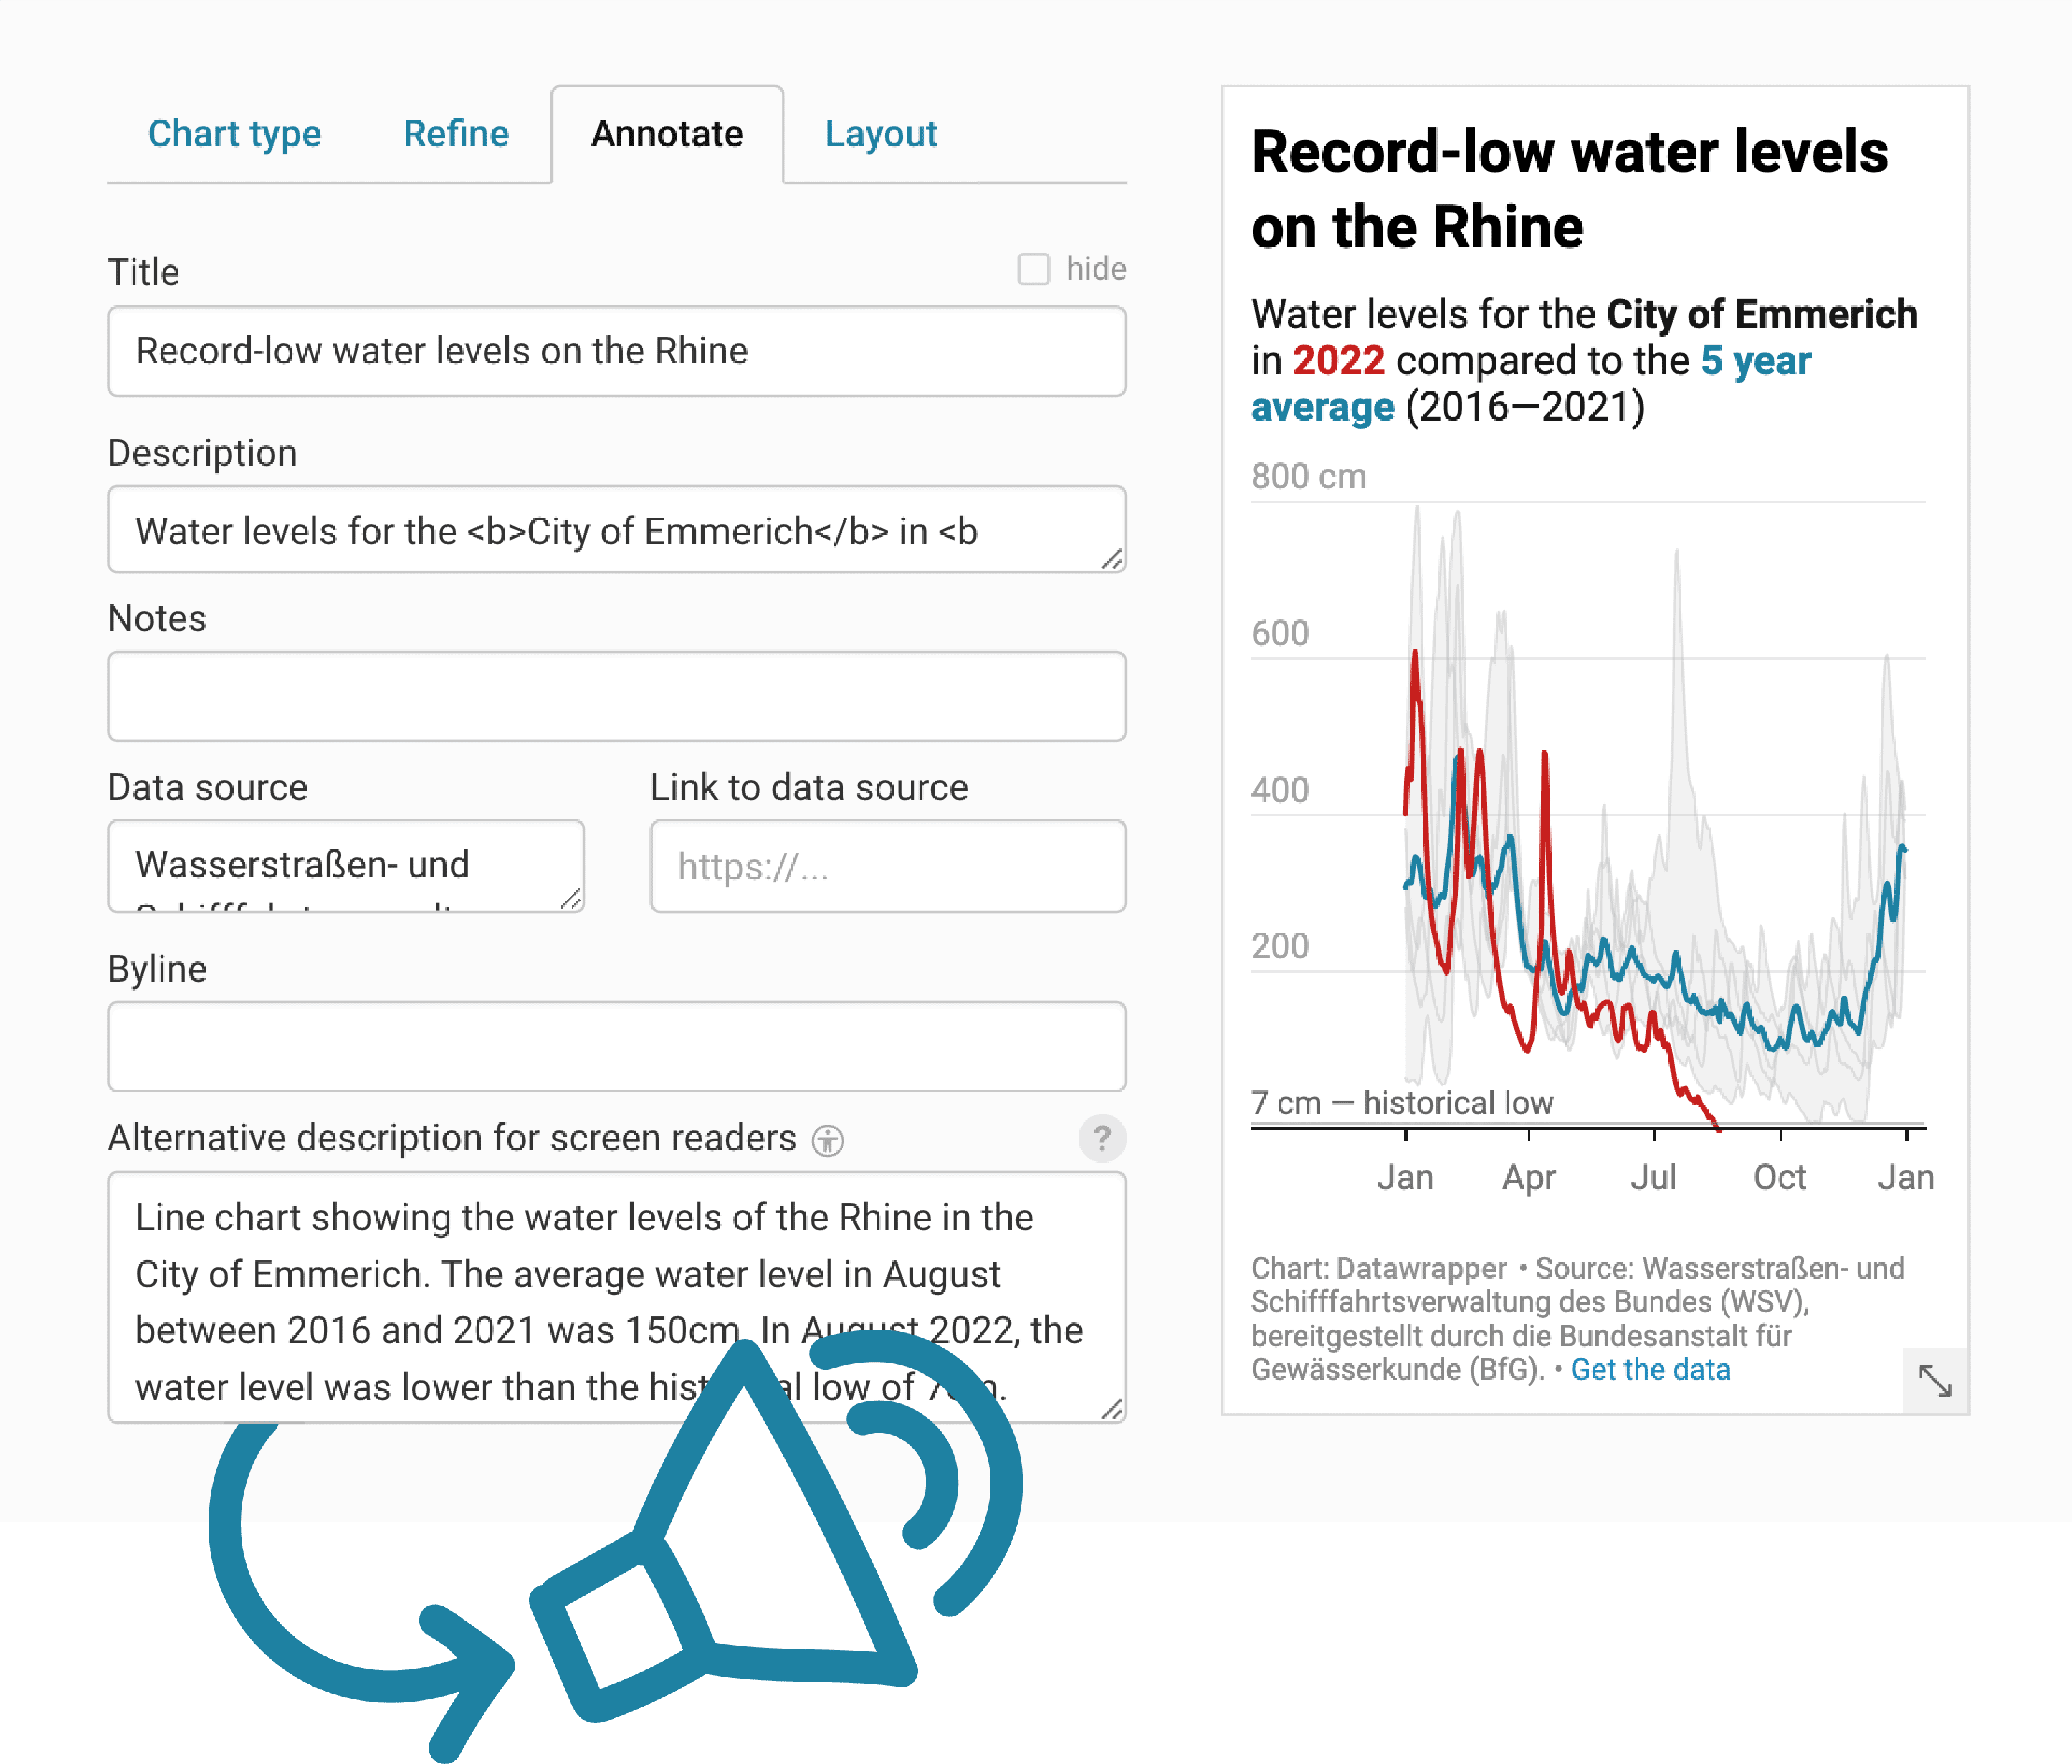
Charts that screen readers will understand

Set an alternative text for all Datawrapper visualizations you create to let screen readers read out what your chart, map, or table is about. If you don’t do so, vision impaired visitors on your website will get a fallback description.

And to let readers explore the data themselves as a CSV, you can set a “Get the data” link below your visualizations.

Read more about automatic alt text on our blog
Screenshot of the Datawrapper app showing the part where users can enter an alternative text for screen readers.
Datawrapper checks your colors, so you don’t have to

Designing charts and maps is already a tricky task — you might not have the time to go the extra mile and check that your colors are colorblind-friendly, too.

That’s why Datawrapper will just tell you.

The automatic colorblind check shows a little warning sign when some of your readers won’t be able to distinguish the colors in your palette.

Learn more about automatic colorblind checking on our blog
Accessible under the hood too

Datawrapper visualizations use semantically correct, descriptive markup that follows the best practices for accessible HTML code.

Decorative image of HTML elements: and
At your fingertips with keyboard navigation

The elements of all your Datawrapper charts, maps, and tables can be navigated using only the keyboard.

Press Tab to go to the next element, Shift + Tab to go back, and Enter to “click.”

Try out keyboard navigation with this table

Here’s what else Datawrapper has to offer

Everything your organization needs to visualize data professionally

Dark mode
All visualizations work seamlessly in both light and dark mode, adapting to your readers’ preferences. Learn more.
Print export
Export print-ready PDFs with custom layouts, pre-defined CMYK colors, and pre-defined sizes. Learn more.
Localization
Use over 50 languages, right-to-left format, and multiple number formats for your visualizations. Learn more.
Comes in your design
Send us your style guide and we’ll create a custom design theme for your brand, 100% white-labeled. Learn more.
Privacy
No tracking, no cookies, no third-party scripts: Datawrapper embeds don’t compromise your website visitors’ privacy. Learn more.
Security
ISO 27001 certification, hosting in Europe, backups: Confidential data and visualizations are safe with Datawrapper. Learn more.
Show all Features

You’re in good company

Find out how other teams use Datawrapper to improve their data-driven communication

New York City Department of Health: “Datawrapper was the backbone of our COVID reporting”

How Datawrapper is helping a big public health department to meet the challenges of the pandemic.

Learn more
KFF: “We are all-in on Datawrapper”

How Datawrapper went from one person’s discovery to an organization’s tool of choice

Learn more
SWI swissinfo.ch: “Datawrapper is the perfect tool for our work”

Ten languages, five scripts, two data journalists — one charting tool

Learn more

Do you have questions? Let’s talk!

Contact us here so we can help
image Contact Sales
Skip to content
We have updated our Privacy Policy to reflect the new EU regulations. It is written with the goal of clarity. Please give it a read and accept it.Accept