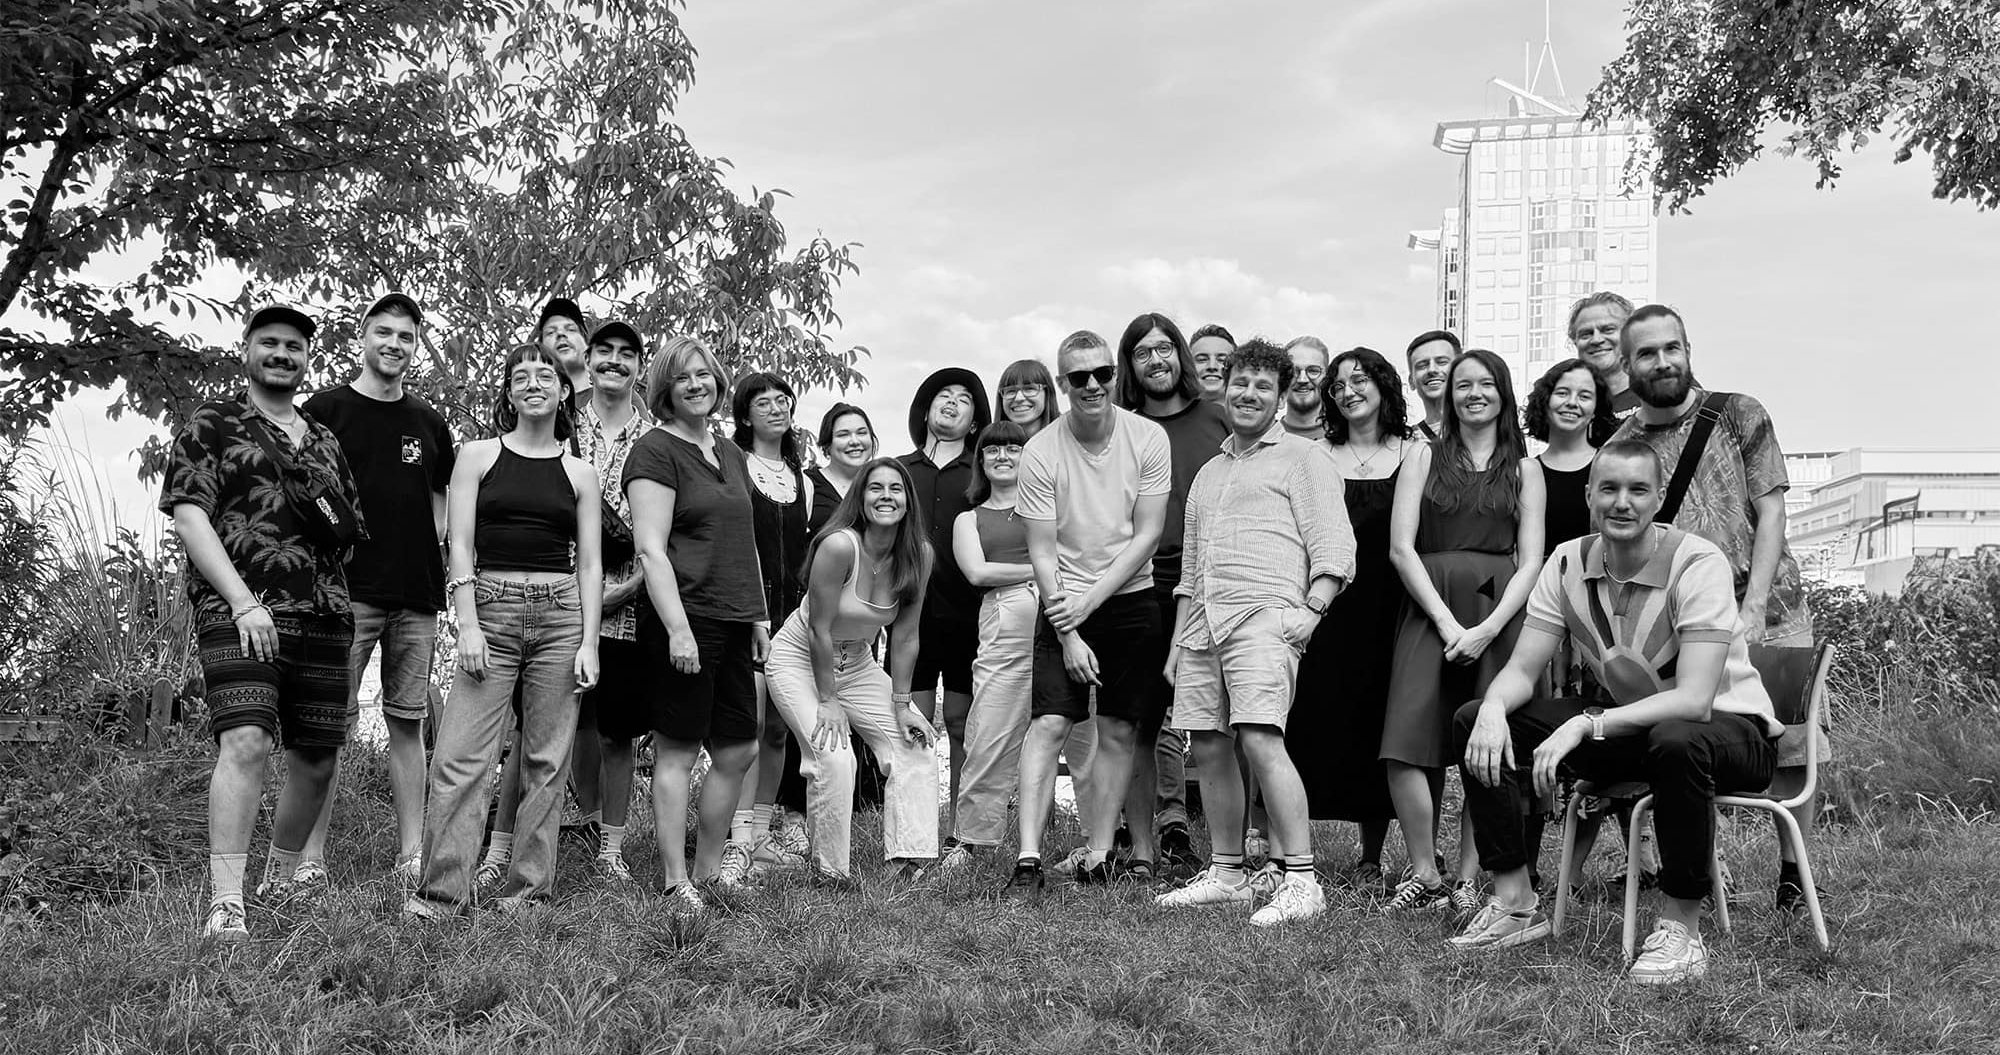
Hi! We are Datawrapper.
As toolmakers, we share the responsibility for the design of the charts, maps, and tables our users create. We think a lot about what makes a good visualization good. What’s important for our users. And what’s important for those who will eventually look at their visualizations.
Our background helps: We spent many years studying data visualization and working as practitioners in international newsrooms like The New York Times, NPR, Deutsche Welle, Bloomberg, Correctiv and ZEIT Online. We’ve given dozens (hundreds?) of workshops and talks, contributed to community discussions through widely shared blog posts and worked on open source tools and resources that are being used around the world.
We learned a thing or two about good visualization design. Now we want to make our users benefit from these learnings – so that they can skip the beginner’s mistakes and create well-designed charts, maps, and tables.
Our team
David Kokkelink (he/him, @DavidKokkelink) is a co-founder and co-CEO of Datawrapper. Originally a software developer, he works across our customer-facing and product development teams to make sure Datawrapper is headed in the right direction. David lives in Berlin.

Elana Levin Schtulberg (she/her, @elanaEllesce) is co-CEO of Datawrapper and head of visualization. Together with her team, she builds new visualization types and features for Datawrapper. Elana has a background in physics and design and sees data visualization as a perfect intersection of the two. She lives in Berlin.
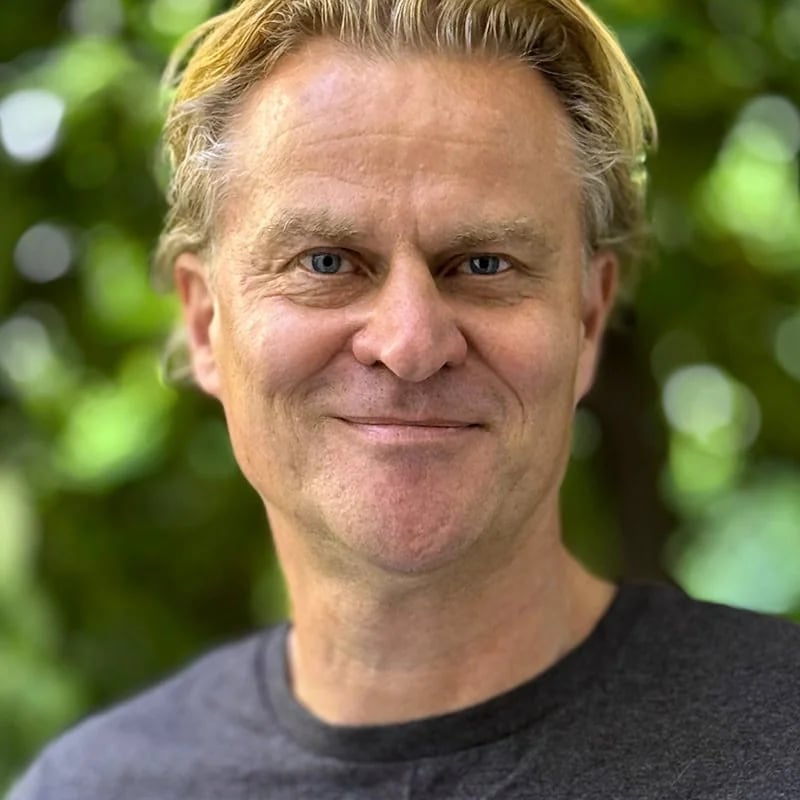
Mirko Lorenz (he/him, @mirkolorenz@vis.social, LinkedIn) is a co-founder of Datawrapper and a member of the advisory board. Before that, he served as CEO and later co-CEO of the company for almost 10 years since its inception in 2012. Mirko lives in Cologne.
Gregor Aisch (he/him, Bluesky, Mastodon, LinkedIn) is a co-founder of Datawrapper and a member of the advisory board. He was responsible for the product design and development in the first years of Datawrapper and later served as CTO for five years. Gregor still enjoys making graphics and lives in Berlin.

Lisa Charlotte Muth (she/her, @lisacmuth, @lisacmuth@vis.social) is Datawrapper’s head of communications. She writes about best practices in data visualization and thinks of new ways to excite you about charts and maps. Lisa lives in Berlin.

Daniela Haake (she/her) is Datawrapper’s head of operations. She is responsible for human resources, accounting, and information security. When not managing our office, she works as a business coach to help people find solutions to their individual problems. Daniela lives in Berlin.

David Wendler (he/him) is Datawrapper’s head of design. He’s responsible for all things design at Datawrapper, especially the interface and user experience. David has worked as a designer in several other settings, most recently in a newsroom visualizing data with journalists. He lives in Berlin.

Margaux Bourdon (she/her) is Datawrapper’s head of support and customer success, answering your emails together with her team. Outside of work, you’ll find her wondering which craft to learn next or wandering flea markets. Don’t hesitate to reach out — even for the easiest things — at support@datawrapper.de. Margaux lives in Lyon.

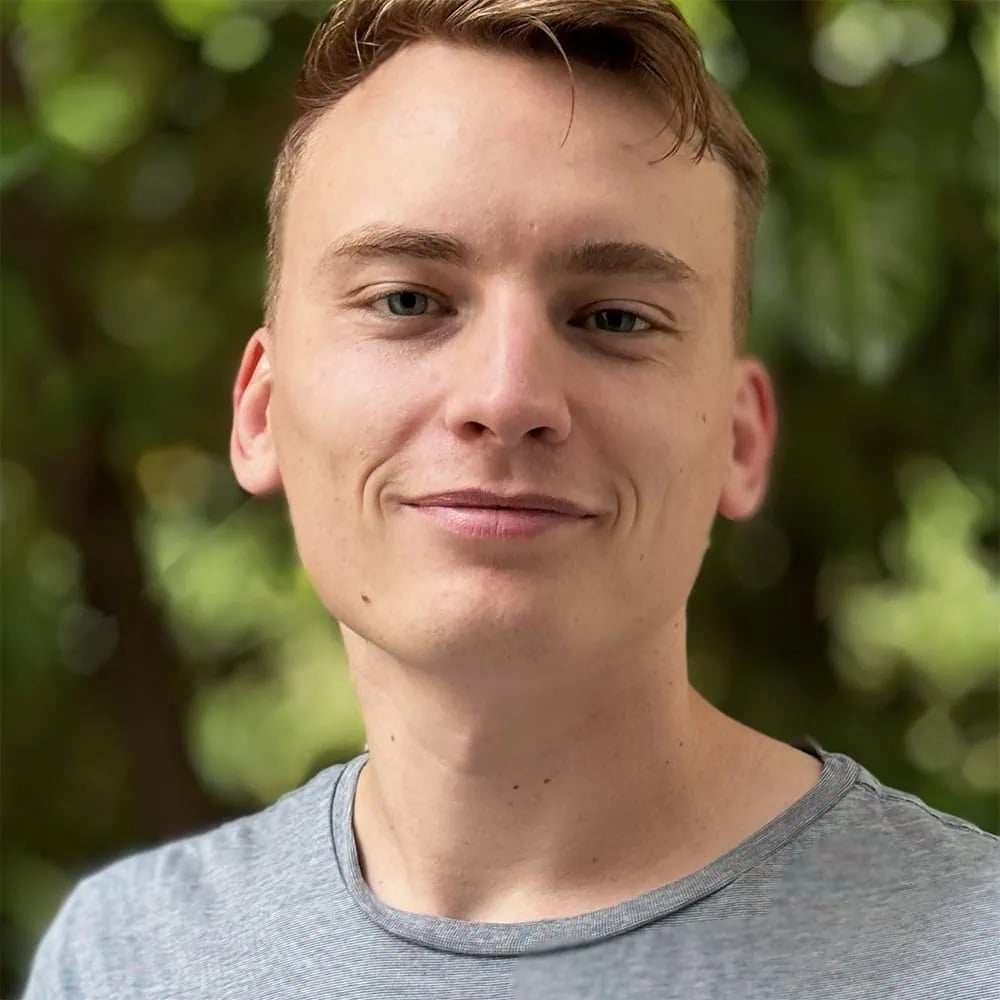
Marten Sigwart (he/him, @martensigwart) is Datawrapper’s head of app development and, as such, responsible for the Datawrapper editor, team settings, and more. Outside of Datawrapper, you’ll find him either working on one of his side projects or exploring Berlin, playing football, and enjoying the sun.

Ivan Lokhov (he/him) is a data visualization developer at Datawrapper. When coding at Datawrapper just isn’t enough, he creates his own visualisations. Ivan enjoys exploring rural areas around Berlin, drinking tea, and listening to electronic music from the 90s.

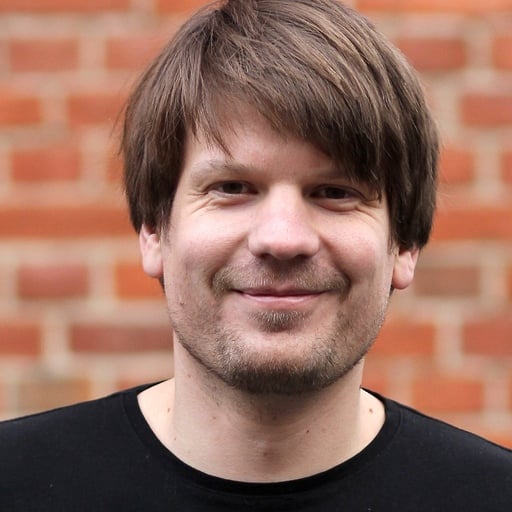
Hendrik Bartusch (he/him, @eXo_X5) is a backend developer at Datawrapper. He takes care of our servers and the map data used in Datawrapper locator maps. Hendrik believes that only code that you write yourself is code you truly understand, and likes coding late at night. He lives in Magdeburg.

Anna Thieme (she/her) is a basemap creator on Datawrapper’s support and customer success team, and takes care of adding and updating administrative regions for our choropleth and symbol maps. She’s also the author of our Map Stories series. You need a map? Get in touch with her at support@datawrapper.de. Anna lives in Berlin.

Shaylee Safie (she/her) joined Datawrapper’s support and customer success team after she visited Berlin one time and immediately knew she needed to move here. Outside of work, you can find her knitting, listening to podcasts, or exploring the city. If you’re trying to get a tricky dataset to behave in Datawrapper, she’d love to help at support@datawrapper.de.

Elliot Bentley (he/him, vis.social/@ejb) is a senior data visualization developer at Datawrapper. He previously worked on interactive graphics and internal tools at The Wall Street Journal and created the popular web app oTranscribe. Outside of work, Elliot likes to make his own video games. He lives in London.

Guillermina Sutter Schneider (@gsutters) is a product specialist at Datawrapper and part of the sales team. She helps you get the most out of the tool through public webinars. A data visualization designer herself, Guillermina likes coding, color theory, numbers, and Berlin — not necessarily in that order.
Antonio Sarcevic (*/? (any or none), @SarcevicAntonio) is a software developer on Datawrapper’s app team working on user experience. Outside of work, Toni helps to maintain SvelteLab and creates Svelte and web dev guides on sarcevic.dev. He also loves going to concerts and riding his fingerboard. Toni lives in Münster.
Jack Goodall (he/him) is a software developer in Datawrapper’s App team. He’s keen on squashing bugs and optimizing performance. When he’s not clacking away at his keyboard, he enjoys skiing, photography, rock climbing, and twiddling his mustache. Jack lives in Lyon.

Luc Guillemot (he/they, @Luc) is a developer on Datawrapper’s visualization team. Before that, he created visualizations as a data journalist and social scientist. When not making sure your labels have the correct position, you can spot him running in the forests around Berlin or listening to hyperpop.

Michael Do Thoi (he/him) is on the support and customer success team. If you’re trying to figure something out in Datawrapper, he’s all ears (and eyes, if you message support@datawrapper.de). When not talking or typing, Michi’s probably thinking deeply about food or music. He lives in Berlin.

Alexander Käßner (he/him, @alexkaessner, @alexkaessner@mas.to) is a designer at Datawrapper, especially focused on interface and experience design. When not iterating on Datawrapper’s interactions, you can find him working on his side projects, jogging around Berlin, taking care of his small garden, or playing volleyball.

Julian Freyberg (he/him, @jfreyberg) is a full-stack developer on Datawrapper’s app team and eager to make charting as smooth and fun as possible. Before joining, he studied data and computer science and worked on scientific apps. He enjoys going to the gym, cooking, and learning about economics and cinematography. Julian lives in Heidelberg.
Linus Aarnio (he/him) is a full-stack developer on Datawrapper’s app team. He likes to find simple solutions to hard problems. When not at work, he enjoys the outdoors in various forms: During the summer months, he can be found hiking, paddling, or riding his gravel bike. In the winter, he does both cross-country and downhill skiing. Linus lives in Åland.

Jonathan Muth (he/him) is Datawrapper’s website development lead. He has experience as a brand strategy consultant, product owner and front-end developer, holds a master’s degree in communication science, and toured Europe making music with a GameBoy. Jonathan lives in Berlin.

Gustav Neustadt (he/him, @gustavneustadt@vis.social) is an interface designer on Datawrapper’s design team. He lives in Potsdam, right outside the gates of Berlin. When he’s not nudging pixels, you can find him out and about with his family, fixing his bike, and tinkering with electronics and code.

Ceren Dolma (she/her, @ceren_do) is a part of the support and customer success team. She is a cartographer by trade and has found her way into data vis by way of making maps to tell stories. Outside of work, she likes to read, teach yoga, go bouldering, and she is most recently learning tricks with hula hoops. Ceren lives in Belfast.

Erle Monfils (she/they) is a data visualization developer at Datawrapper. Having studied anthropology, she is interested in both the technical and the human side of technology. When not working on one of her many unfinished side projects, Erle enjoys reading and making music. She lives in Italy.

Alicia Madlangbayan (she/her) is a visual designer at Datawrapper with a background in product design. Outside of work, she enjoys arts and crafts, cooking, making music, and bouldering. Alicia lives in Berlin.

Moritz Kuhn (he/him) is a data vis product designer at Datawrapper. He designs the tools and interfaces that help users create clear, accessible, and impactful charts. When he’s not arranging rectangles on a screen, you’ll likely find him at the boxing gym or a live concert. Moritz is based in Frankfurt am Main.

Jona Pomerance (he/him, @jona@vis.social) is an interface designer on Datawrapper’s design team. Away from the screen, you can find him commenting on beautiful letterforms and incorrect apostrophes in Berlin’s cityscape, learning Asian languages, playing badminton, and caring for his house plants.

Michelle Otiji (she/her) is a working student on Datawrapper’s communications team. She creates the Data Vis Dispatch to keep data visualization enthusiasts up to date on exciting new projects. Michelle studies interface design in Potsdam.