Everything you need to create professional and beautiful visualizations
Discover all features that help you create visualizations with ease and confidence.
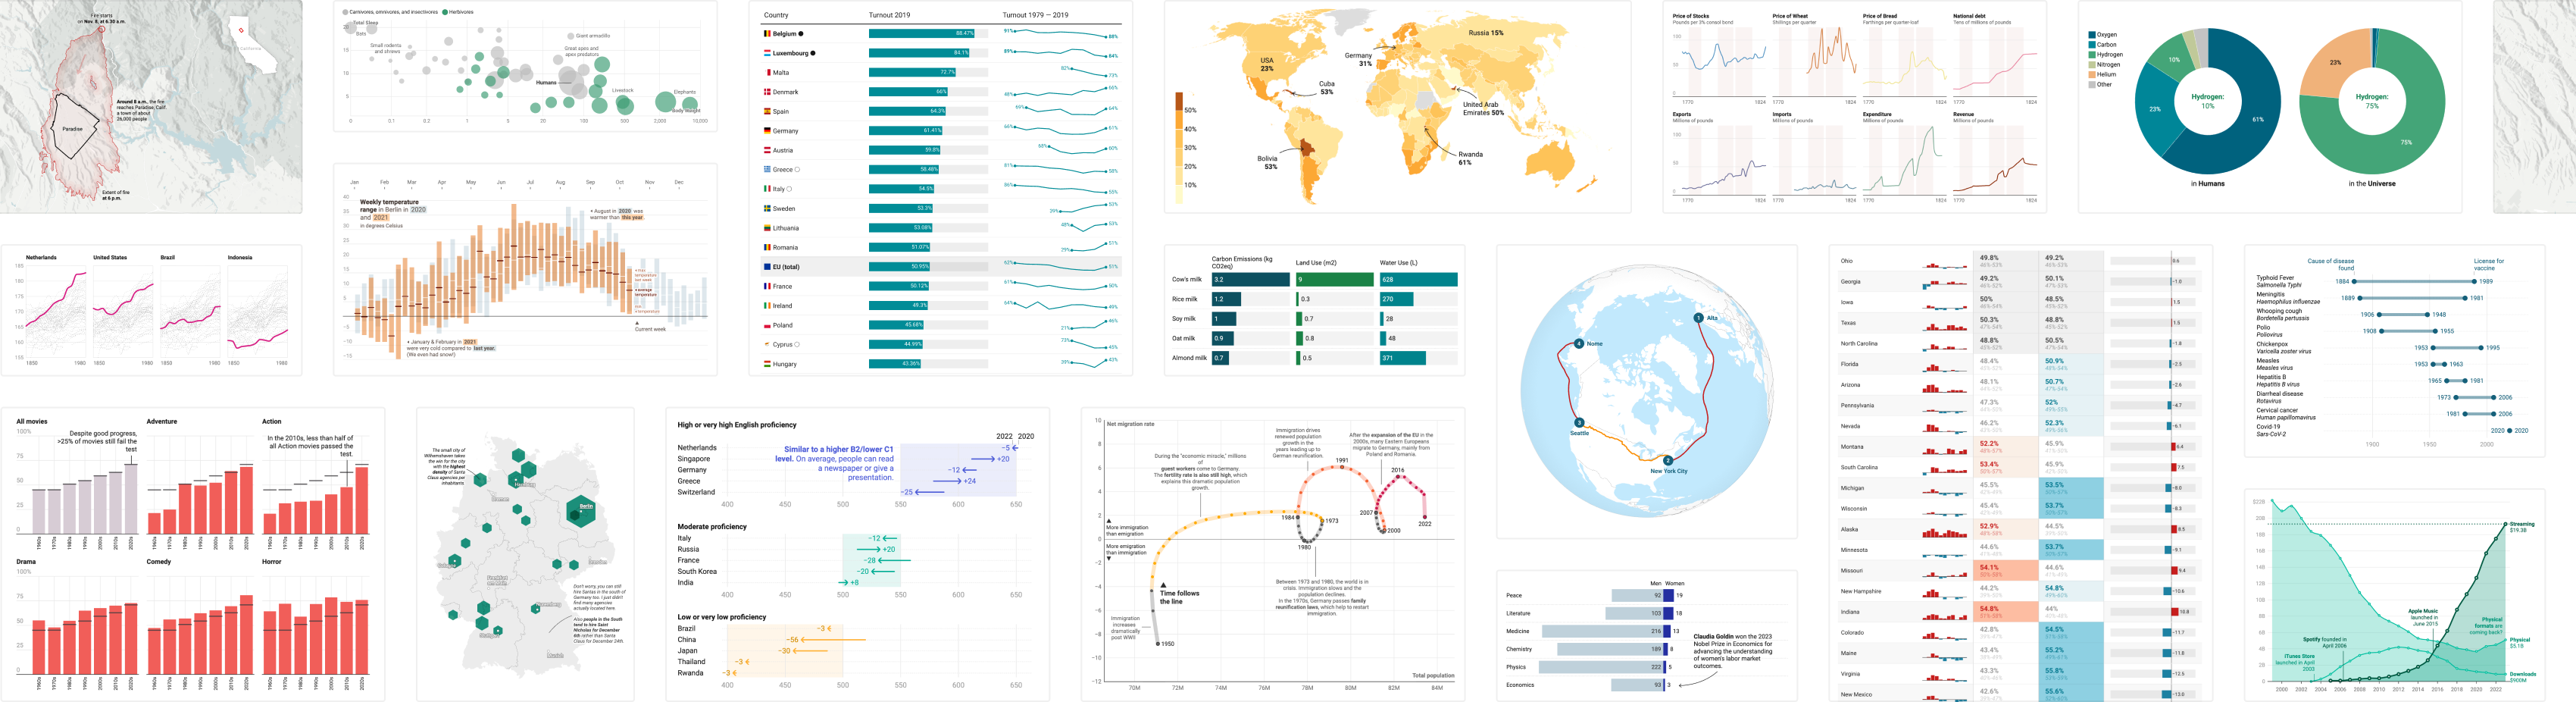
Charts, maps, and tables
Explore 25 interactive, responsive, and accessible visualization types.
Charts
Charts
- More than 20 chart types to visualize time, shares, relationships, and more
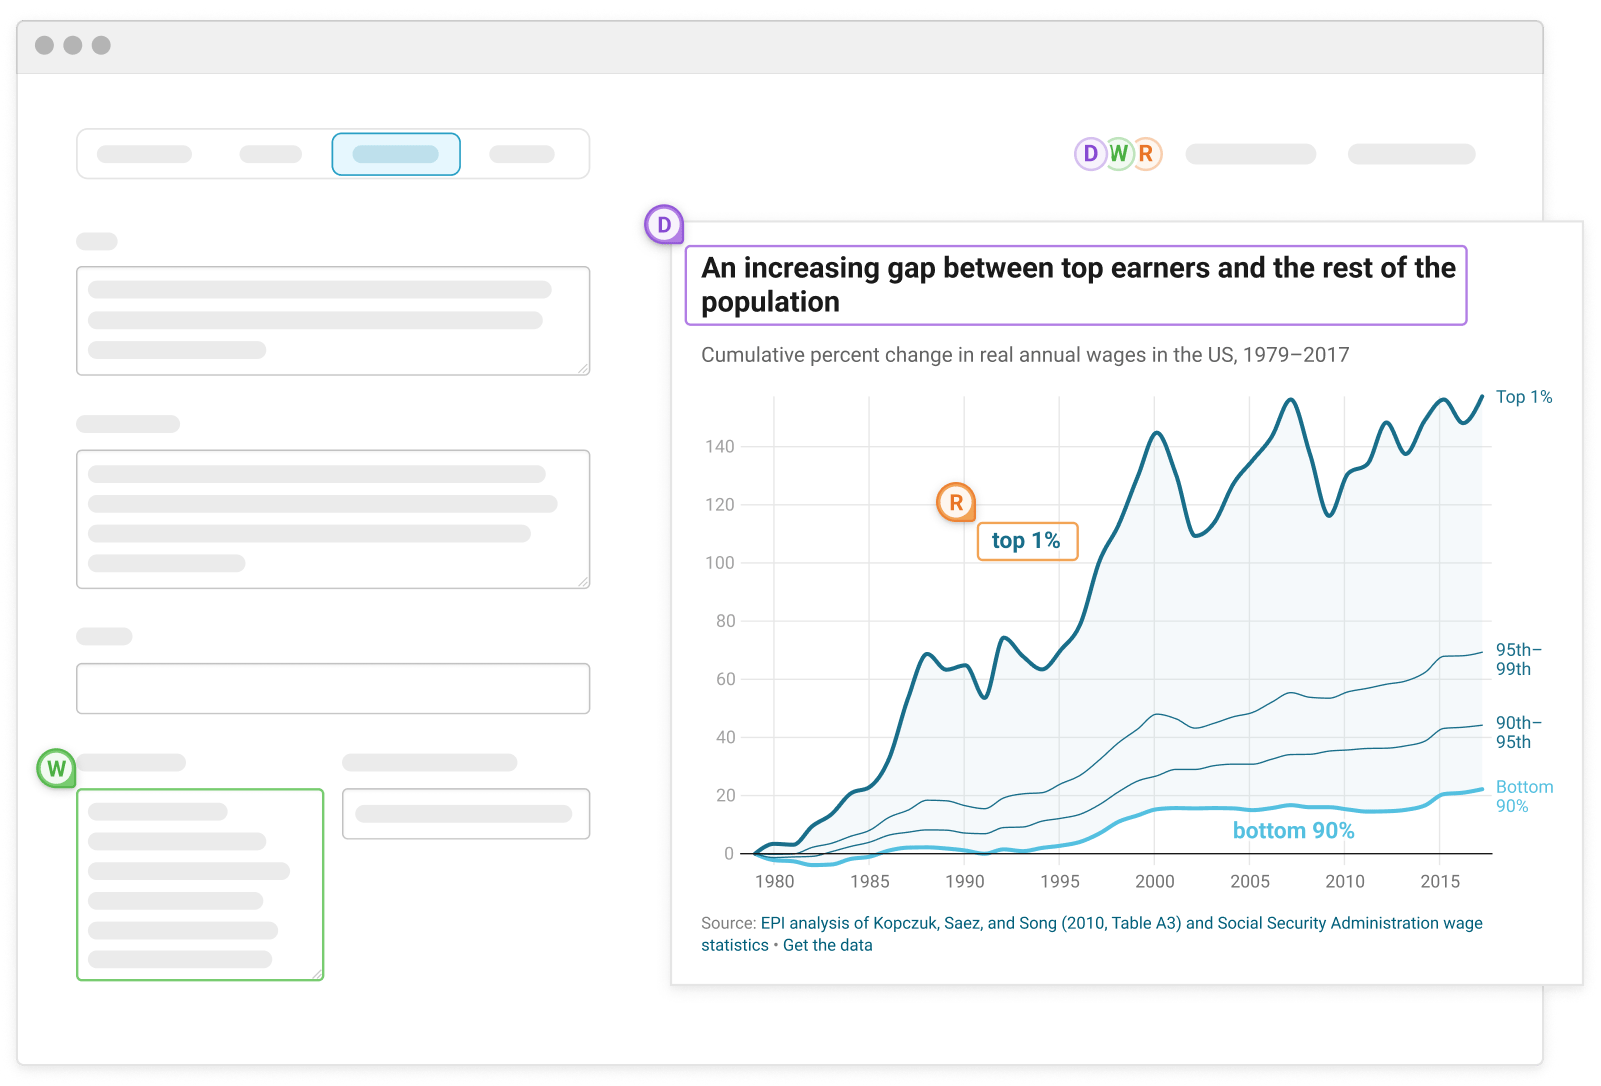
- Annotations, overlays, and highlights to reveal key insights
- Less effort through smart default design
Maps
Maps
- Put your data in place with symbol, choropleth, and locator maps
- More than 4000 basemaps and cartograms to choose from
- Built in annotations, tooltips, zoom, and more
Tables
Tables
- Add images to your table and style them to your liking
- Heatmaps, and miniature charts to make your data easy to compare
- Search, pagination, and sort options for big data sets
Designed with everyone in mind
Datawrapper makes sure all your readers get the best experience.
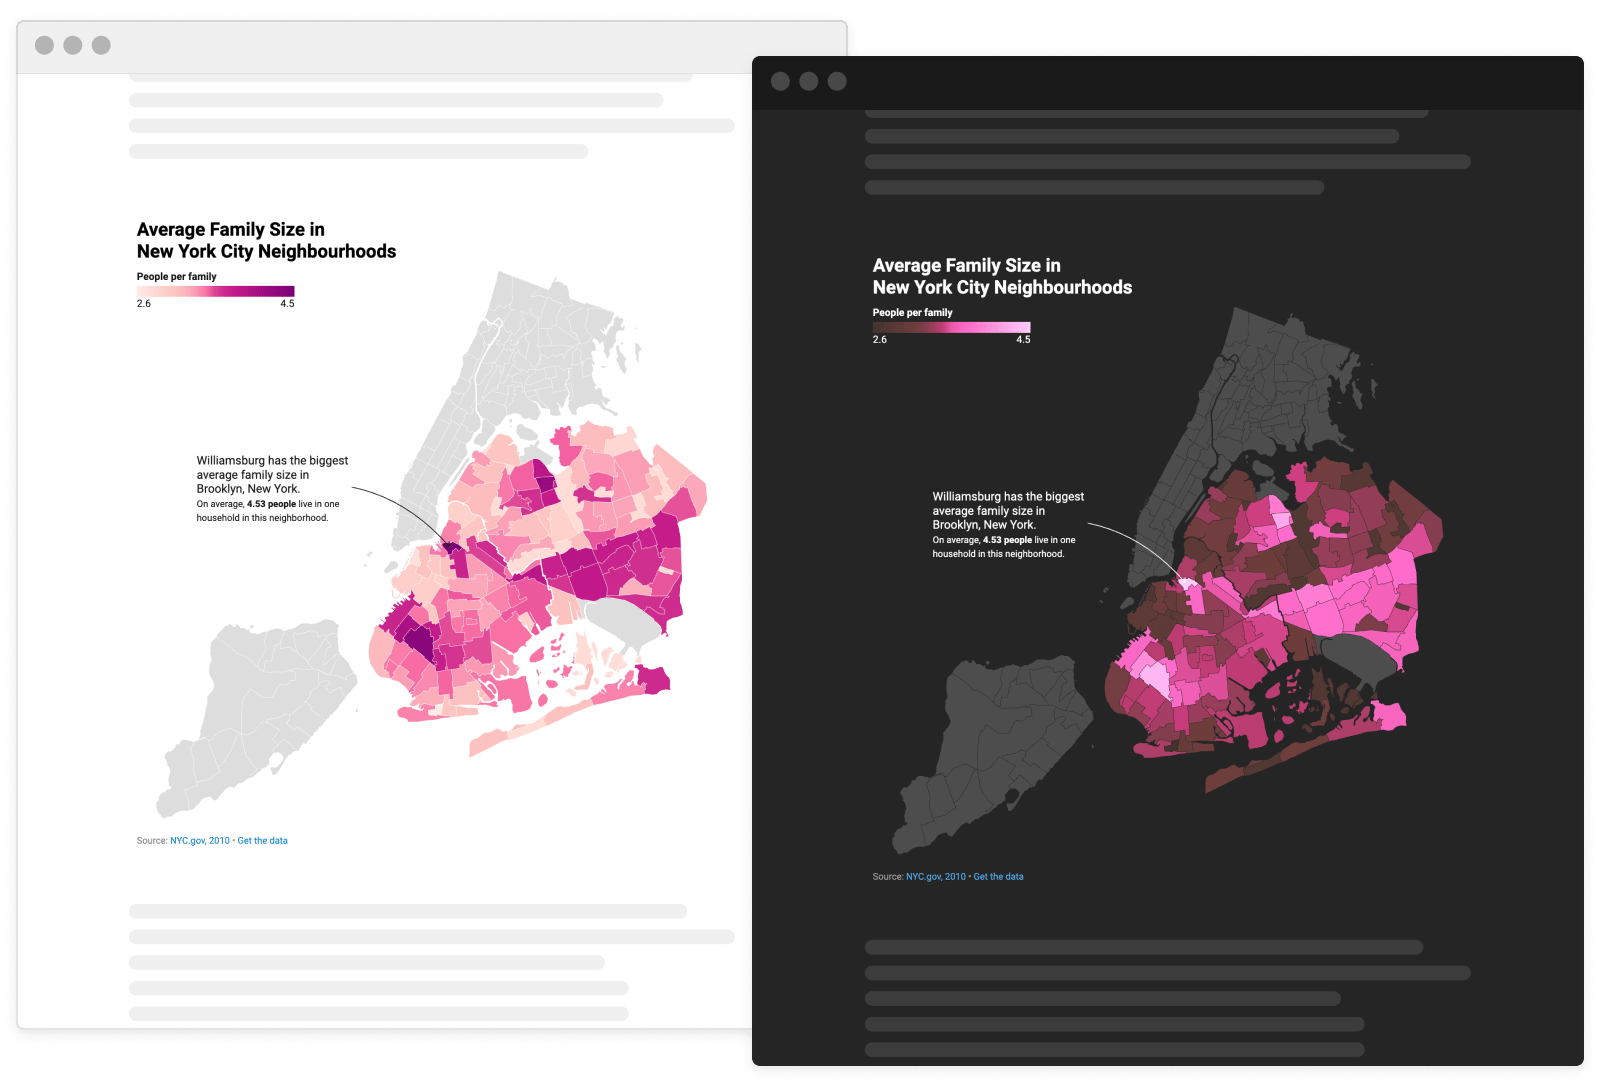
Dark mode
Reduces eye strain while keeping your visualizations legible and looking great. Learn more
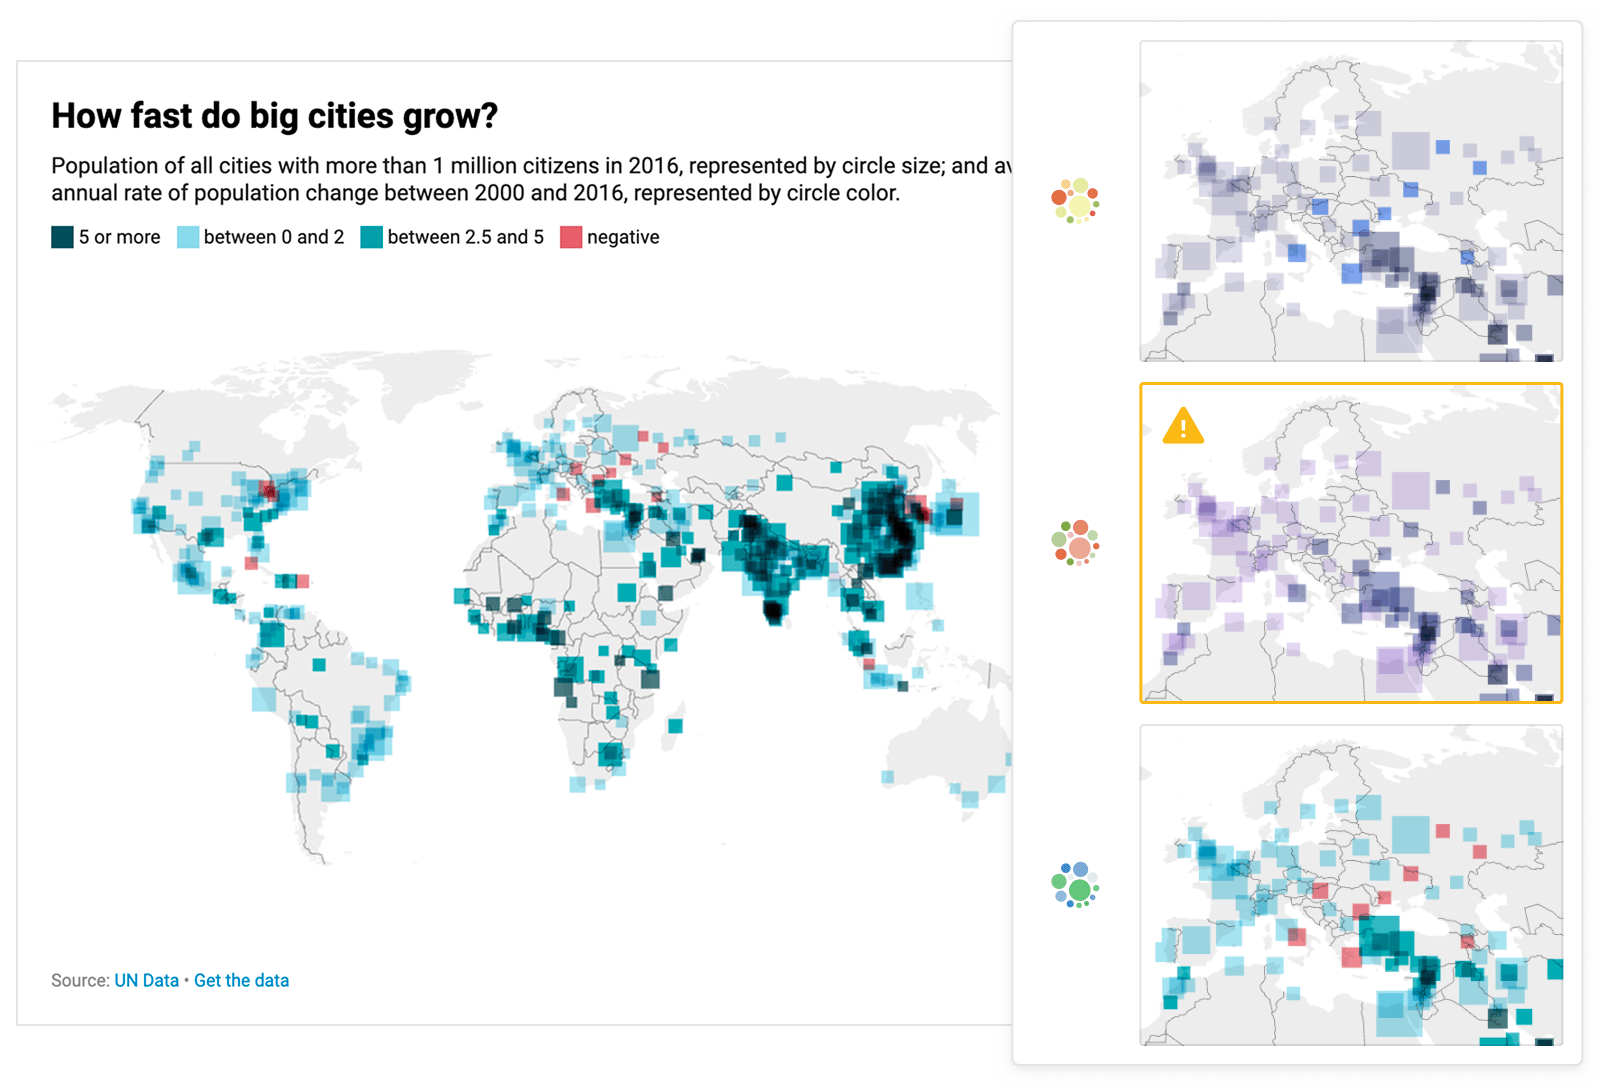
Color check
Make sure your visualizations can be read by everyone, with our built-in accessibility tool. Learn more
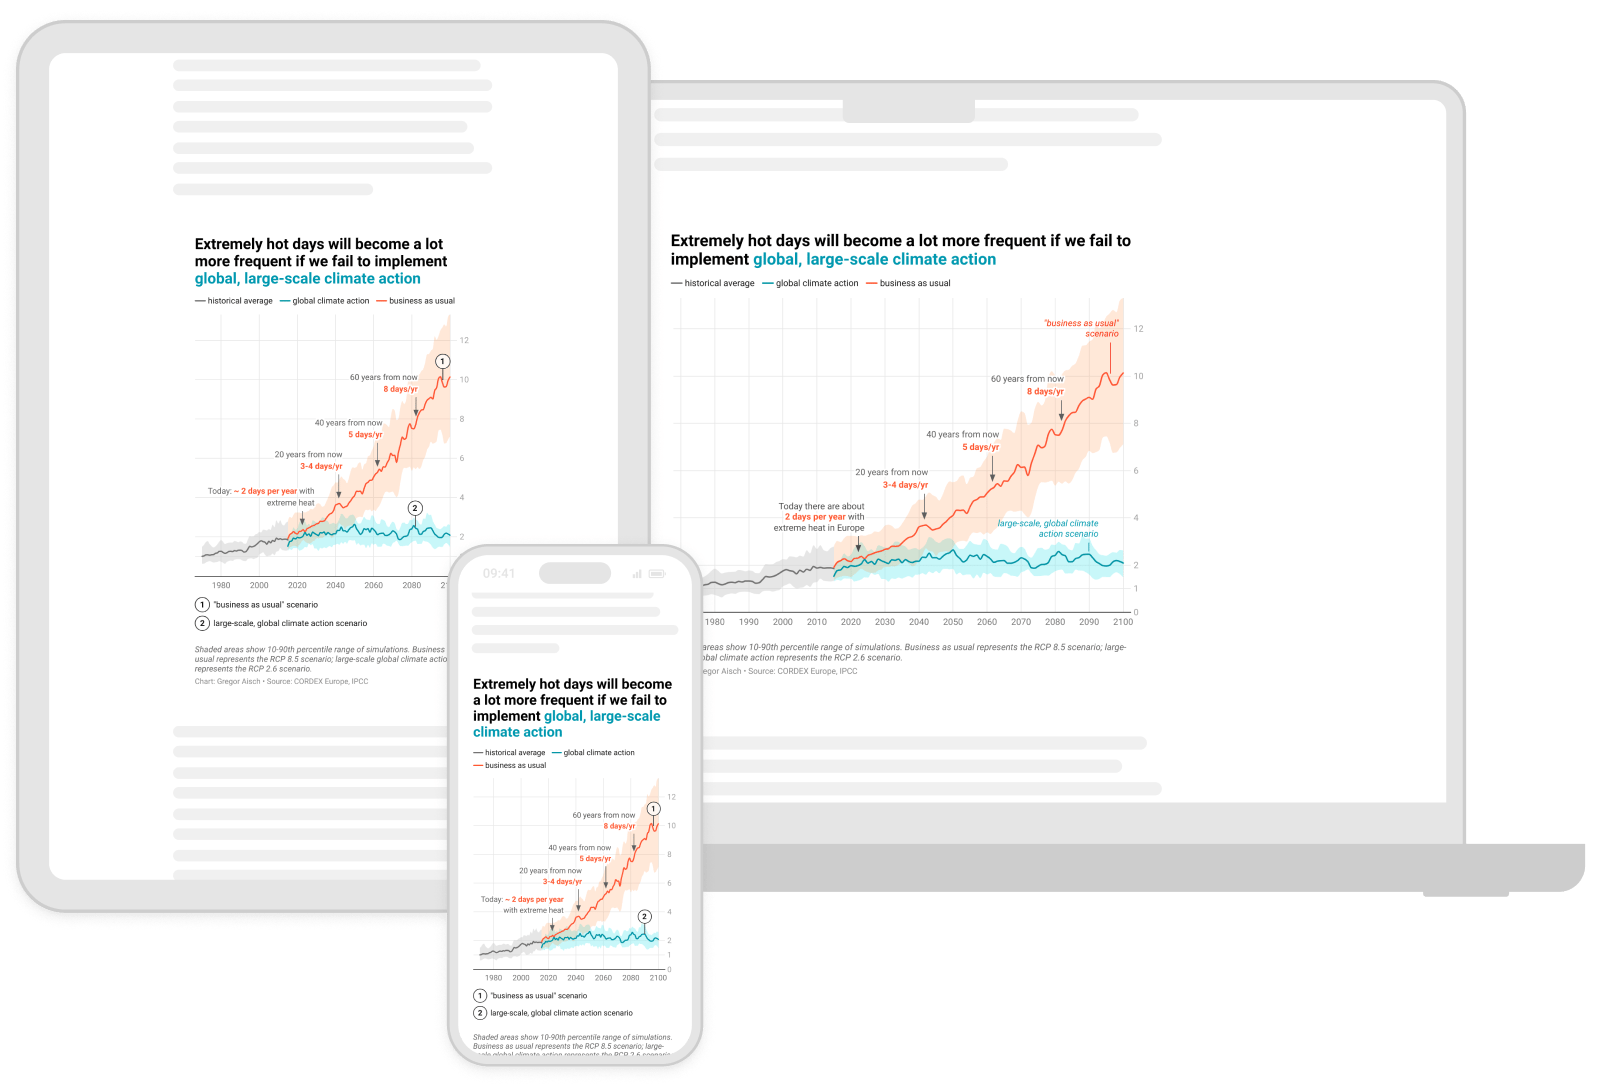
Responsive design
On desktop devices, tablets, or smartphones – your visualizations are beautiful and legible everywhere.
Publish anywhere
Embed and export your visualizations with Datawrapper.
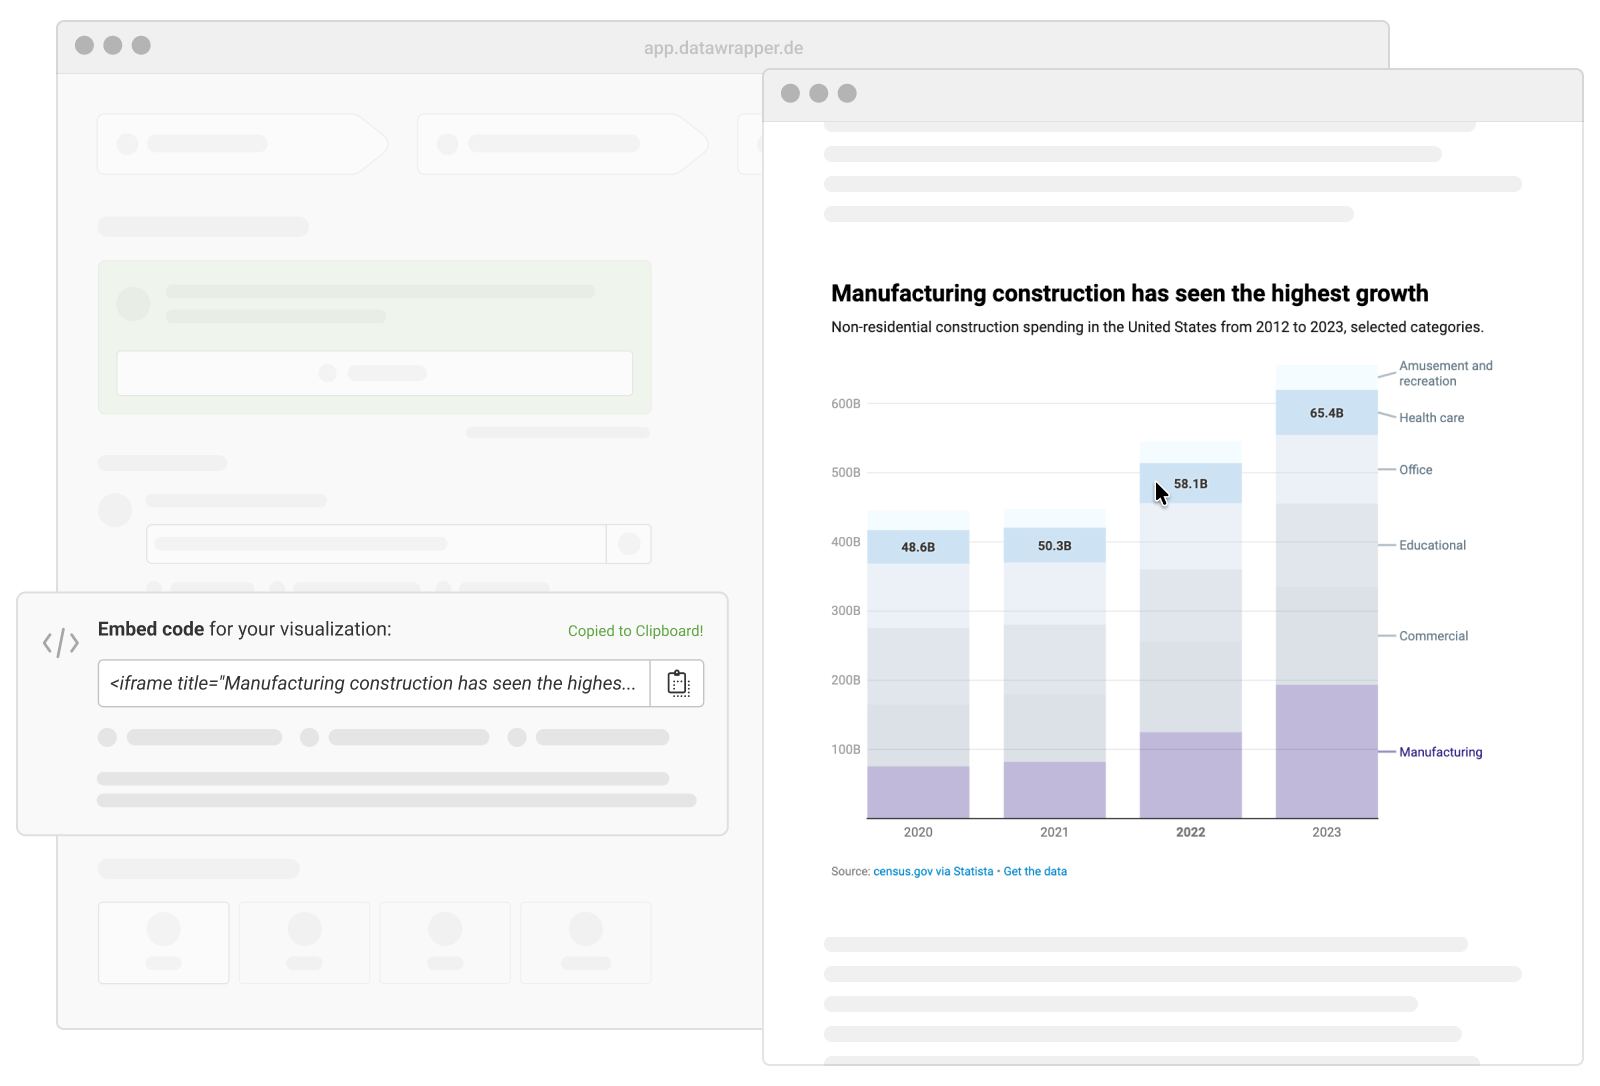
Interactive website embeds
Embed your charts, maps, and tables in almost any website with just a single line of code.
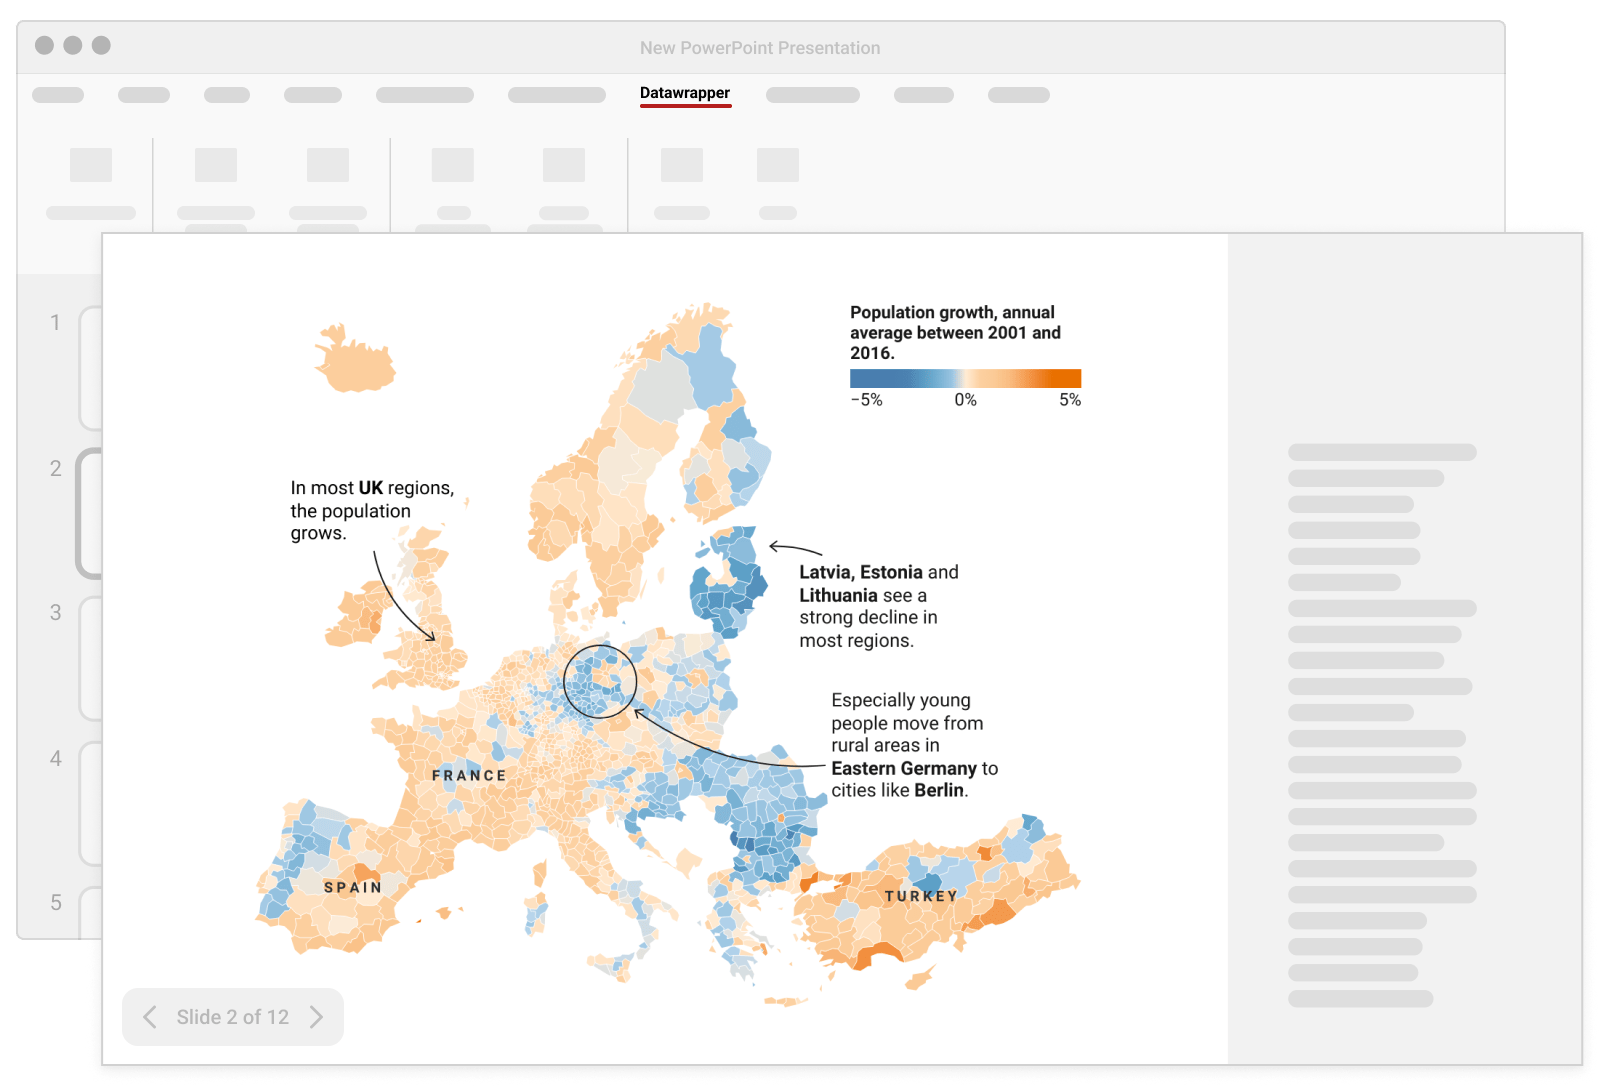
PowerPoint Integration
Bring the power of Datawrapper to your favorite presentation tool with our official add-in. Learn more
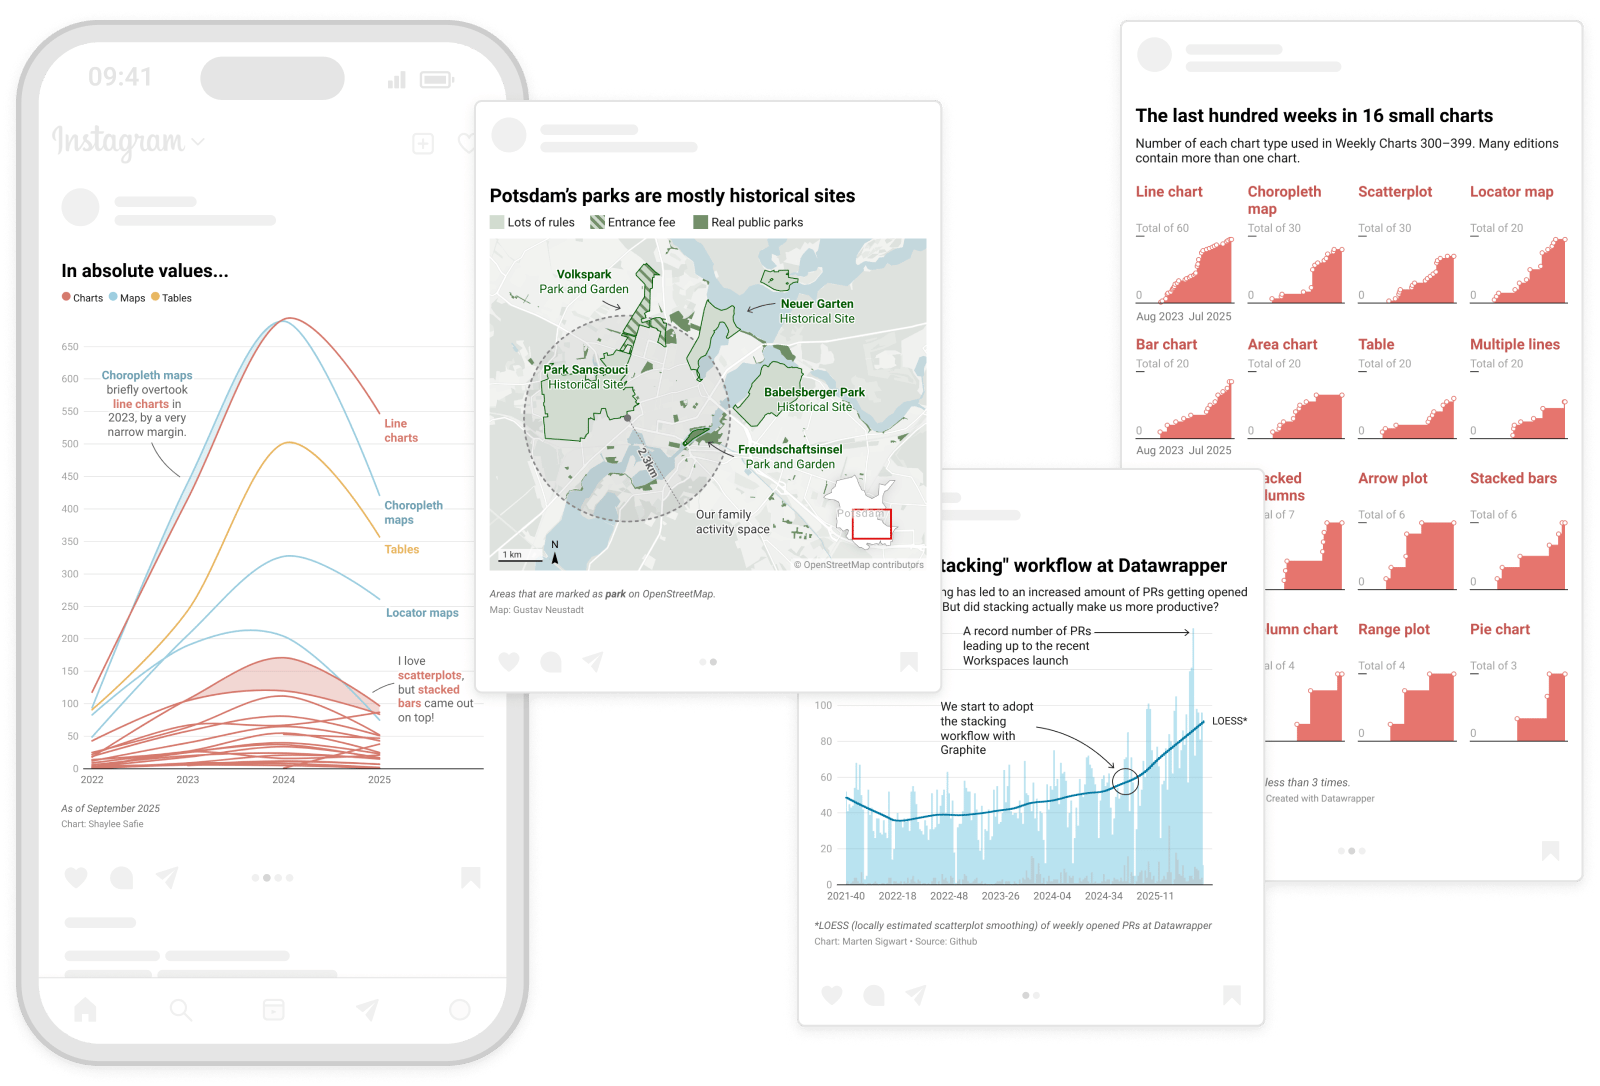
Static PNG export
Export your visualizations as a static PNG to use in social media posts or presentations.
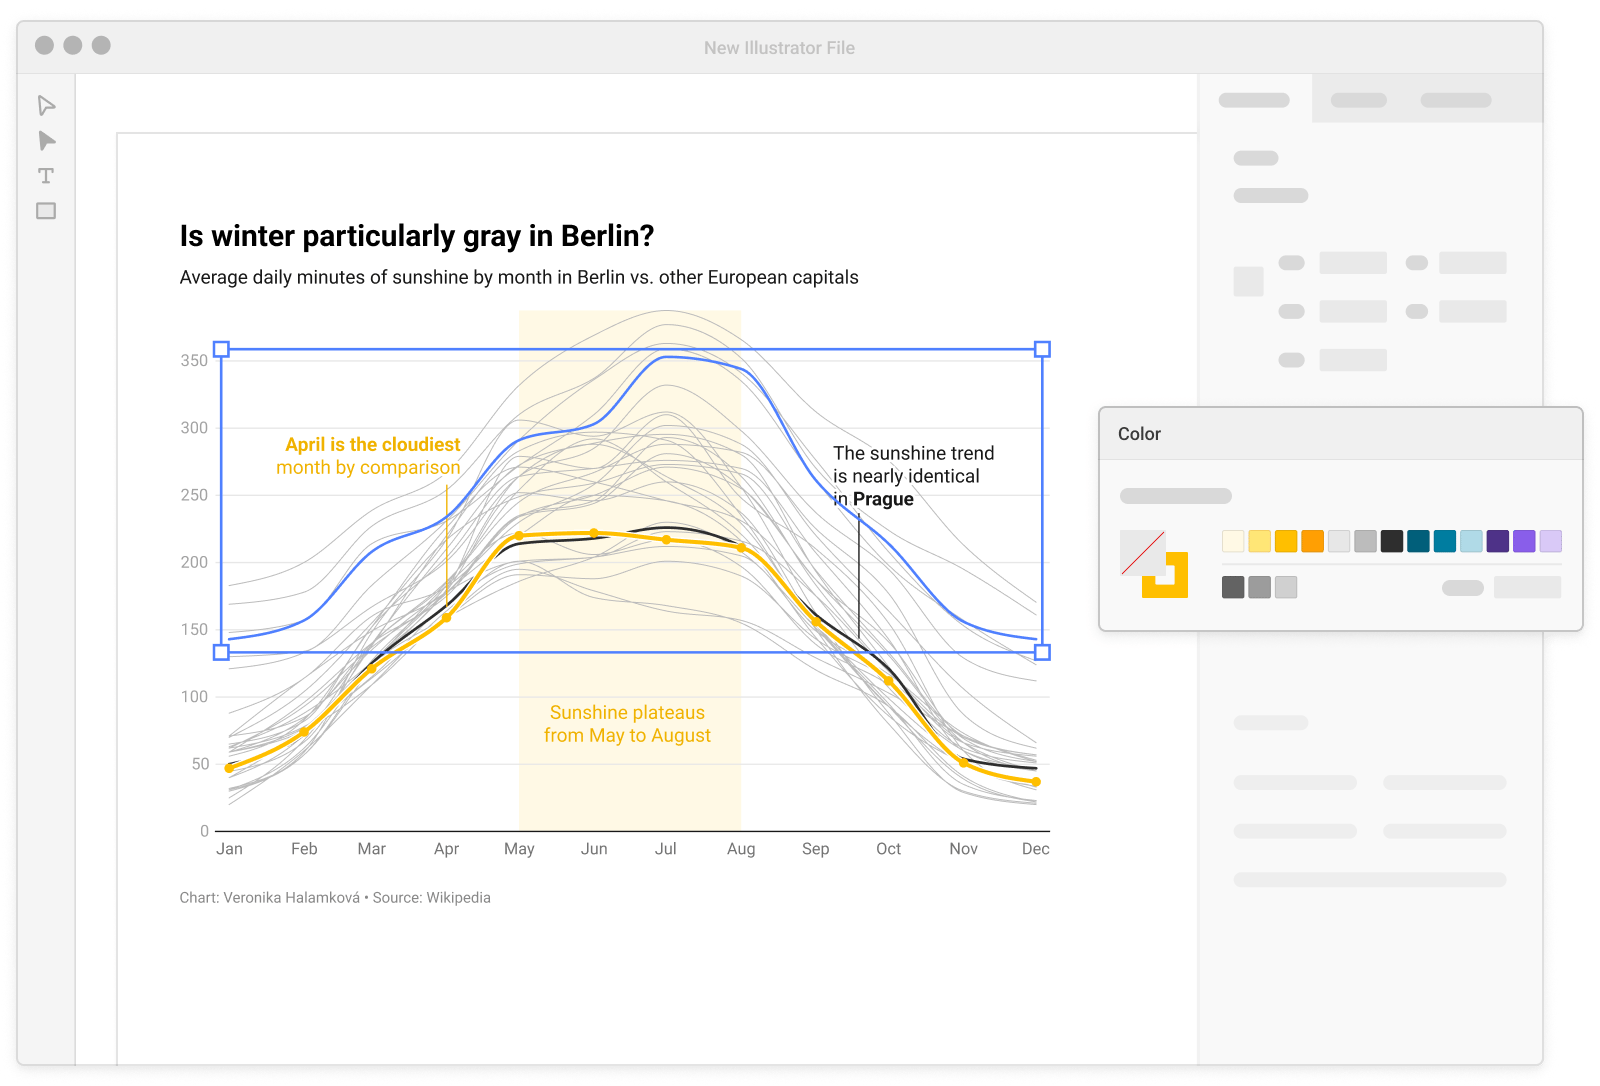
PDF and SVG export
Download your visualizations as print-ready PDFs or vector-based SVGs to edit further. Learn more
Work together seamlessly
Working in teams within Datawrapper has never been this easy.
Real-time collaboration
Work and collaborate on the same chart with multiple people at the same time.
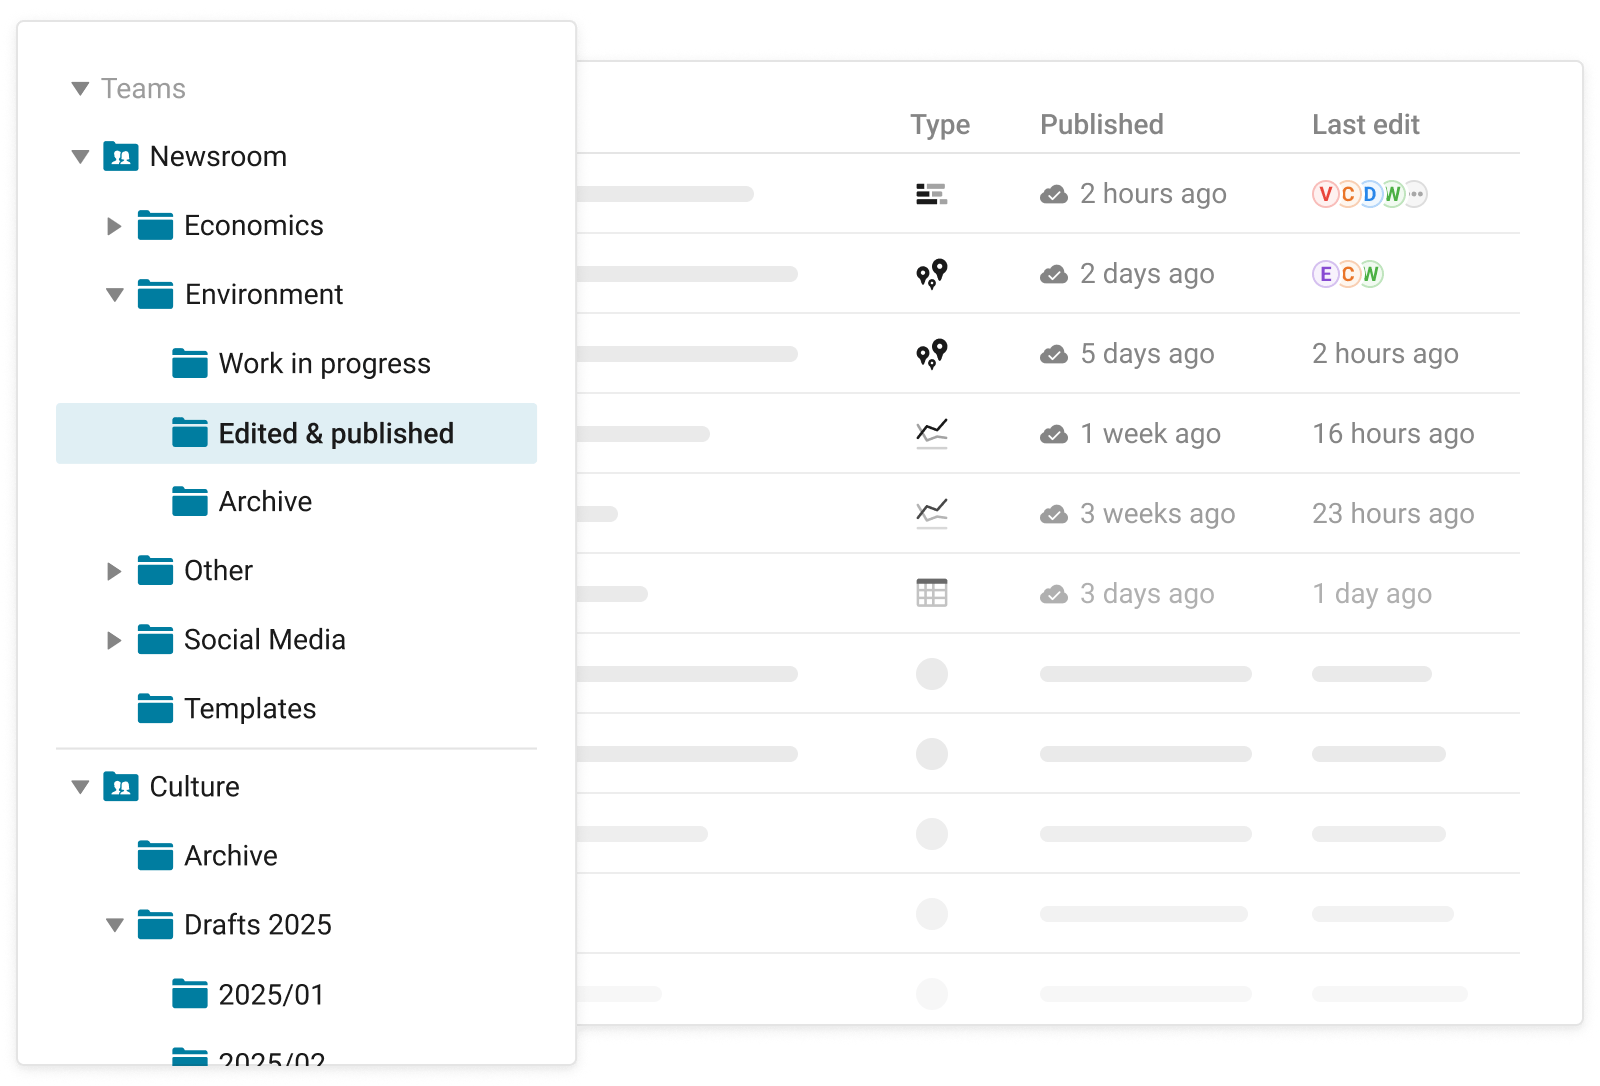
Shared archive and folders
See what others are creating as they’re creating it – keeping everyone up to speed.
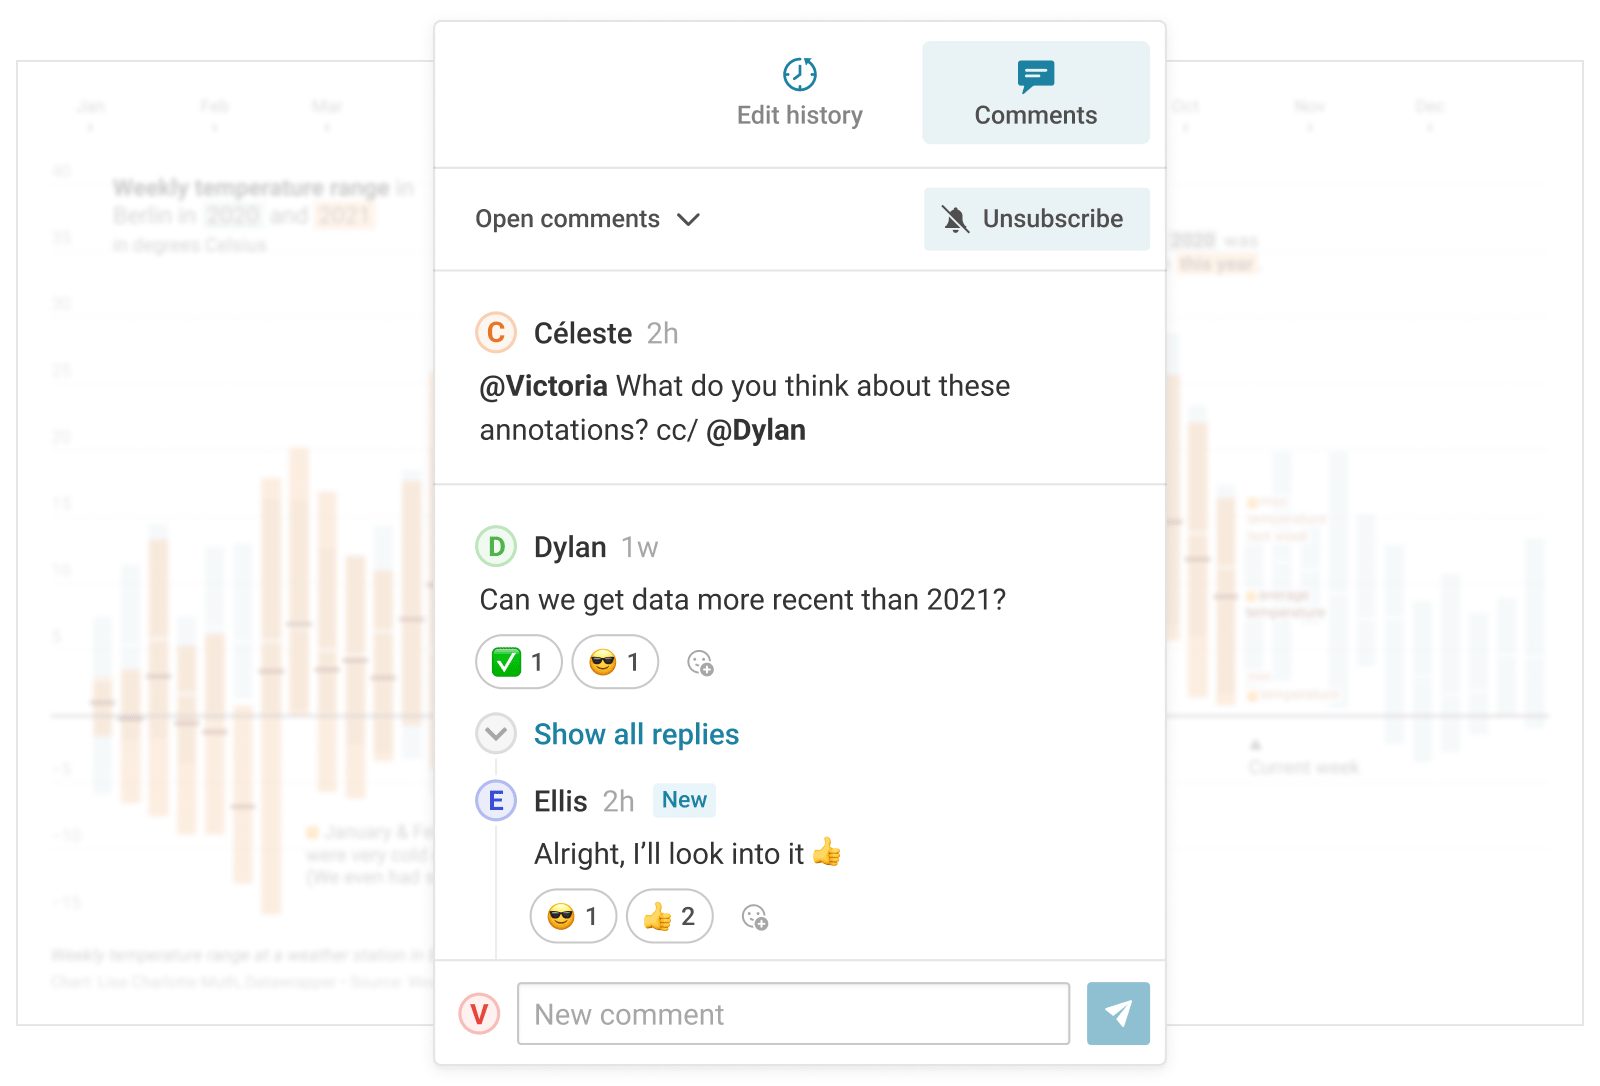
Comments and notifications
Give feedback where it matters to the people who need it, and get notified in the app and via email.
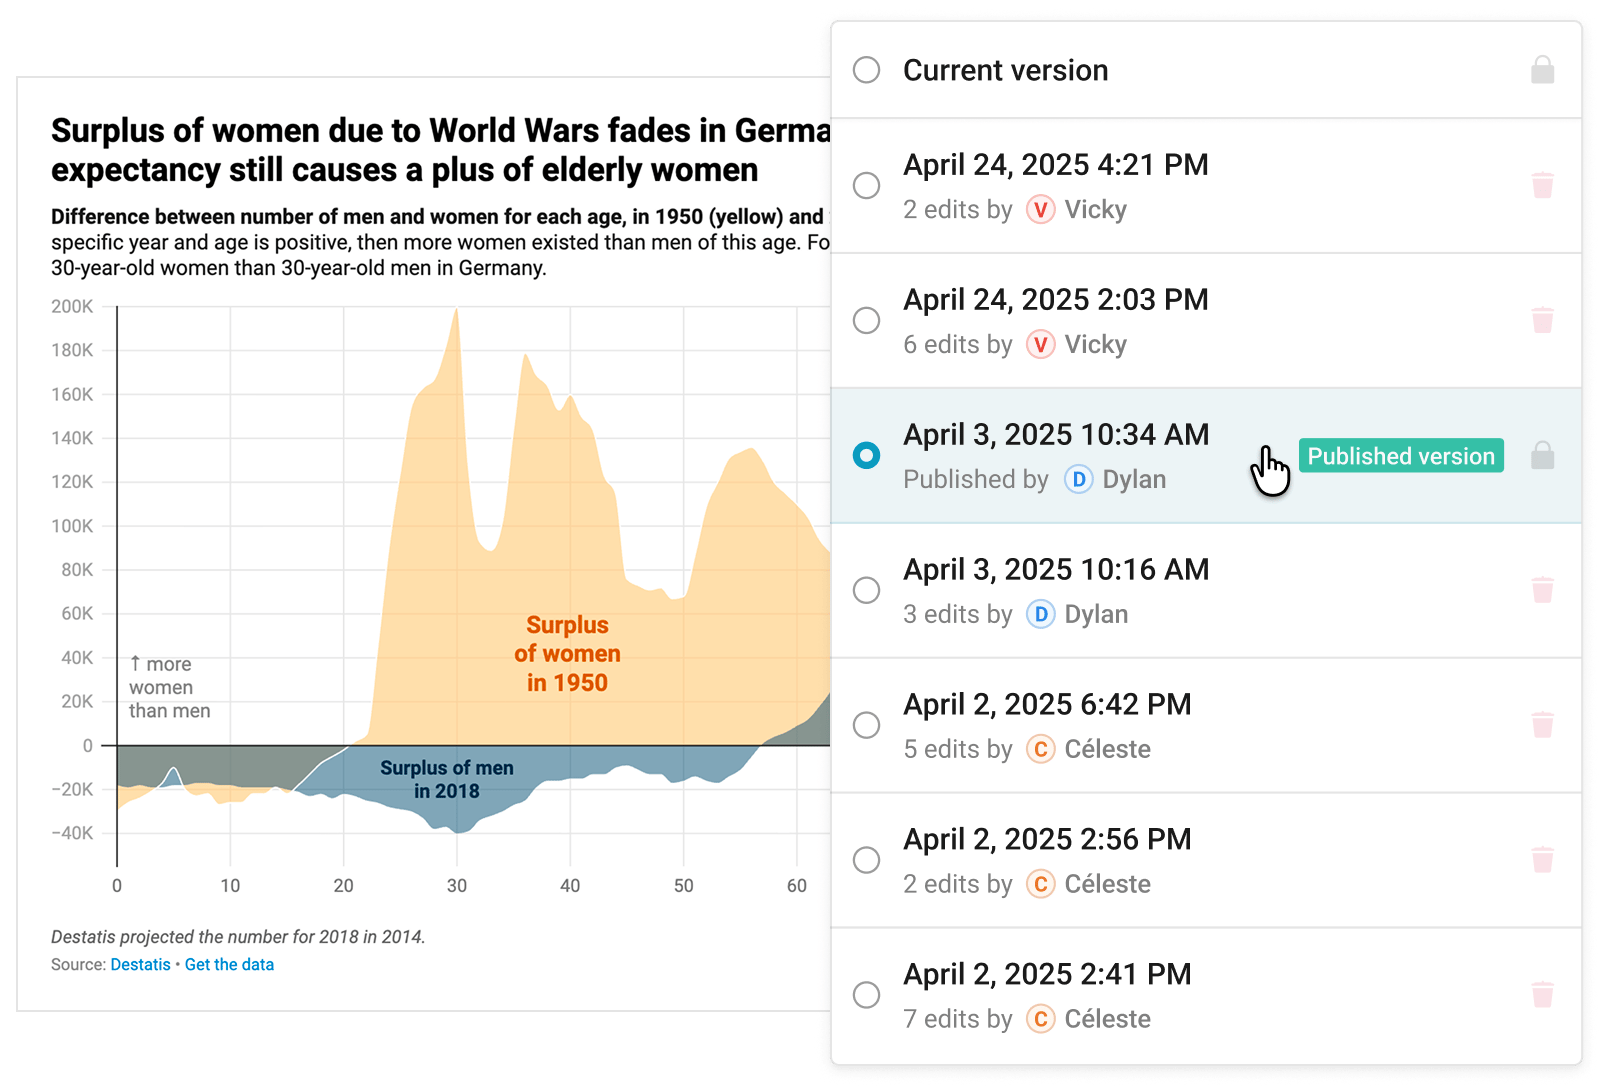
Smart versioning
Don’t worry about losing your work ever again – all your edits are safe and sound.
GDPR-compliant
Embedded Datawrapper visualizations are compliant with the strictest privacy regulations, including GDPR and CCPA.
Hosted in Europe
Datawrapper is hosted in Frankfurt and Stockholm, so all user data stays within the European Economic Area (EEA).
Tracking free
No trackers, no cookies, no third-party scripts – embed your visualizations without compromising privacy.
ISO 27001 certified
Fully certified according to the world’s best-known standard for information security management systems.
Independently audited
Yearly ISO 27001 audits and penetration tests make sure all our safety procedures are up to date.
Permission management
Manage permissions and make sure team members only see the visualizations they’re supposed to.