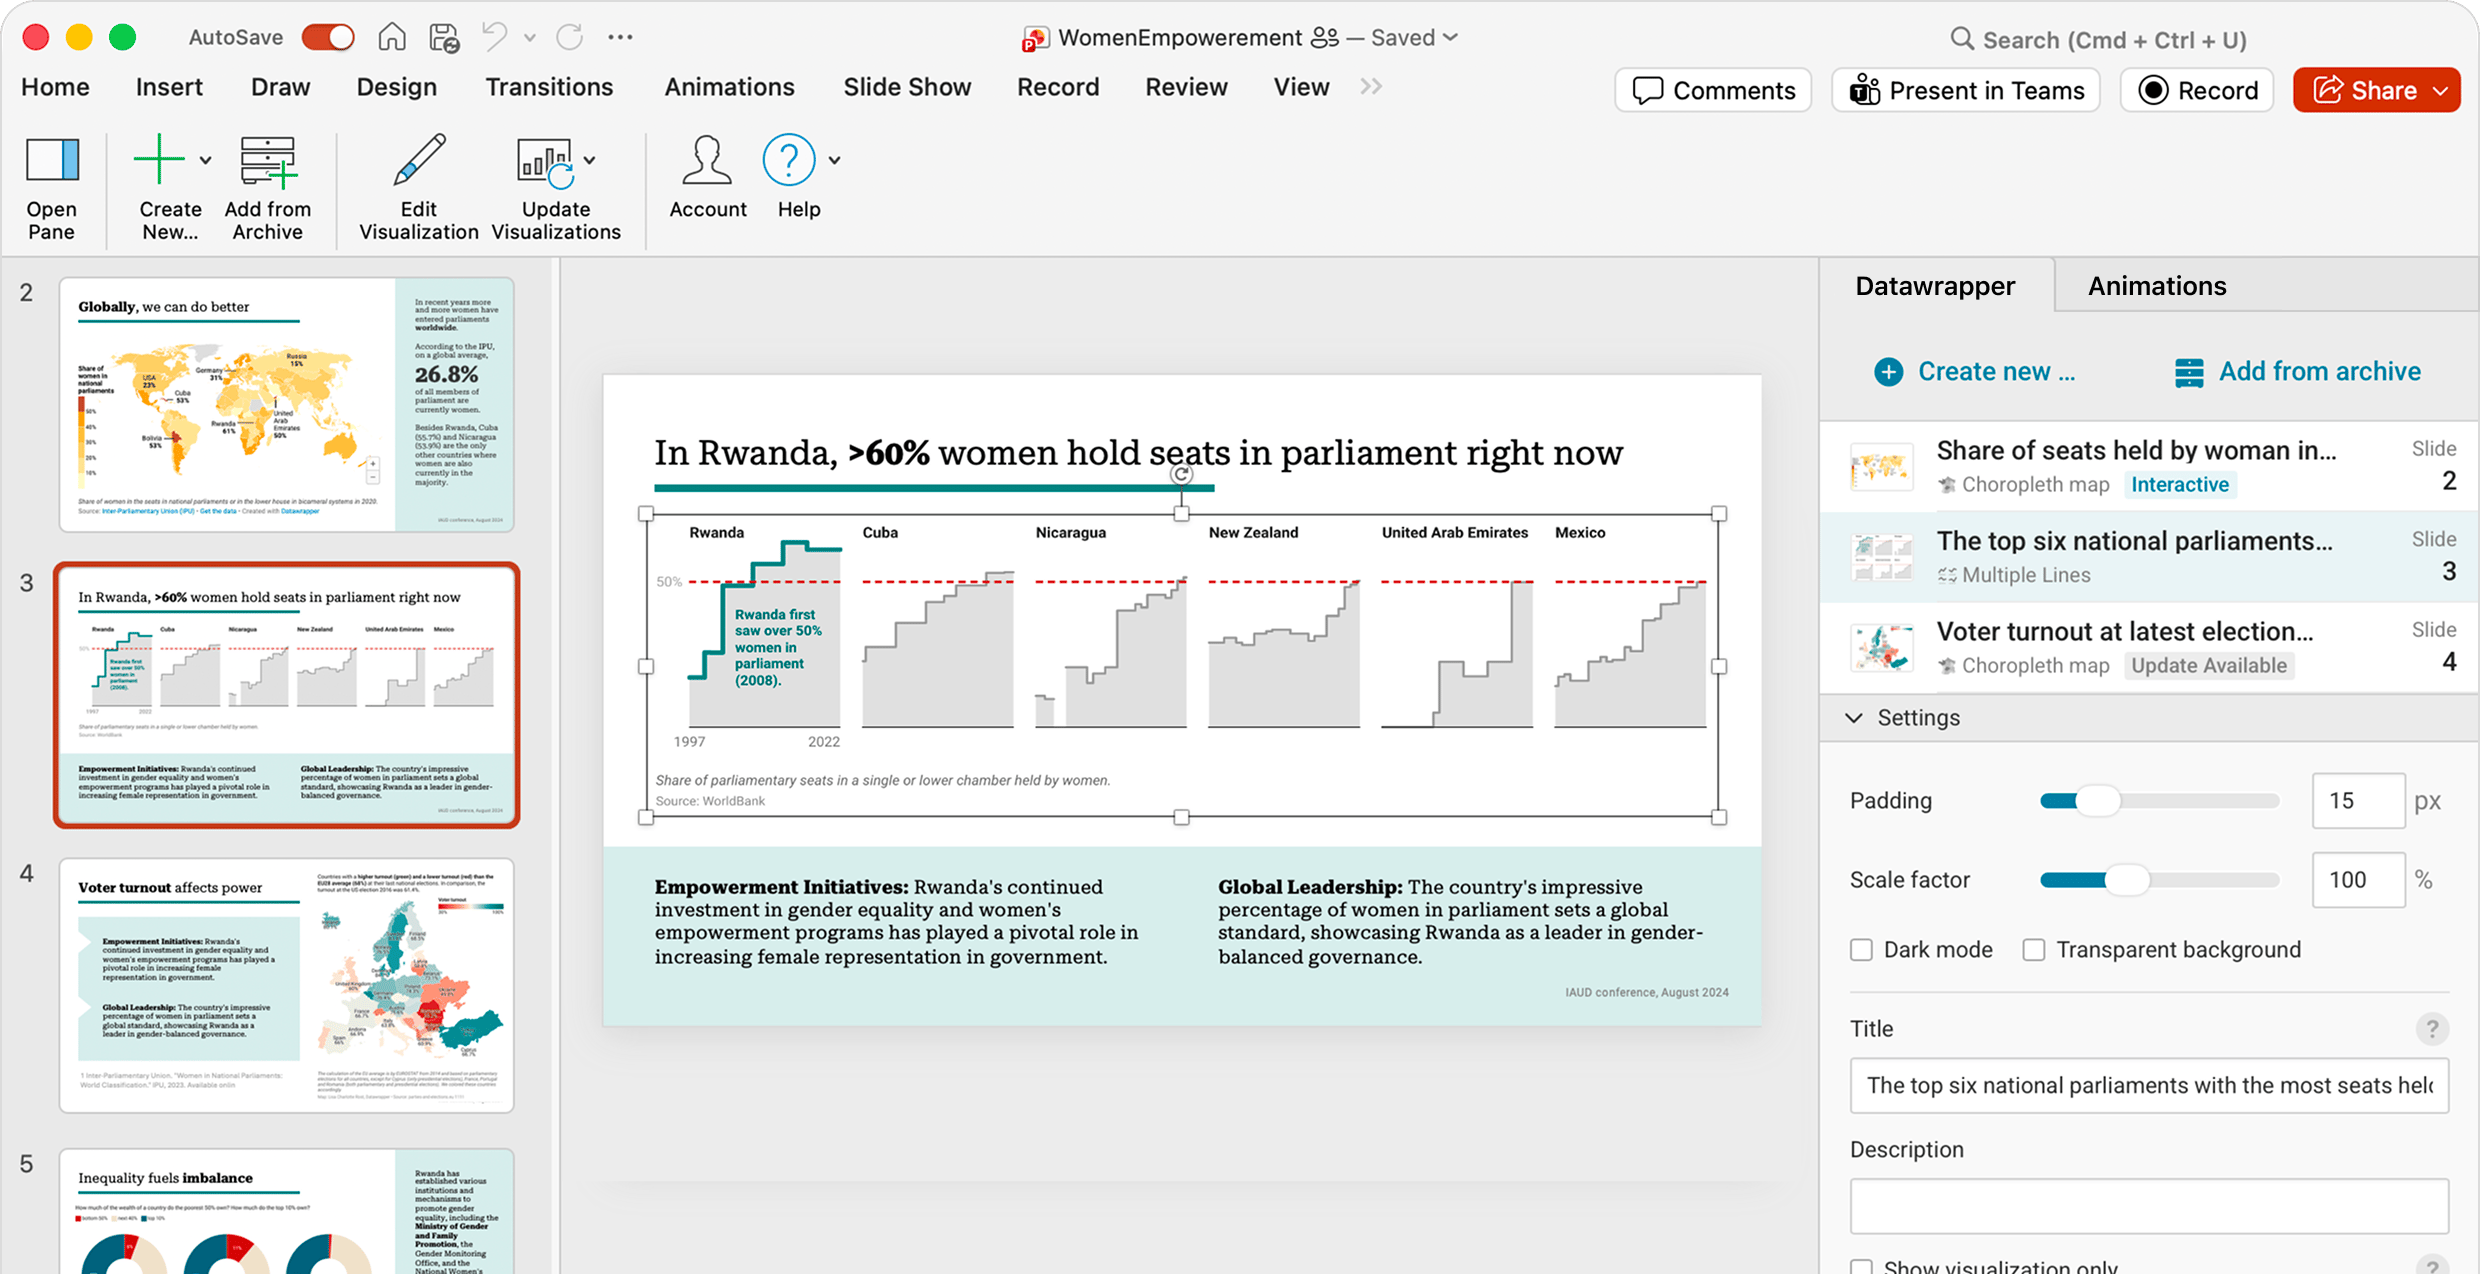
All the power of Datawrapper, directly within your presentation
With Datawrapper’s PowerPoint add-ins, you can make use of the full power of Datawrapper without ever leaving your presentation. Create, edit, and embed charts, maps, and tables directly from the task-pane, and edit them right where you need to.
Keep your slide decks up-to-date with a single click
With Datawrapper’s PowerPoint add-in, keeping your slide deck up to date is a breeze: Simply update all visualizations with a single click.
Embedded visualizations remain connected to your Datawrapper acccount, so you can easily continue to update them and collaborate with your team.
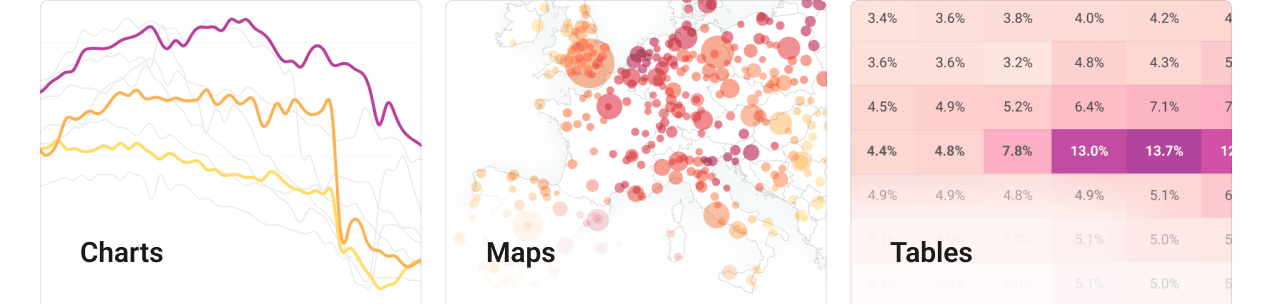
Consistency from your slide deck to your website, socials, and more
You set the style guide, we make sure your visualizations look great everywhere.
Save time by creating your visual once and embedding it in PowerPoint, your website, or download them to use in reports or on social media – all from the same graphic.