How to create a symbol map
Symbol maps are maps on which data about specific locations (e.g. cities) is represented with geometric shapes (e.g. circles).
These kinds of maps shouldn't be used if you want to show data about areas, like the population of all countries or the crime rate in all Chicago neighborhoods. Choropleth maps are the better choice for that, and we show you how to build them here. But symbol maps are ideal if you want to show the data for specific geographic locations, e.g. to show all McDonald's restaurants in the US, all UFO sightings worldwide, or the location of National Parks.
We'll show you how to create and customize a symbol map based on population data for the biggest US cities:

Choosing a map
To create a new symbol map, click on Create new ❶ > Map ❷ at the top of the Datawrapper app, or go directly here: app.datawrapper.de/create/map and click on Symbol map ❸:
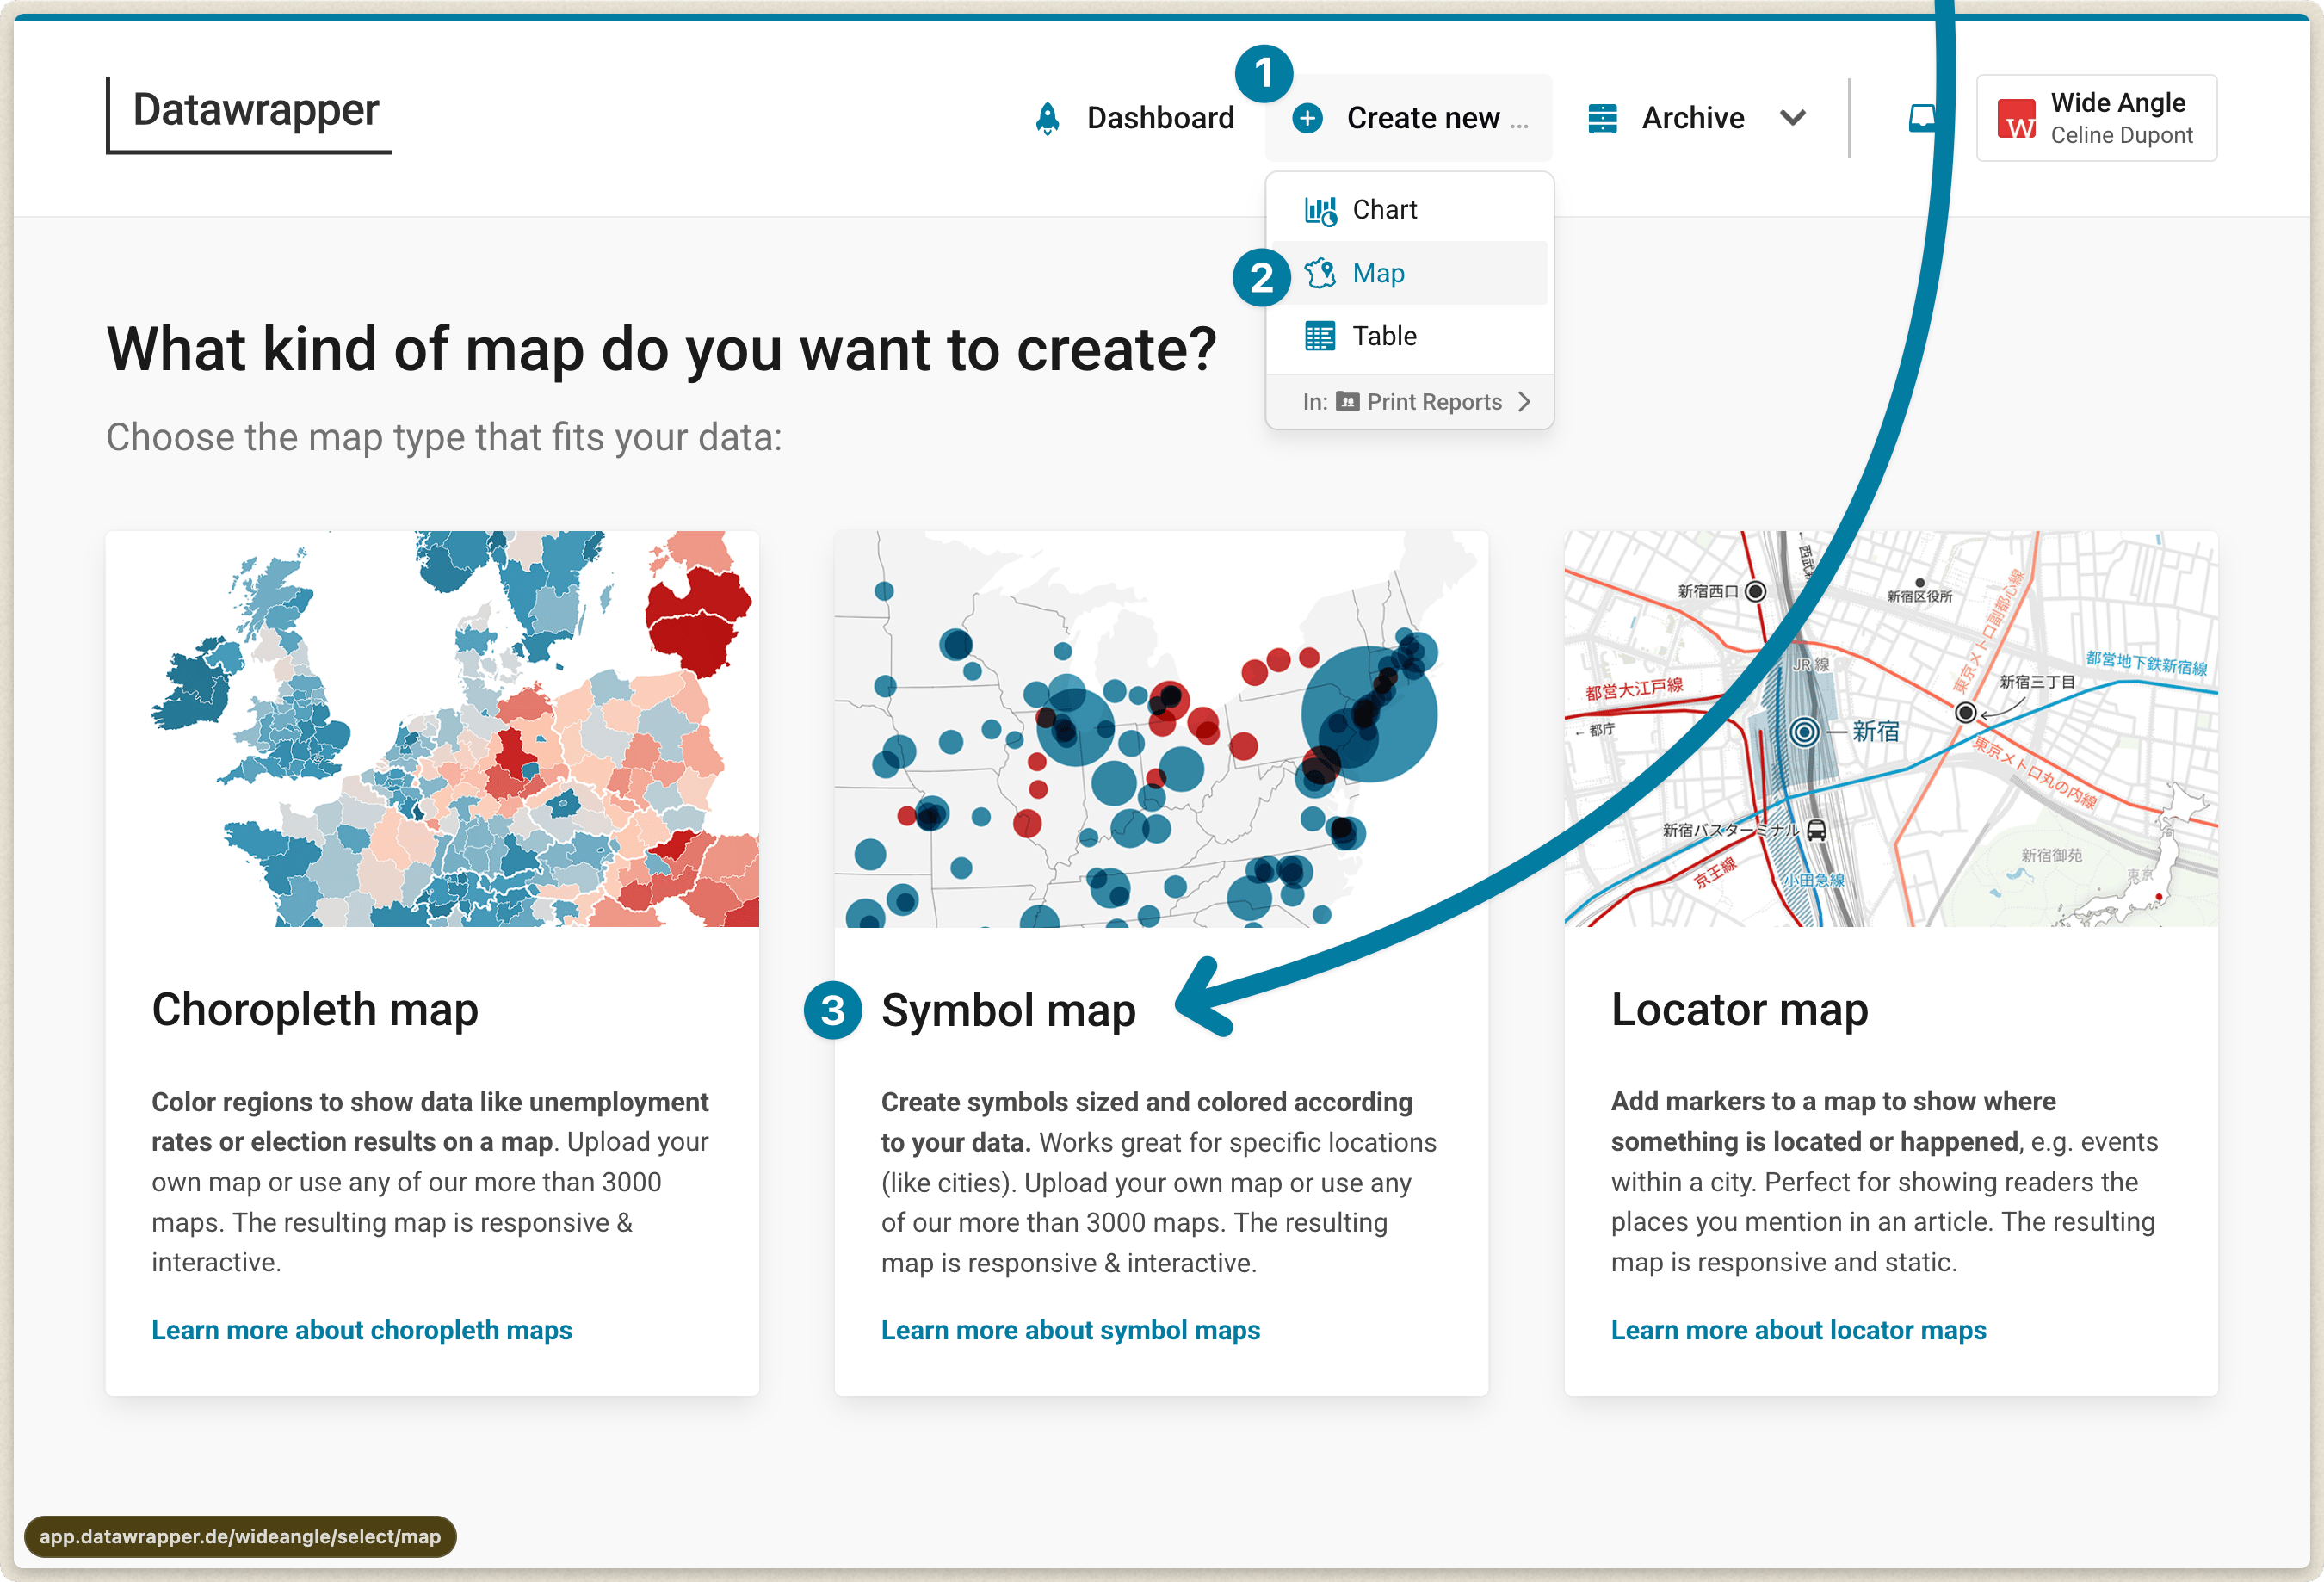
The first thing your symbol map needs is a basemap.
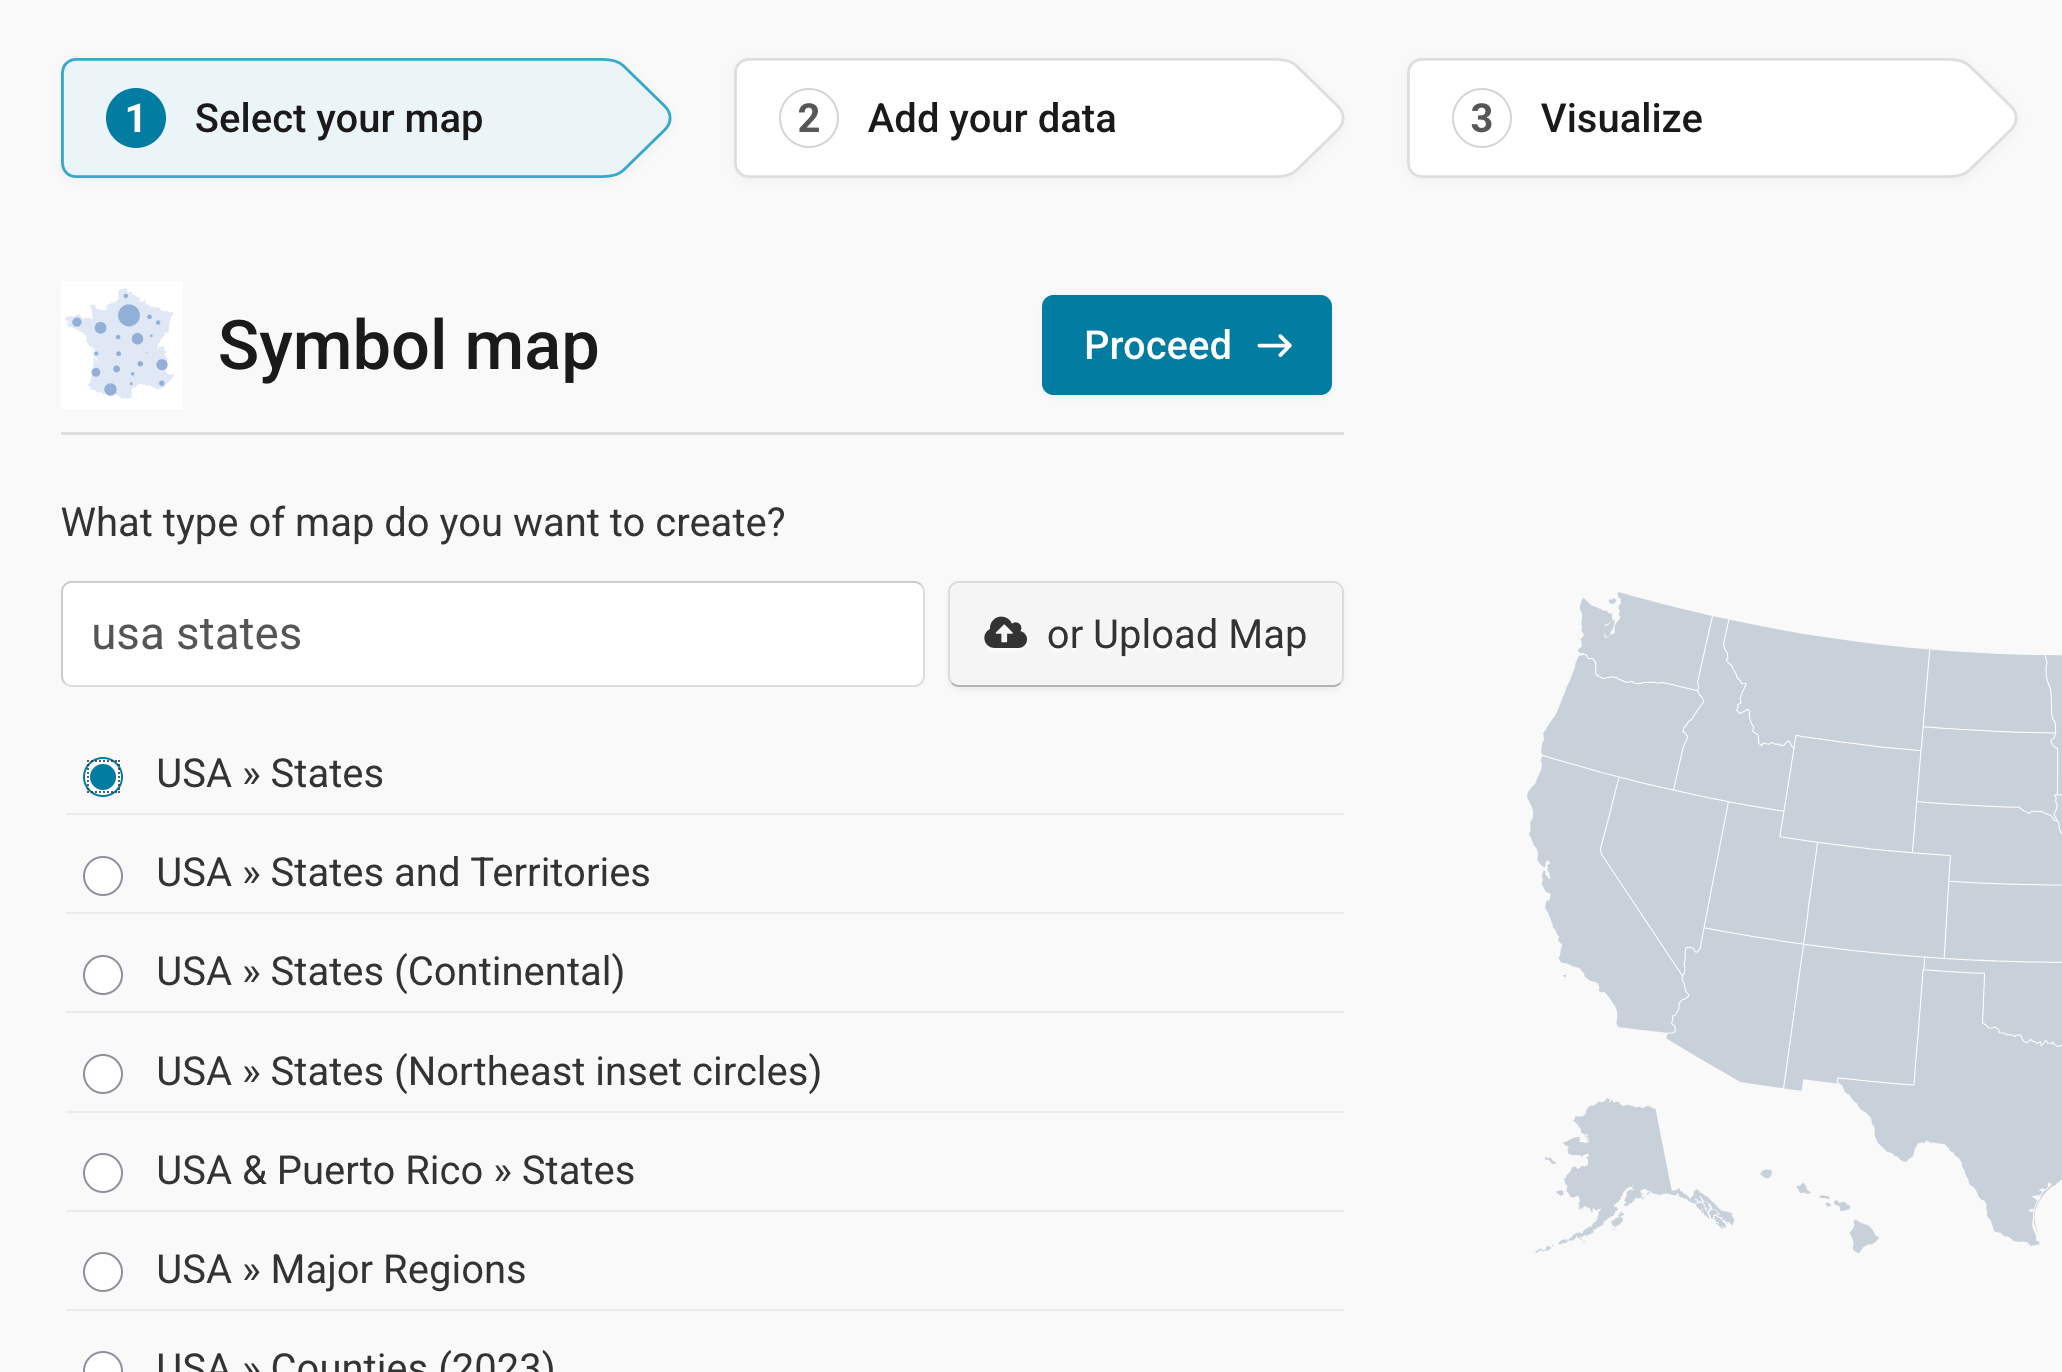
Even if you know that you want a US map, you can still decide between different levels, e.g. states, counties, district courts, or congressional districts.
We want a US state map as a background for our population circles to give the reader some orientation. So we'll search for "USA", click on USA » States and then click Next. Learn here how to upload your own map.
Preparing your data
Before we can visualize the population numbers, we need to bring them into the right format. Datawrapper needs addresses or latitudes/longitudes to know where you want your points to be. You have two options here:
1st option: Using addresses
For our map of US cities, the city names will serve as addresses, together with the state, since many US city names exist more than once (there's a Columbus in Ohio and one in Georgia, for example). Datawrapper will map them automatically. This is called "geocoding." Learn more about how to make sure Datawrapper geo-codes your addresses correctly.
If you want to represent data with the size or color of circles (or other geometric shapes), you also need to prepare a column with data values. On our map, the size of the circles is determined by population numbers, and the color of the circles represents the change since 2020. So we need at least two more columns for population and change. Our table looks like this now:
| City | State | Population 2025 | Change since 2020 (%) |
| New York | NY | 8584629 | -2.49 |
| Los Angeles | CA | 3869089 | -0.76 |
| Chicago | IL | 2731585 | -0.54 |
| etc. | etc. | etc. | etc. |
2nd option: Using coordinates
You can also import latitudes and longitudes. Datawrapper accepts decimal coordinates (e.g. 40.6635, -73.9387 instead of 40° 39′ 48.6″ N, 73° 56′ 19.32″ W for New York City). You will need one column for latitudes and one column for longitudes. That's what our data looks like when we add the two columns:
| Latitude | Longitude | City | State | Population 2025 | Change since 2020 (%) |
| 40.66 | -73.94 | New York | NY | 8584629 | -2.49 |
| 34.02 | -118.41 | Los Angeles | CA | 3869089 | -0.76 |
| 41.84 | -87.68 | Chicago | IL | 2731585 | -0.54 |
| etc. | etc. | etc. | etc. | etc. | etc. |
Why should you upload latitudes and longitudes when Datawrapper can just transform our city names into points on the map? Because the names of cities (or any other places) might exist more than once or might be written differently in different languages.
For example, there are multiple Vancouvers around the globe. If you give a geocoder (like Google Maps or Datawrapper) "Vancouver" as an address, it will assume that you mean the biggest Vancouver, which happens to be in Canada. But the "Vancouver" in our table actually refers to the Vancouver in Washington state. When using city names as addresses, Datawrapper will map Vancouver in Canada. When using latitudes and longitudes, our Vancouver appears (correctly) in Washington. With latitudes and longitudes, you can be sure that Datawrapper maps the exact points you want to appear on your map. Learn more about how to make sure Datawrapper geo-codes your addresses correctly.
Adding your data
Uploading your data
You've prepared your data? Great! In step 2: Add your data, there are four ways to import your table with names/IDs and values:
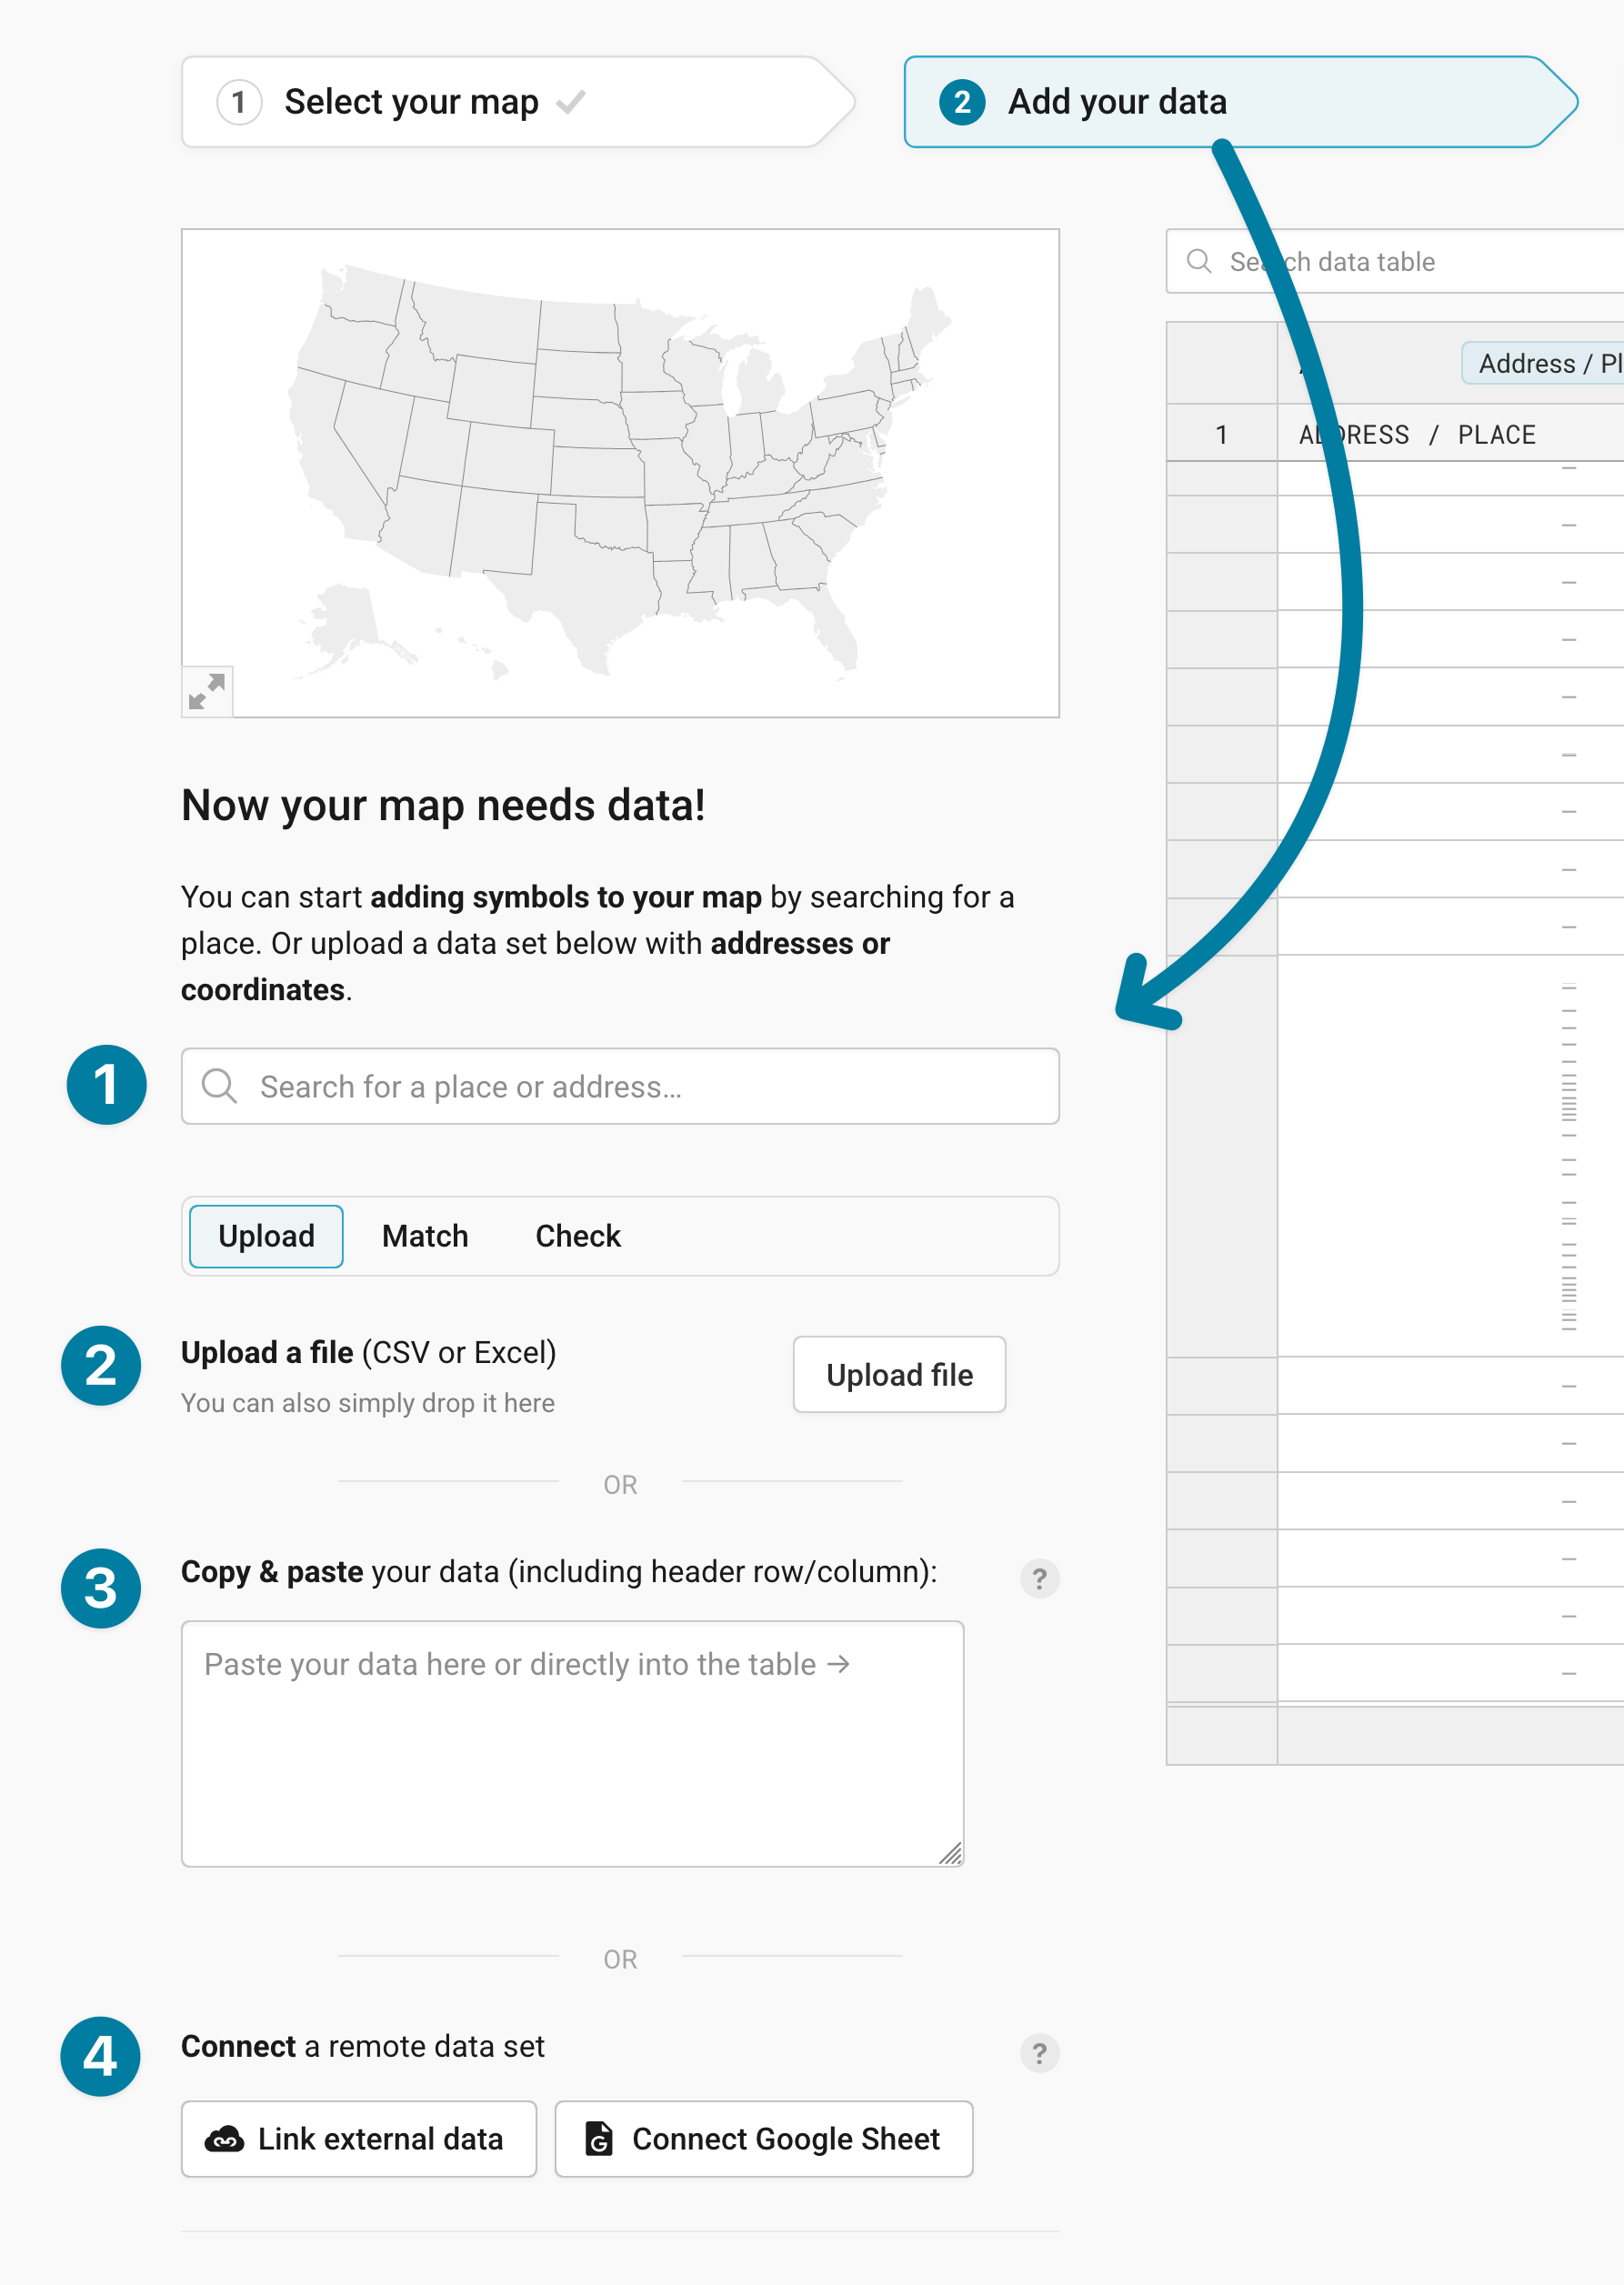
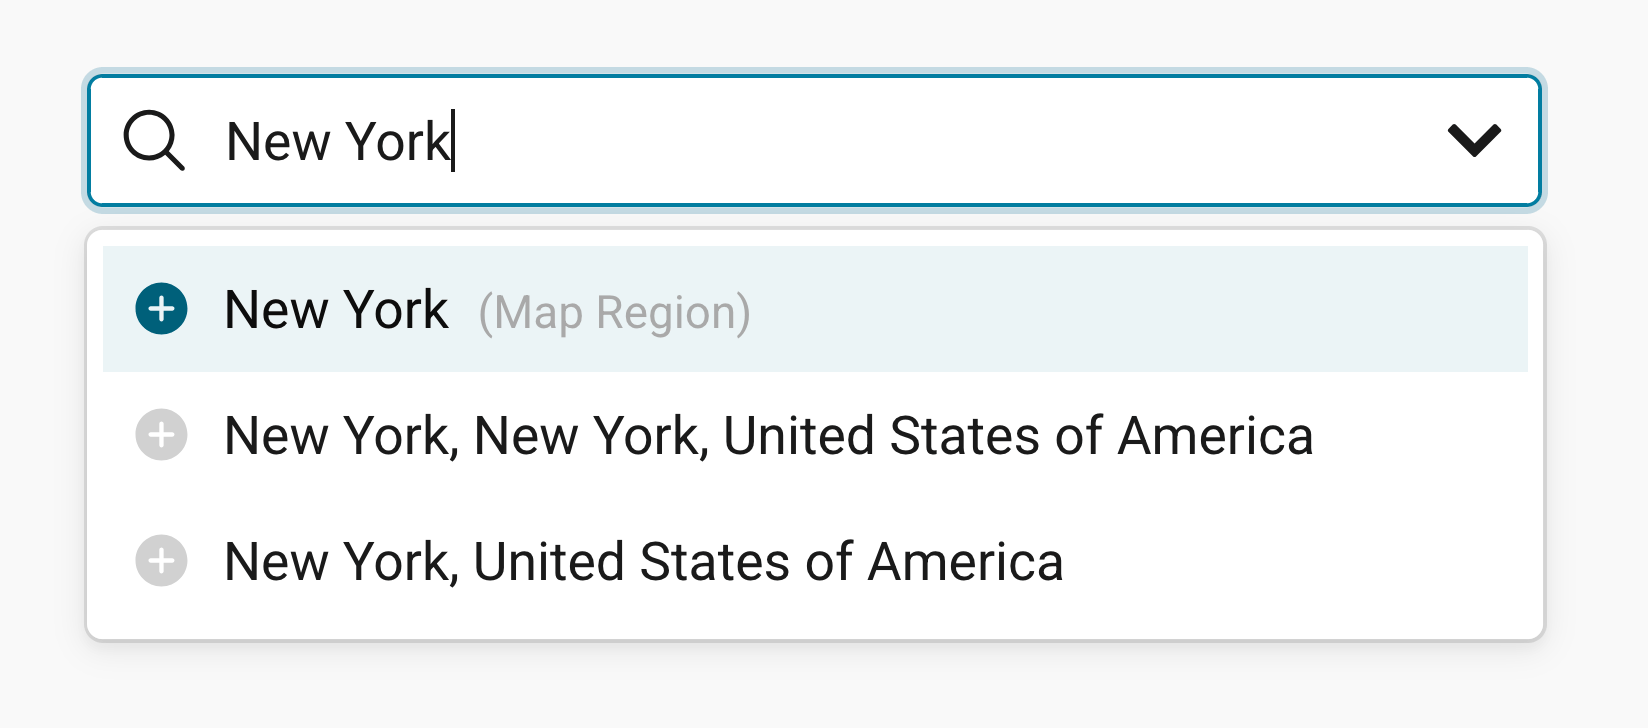
❶ Search for a specific location. This can be tedious if you have dozens of locations, so this works best for maps with only a few symbols.
❷ Upload a CSV or Excel file. To do so, click on Upload file.
❸ Copy & paste your data from a spreadsheet. For example, from Excel or Google Sheets. This is the most convenient option for lots of our users.
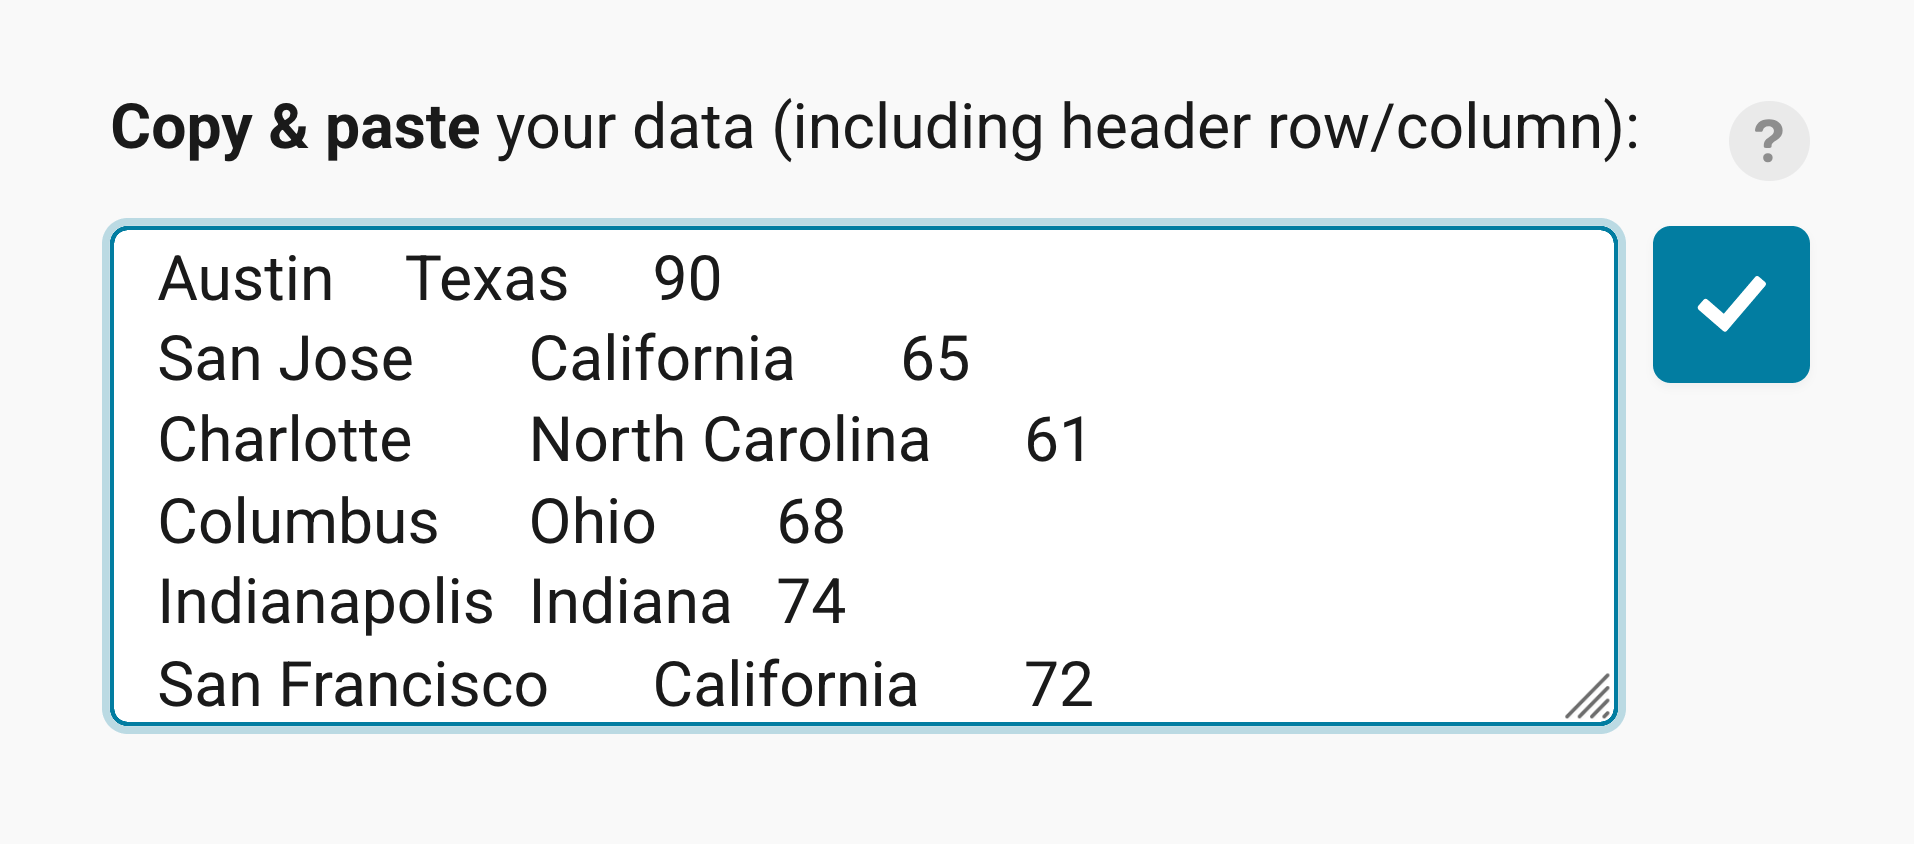
❹ Connect a remote data set. You have two options:
- Link external data. That's the best option if your data keeps updating (e.g. election results during election night), and you want your embedded map to always show the latest numbers. Learn more about creating live-updating symbol maps.
- Connect Google Sheet. That's a good option if you or a coworker is changing the data by hand a lot and you want to make sure that your map shows the latest numbers when visualizing it.
Matching your data
Once you upload your data, the next step is to match your data with the map in the Match tab.
If your dataset contains addresses, click on Find coordinates for places, select the column with your addresses, and click on Generate coordinates. Datawrapper will then create Lat and Lon columns from these addresses.
If you tick Automatically find coordinates when place is changed (below Get all coordinates on the left), Datawrapper updates the coordinates whenever you edit an address in your table.
Below that, you can select the correct columns for the latitude and longitude if your dataset contains coordinates.
You can also check whether the correct columns are selected by looking at the column headers ❶:
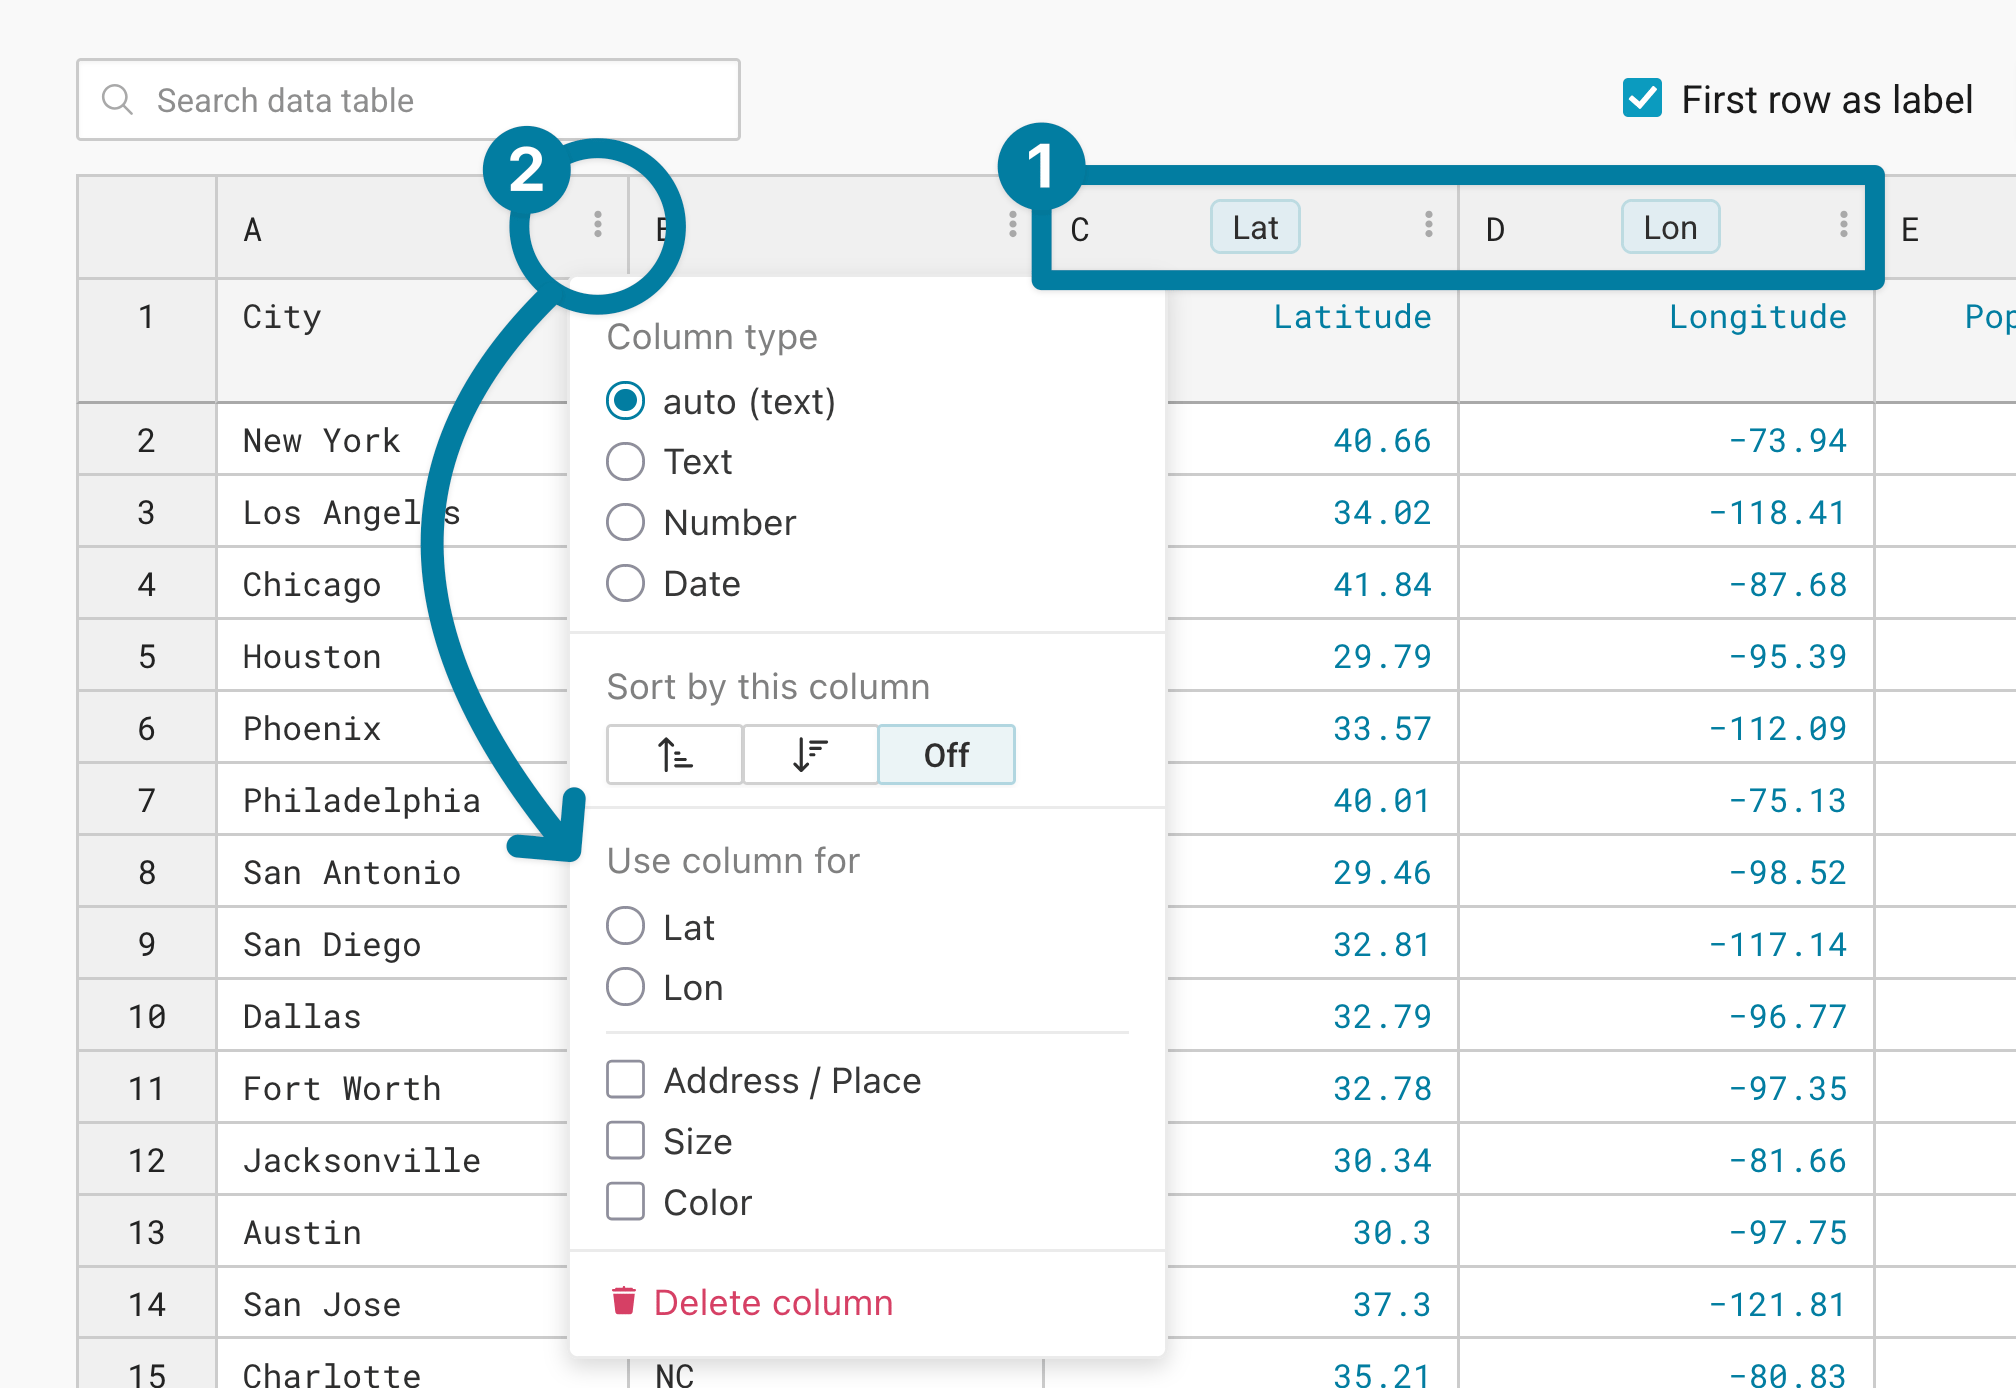
If you click on the three dots in a header, you can also select it to be used for lat or lon, or even for the symbol size and the symbol color. You can change both later in step 3: Visualize. For now, make sure that Datawrapper shows your symbols at the right position.
Checking your data
If there are any errors in the data, you can check and correct them in the Check tab:
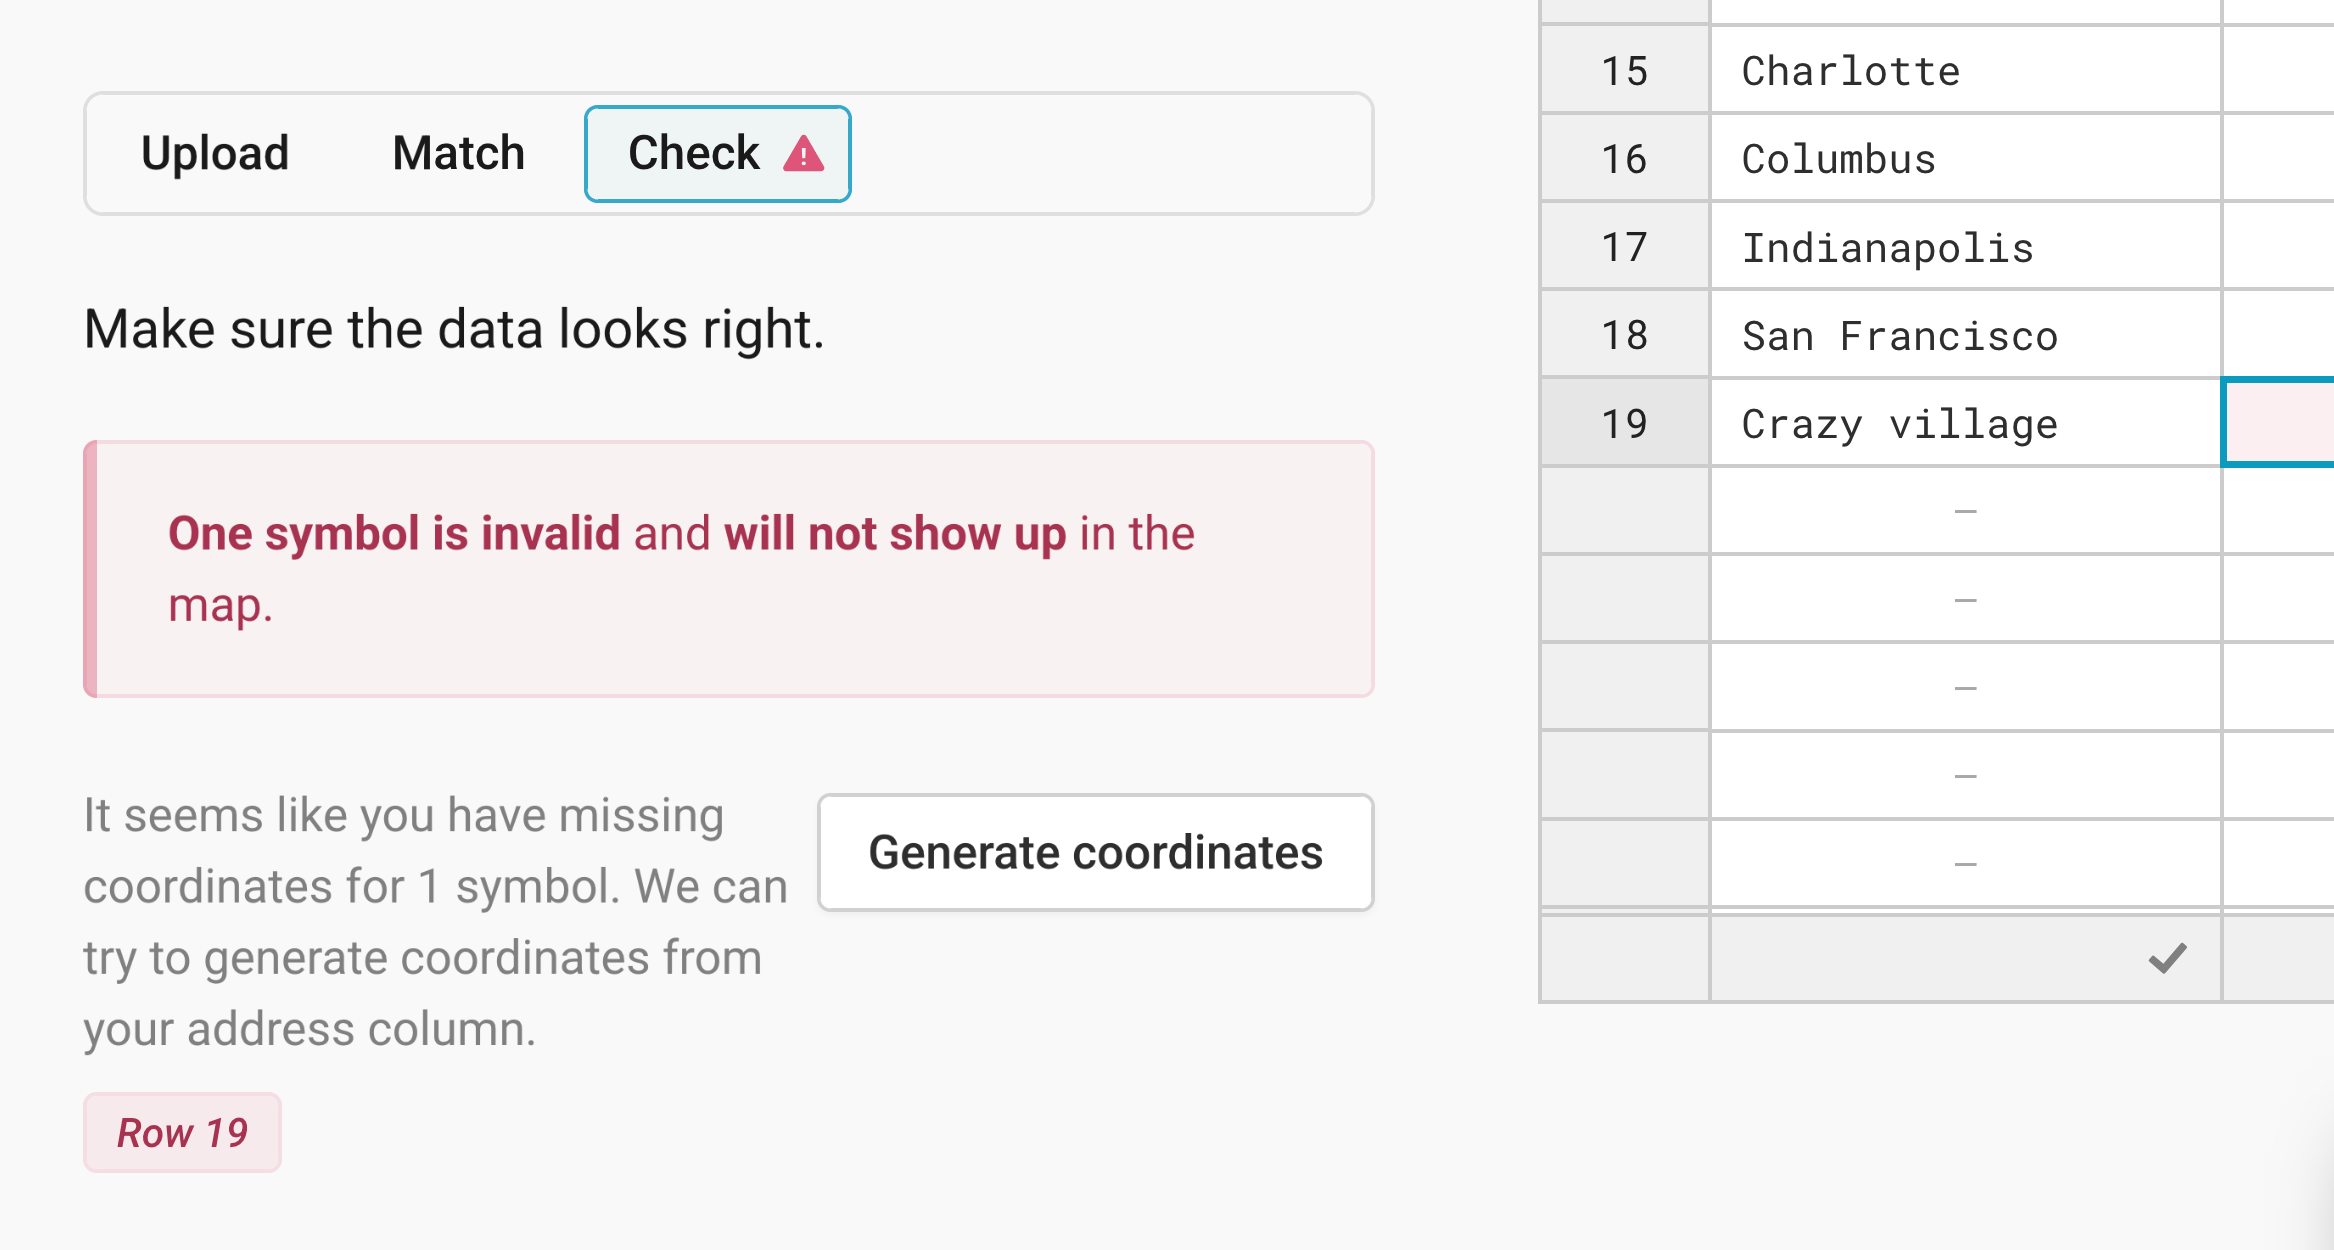
Click on the missing/wrong value, and the table will jump to where you can fix it.
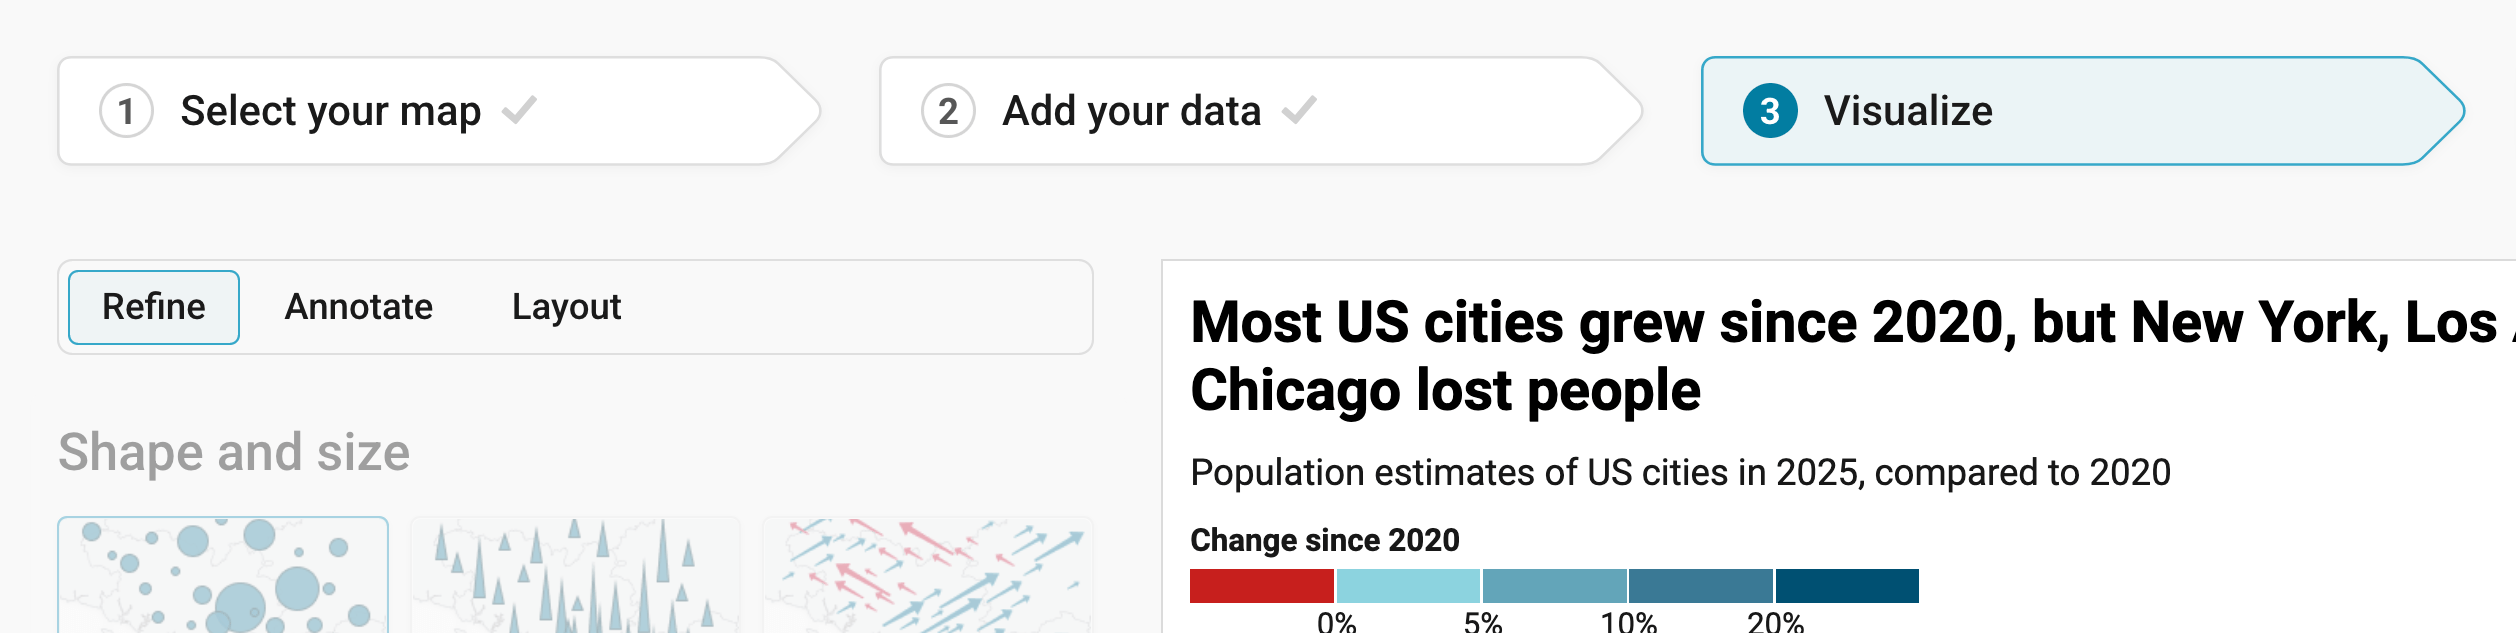
If you successfully imported and matched the data, click on Proceed to go to step 3: Visualize. Here, you'll notice three tabs: Refine, Annotate, and Layout:
Resizing
In any tab of step 3: Visualize, you can click, hold, and drag the arrow in the lower right corner to scale the map window or manually determine the dimensions of the map by entering values in the boxes below the chart (Size).
We recommend checking what the map looks like on different screen sizes multiple times while designing it, by clicking on the little icons (mobile, tablet, and computer) below the map.
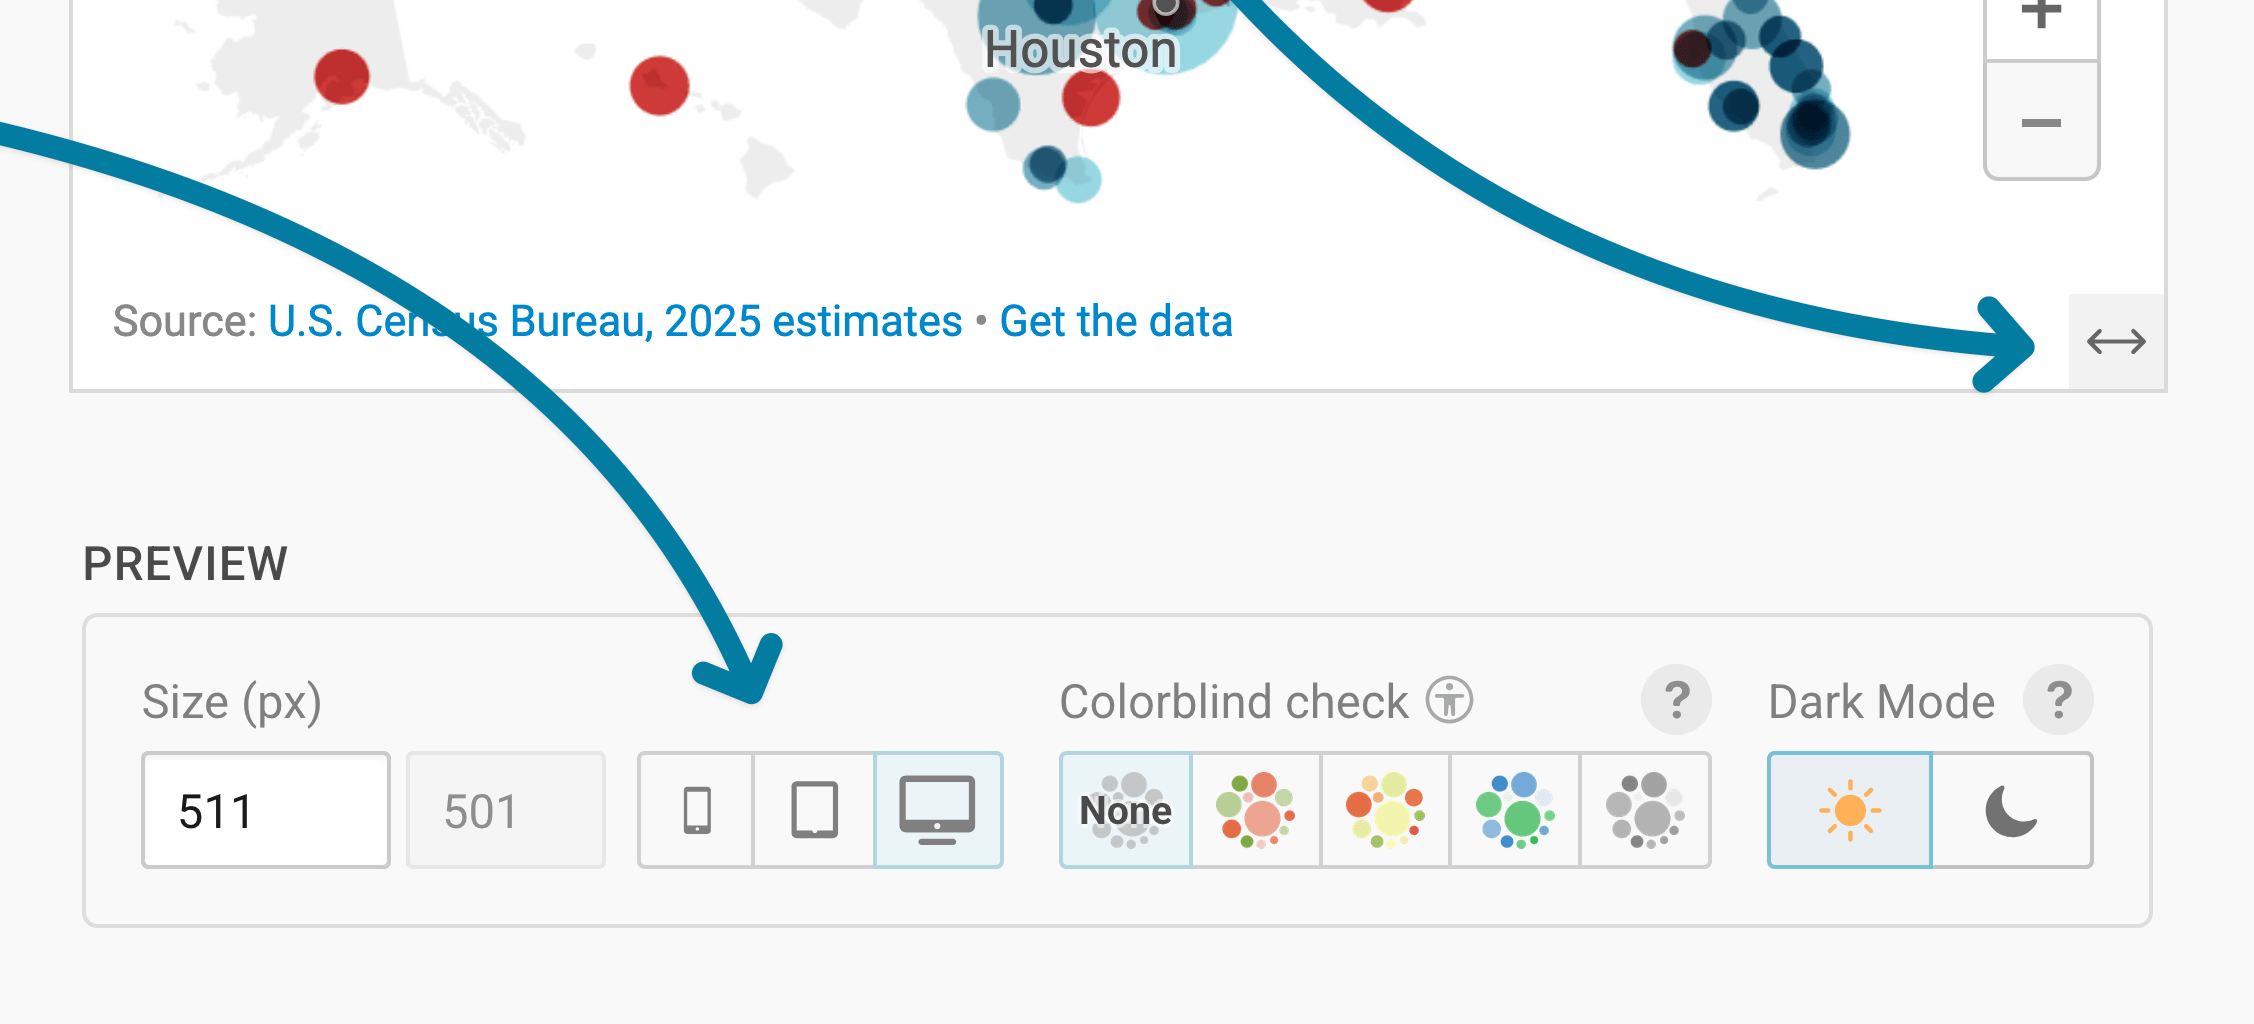
Learn more about changing the width and height of your map.
Refining your map
Let's continue with the Refine tab. Here, we see five panels: Shape and size, Color, Legend, Map extras, and Appearance.
Choosing shape and size
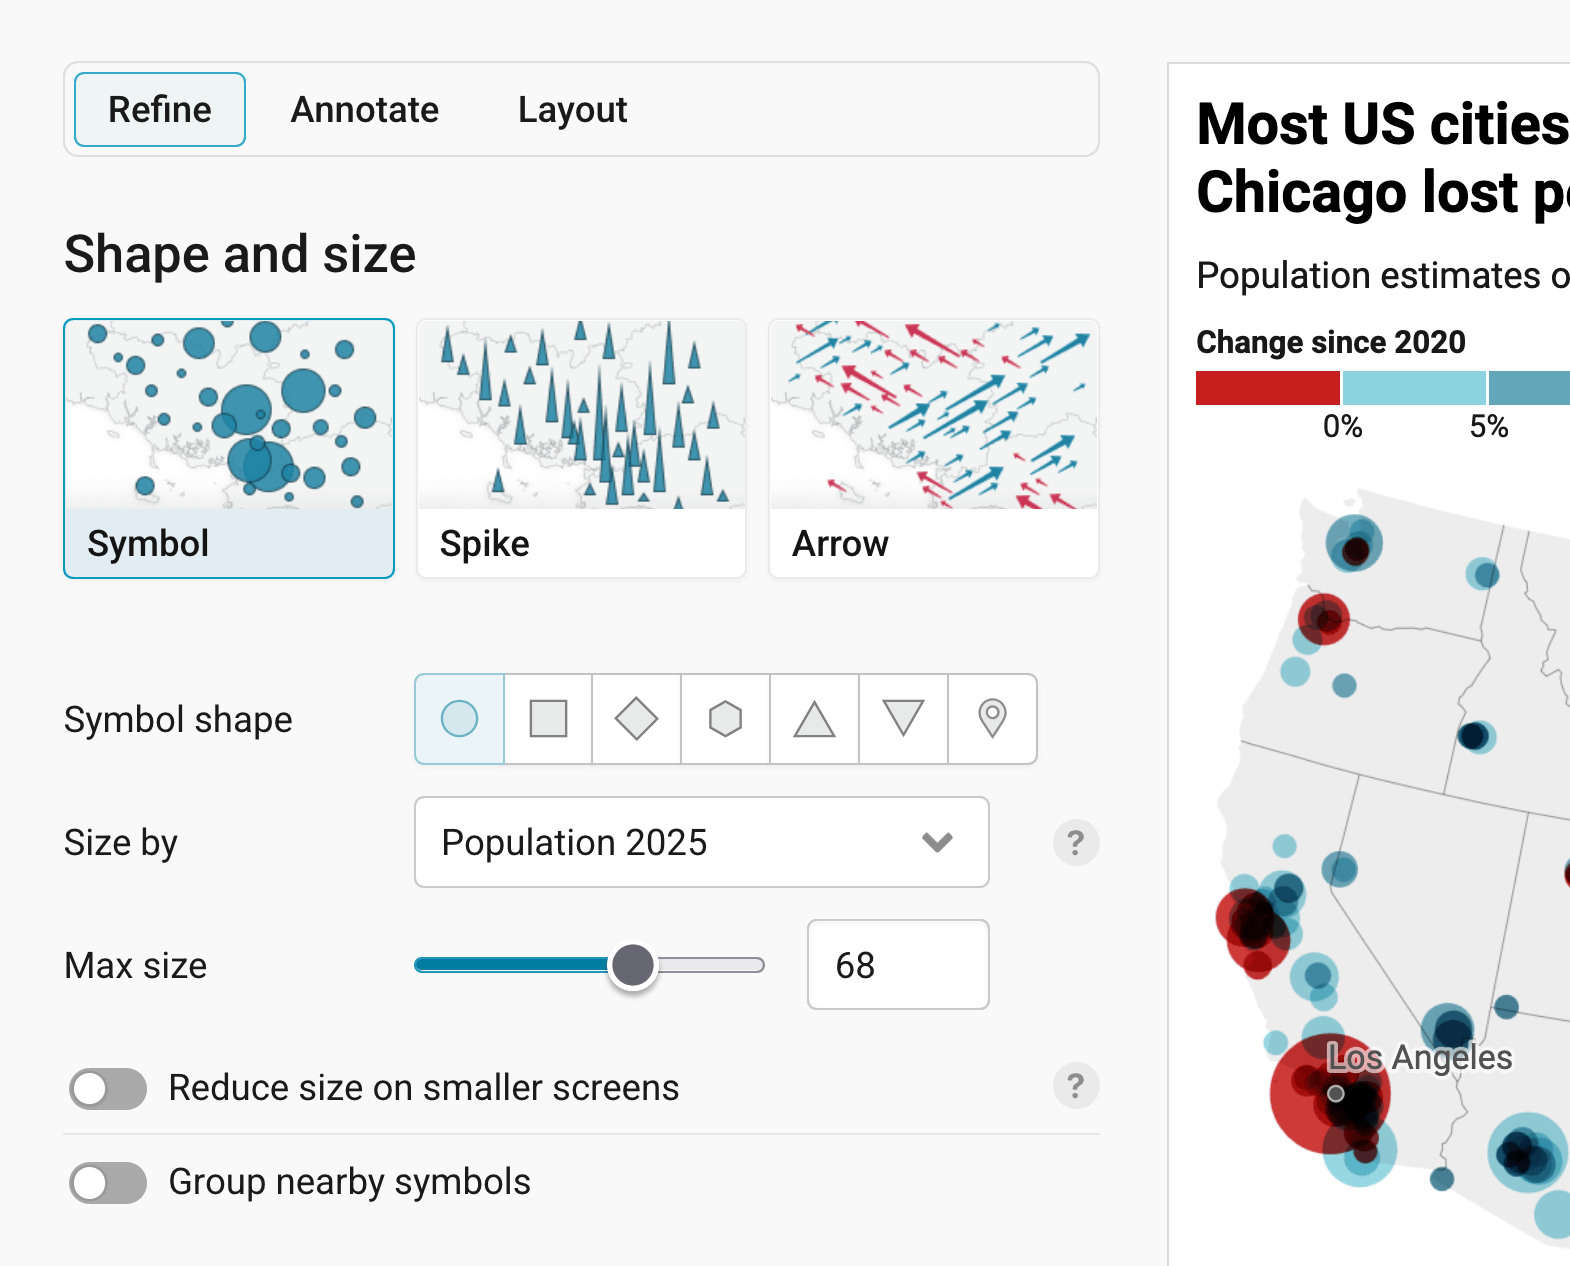
In the first panel, your first action is to choose that you want to create a Symbol map, not a Spike map or Arrow map. Then you have four options:
- Symbol shape: Here you can decide which geometric shape your symbol should have. Circles are the default, as they are used in most symbol maps and are easy to read. Squares, diamonds, and hexagons are great options for clustering, as we'll see later. Triangles (up and down) can be used to show a development (e.g. a city with a shrinking population). And markers are especially great if you don't choose a column for "size"; meaning if all your symbols are exactly the same size.
- Size by: Select which numeric column should define the size of your symbols. For our map, we use the column "Population 2025". If your symbols should all have the same size, select
--from the dropdown menu. - Max size: Decide how large the symbols should appear. You can try around a bit to find a good solution: Too small, and it's hard to see them. Too big, and they're overlapping each other too much. Check your map on mobile screens with the preview options below the chart to decide if you want to Reduce size on smaller screens.
Choosing the last option, Group nearby symbols, will cluster your symbols together. That's helpful if you have a lot of smaller symbols and it's important to see for your readers how many they are in an area.
Changing the colors
The next panel lets you define which colors your symbols should have. By default, they're all in the same color. You can change this color by clicking on the swatch next to Symbol color.
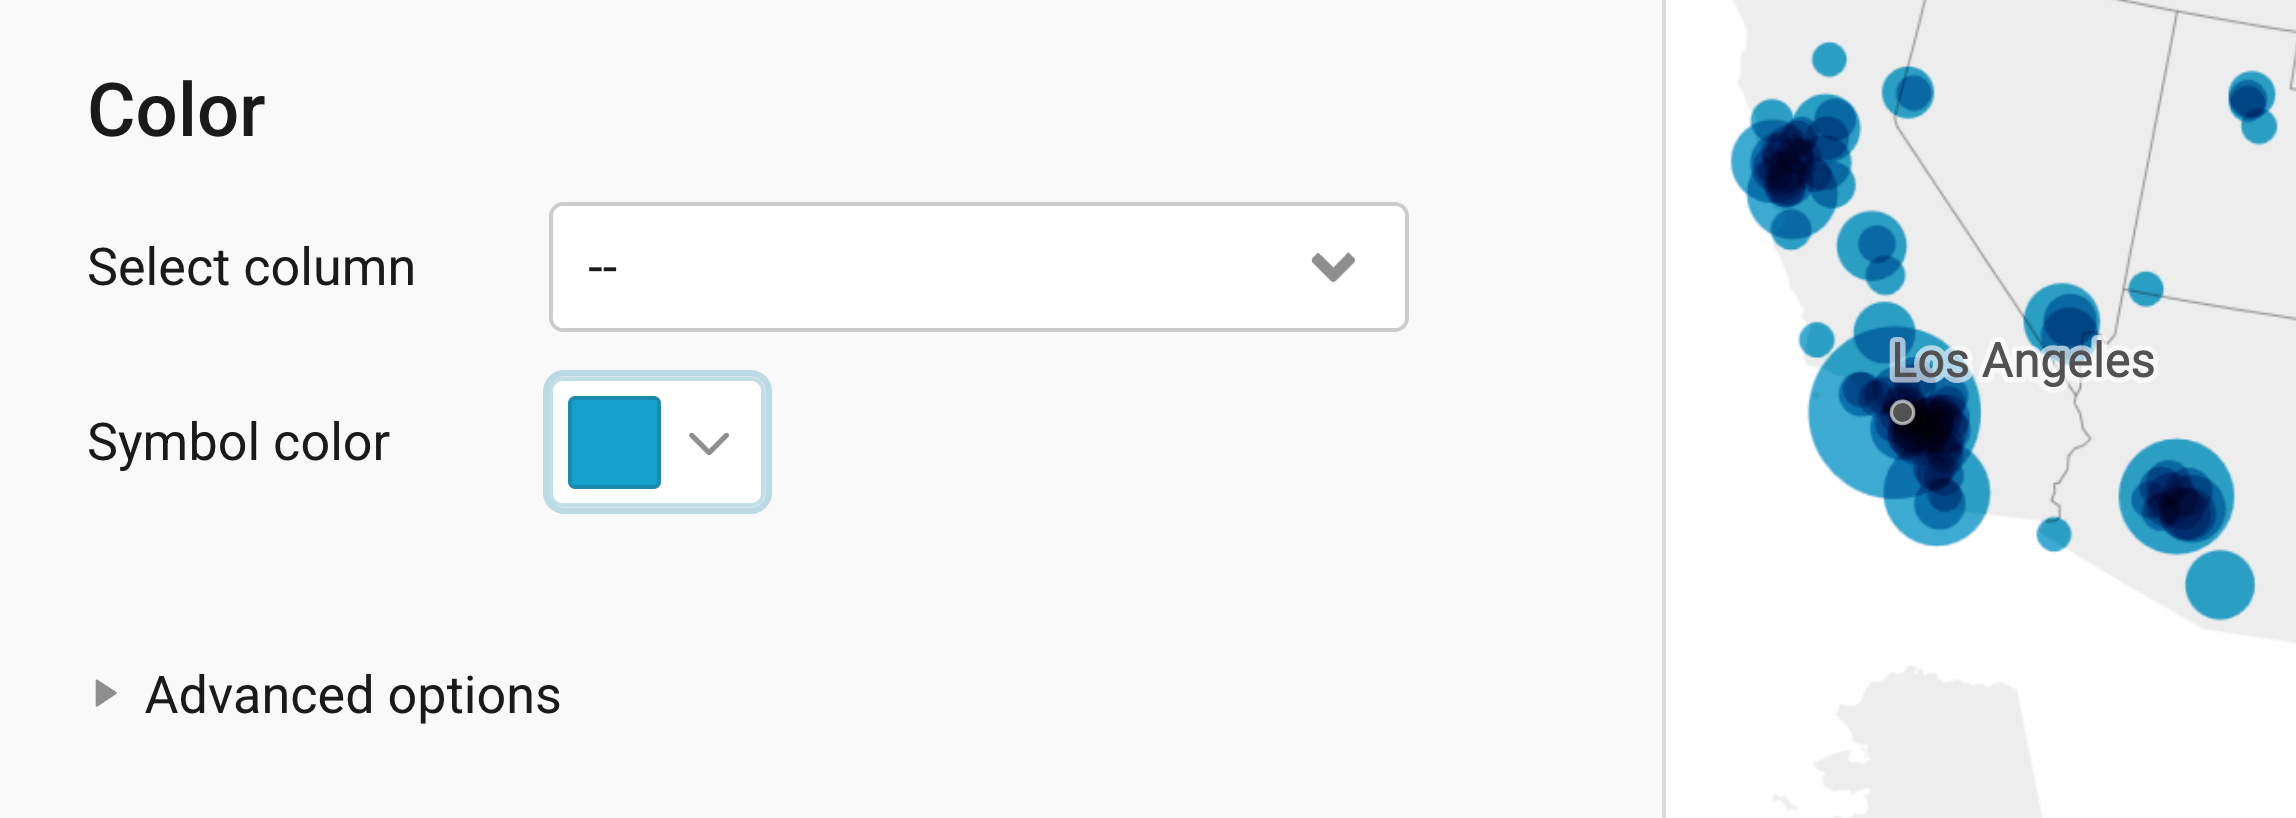
You can also select a column you want to color by. In our case, we want the symbols to show us how much the population of each city has changed since 2020. So we choose our numerical column "Change since 2020 (%)". As soon as we do this, we get a lot of new options.
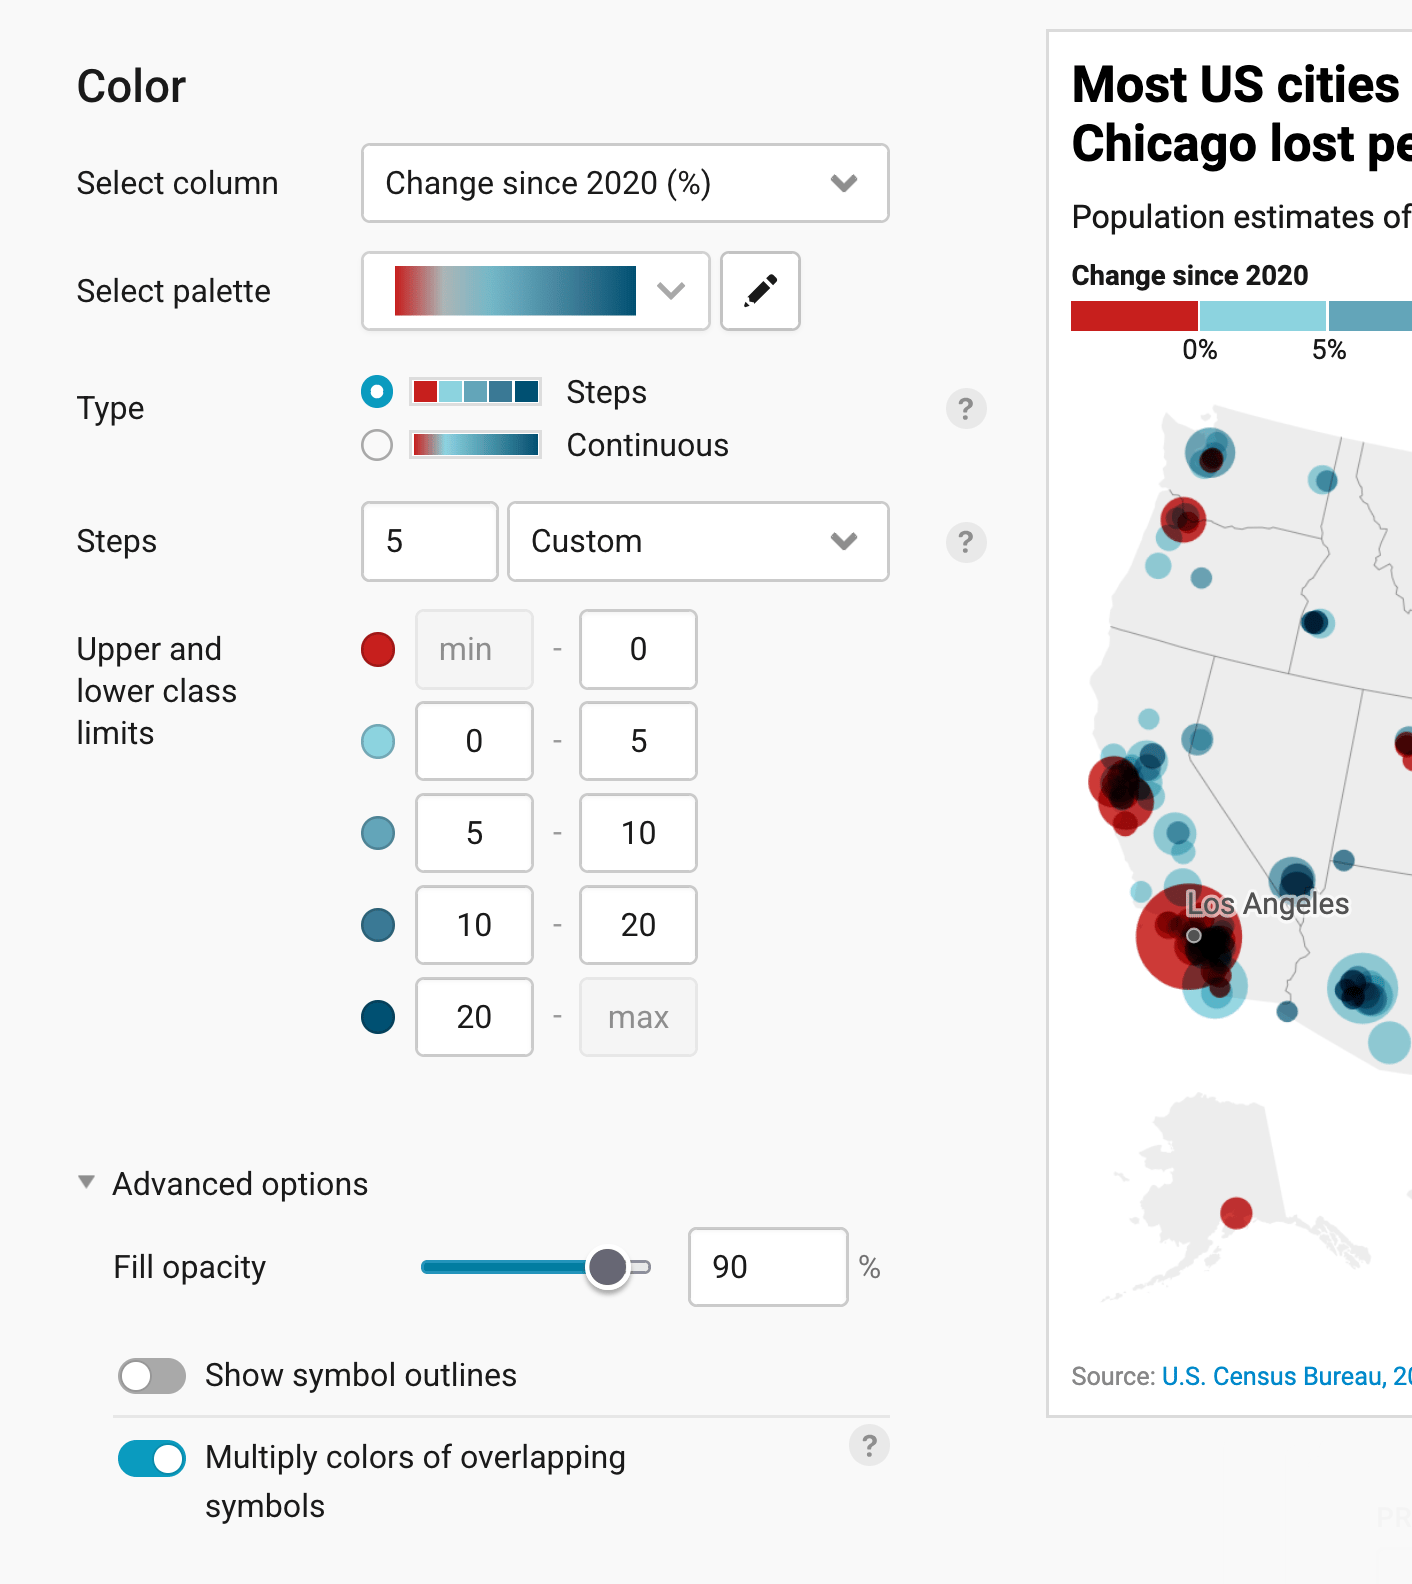
Datawrapper automatically maps your values to a color gradient between the lowest and the highest number. You can select another palette or change its colors (learn more), decide between a Continuous gradient and Steps (learn more), and set how many steps there are and where they start and end. For our map, we chose a palette that goes from red (cities that lost people) to blue (cities that grew), with five steps and custom limits: below 0%, 0 to 5%, 5 to 10%, 10 to 20%, and above 20%.
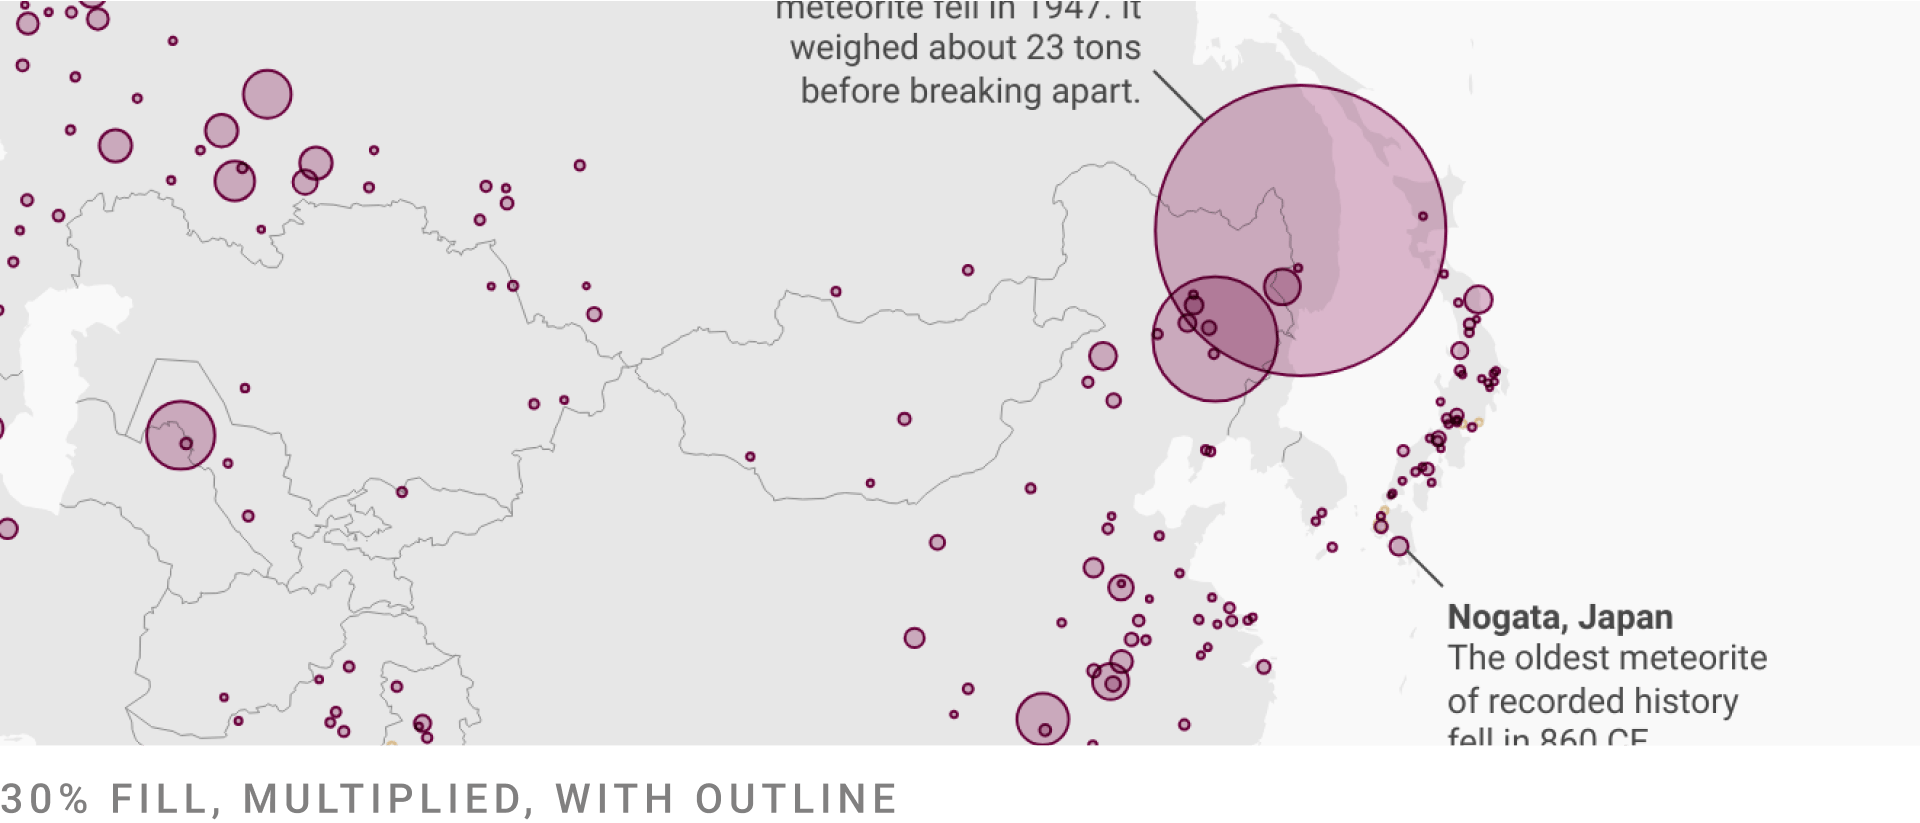
The Advanced options let you decide how transparent your symbols should be (Fill opacity), whether they get outlines (Show symbol outlines), and whether their colors multiply where they overlap (Multiply colors of overlapping symbols).
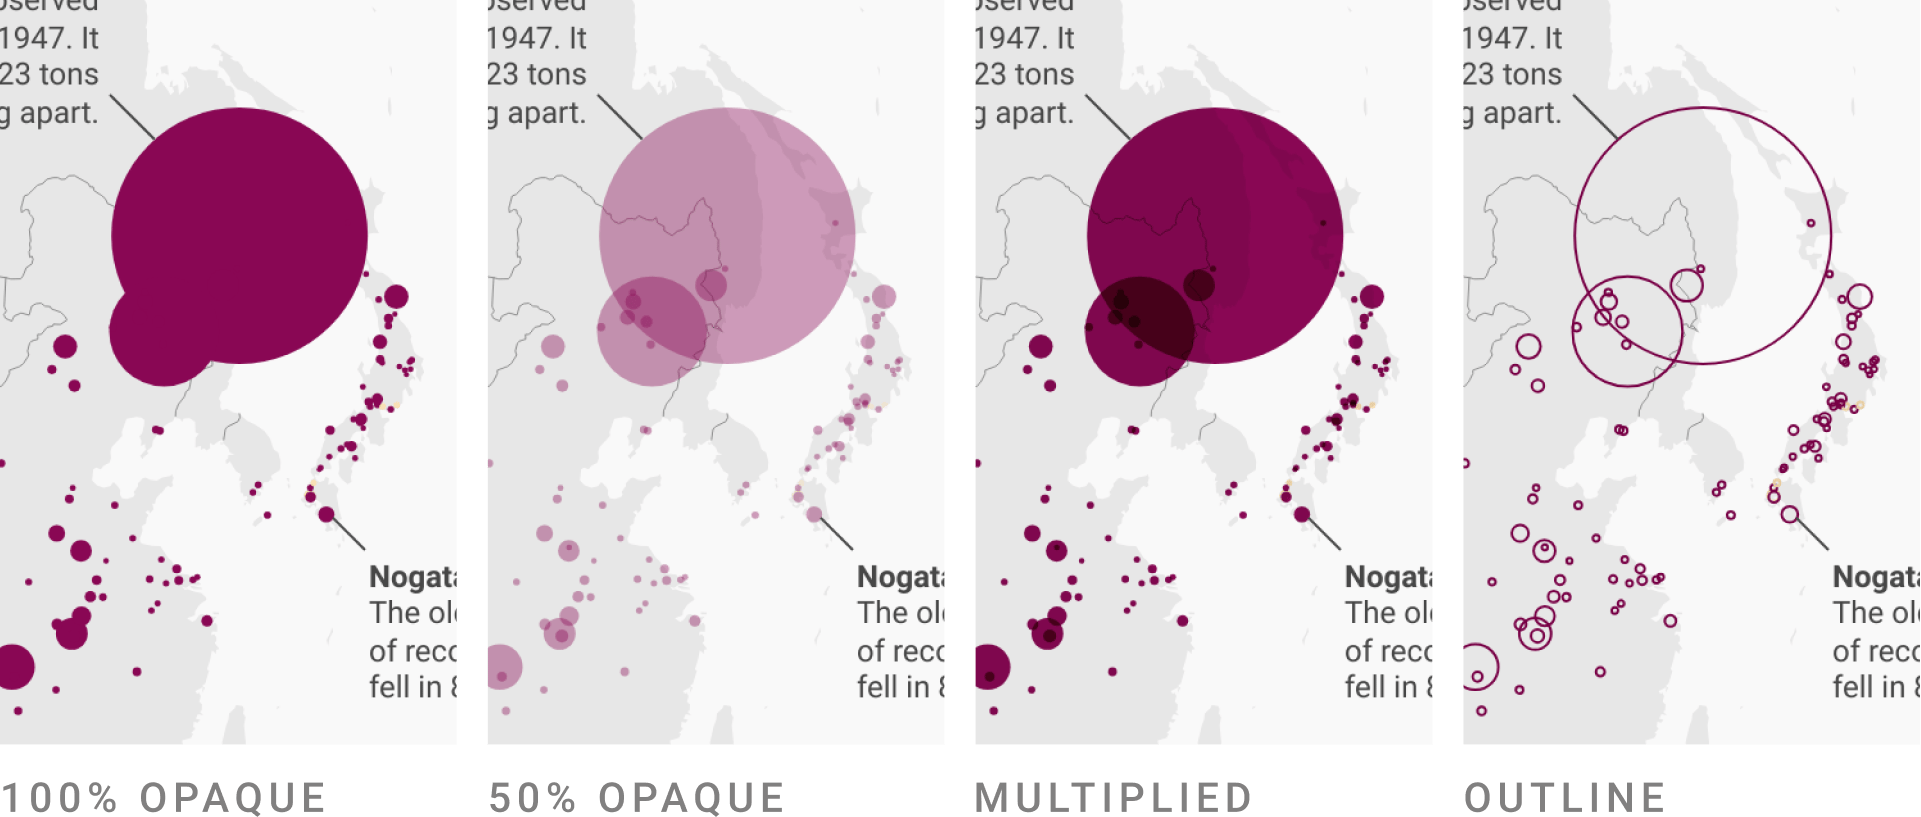
Depending on the colors of your symbols and how much they overlap, you might need to make some changes here. Often, a combination of all options works best:
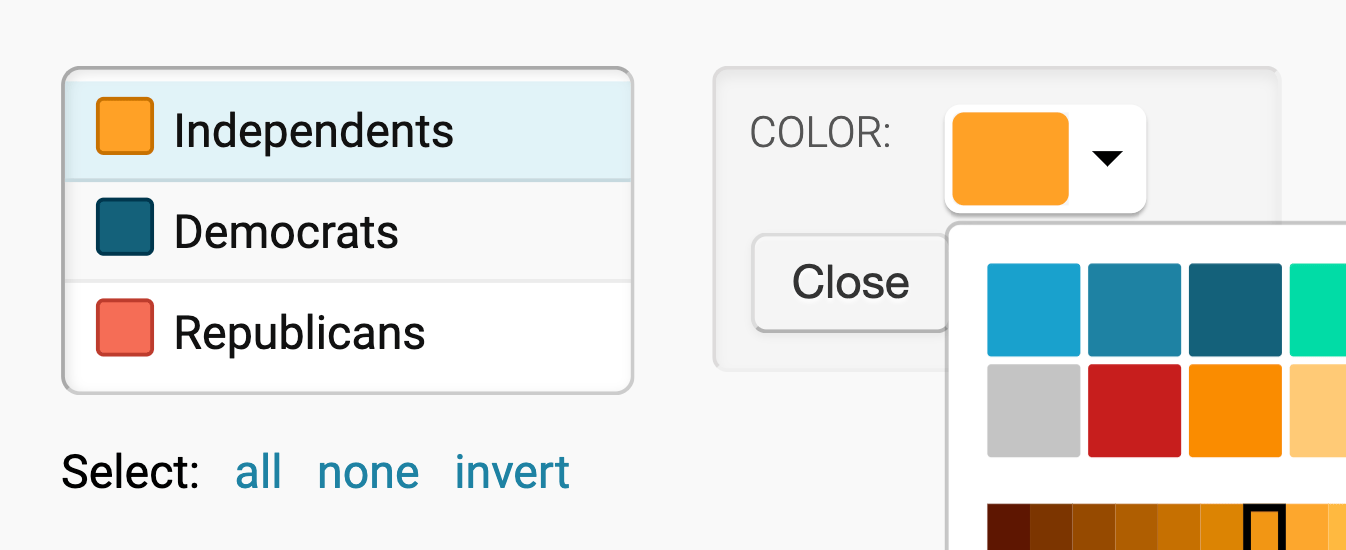
If you choose a text column, you can assign colors to categories (e.g. "yes"/"no" or "Republican"/"Democrat"/"Independent"). Click on them and then on the color swatch to change their colors:
Now that we chose our colors, let's make sure readers can make sense of them with a legend:
Customizing the legend(s)
By default, Datawrapper shows a legend for your symbol size and the color you chose. You can customize both in the Legend panel.
The first settings are for the size legend that explains to your readers what the size of your symbols means. You can also turn it off with Show size legend.
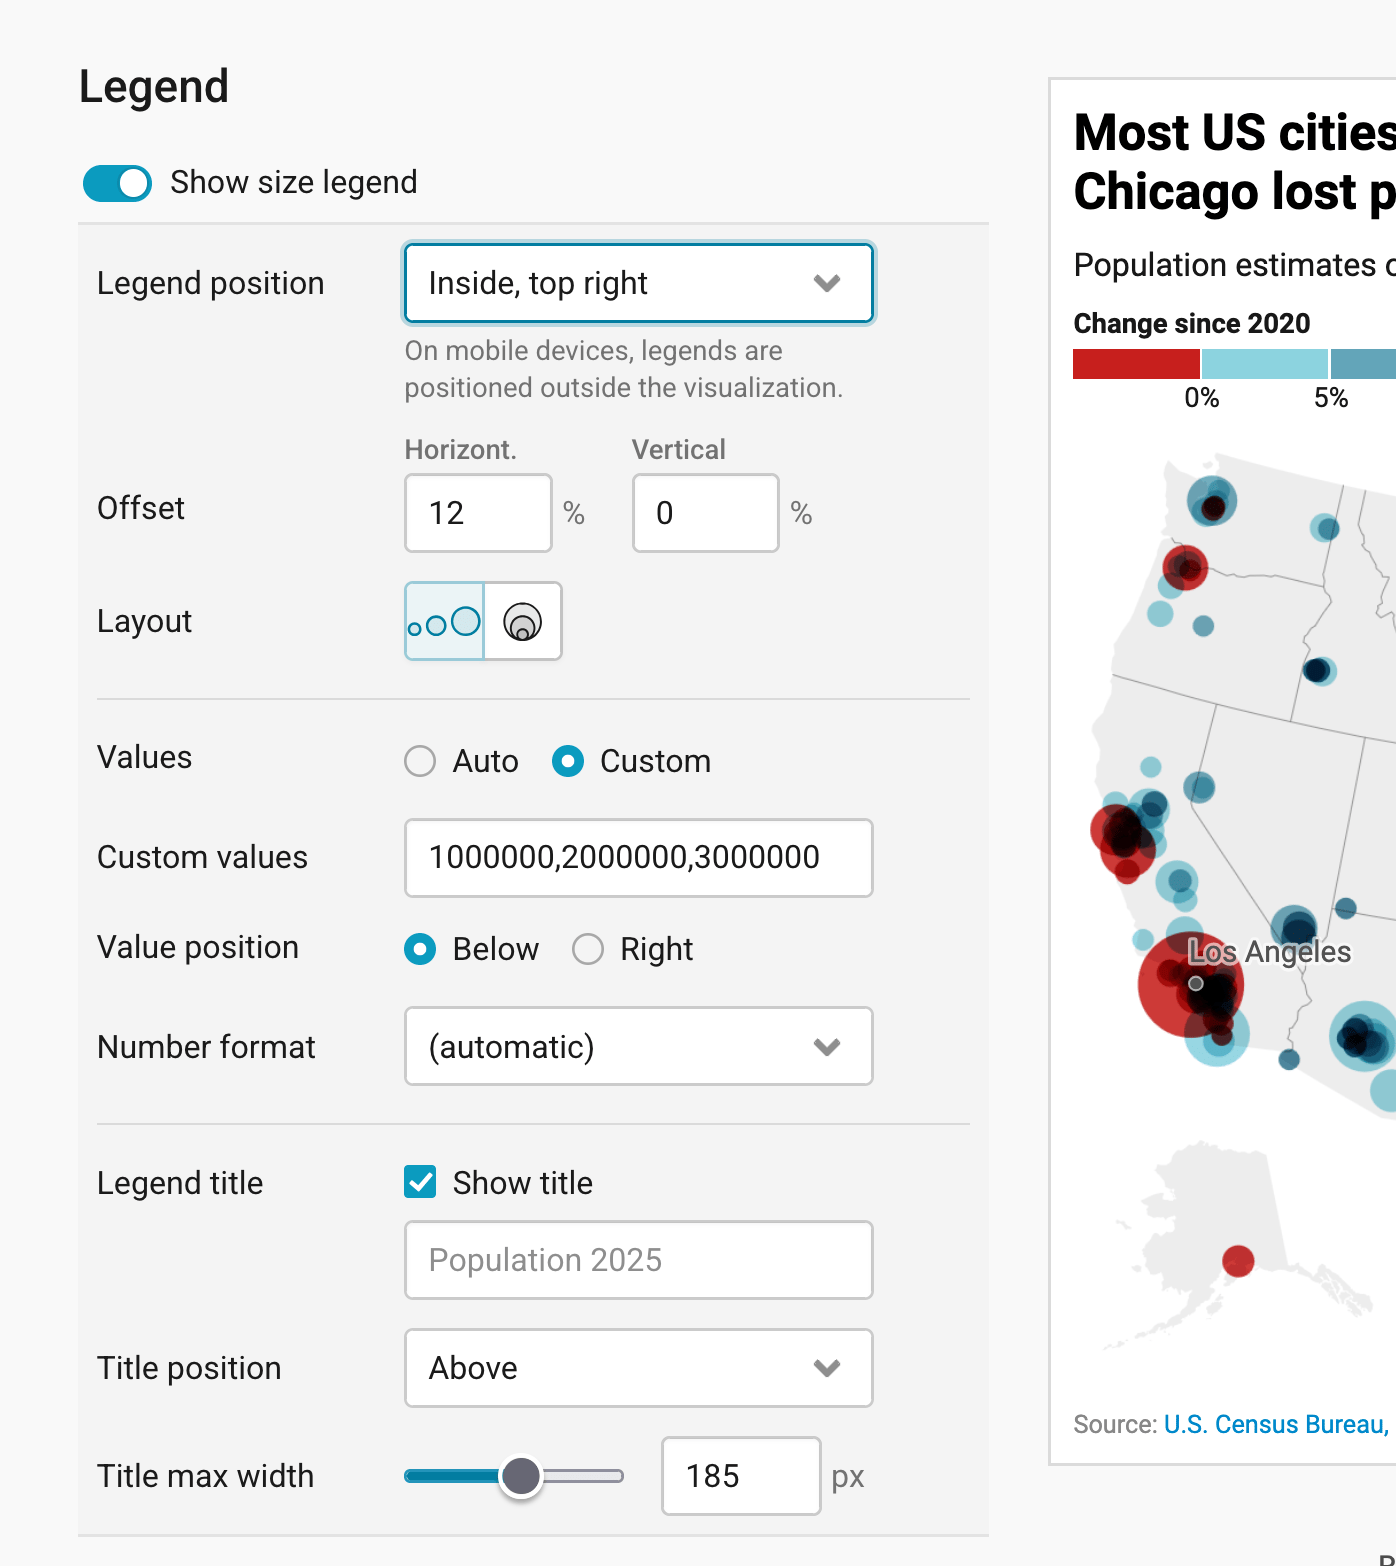
You can
- decide on the position, offset, and layout of your legend
- define which values the legend should show in which number format, and if the values should be placed below or next to the symbols. For our map, we chose Custom values to show circles for 1, 2, and 3 million people.
- put a title above, below, left or right of your size legend and decide how wide the title should be able to get (meaning, when a long title should break to the next line)
Below the size legend, you'll find the settings for the color legend:
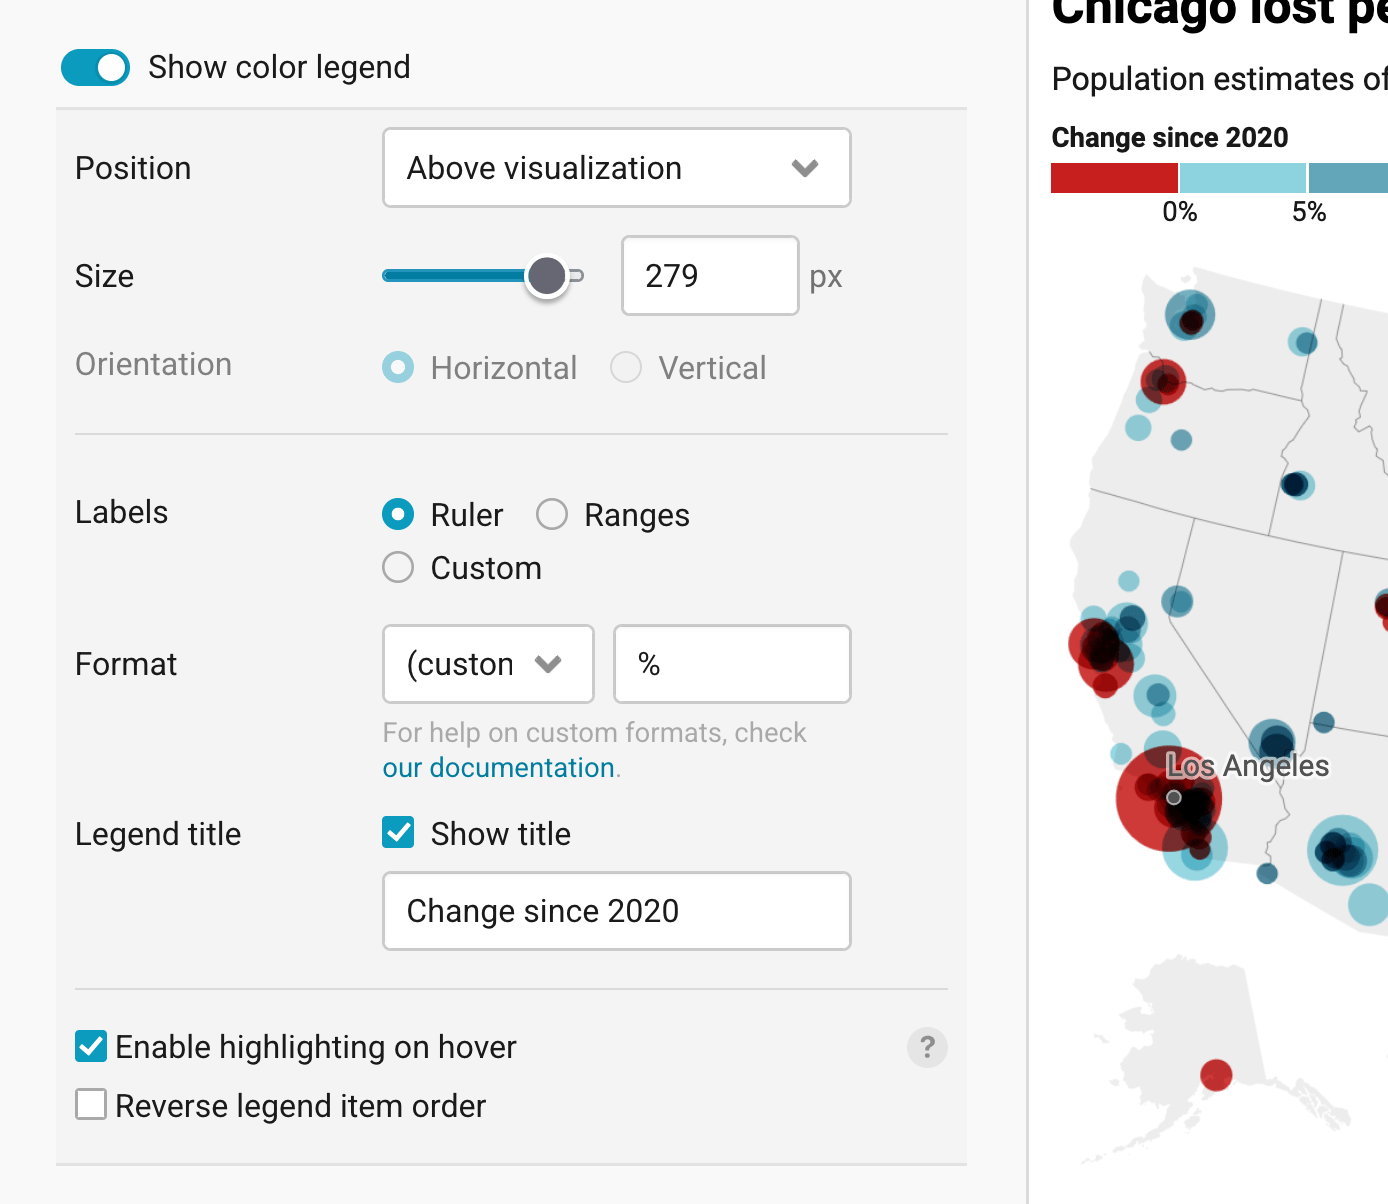
Here, too, you can choose the position and how wide it should get (Size), and decide on a title. With Labels, you decide whether the legend shows the values at the borders between the colors (Ruler), as Ranges, or with your own Custom labels, and Format sets what the numbers look like. If you enable highlighting on hover, your readers can hover over either the legend or the symbols on your map to see symbols in a similar value range. Reverse legend item order flips the order of the colors in your legend.
👉 To learn which legend types exist, how to use them, and how to position your map legend, visit our Academy article How to customize your map legend.
We gave our color legend the title Change since 2020. We also used a custom Format that adds a percent sign to the values, to make visible that our legend shows percentages.
Adding map extras
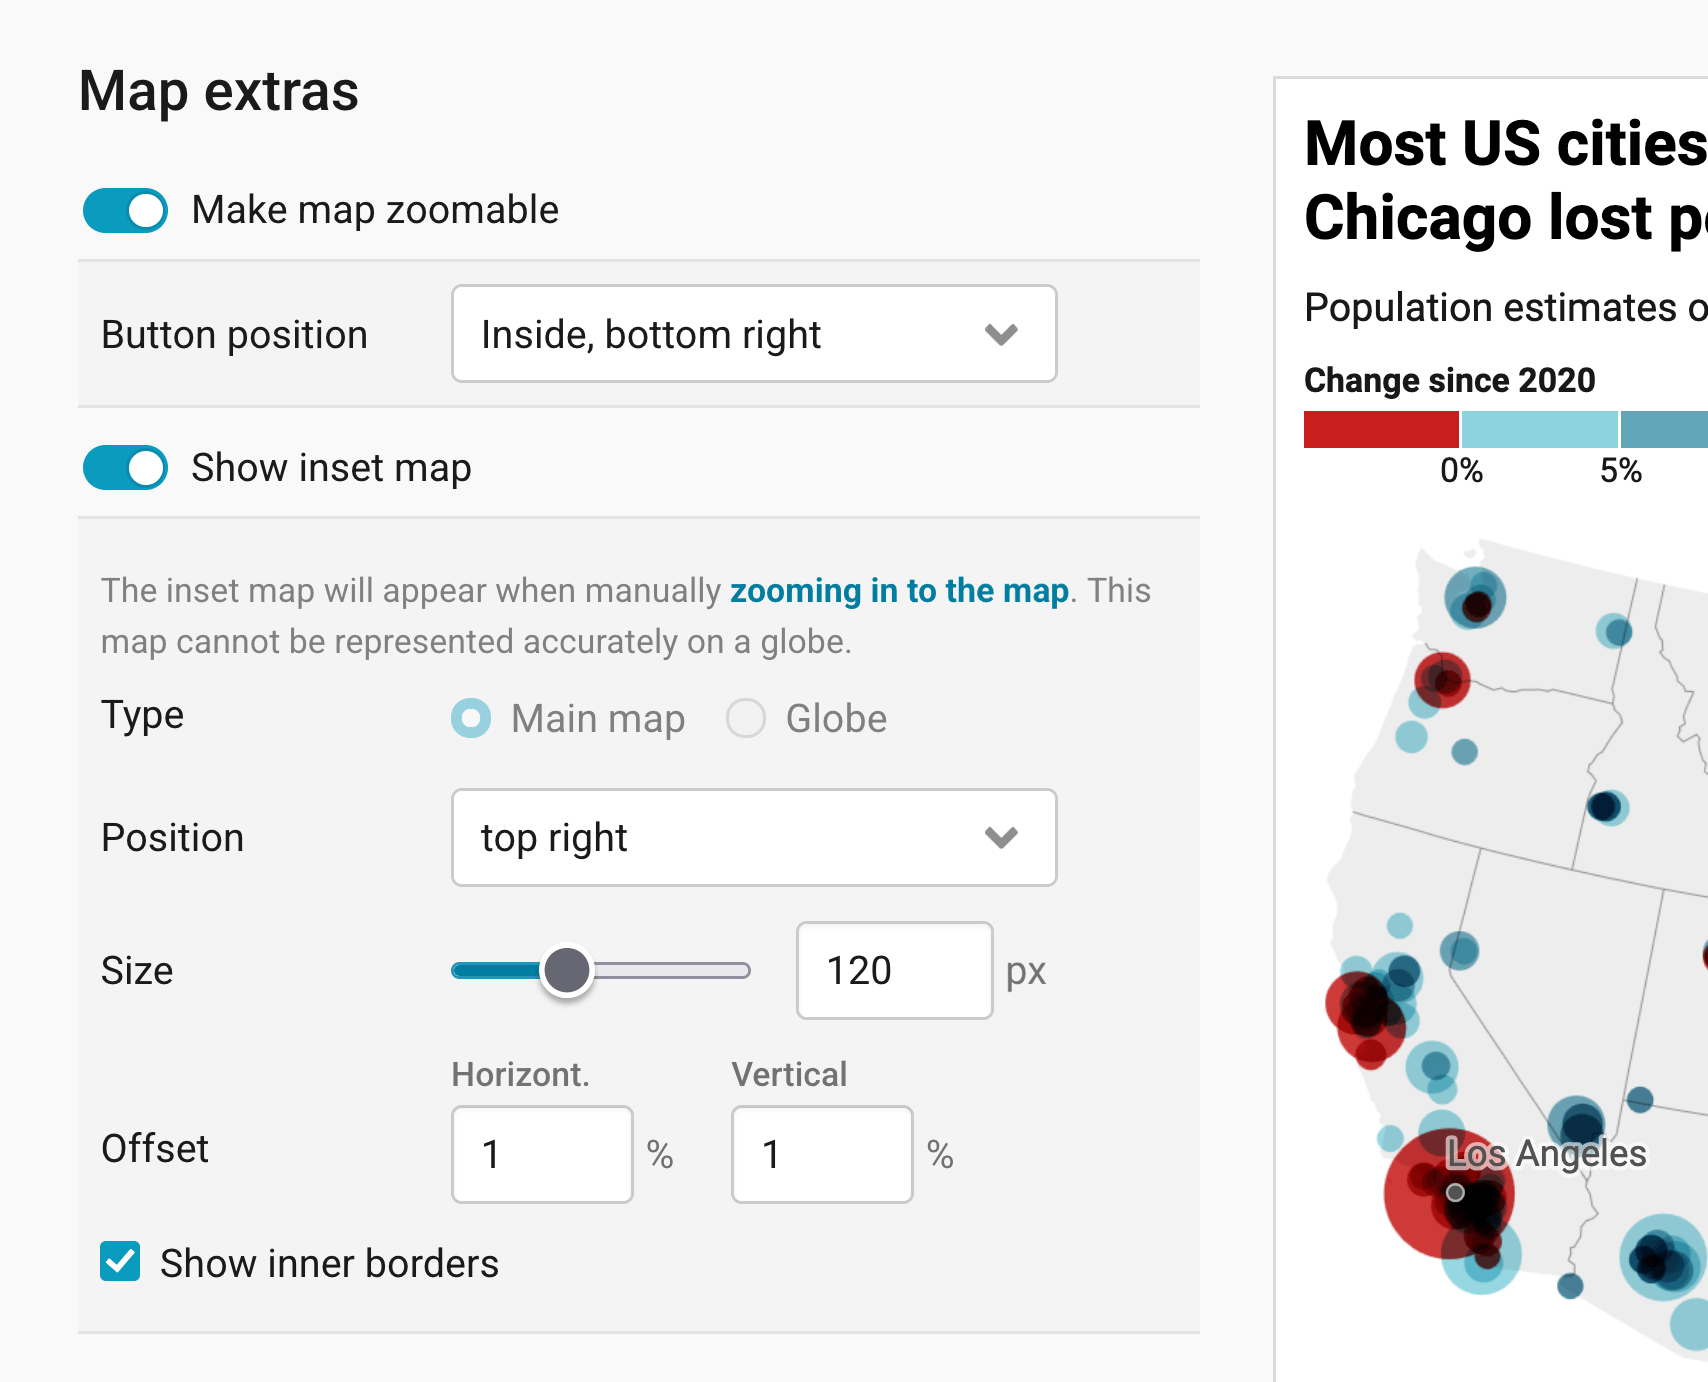
The next panel lets you add extras to your map: A zoom button and an inset map.
If you turn on Make map zoomable, you can place the zoom buttons in all four corners of the map (Button position). It's a great way to let people explore the symbols in exactly the region they're interested in.
An inset map is a miniature version of your main basemap that highlights the visible region, helping your readers orient themselves. It only appears once readers zoom into your map. You have two type options: The main map and a globe. The main map is a good choice if you crop to data (see next panel). For some maps, like our US map, you can only choose the main map as the inset map.
Whichever type you choose, you can define the inset map's position, make it bigger (size), and add a horizontal and vertical offset to it as a share of the whole map width. With Show inner borders, the inset map also shows the borders within your map, like the US state borders.
Changing the appearance
The last panel in the Refine tab is the Appearance panel. Here you have the following options:
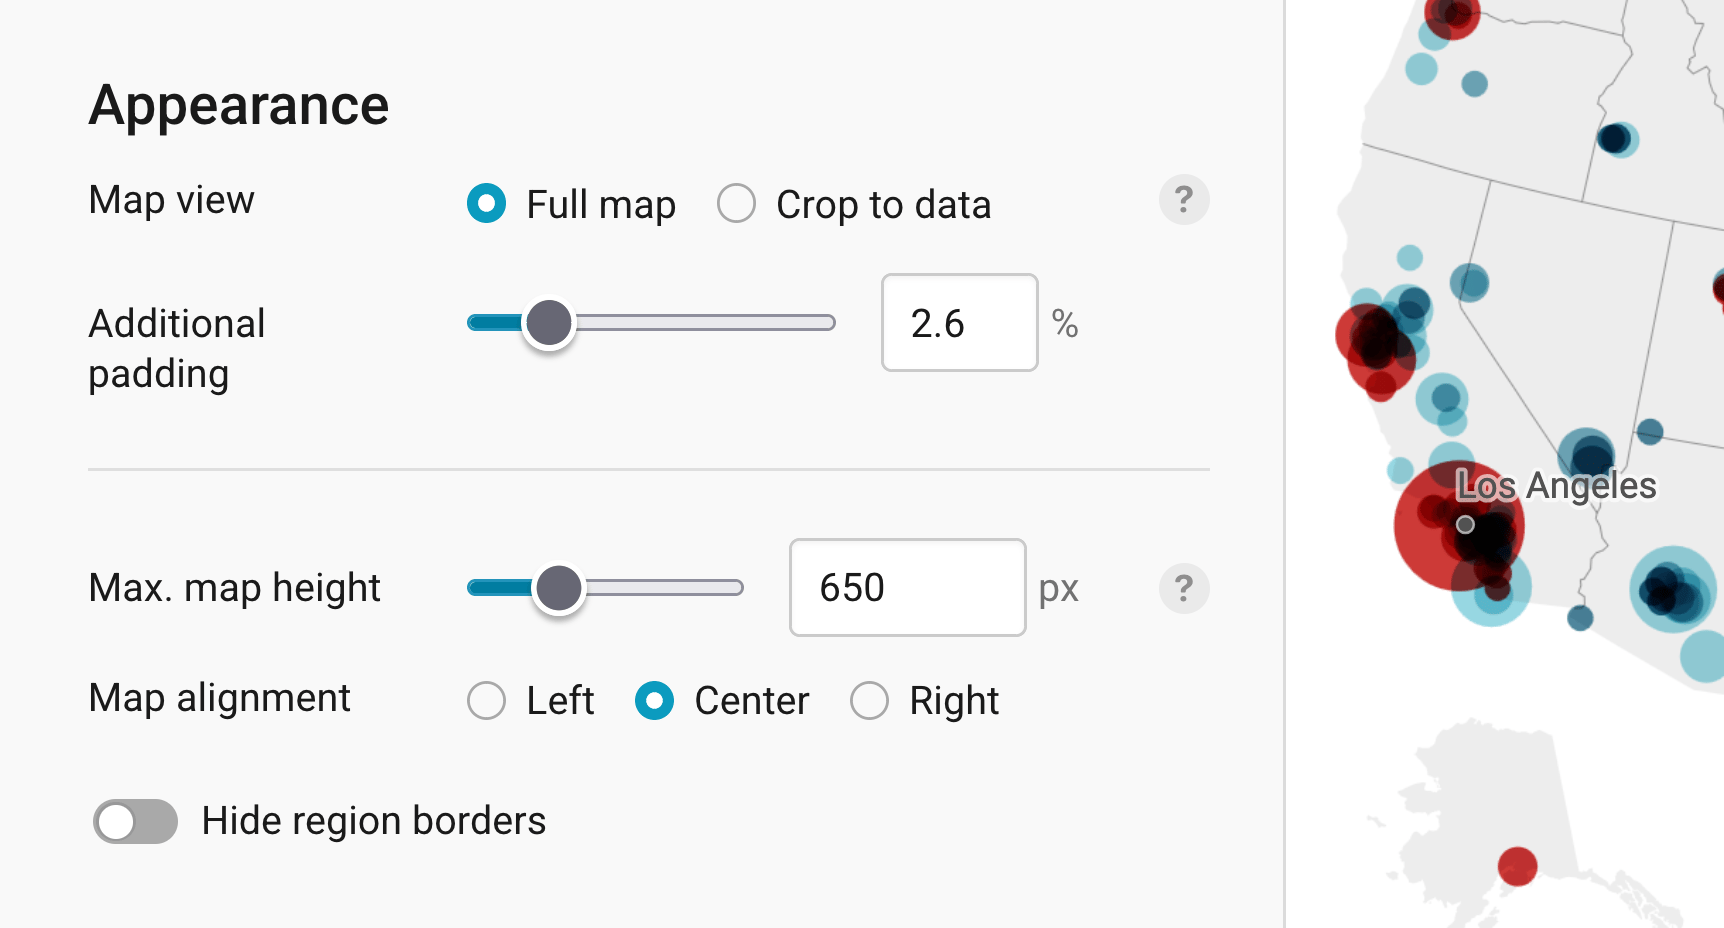
Map view lets you hide the parts of your map that don't have data if you choose Crop to data. This can be helpful if a big part of your map is empty. Give your map Additional padding to "zoom in" less in the part of your map with the data; to keep more context around the regions with data. Learn more about this in our article How to hide regions on a map.
Max. map height is often not needed, but becomes important if your basemap has an unusual aspect ratio. By default, Datawrapper will automatically adjust the height according to its width to reduce any unnecessary white space around the map. But when you have a long map like Chile, for example, you might want to set a maximum height to avoid all the scrolling:
Map alignment determines the position of the map on the background. Often, a map fills the background completely, like a US map. If you work with such a map and the map padding is set to zero, this option won't have any effect.
Hide region borders is the last option and does just that: The borders on your map (e.g. country borders, state borders, or district borders) will disappear when you turn this on. This is especially useful if you have lots of tiny regions that get in the way of the symbols, but are not necessary to show for your readers.
These are all the settings you can find in the Refine tab. Let's move on to the Annotate tab:
Annotating your map
Adding a title and source
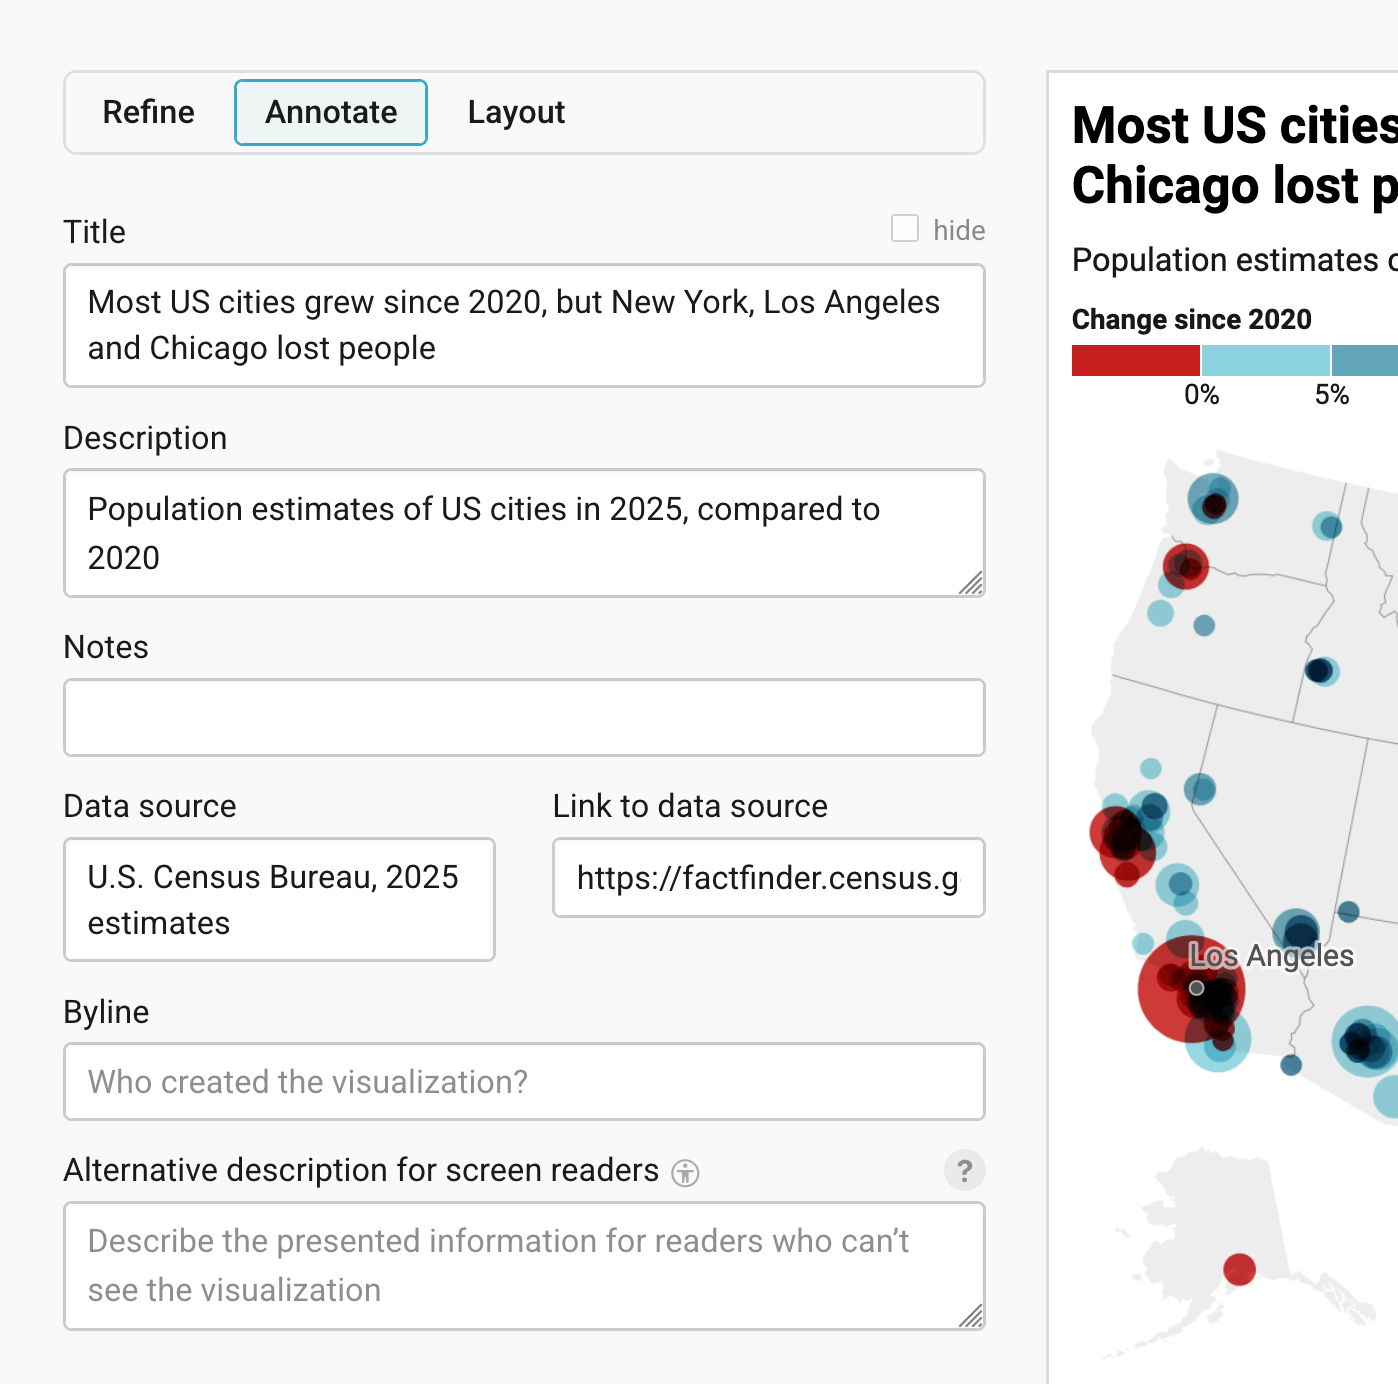
In the Annotate tab, you're first asked to give your visualization a title, description, notes, source, byline, and an alternative description for screen readers. You can find a detailed explanation of all these Annotate options here.
Adding map labels
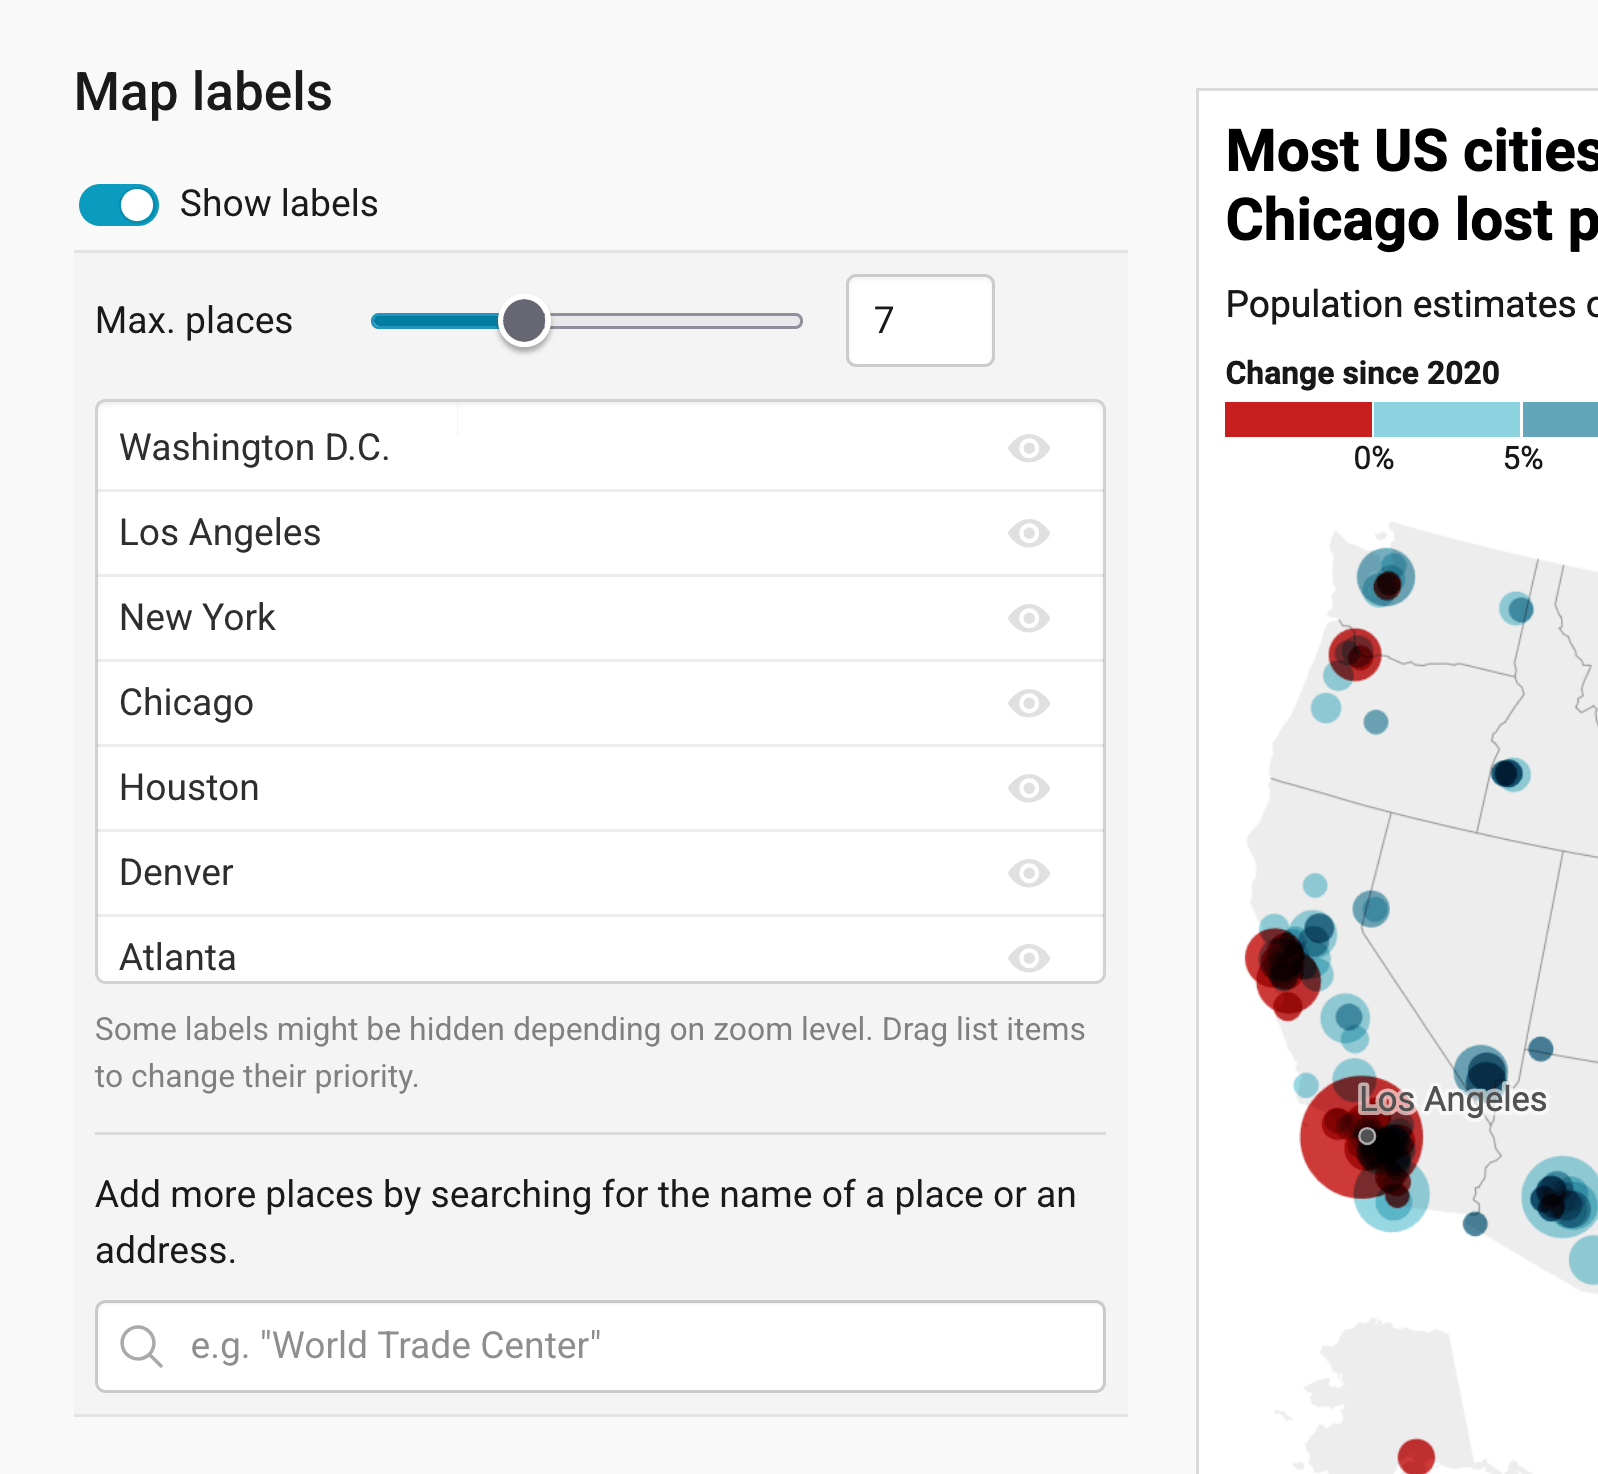
Then there are three panels left: map labels, text annotations, and tooltips.
Map labels show the names of regions and cities directly on the map. Turn on Show labels, choose with Max. places how many labels should appear at most, and drag the places in the list to decide which ones are the most important. You can also search for more places to add. In our map, we show the names of seven big cities, like New York and Chicago.
To learn more, visit our article How to add map labels.
Adding text annotations
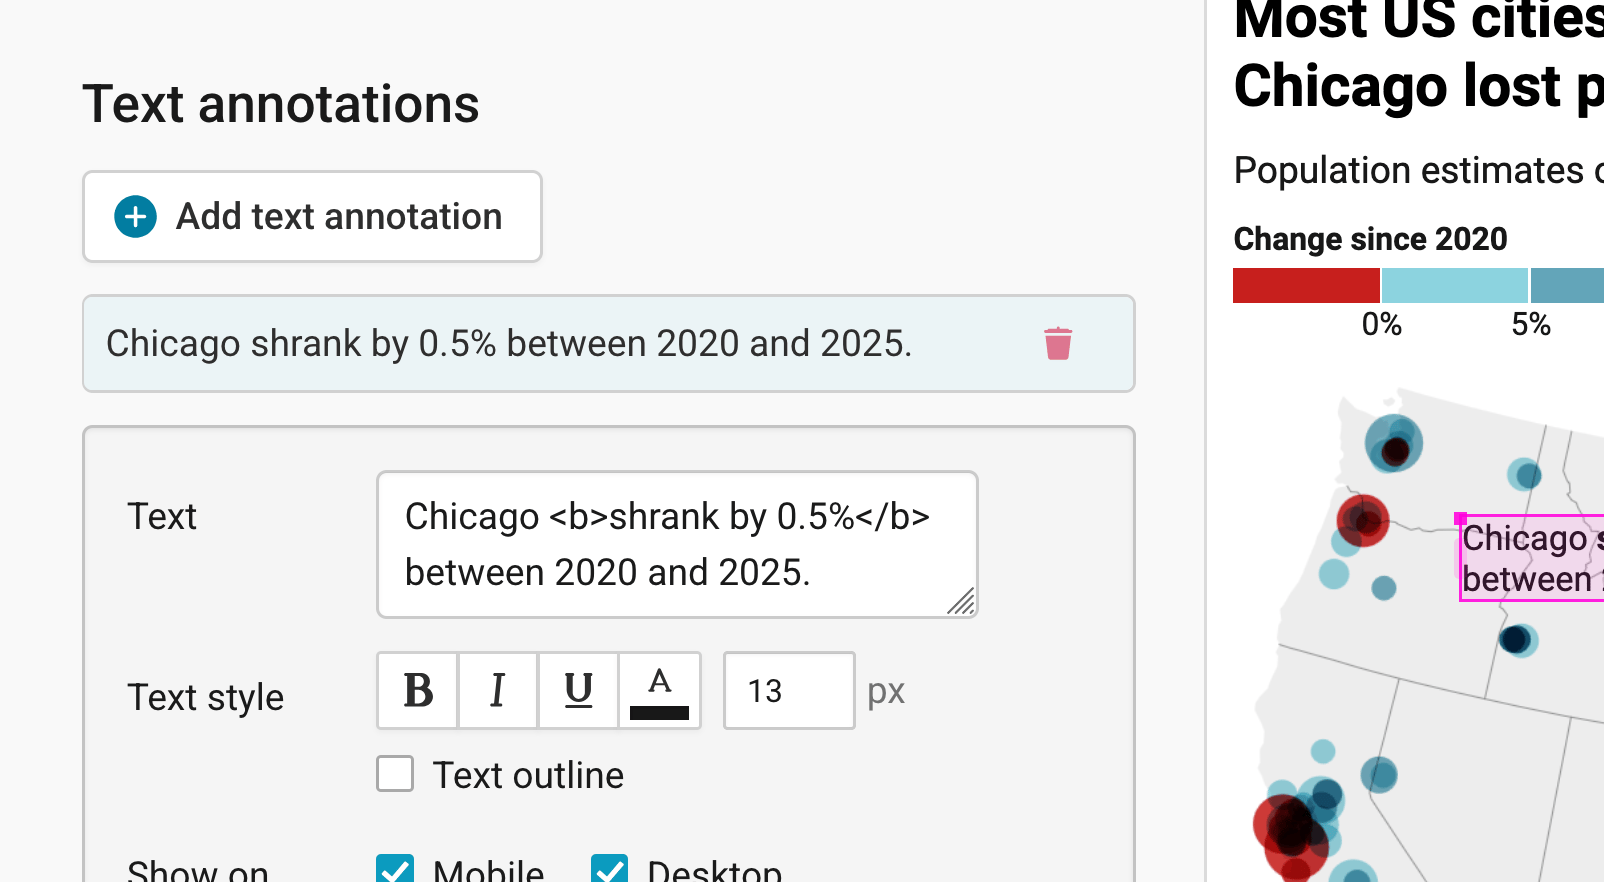
To learn more about text annotations (in our map, that's the text that points out that Chicago shrank), visit our article "How to create text annotations".
Creating tooltips
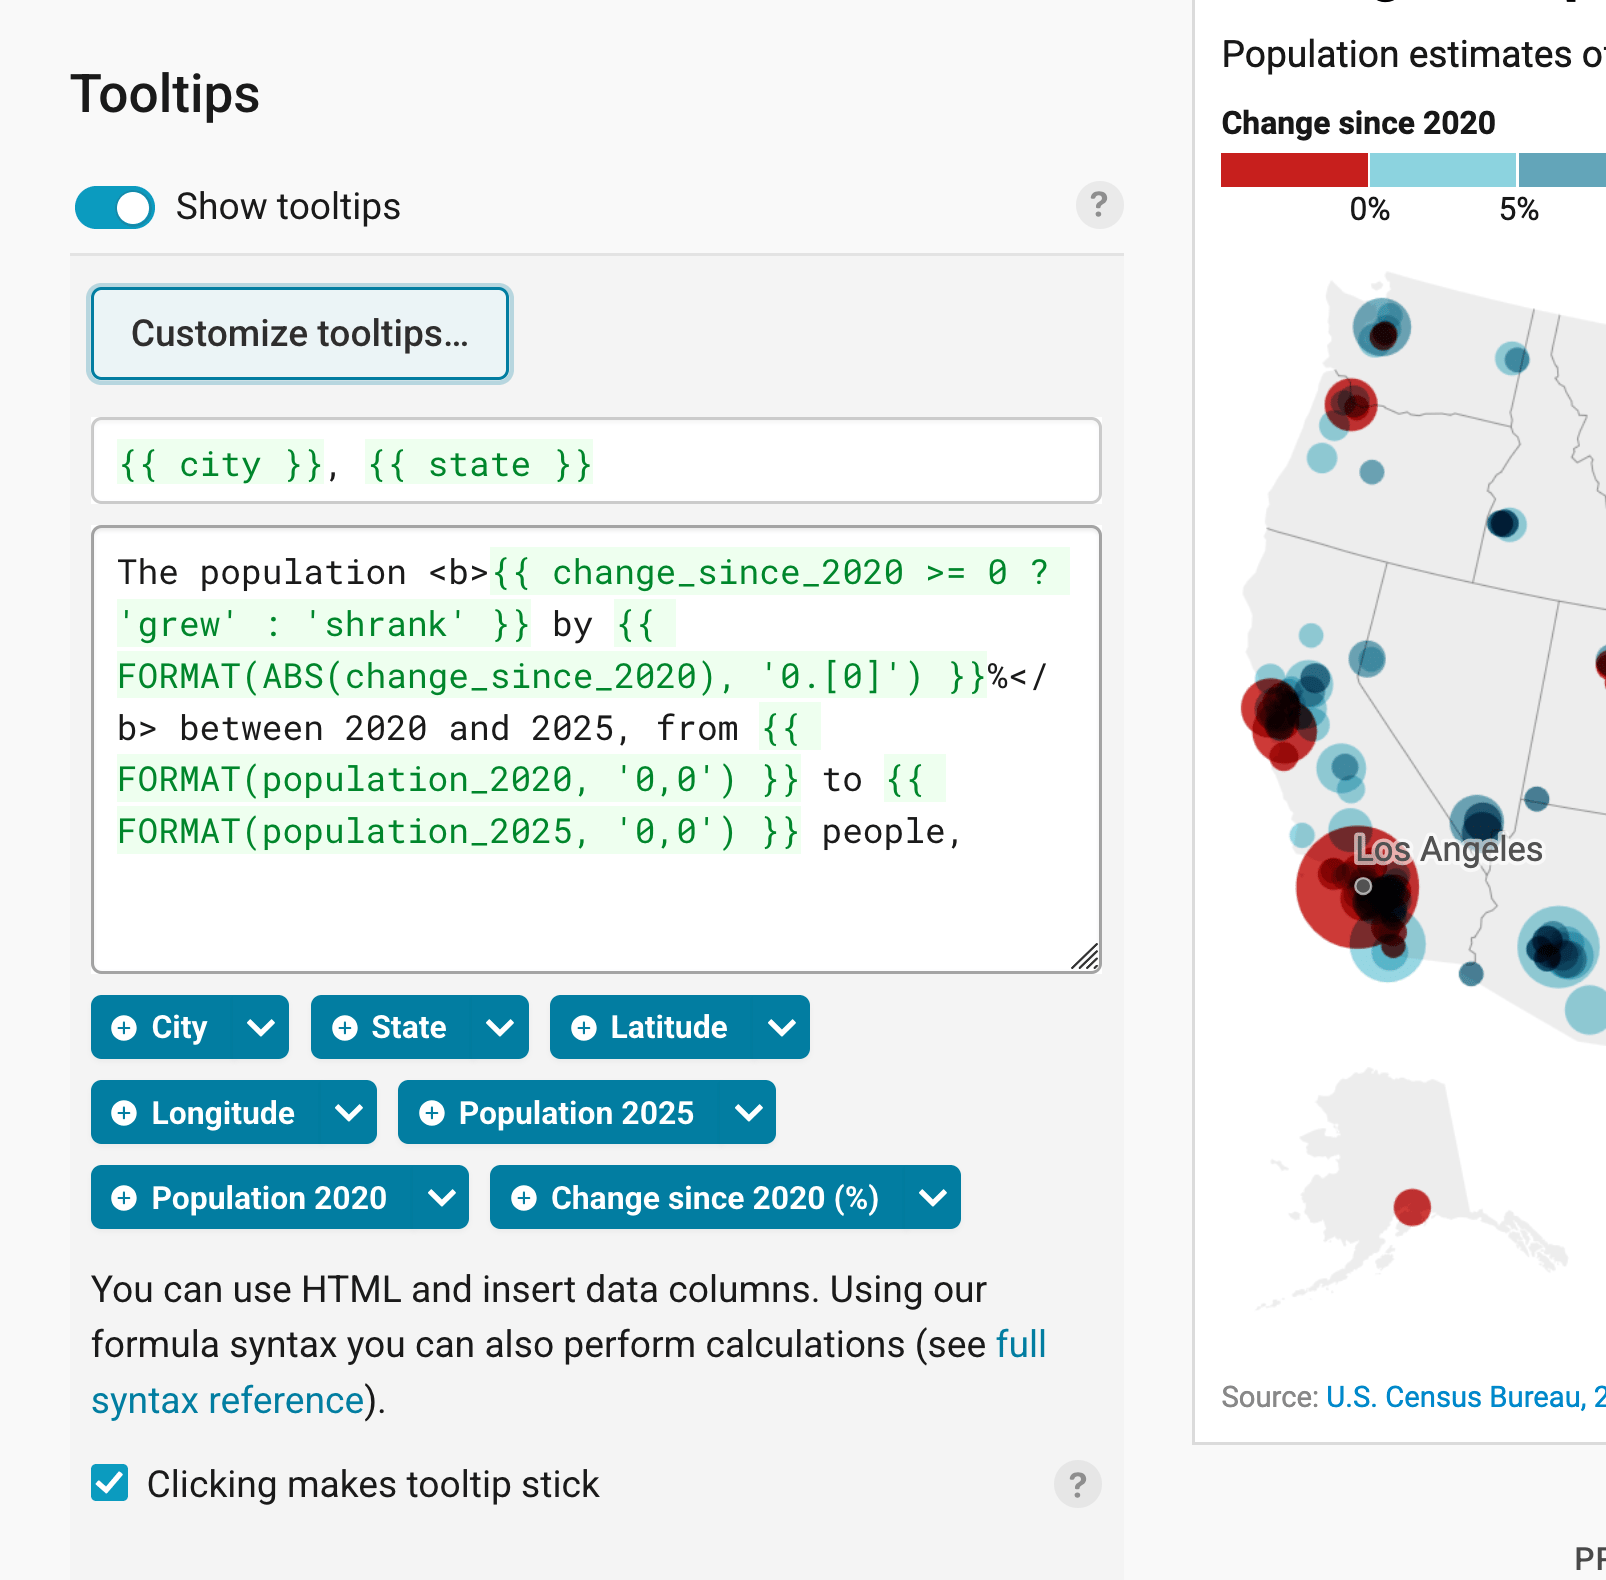
Finally, you can add tooltips. They're great to let your readers explore the map, see the underlying value of each symbol, and to add context information. In our map, the tooltip shows the city and state as a title, and a sentence about how much the population grew or shrank since 2020.
If you tick Clicking makes tooltip stick, the tooltip stays open when readers click on a symbol, so they can read it in peace.
Learn how to create them in our article How to create tooltips, and learn how to customize them. To learn how to create tooltips for your grouped/clustered symbols, visit our article How to create tooltips for grouped symbols.
Publishing your map
After annotating your map, only one tab is left in step 3: Visualize: the Layout tab. You can find all Layout settings explained in this Academy article.
In step 4: Publish & Embed, you can first publish your map and then decide how it gets to your readers. We recommend pasting the embed code into your website or CMS, but you can also share the map's URL. Learn more about both options here. To use your map somewhere else, download it as a PNG (on any plan) or as an SVG or PDF (on paid plans). See what each plan includes on our pricing page.
In this tutorial, we gave an overview of all the options that you have to customize your symbol map. You can find more detailed explanations about the color palette, tooltips and custom map keys in other articles.
And that's it! You've successfully created and customized a symbol map.