How to hide regions on a map

You might be looking for a very specific basemap for your choropleth or symbol map. One that looks like a map you found in our map selection – just zoomed in, or with certain regions hidden. That's because you might want to show just e.g. counties in the north of California instead of in the whole state, or only Western European countries, or because you don't have data for those tiny islands at the edge of the map anyway.
This article explains how to make this possible.
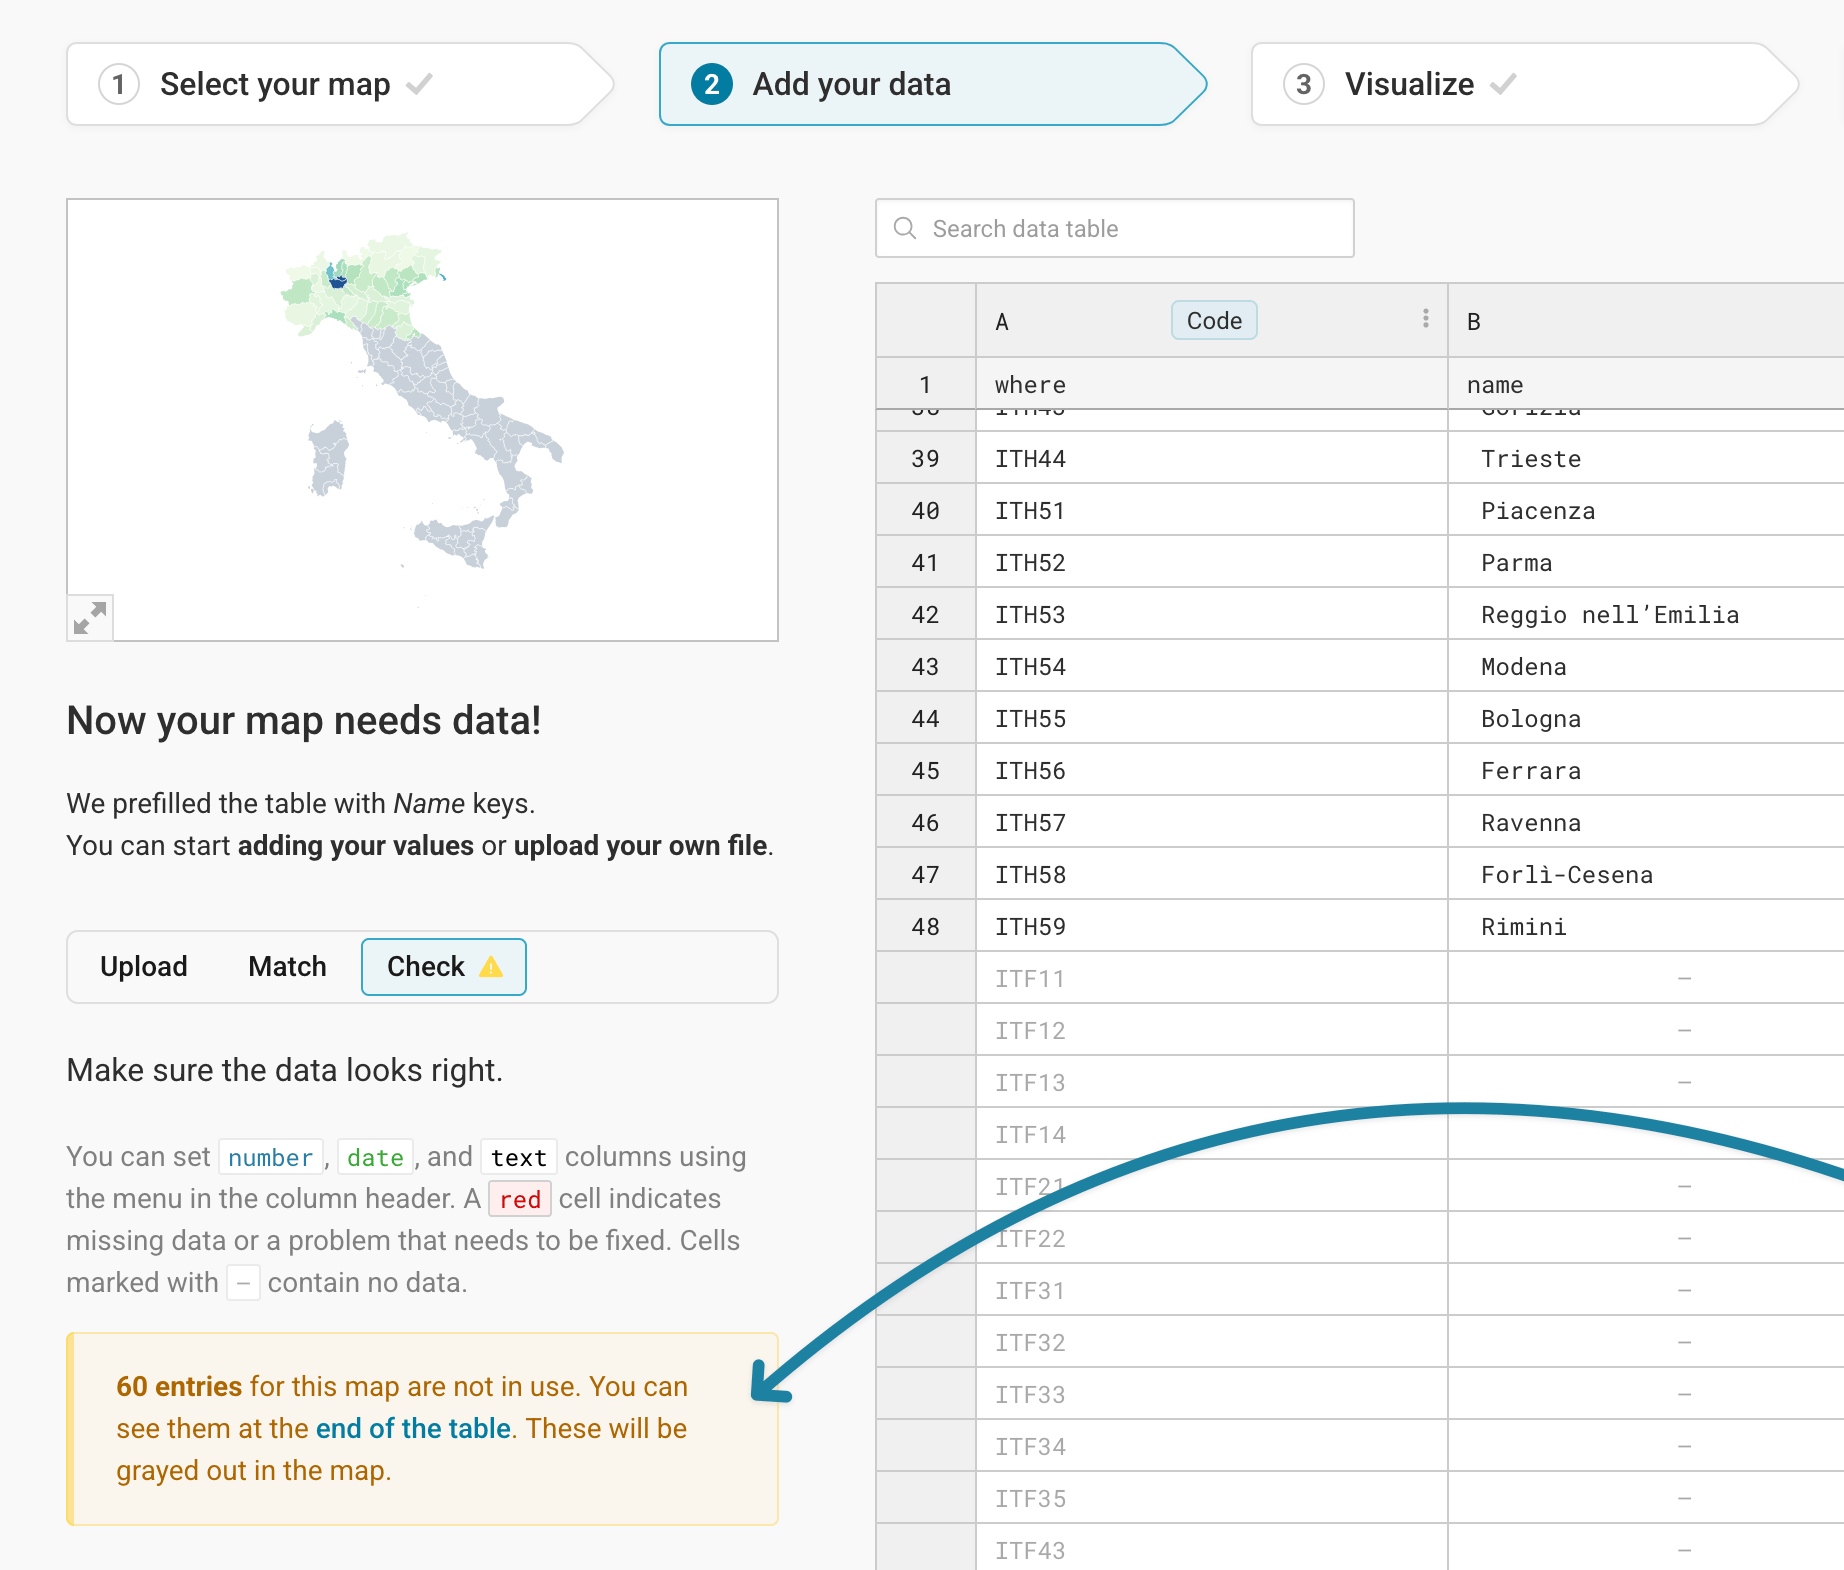
Only upload data for the regions you want to show
First, make sure to only upload the data for the subset of the map that you want to show. Datawrapper will tell you that "entries for this map are not in use", but you can ignore that for your use case.
Crop to data
In step 3: Visualize, make sure you're in the Refine tab and then scroll down to the Appearance section. The first options are about the Map view. Here, select Crop to data.
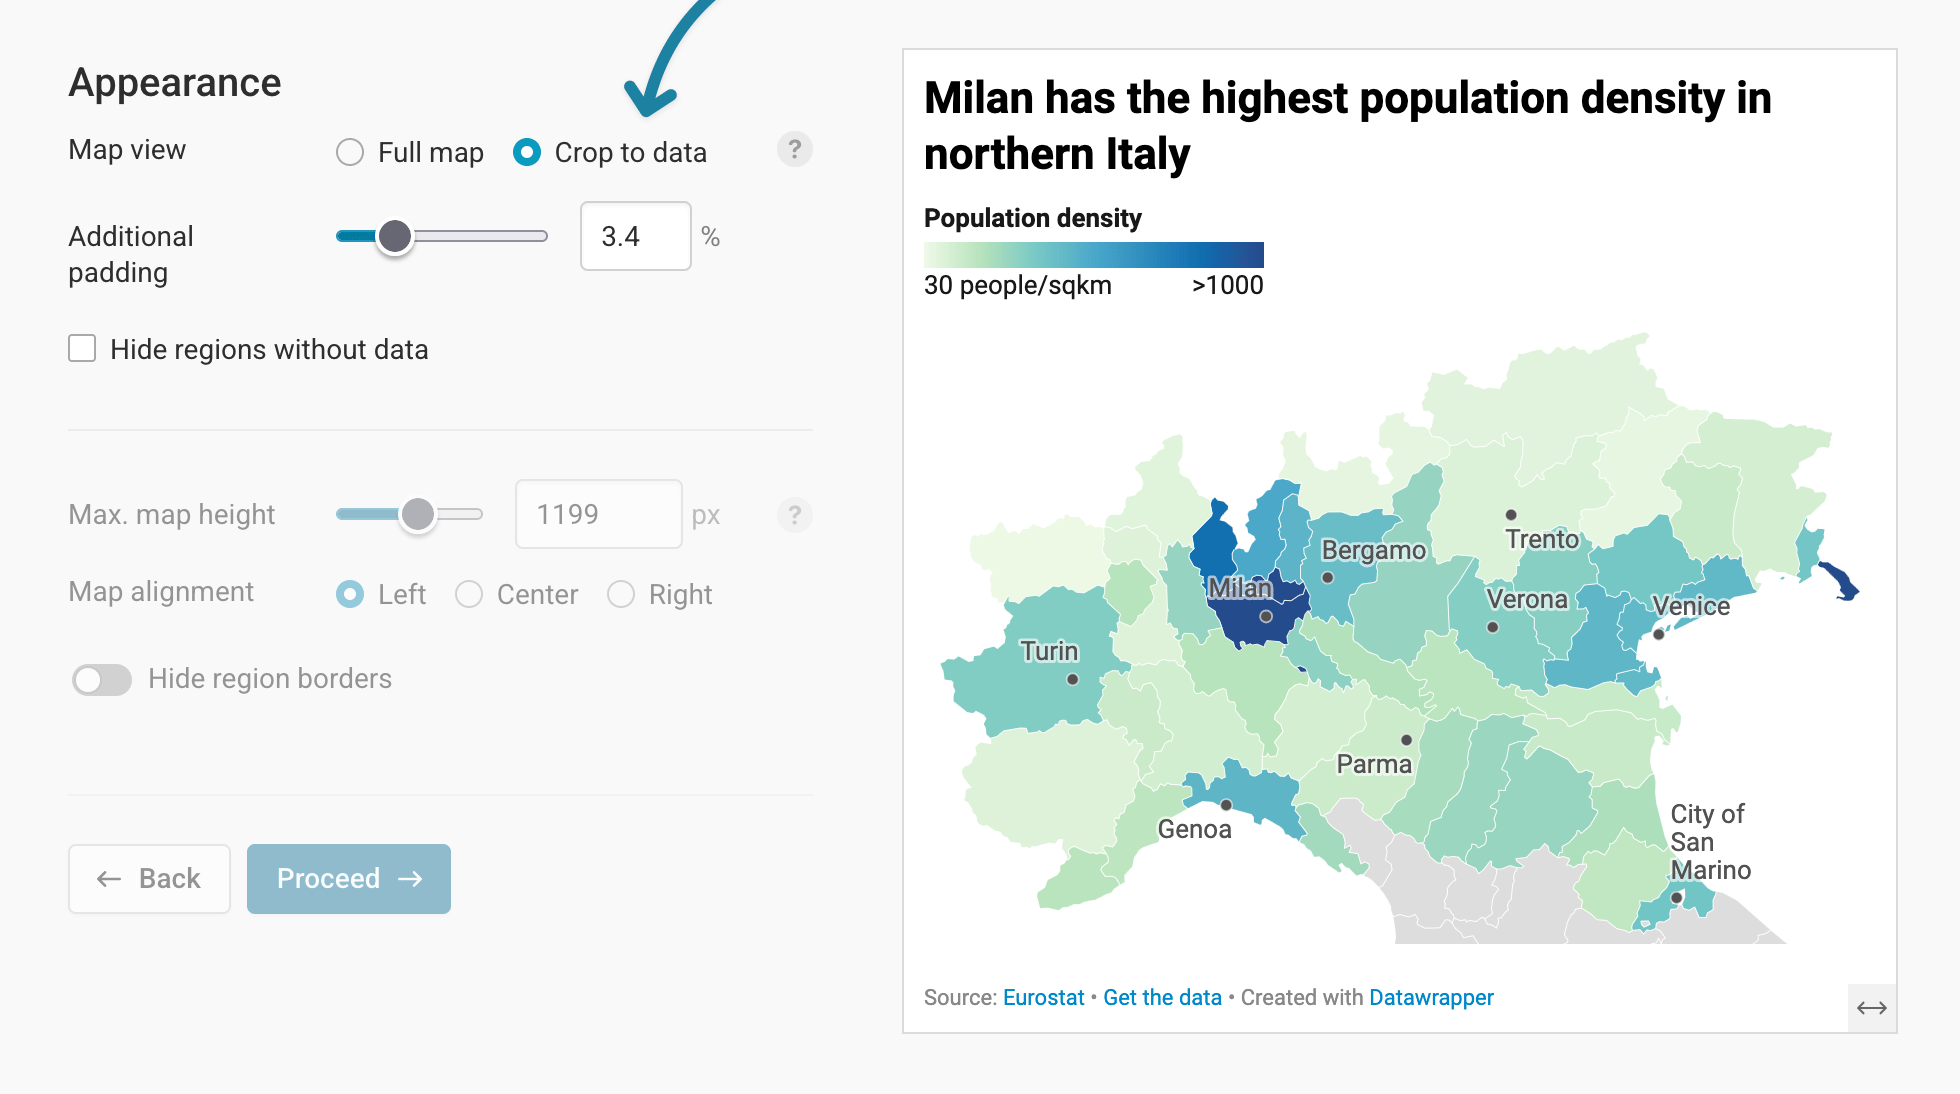
This will lead to a zoomed-in version of your map that only shows the regions for which you uploaded data.
You can also adjust how much zoomed in your map is by changging the Additional padding.
Optional: Hide regions without data
So far, the regions without data will still show up, just grayed out. To not show them at all anymore, check Hide regions without data:
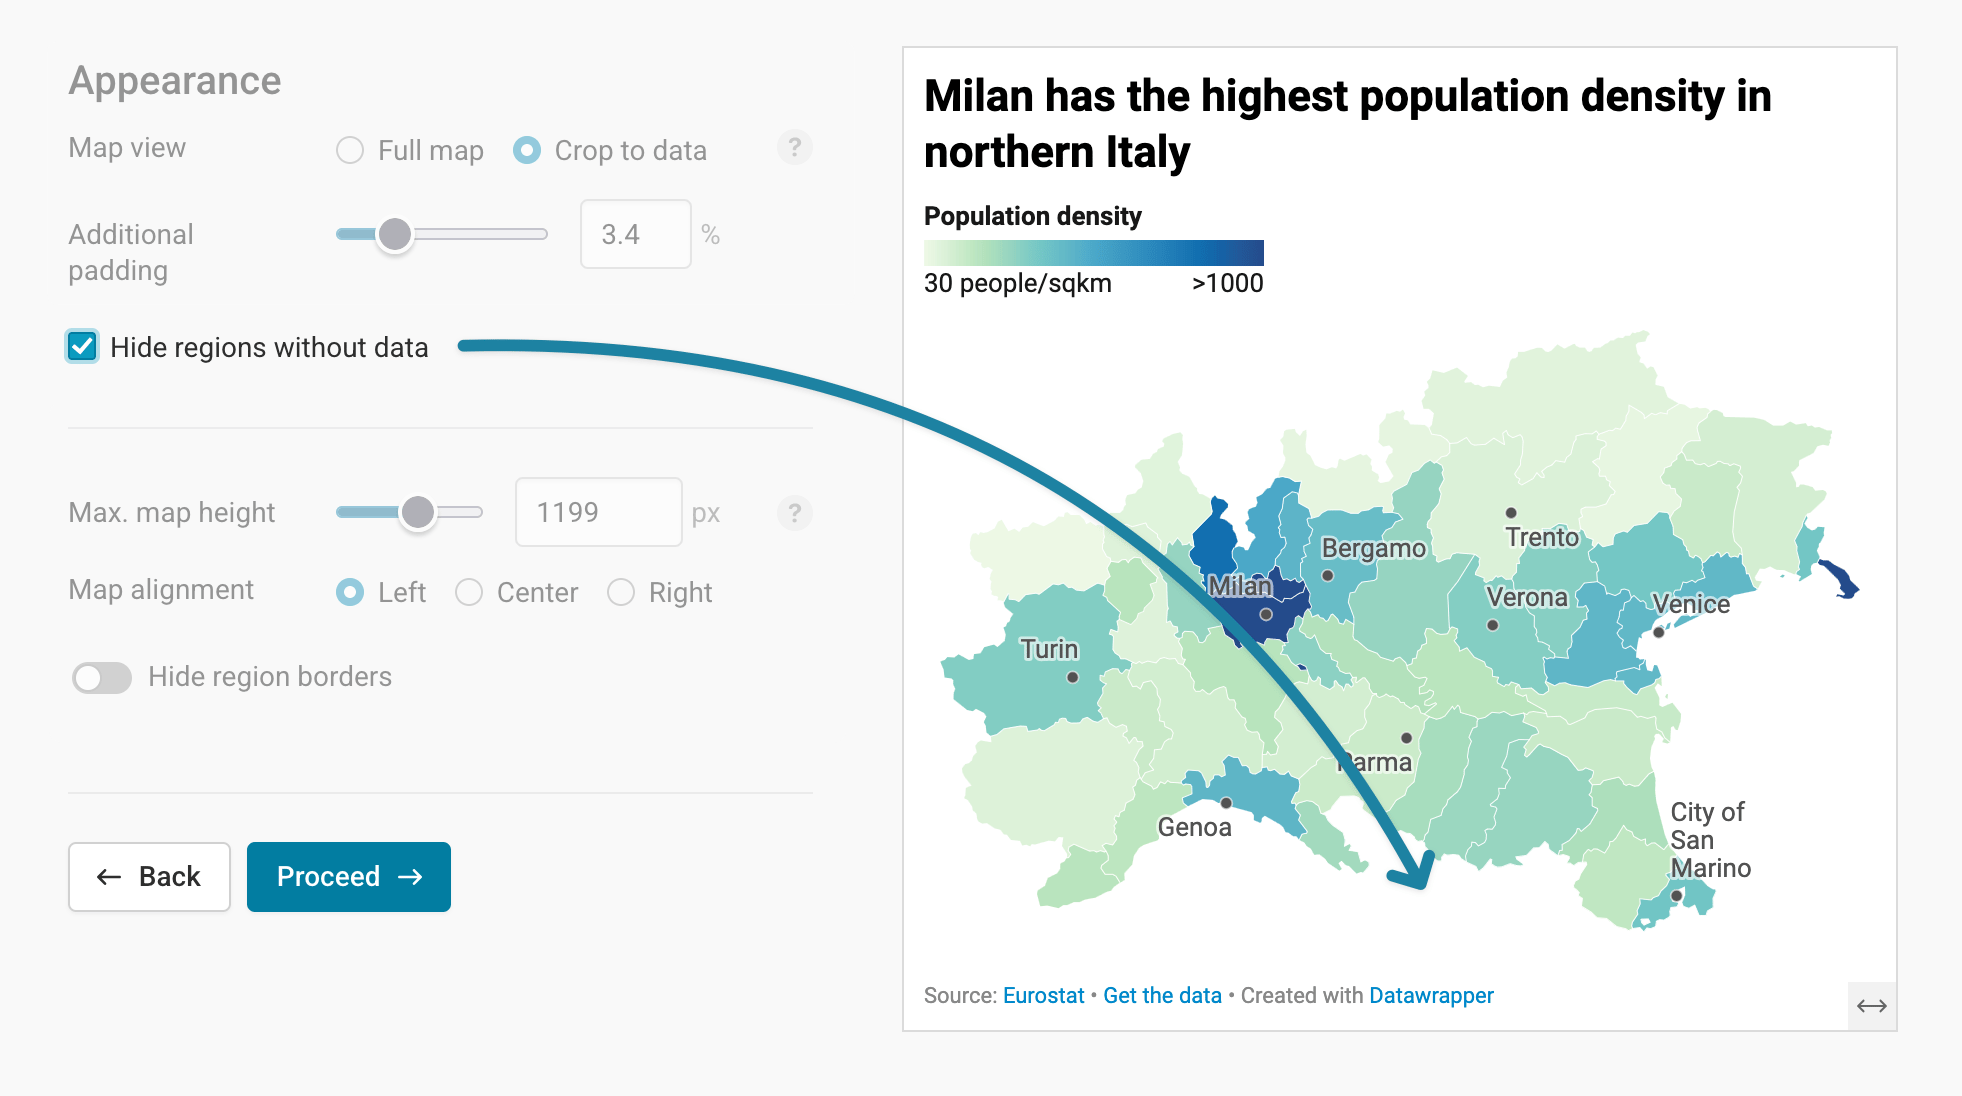
This way, your regions appear a little bit like an island. Consider if this is intuitive to your readers in your specific case.
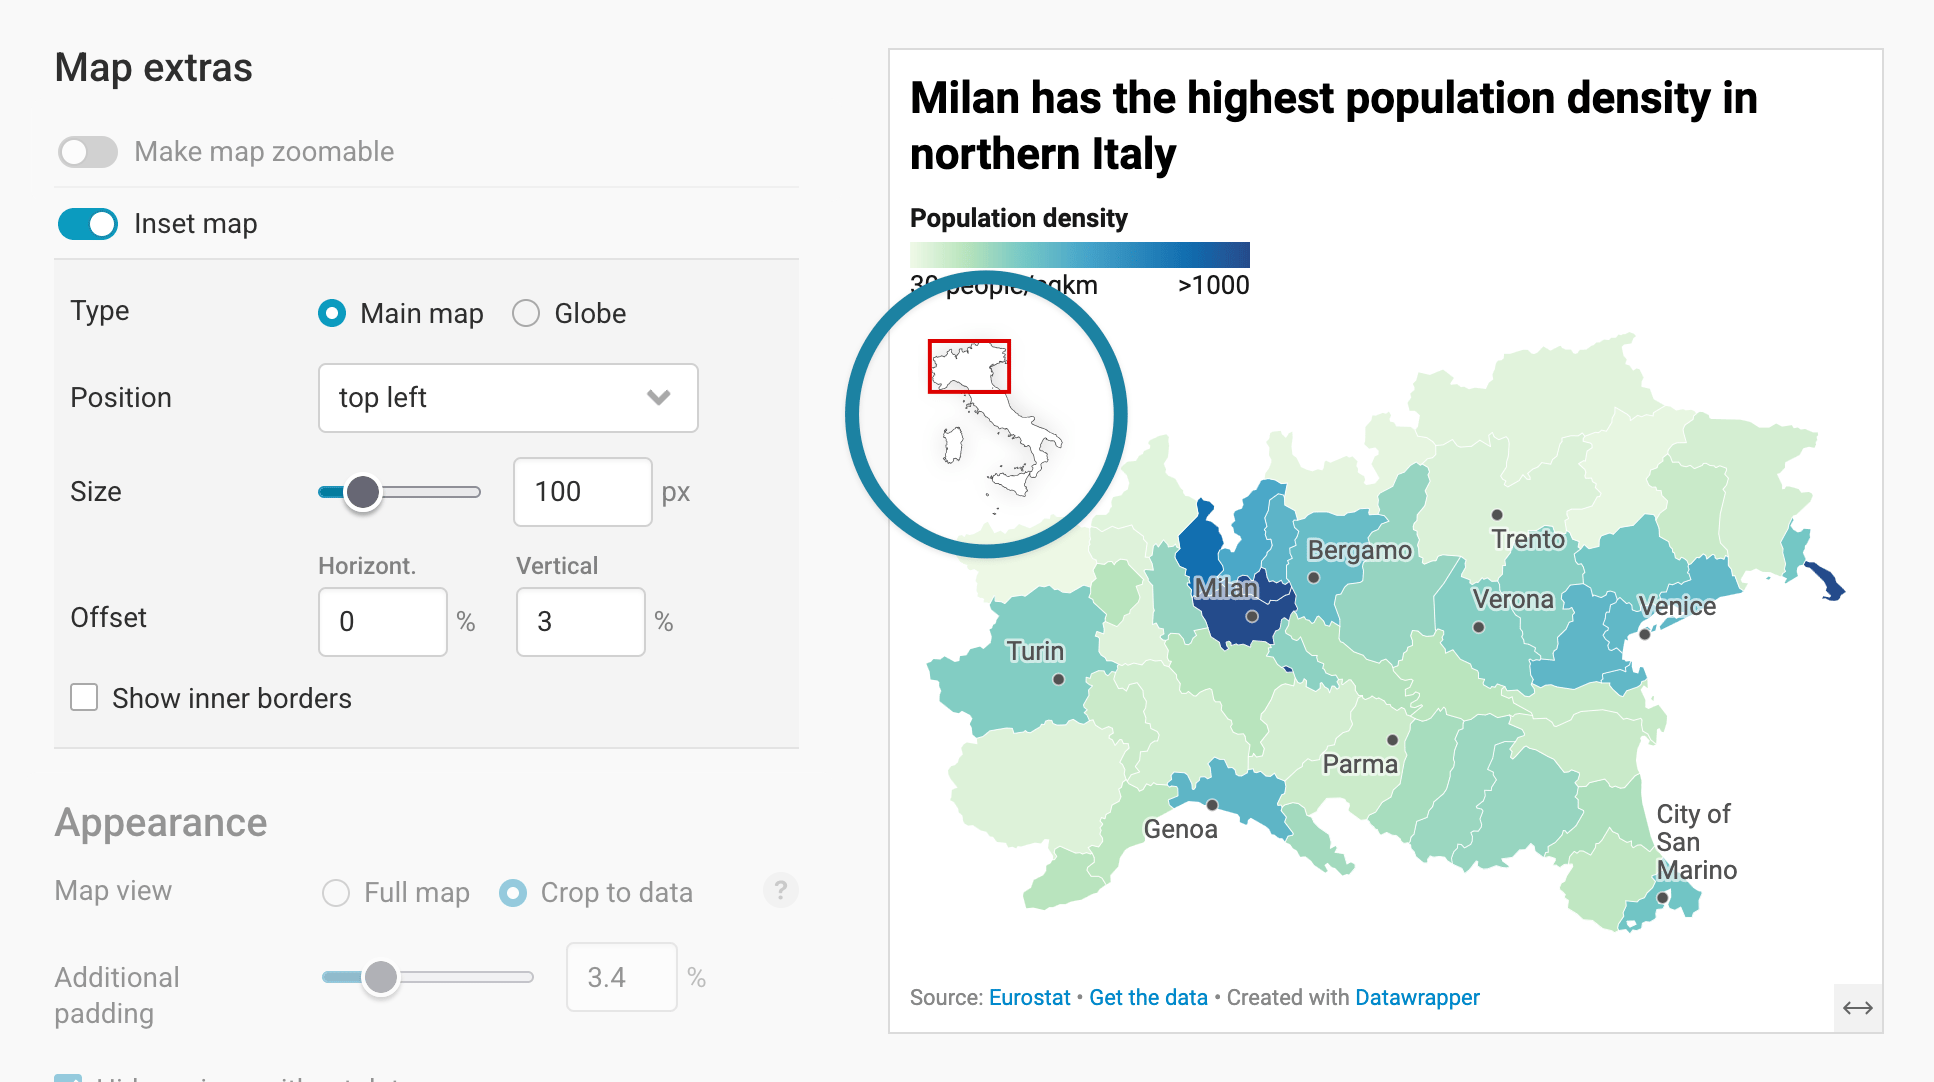
Recommended: Show an inset map
While readers will likely know the outline of a whole country you're showing, they might have problems orientating themselves when you hide certain map regions. An extra inset map of the main map or the whole globe will help here. Scroll up to Map extras and then turn on the Inset map, then adjust the position, size, and offset of your extra map:
To help your readers to know where's where, we also recommend to add map labels. You can do so in the Annotate tab. Learn more about map labels here.