How to set defaults for all visualizations in your workspace or team
If you're a workspace or team admin, you might want to make some decisions about visualizations that apply to the whole workspace or team. That's what the configuration part of your workspace are for. For example, you can decide on a default locale, embed code, or folder.
Those defaults can streamline the process by making sure all visualizations have the same configuration. You can set defaults either on the workspace level (so that they apply to all teams in your workspace), or override them on the team level. For example, you can decide to add a custom field in visualizations of all teams in your workspace, but give each team a default custom theme. Once you set them up, these defaults will apply to newly created visualizations.
Your workspace and team members will still have flexibility on a case-by-case basis for some of those settings, as they can be adjusted for individual visualizations as needed, directly in the visualization editor. We explain how below.
Contents
- Where to change your Workspace preferences
- Preferences: Default theme
- Preferences: Default locale
- Preferences: Default embed code
- Preferences: Default visualization size
- Preferences: Preview widths
- Integrations: Set up notifications
- Custom fields: Capture additional metadata
- Formats: Customize file exports/downloads
- Rules: Decide which options your team members have
- Team preferences: Change the default folder
- Override workspace defaults on a team level
Where to change your Workspace preferences
First, log into Datawrapper. Then go to the Preferences page in your workspace settings, right below Configuration. (We cover the options above the Configuration section in this article on managing your workspace.)
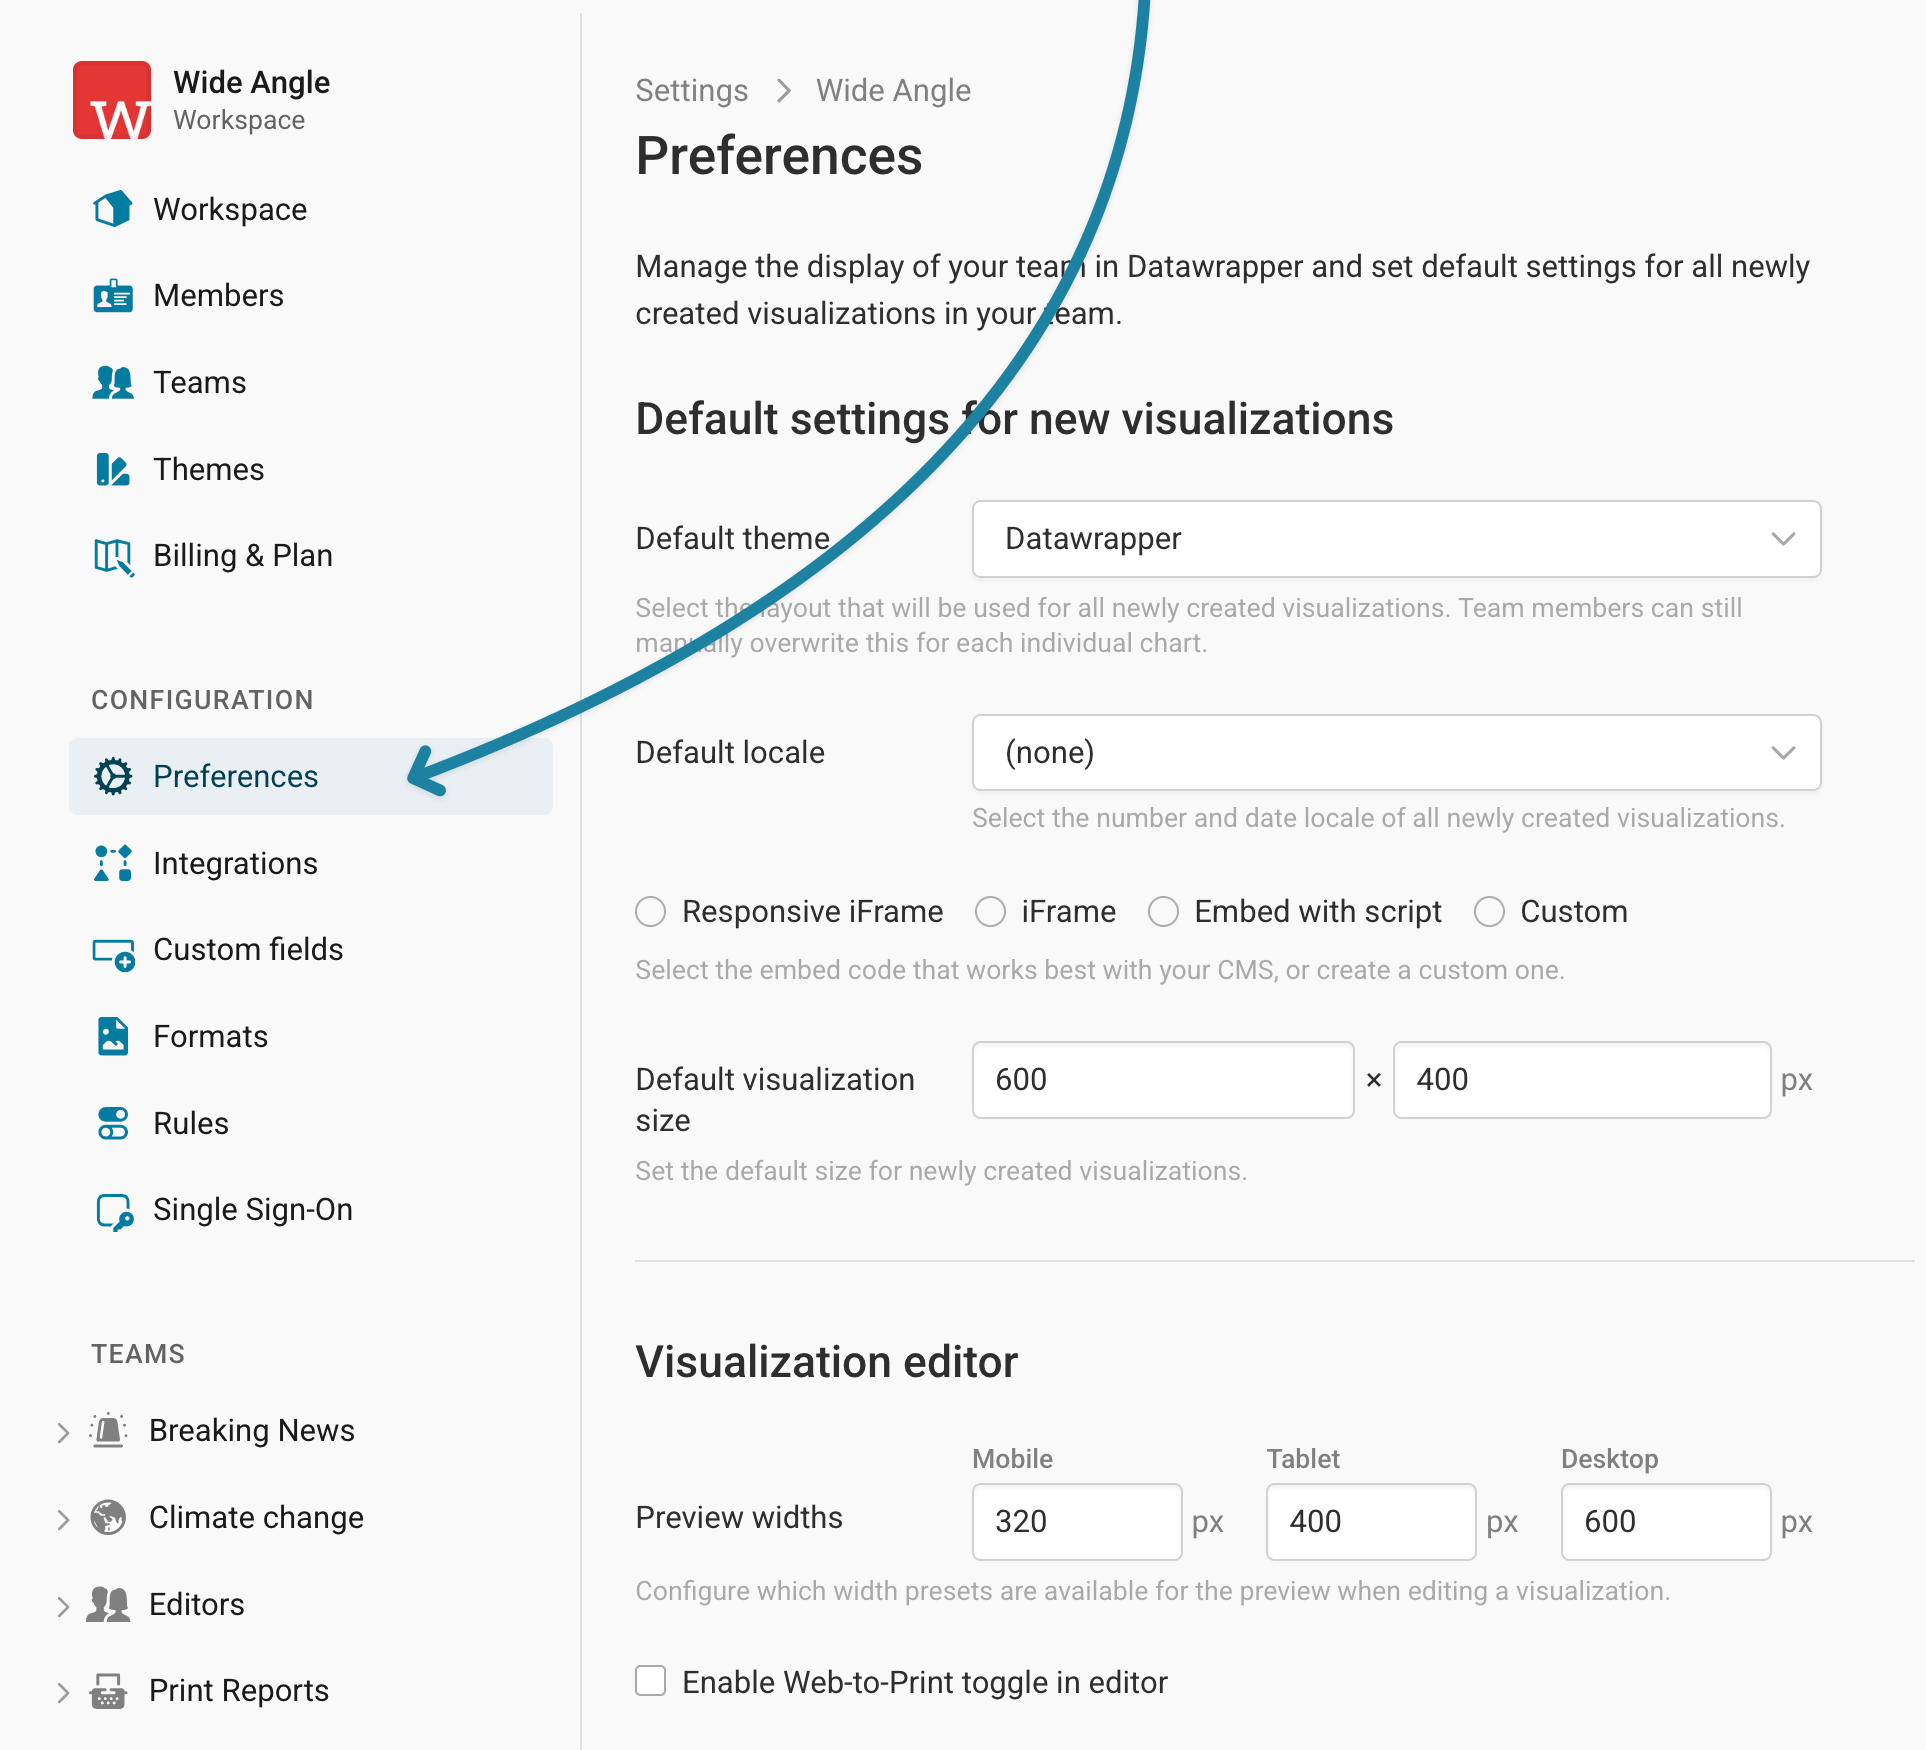
Here's what you can change on this page.
Preferences: Default theme

You can set a theme which will be used for all newly created visualizations in your workspace. That determines the style that new visualizations start with. The obvious pick is your organization's custom design theme.
Team members can still manually switch to another theme for each individual visualization in step 3: Visualize > Layout.
If you don't want your team members to be able to change the theme, go to Rules and disable Layout selector.
If you want team members to not see the Datawrapper themes in the theme selector, go to Rules > Default themes and disable Default Datawrapper themes.
If you're not paying for a custom theme, you will only be able to choose between five or so very similar variations on Datawrapper's theme, like the high contrast variation or one with an extended character set.
Preferences: Default locale

Here, you can configure what language your visualizations are created in. With this, you can make sure that dates, numbers, and in-chart elements are displayed in your language. For example, an English locale will display numbers in the "1,000.00"-format, while a German locale will display the same number as "1.000,00". Learn more about what the output locale does here.
If you're a multilingual organization, we recommend you choose the language that's used most often in the charts you'll create. When creating charts, maps or tables, you or other creators can still choose an individual locale in step 3: Visualize > Layout.
If you don't want your team members to be able to change the locale, go to Rules and disable Output locale.
Preferences: Default embed code

Here you can decide on the default embed code. Do you want to choose our responsive iFrame, an unresponsive iFrame, embed with script, or a custom embed code? Find more information about the differences in the Academy article "How to embed charts", or visit our developer docs to learn how to set up your custom embed code. If you need a custom embed code & have trouble setting it up, get in touch with us at support@datawrapper.de.
Preferences: Default visualization size

When you create a new visualization in your editor, this is the default width ⨉ height that it will have. If you're embedding using a normal, unresponsive iframe, then this will the width and height of the iframe.
The default visualization size won't always correspond to the size of the visualization when embedded. Some visualization types have fixed heights that are not customizable. Some visualization types have heights that are dependent on the width. If you're embedding using a responsive iframe, then the width will always adjust to take up the full screen. Learn more about visualization sizing here.
Preferences: Preview widths

In step 3: Visualize step in the visualization editor , you can click on the preview buttons to check that your visualization is responsive and looks good on mobile, tablet, and desktop screens:
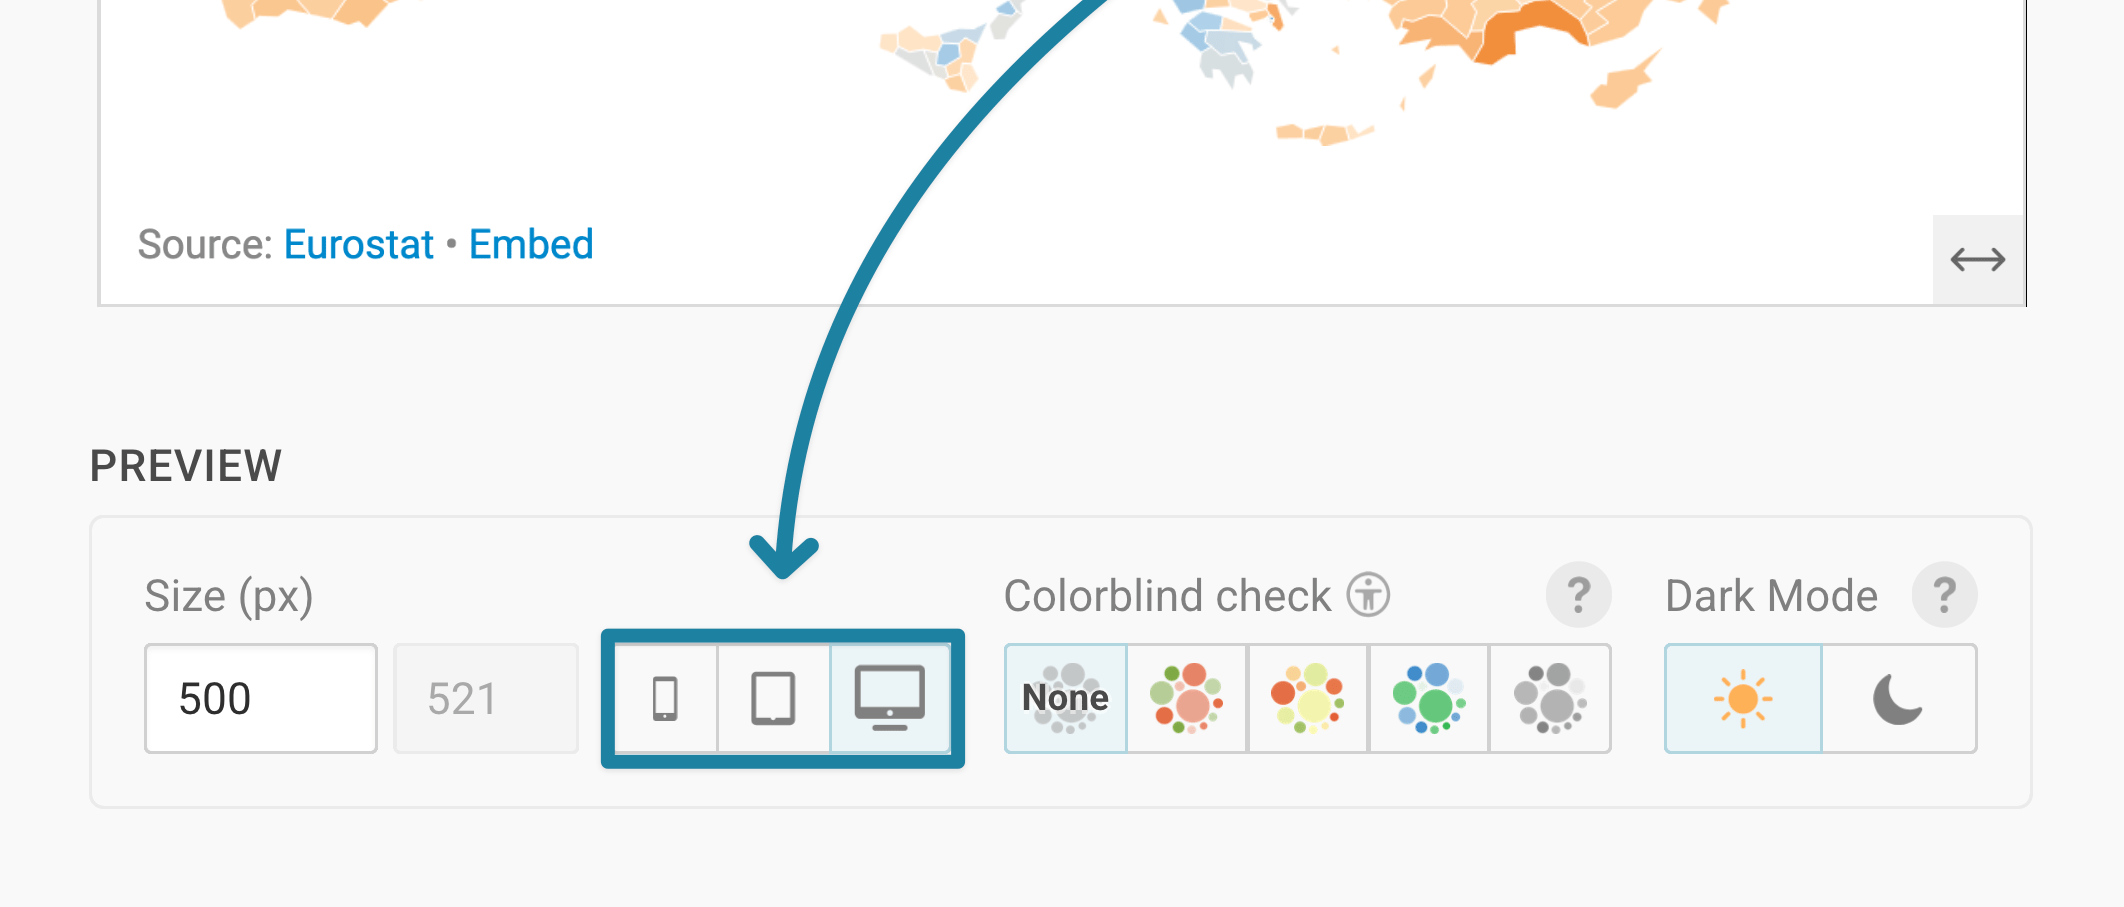
We've configured the preview widths with default presets that are commonly used (mobile: 320px, tablet: 400px, desktop: 600px) but you can also customize the values here.
Integrations: Set up notifications

In the Integrations settings, you can set up notifications whenever a visualization created in your workspace or team is published or updated. Learn more about this here:
- Using team webhooks for chart publish events (in our developer docs)
- How to set up a Slack integration
- How to set up a Microsoft Teams integration
Custom fields: Capture additional metadata

On the Custom fields page, you can add UI elements to your visualization that let you capture additional metadata (e.g. text for your embed code) and customize your visualization (e.g. to add an extra title). Learn more about how and why to set up custom fields here.
Formats: Customize file exports/downloads

On the Formats page, you can customize the file type (PNG, SVG, PDF), size, scale factor, border, etc. for the files that get automatically exported when you hit the Publish button (learn more here).
You can also customize which files user can download directly from your visualization embed (via a "Download image" and "Download data" link), and change their names (learn more here).
Rules: Decide which options your team members have

Finally, on the Rules page, you can choose which visualization features and visualization types will be available to your workspace or team members. Disabled features will not show up in the editor.
Team preferences: Change the default folder
You can find all the options we covered so far for the workspace level on the team level, too (see next section). But there's one exception – a setting that doesn't make sense on the workspace level: For each team, you can define a default folder. With that, you can change the folder in which all team charts land by default (you can still drag them to other folders from there).
To do so, make sure you've created at least one folder in your team in the Archive. Then select your team in your settings ❶ and go to Preferences ❷. Now select your new default folder ❸:

Now, when you create a new chart, map or table in that team, you will see the folder you chose as a default folder in the top left of your visualization:

Override workspace defaults on a team level
By default, the defaults set in your workspace are inherited by all teams. But individual teams can have specific needs. You can change defaults for individual teams by selecting your team ❶, then going to the settings page for Preferences, Integrations, Custom fields, Formats, or Rules, and toggling Use custom team settings ❷ at the top:

All the settings from here on are just the same as the ones you can configure for the workspace as a whole (with the exception of the team default folder, see above).
To revert back to using the workspace settings, click on Load workspace settings.
