How to create a live-updating chart or table
Datawrapper has an option to update charts and tables automatically, without republishing. Every time a user updates a website with your chart, the chart or table will freshly get the data from the CSV.
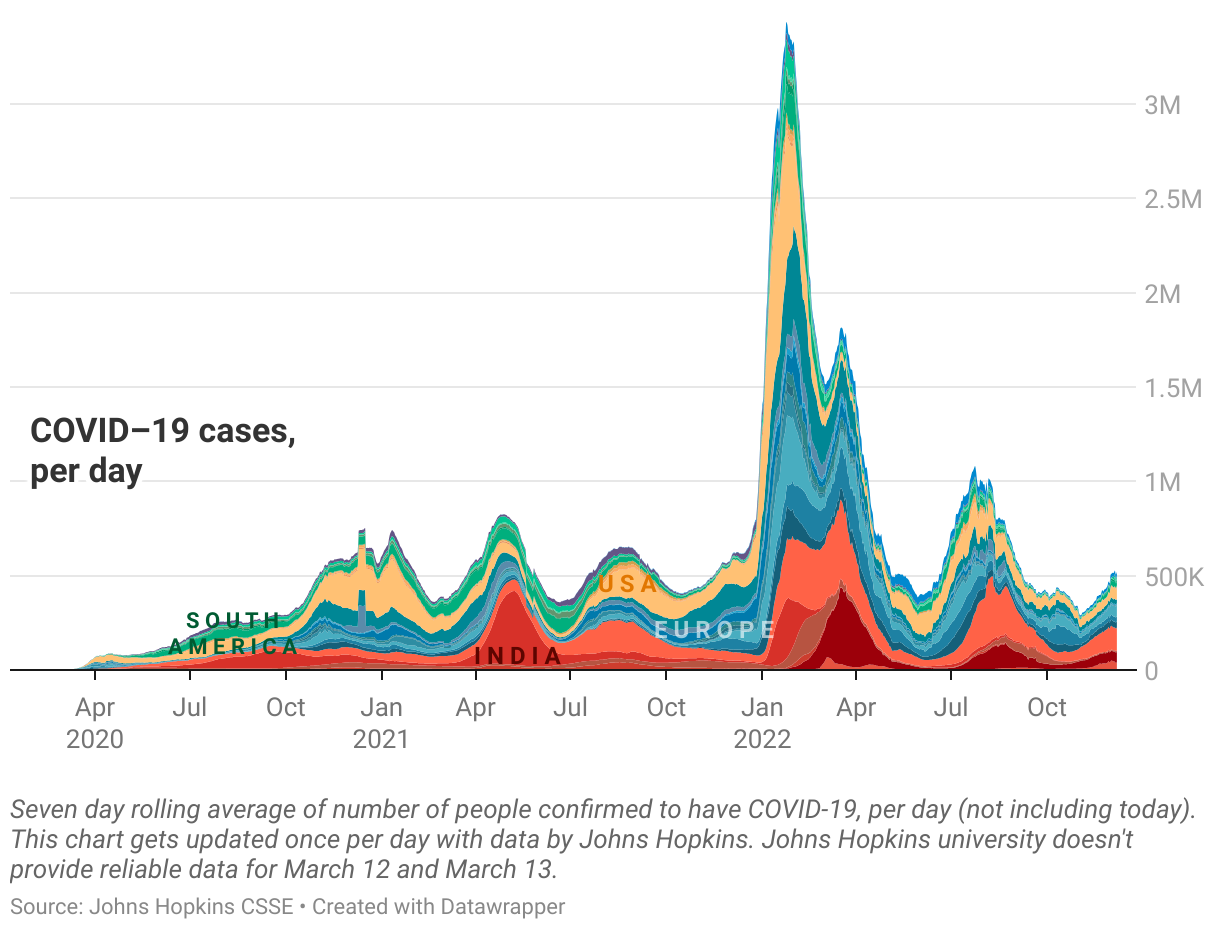
For example, here's a Datawrapper area chart that shows the COVID-19 cases per day in different continents:
This article explains how to create a live-updating chart or table with Datawrapper.
👉 To create a live-updating choropleth map, visit this article.
👉 To create a live-updating symbol map, visit this article.
Create a chart
To create a chart with Datawrapper, go to app.datawrapper.de/chart/create (you can, but don't need to be signed in to do so). You immediately arrive in Step 1: Upload data. Click on Link external dataset:

Link your data
Now you need to link to your dataset. For live-updating charts and tables, the data needs to be somewhere on the web – e.g. on a server, on Github, etc.
Datawrapper asks you to paste the address to this data. Note that it needs to be a CSV; the data can't be in the JSON/XML/TSV/etc format:

You'll see two options to link to an external dataset, using the Datawrapper server and serving your data file directly. To decide which one is best for your use case, visit our article "Options for live-updating visualizations".
Once you pasted an address, Datawrapper will show you if it's valid or not:

Check your data and customize your chart
You're almost there! Now you can go to step 2: Check & Describe to see your data...

and then to step 3: Visualize to choose a chart type and customize it:

We offer detailed information about how to visualize all the chart types we offer, like line charts, bar charts, or scatter plots in the Datawrapper Academy.
👉 If your live-updating table should show mini-columns, sparklines and heatmaps, visit this Academy article.