How to embed interactive visualizations in Notion
You can easily embed interactive Datawrapper maps, charts, and tables in Notion pages – for example, to add some explanations to your visualization before sharing them. This article explains how.
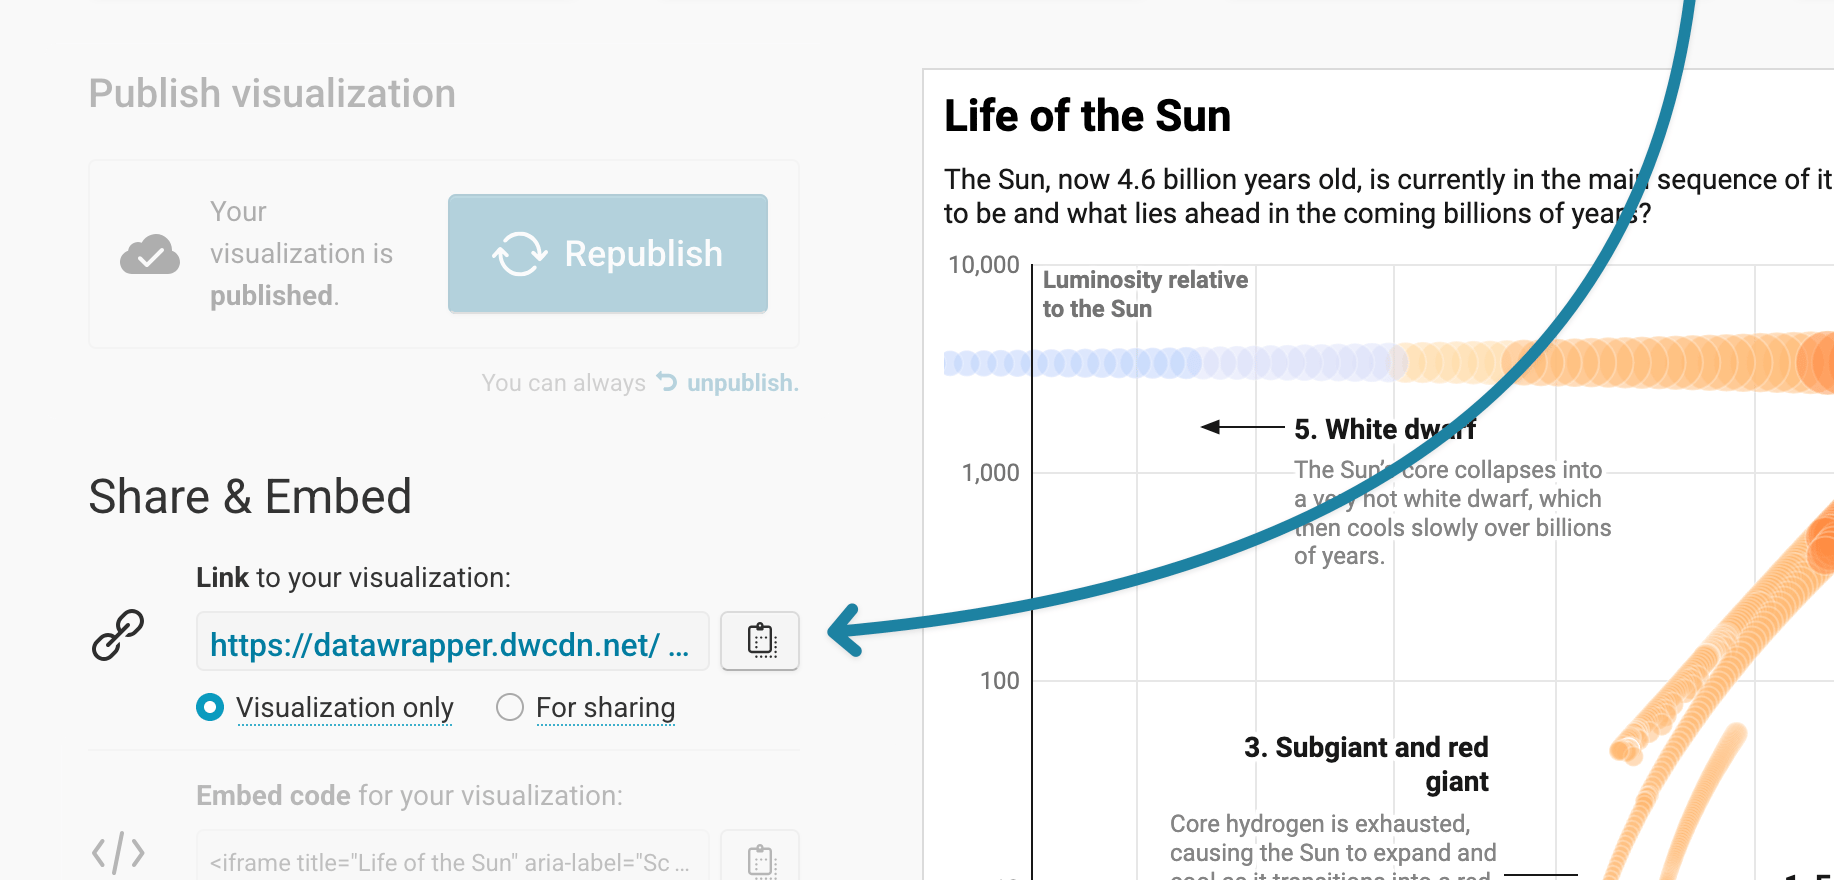
First, create a visualization with Datawrapper (like this one). Once you've published it in step 4: Publish & embed, copy the link to your visualization. You can either copy the "Visualization only" link or the "For sharing" link –Notion will embed either.
Now go to your Notion page. On a new line, paste the link you just copied. A small menu will appear. Make sure to select Embed:
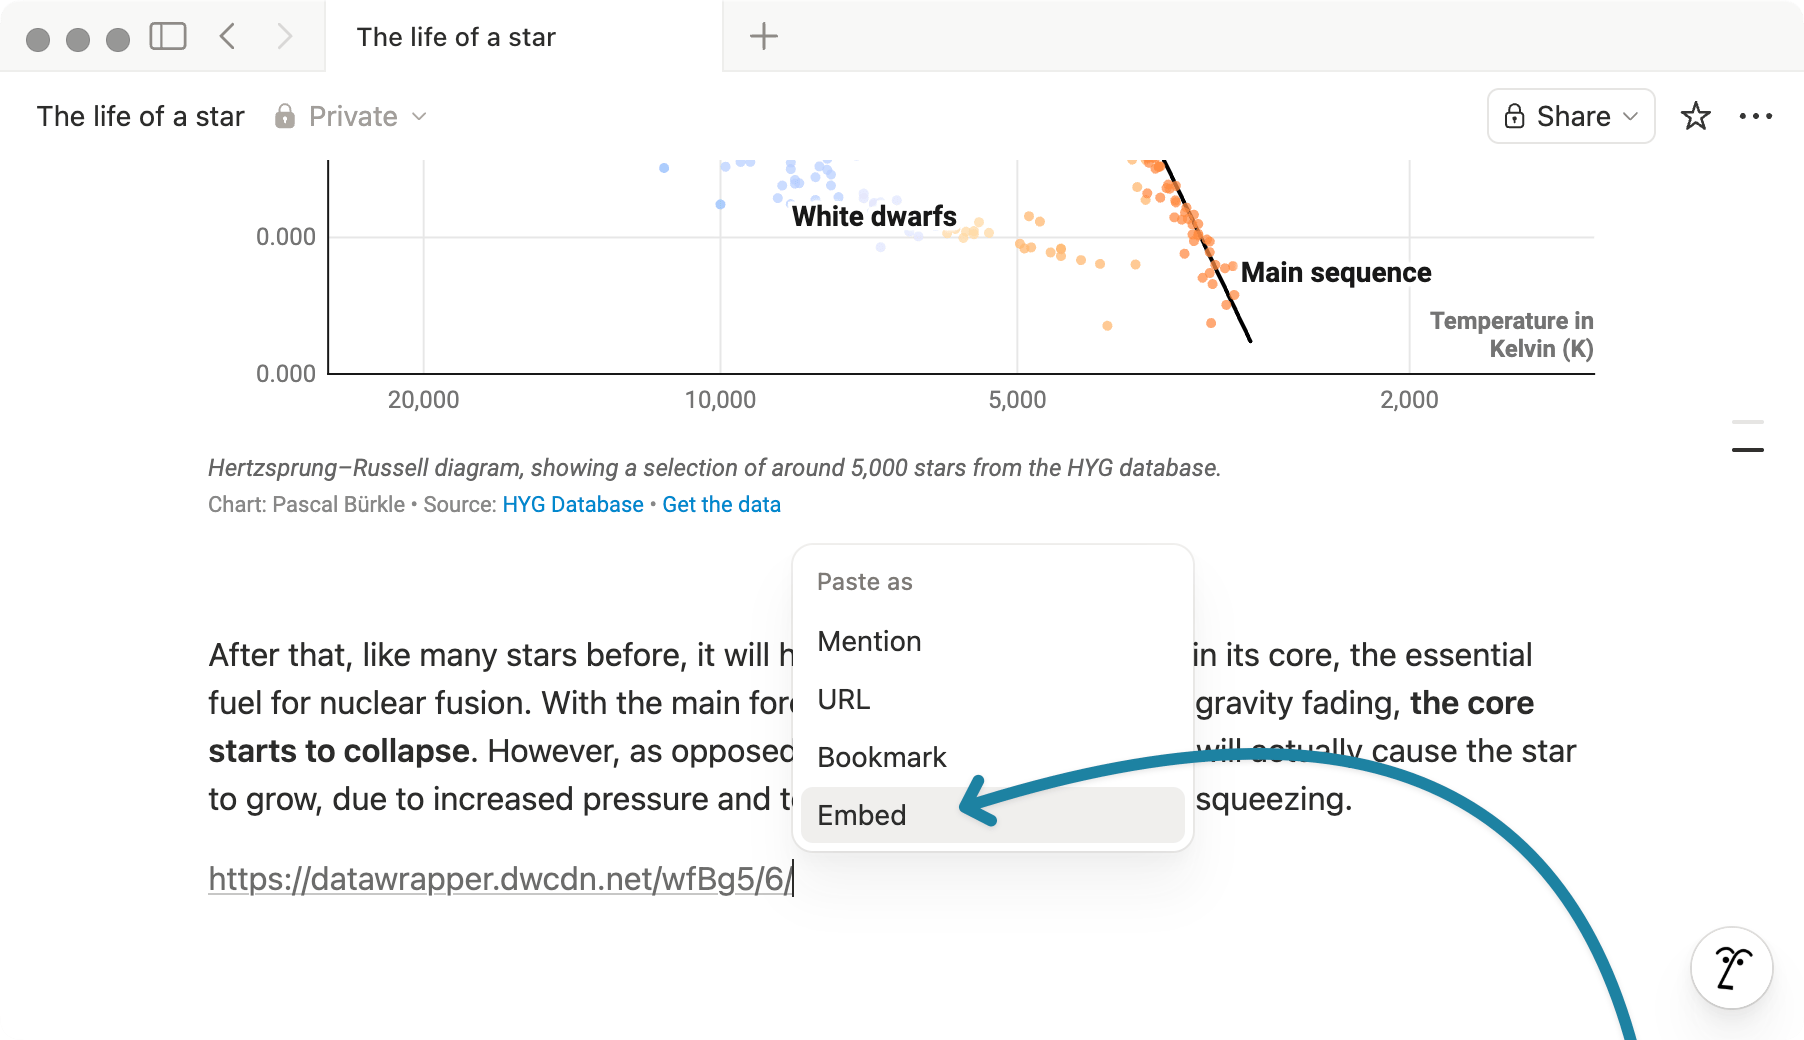
Alternatively, you can also type /embed on a new line, and paste your visualization link there.
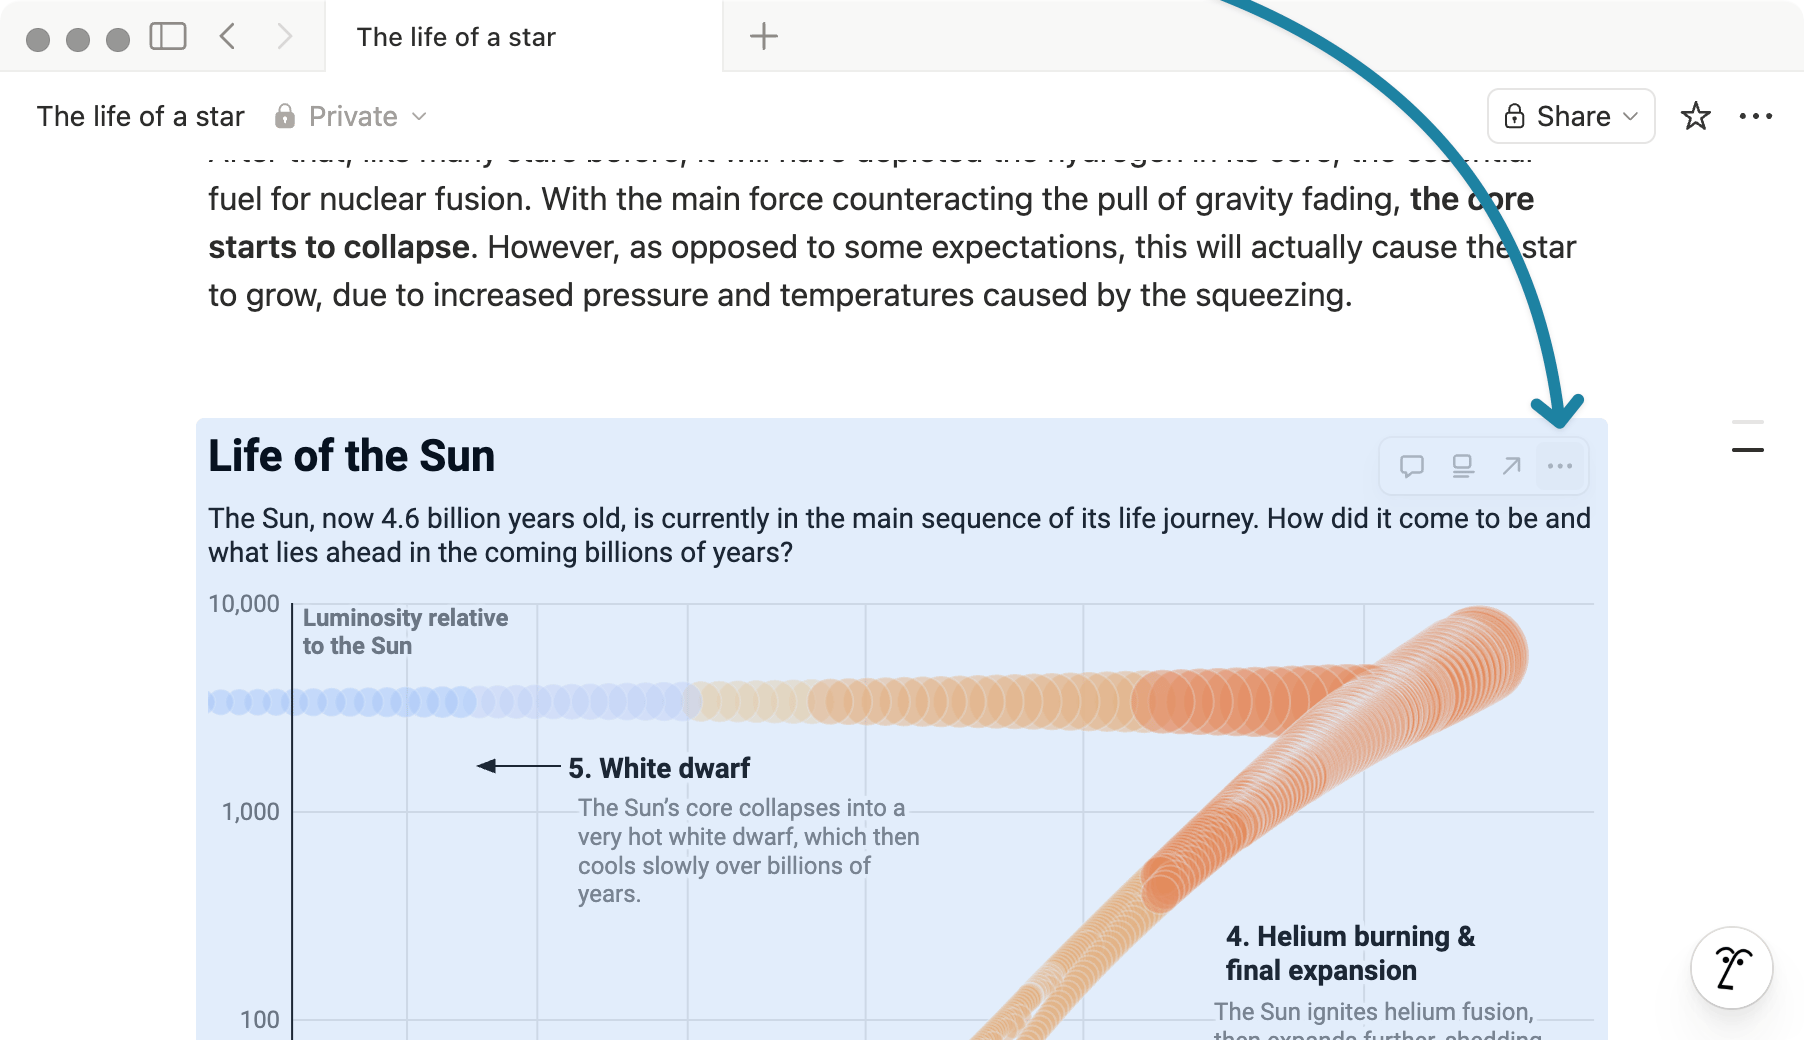
And that's it! You now have an interactive, responsive Datawrapper visualization on your Notion page.
How to replace your visualization
To replace the visualization with a new visualization (e.g. once you've updated it), hover over it and click on the three little dots that appear in the top right.
Now, simply click on Replace and add the new link to your visualization. Click Embed link, and you'll see the new visualization.
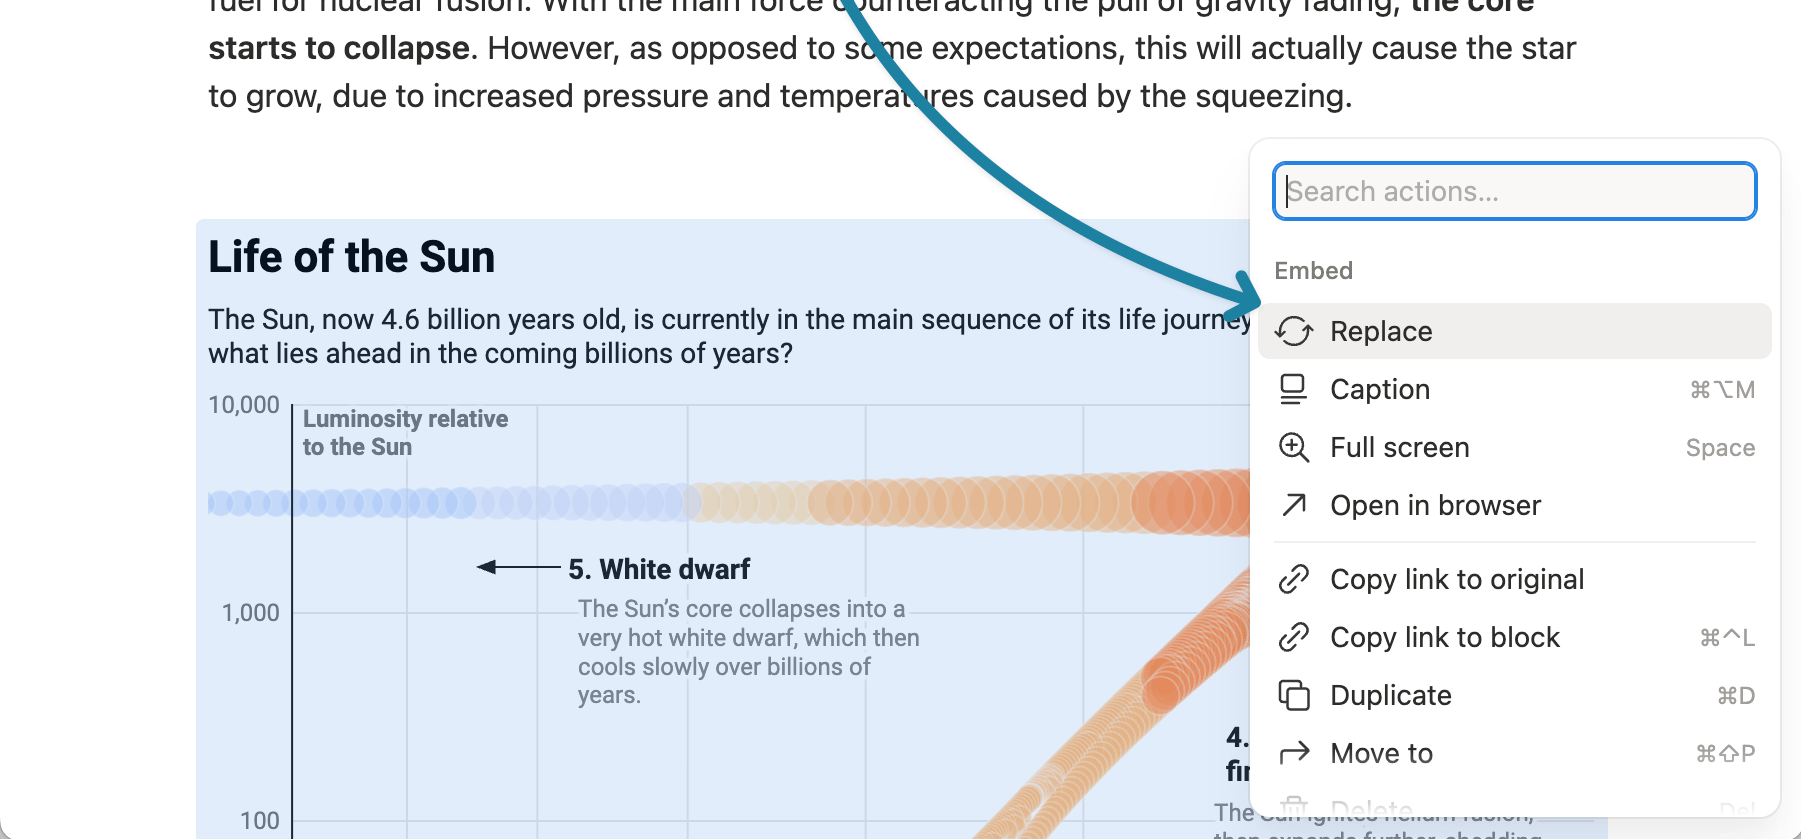
You can also use that menu to open your visualization in your browser, duplicate it, give it a caption, or delete it.
How to share your Notion page
Notion pages can easily be shared with others. To do so, click on Share in the top right of your Notion page, then on Publish and then View site. Now you have a website that you can link to just like to any other website. Find more information in the Notion help center.