Examples of Datawrapper tables
Here we have curated some examples of tables created with Datawrapper to show the possibilities that our tool offers. If you want to create an table yourself, visit the article "How to create a table".
If you want to find out how a certain table was created, hover over the chart and click on "Edit this chart" in the top right corner. This will create a copy of the table and lead you right into the step 3: Visualize of the table creation process. There you can play around with the settings or go back to step 2: Check & Describe, to find out how the data for this table was structured.
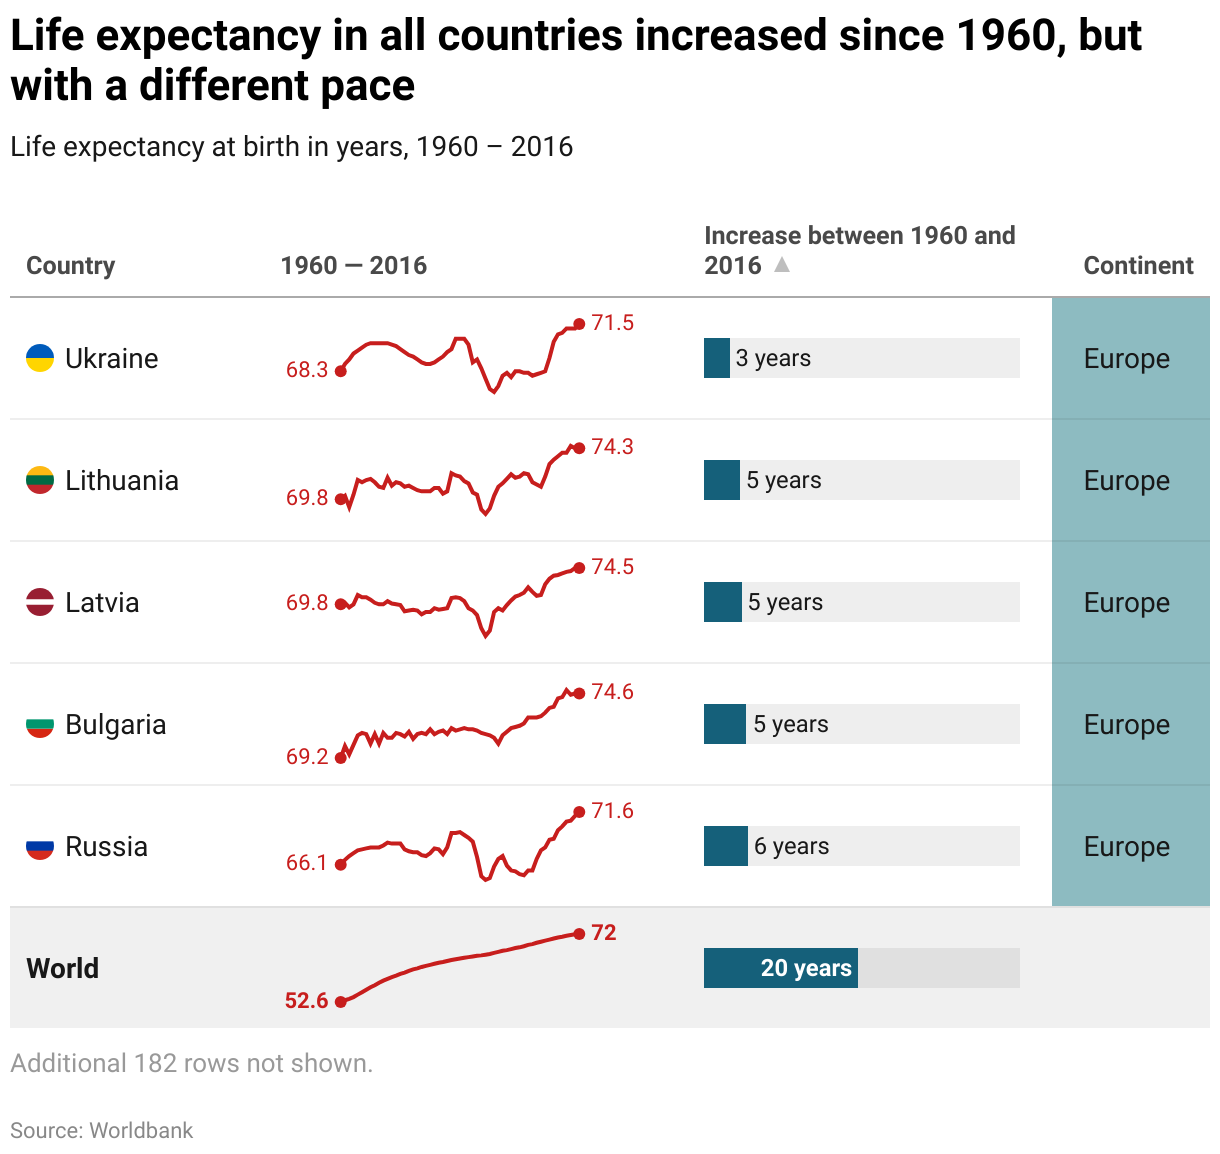
Tables with mini charts
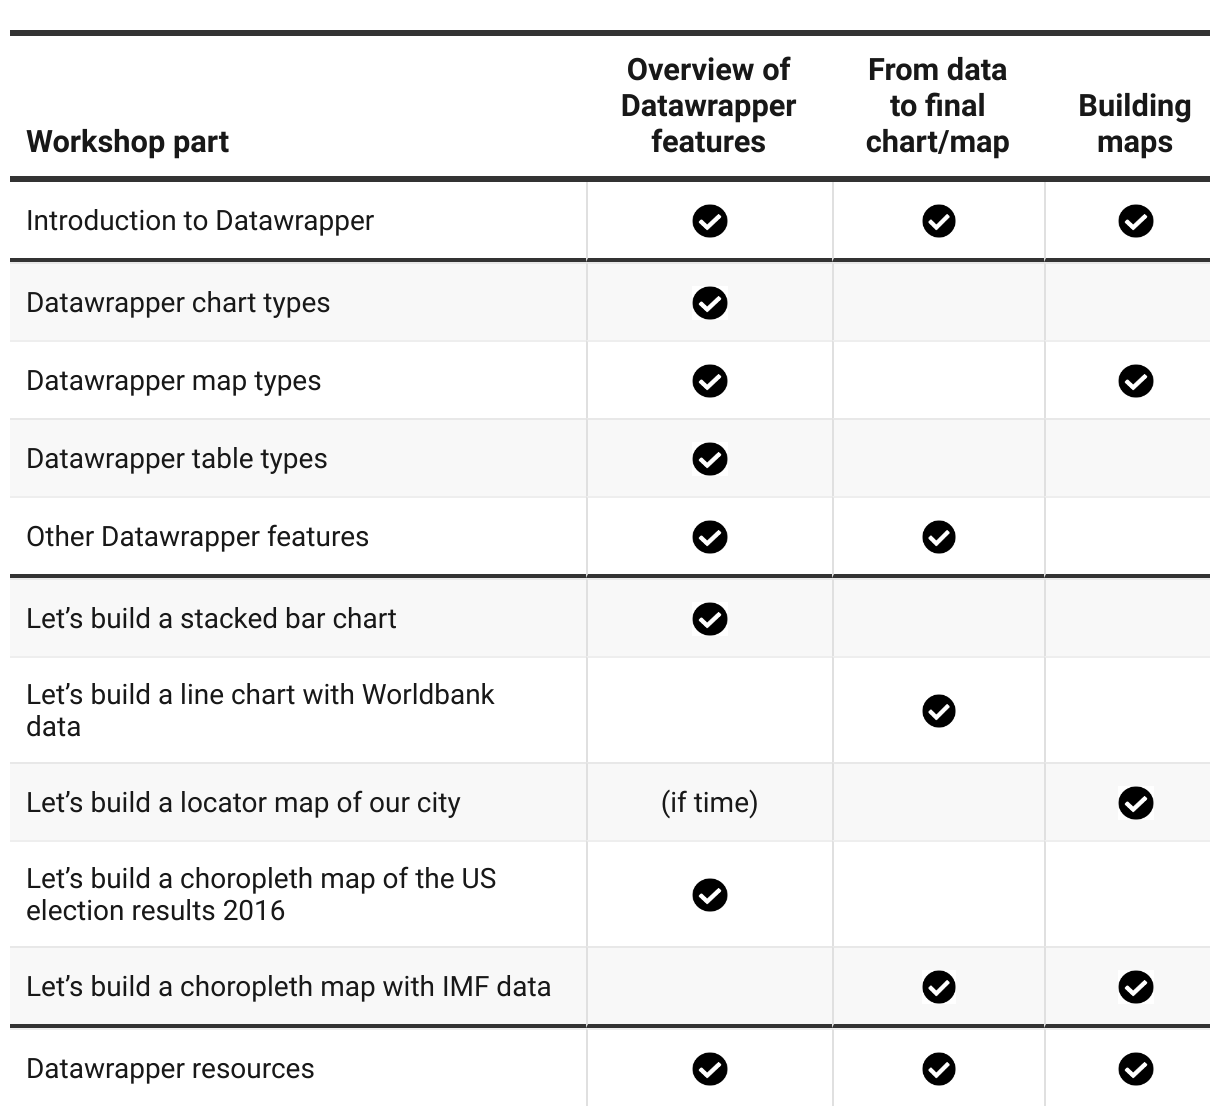
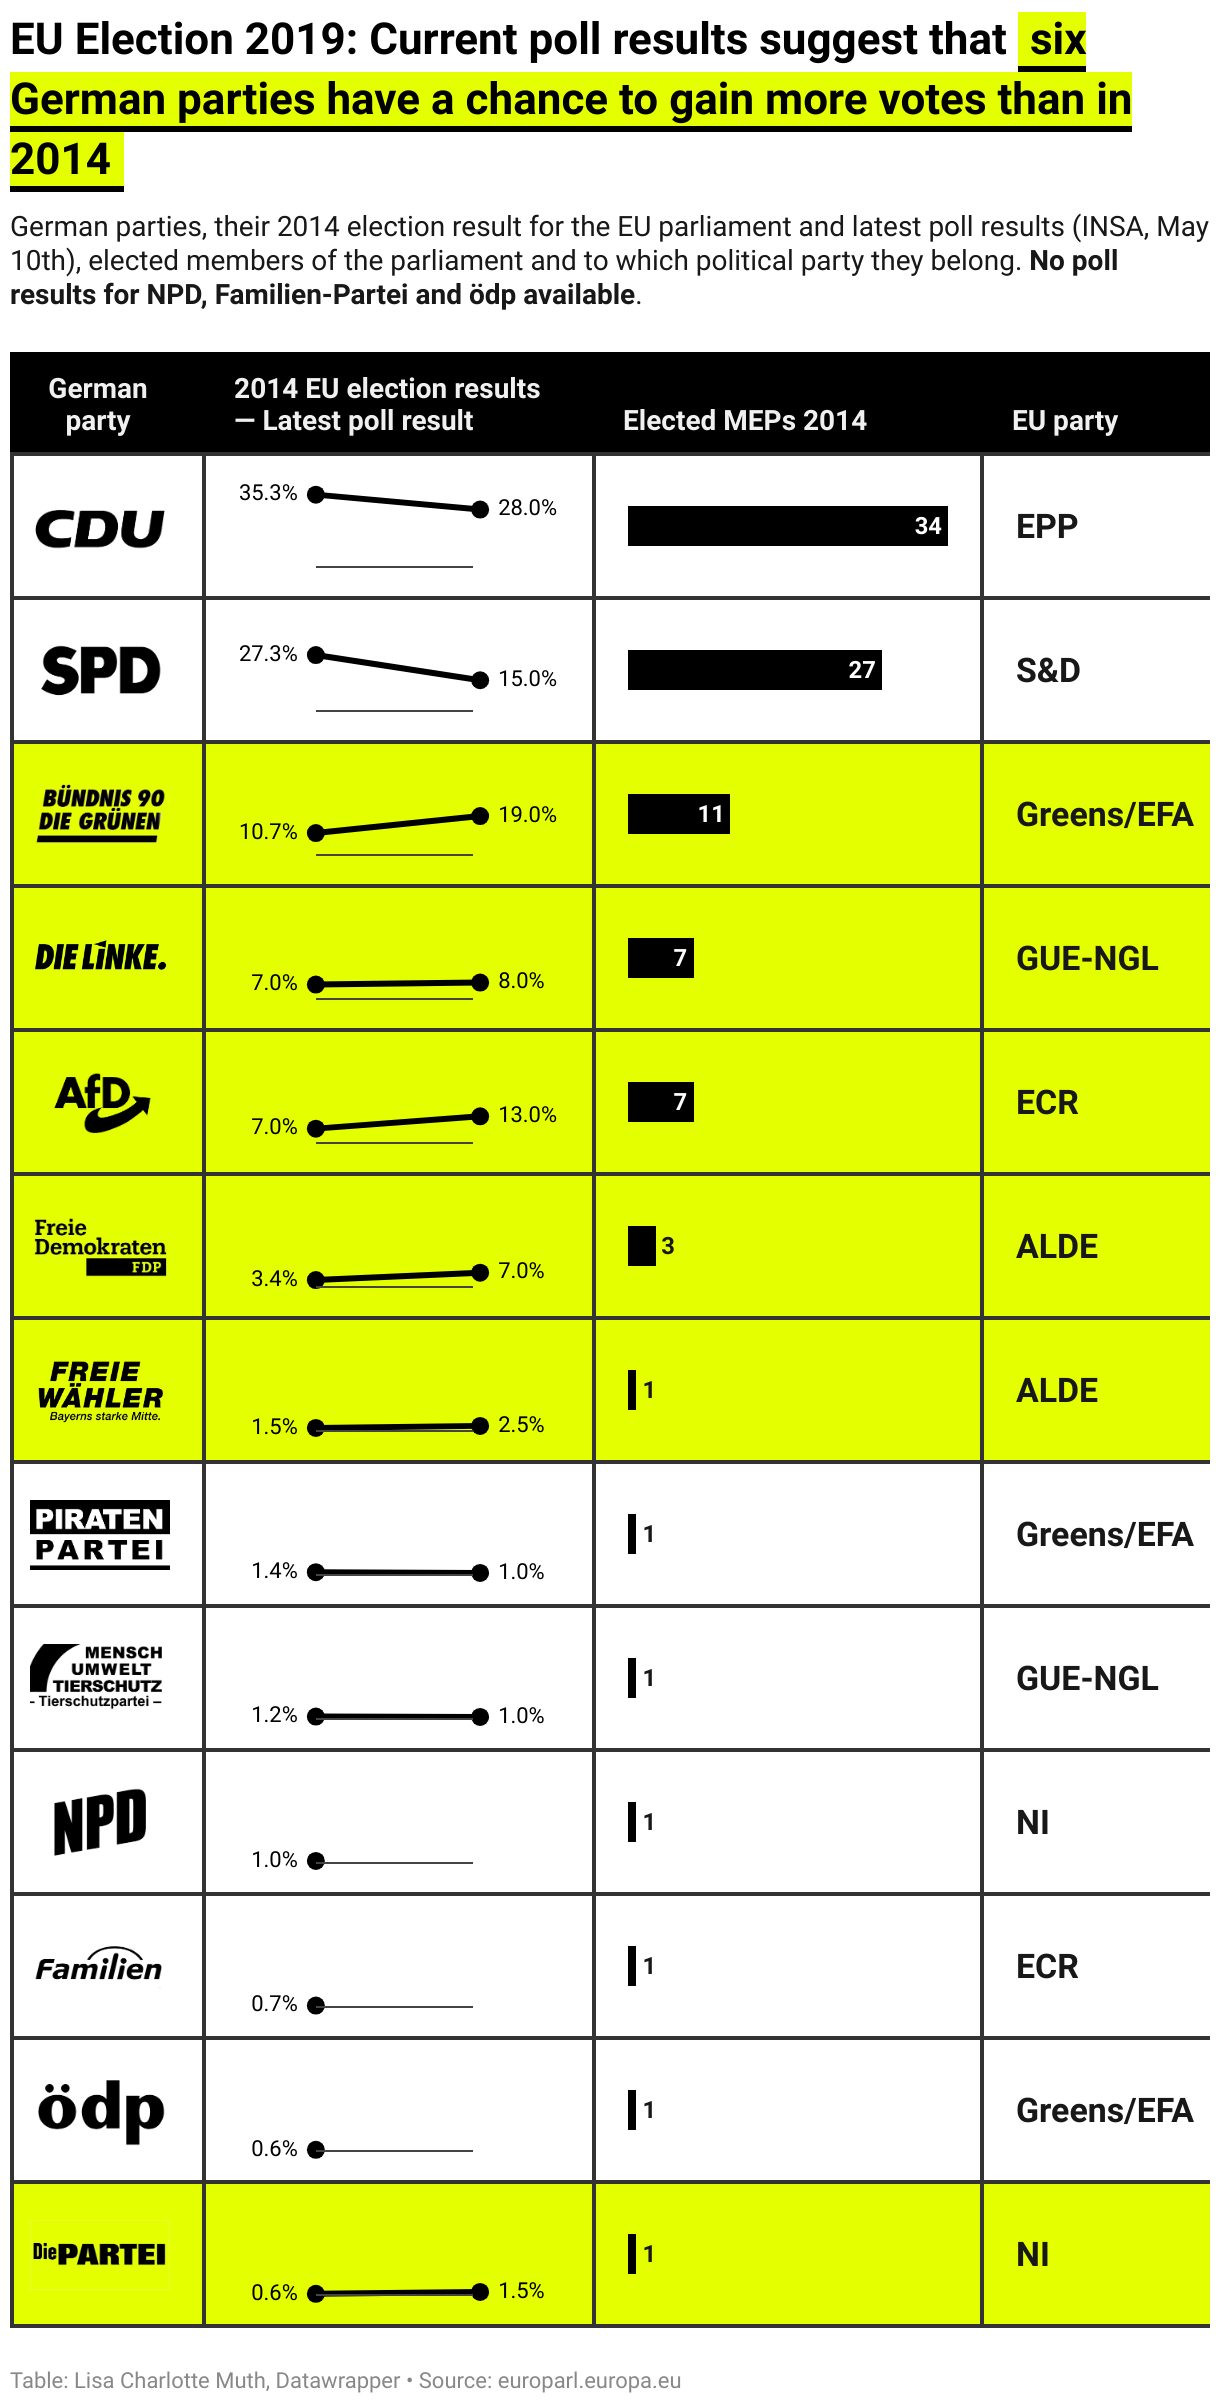
You can add line charts, column charts, and bar charts to your Datawrapper tables. Read more here: "How to add bar charts, column charts & line charts to tables"


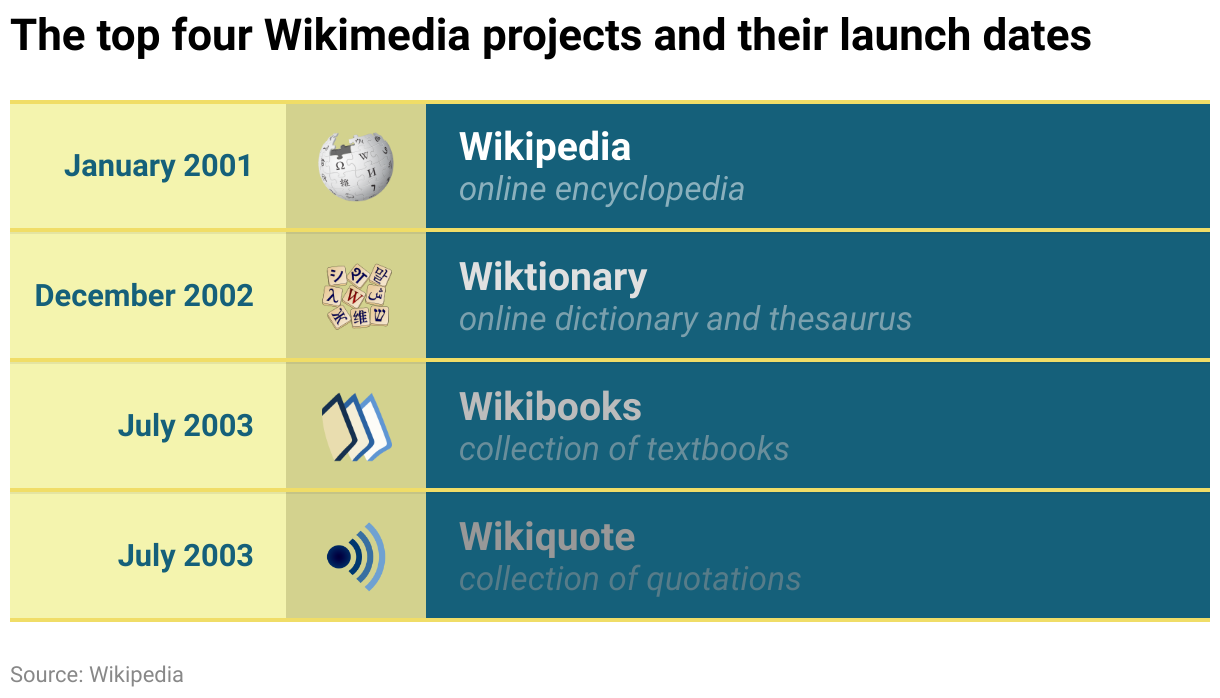
Tables with images
In Datawrapper tables, you can insert images. Read more about how to insert images in tables using Markdown.


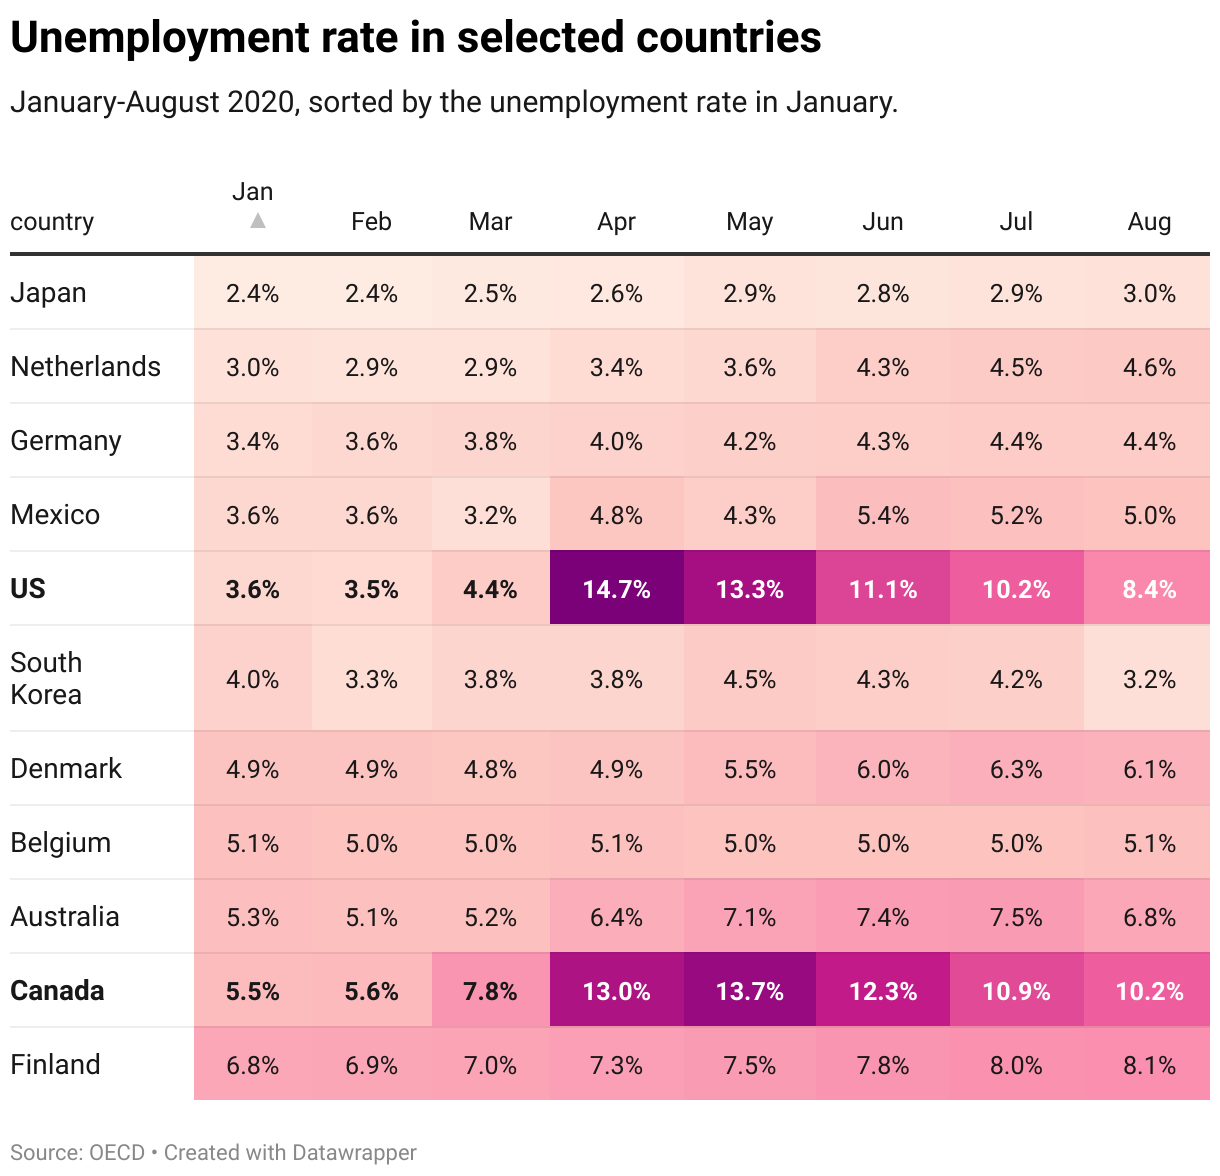
Heatmaps
You can create heat maps with AND without values. Read more about how to create heat maps in Datawrapper tables, or see more examples of Datawrapper heatmaps.
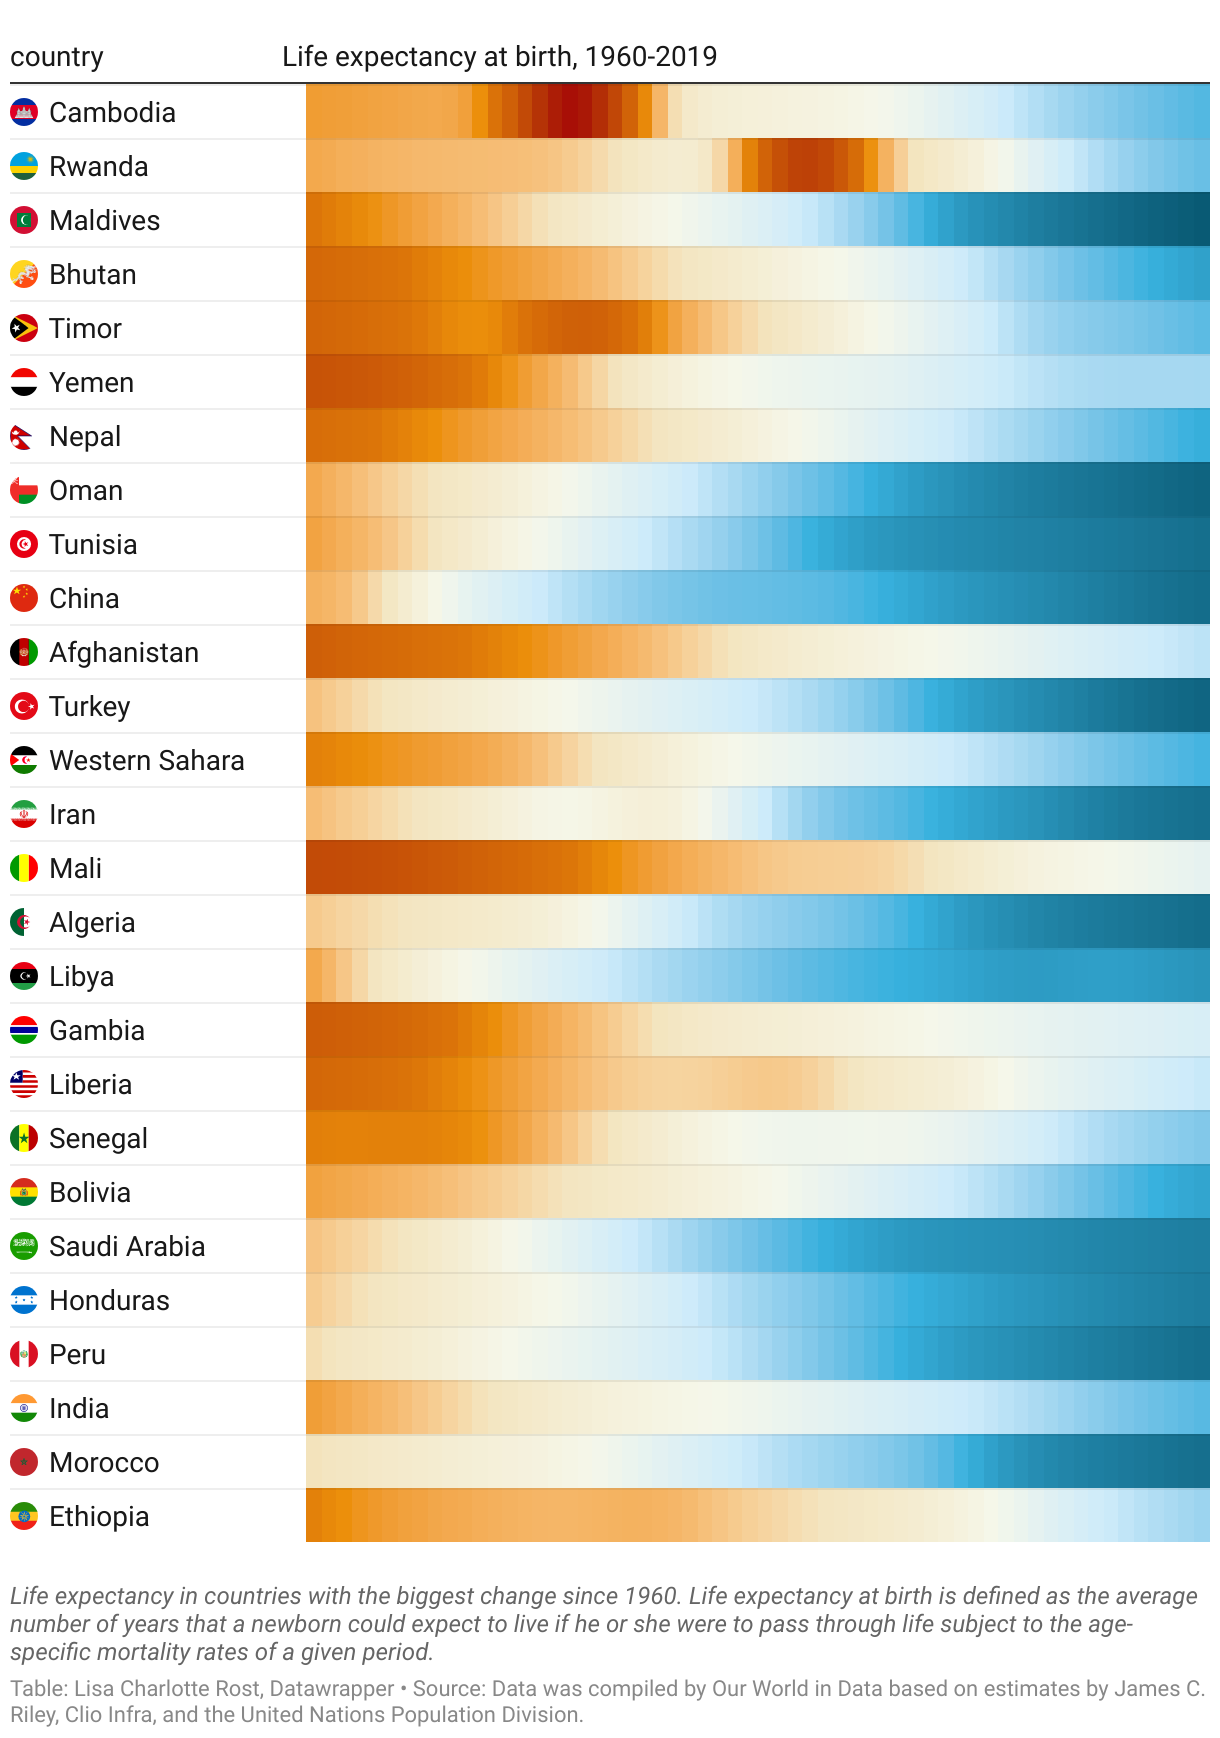
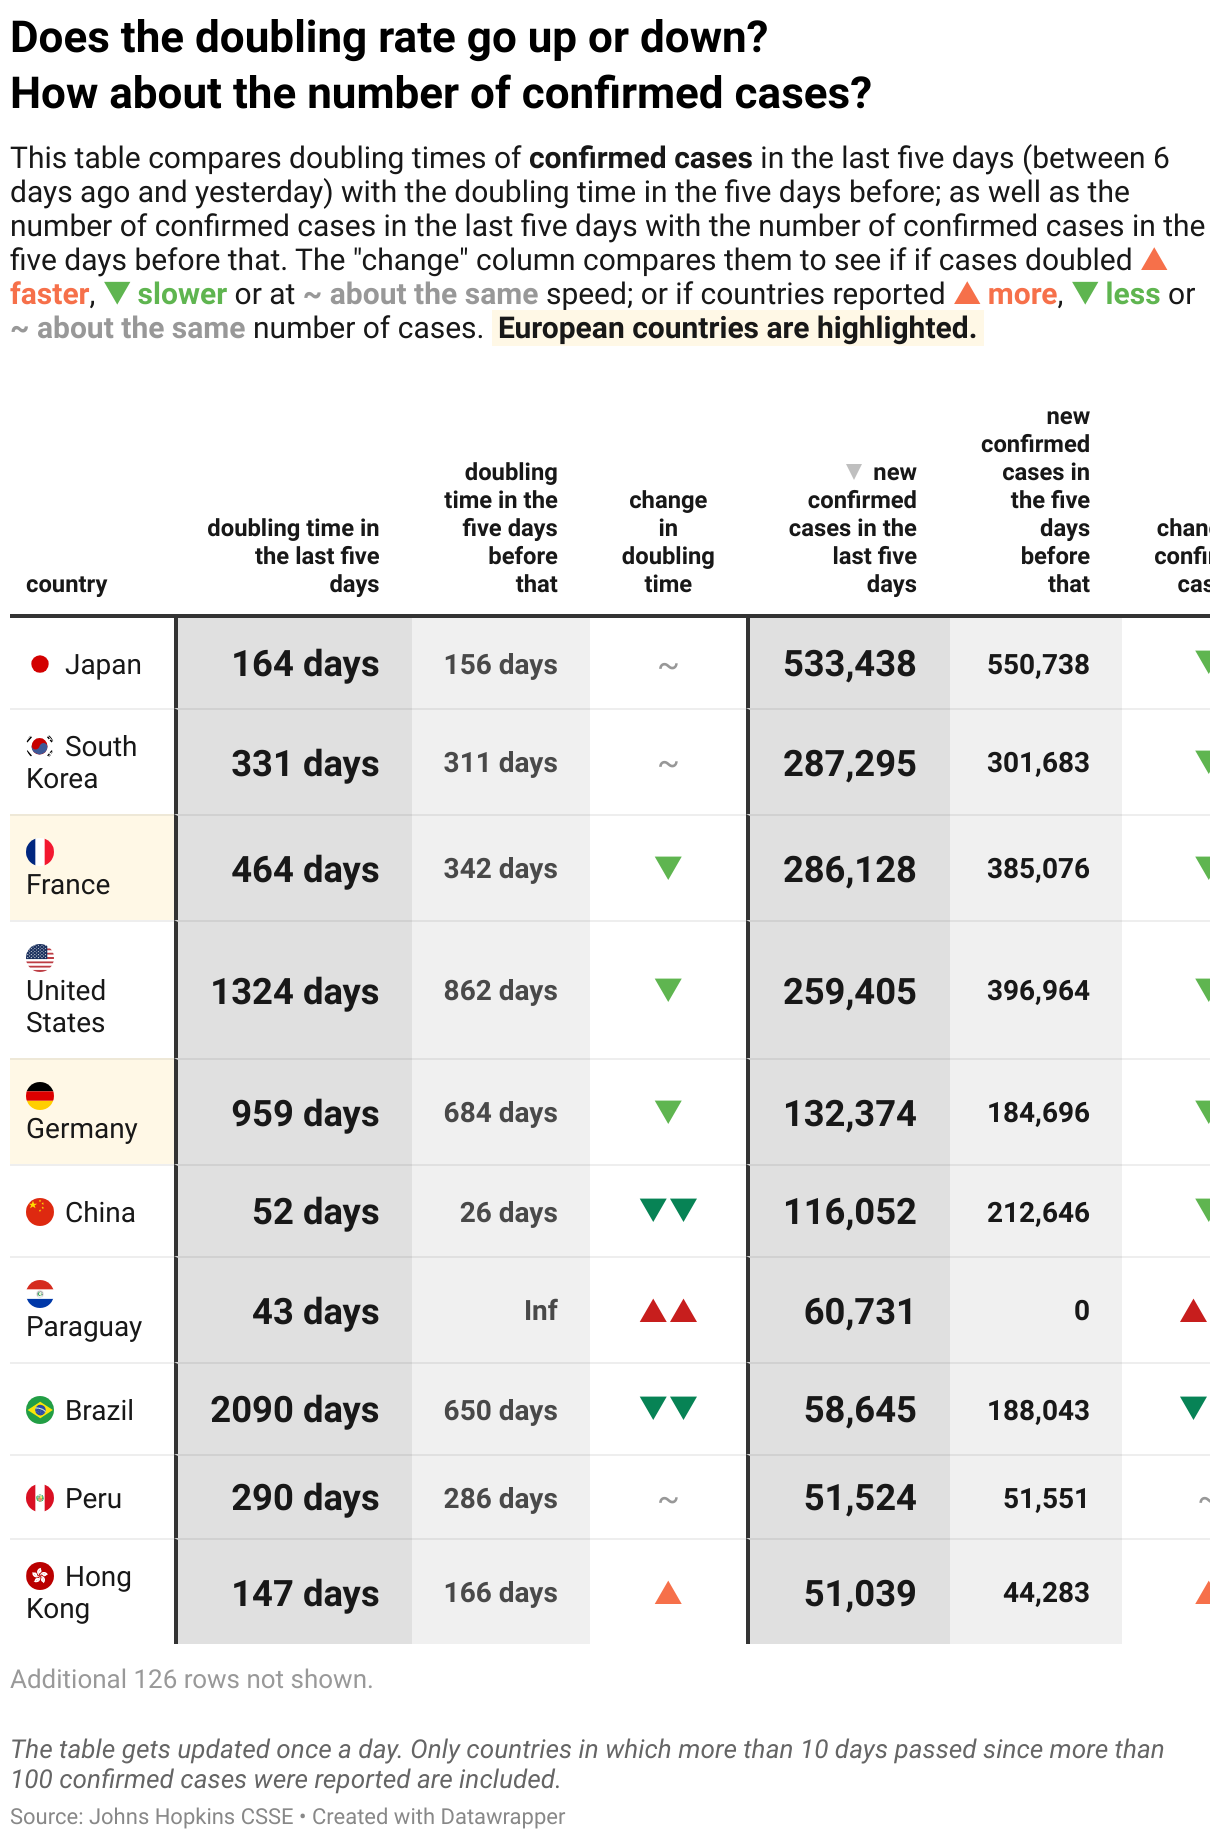
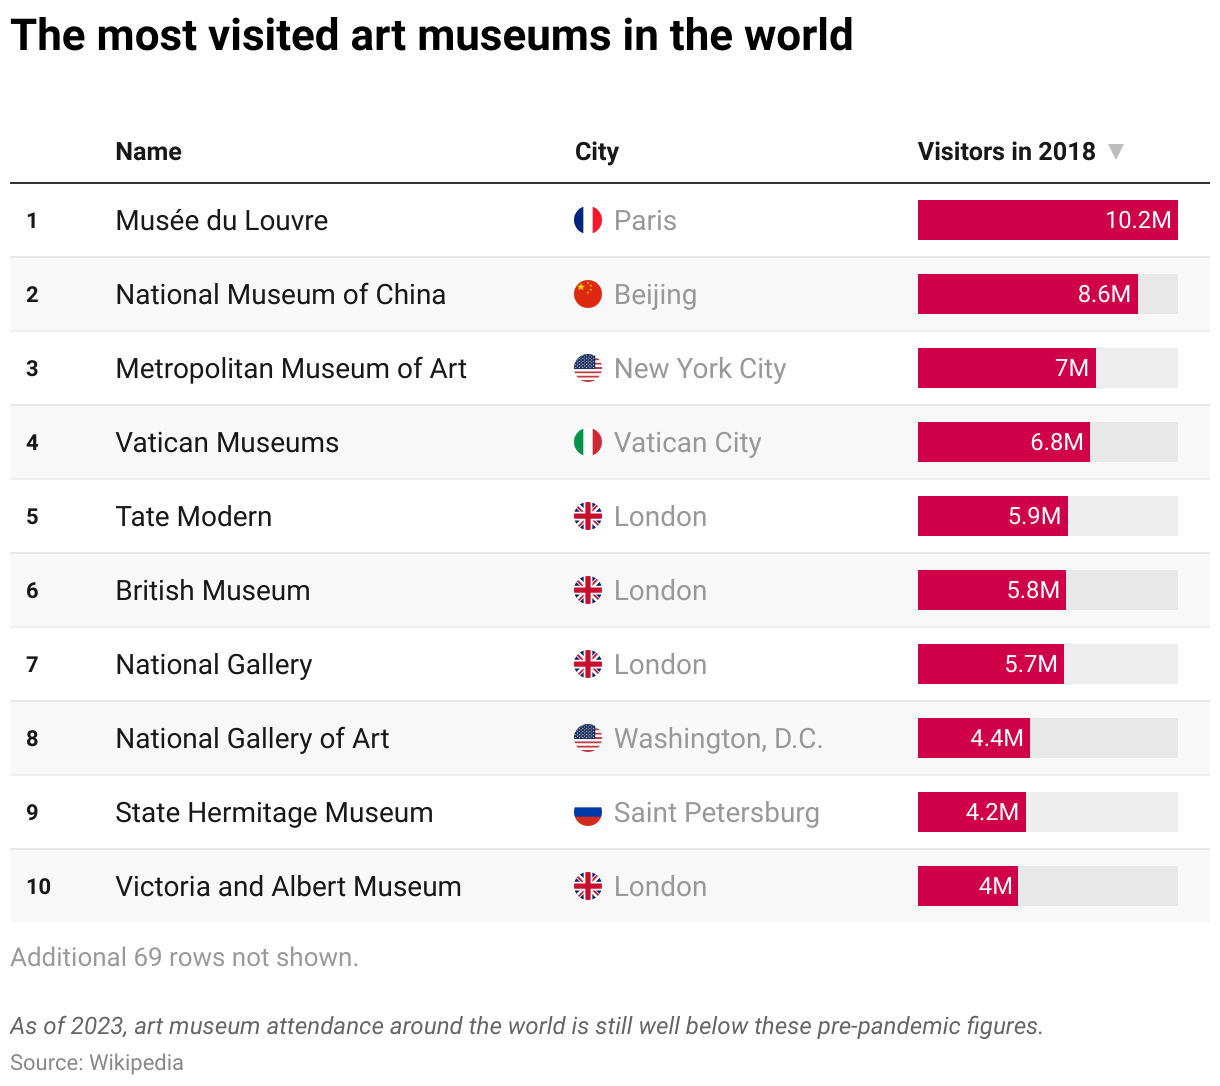
Tables with flag icons
In Datawrapper tables, you can easily insert flag icons for different countries. Read how to insert flag icons here.
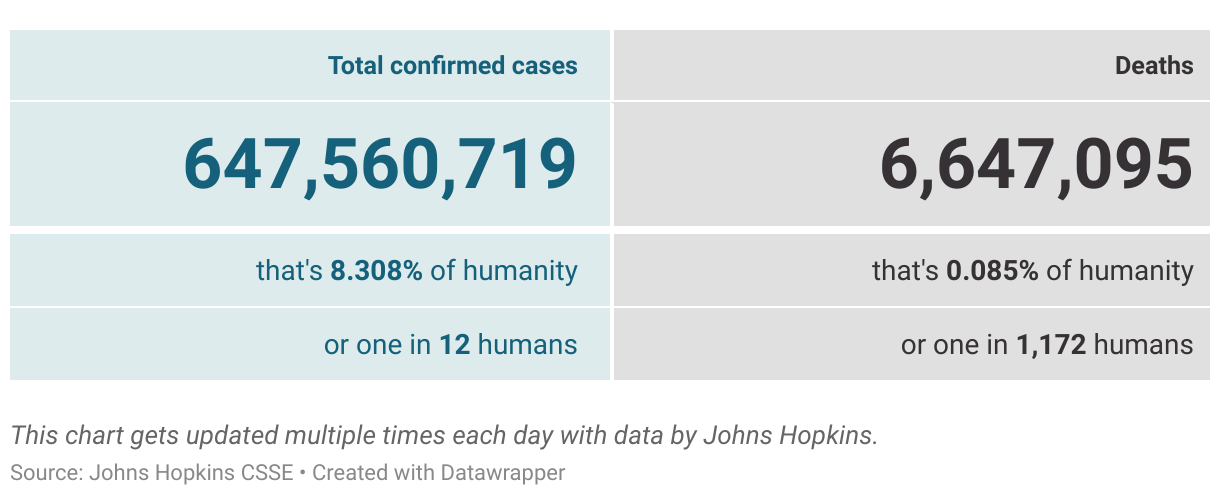
Tables with complex styling

☝️ This table was created by n-tv and does not belong to Datawrapper, which is why there is no "Edit this chart" button. You can read more about it on our blog "How we at n-tv used HTML to add custom color keys to Datawrapper charts & tables" written by Christoph Wolf, editor of the German news site n-tv.