Muna Alebri, UCL, about right-to-left data visualizations


Muna Alebri, PhD candidate at the University College London Interaction Centre, spoke at our Unwrapped conference about "Inclusivity in Visualization Design: Are we leaving right-to-left readers out?"
In her PhD project, Muna focuses on visualization design for the general public. In particular, she investigates the usefulness of icons, pictographs, and other visual elements in engaging the general public — for example, how non-experts in visualization and design perceive embellishments like icons and backgrounds in news visualizations (PDF).
Watch her talk here:
03:01 – Why does it matter?
04:34 – Right-to-left visualizations in practice
07:34 – Support for right-to-left visualizations
08:51 – What can we do?
10:21 – Q: Other tools to create right-to-left charts?
11:44 – Q: Other blind spots in data vis accessibility?
12:59 – Q: Vertical language?
13:50 – Q: Better support for right-to-left in software development?
15:20 – Q: Linguistic tools in Arabic to speak about data vis?
Full transcript
My motivation
[00:00:04] Muna Alebri: So hi everyone. I am really happy to be here, and I feel really honored to be invited as a speaker. Let's begin. So today I'm going to talk about inclusivity in the visualization design and research. And particularly, I'm focusing on the reading direction and scripts that are read and written from right to left.
So during my PhD, I'm actually doing something different. So for my PhD, I'm investigating a particular design strategy that designers often use, such as using icons and pictographs to convey the visualization method. And my interest in the reading direction actually stemmed from the aim of my PhD project, which is to make visualizations approachable and attractive for the general public.
However, I realized after four years of investigating these aspects that I am actually excluding my own community and I started researching for visualizations in Arabic as it's my native language. I wanted also to have the vocabulary to be able to explain my research to my Arab fellows, but I found something else that was really interesting on my journey. I realized that there is an opportunity to research script directionality impact on visualizations. We have over 280 million people who use Arabic scripts, more than 77 million who use Persian scripts, and 231 million who use Urdu scripts. What is common between these scripts is the reading direction.
These scripts are read and written from right to left. Arabic, Persian, and Urdu are not the only scripts that are read and written from right to left. Kashmiri, Kurdish, and Hebrew are all scripts read and written from right to left. There are over 2 billion users of right-to-left scripts. So are these communities that use right-to-left scripts being represented in our research?
A 2009 analysis of the CHI proceedings, which is the most prestigious conference of human computer interaction, revealed that 80 percent of the publications came from a handful of countries that all use left-to-right scripts. Similarly, an analysis of the VIS conference, another major conference in the visualization community, revealed that in 2019, most user studies came from North America, where left-to-right scripts are used.
Why does it matter?
[00:03:01] Muna Alebri: But why does it matter? Can't we just translate everything? Reading directionality is a mindset. It's an expectation instilled from an early visual experience. I found this interesting work about directional tendencies by Fagard and Dahmen, where they compared two groups of children, French, who used the word left to right, and Tunisian, who used right to left scripts.
The children were given circles with dotted lines and were instructed to draw circles with solid lines. They found that Tunisian children more often drew the 5 and 11 o'clock circles clockwise. In contrast, French children more often drew them counterclockwise. They also asked the children to fill circles with dots in 30 seconds.
They found that French children filled more dots from left to while Tunisian children filled more from right to left. Although these tasks are simple and intuitive, they demonstrate that exposure dictates what to expect and how our perception changes based on the direction. It also works as a reminder of the importance of localization.
It is essential to display designs that speak to the audience, what they are used to, and what aligns with their mental models. This also contributes to increasing the trust and credibility of the visualization.
Right-to-left visualizations in x practice
[00:04:34] Muna Alebri: Now, let's move to how visualizations are designed for right-to-left readers in practice. Over the past few months, I have meticulously curated visualizations tailored for Arabic content from four reputable news outlets: Al Jazeera, Al Arabiya, BBC Arabic, and CNN Arabic.
From this collection, I handpicked 37 bar and line charts, because the direction matters in these visualization types. Each visualization was coded, taking into account the orientation of the x-axis and also the position of the y-axis. The analysis revealed that a significant majority, 84 percent to be precise, of the visualizations commenced with the x-axis from left to right.
Conversely, a mere 14 percent began with the x-axis on the right with the y-axis correspondingly positioned on the right as well. Here is a sample visualization found on the BBC Arabic website. As is apparent, some of these charts have their y-axis on the right, some of them have it on the left.
Moreover, the x-axis sometimes starts from the left. In other times, it starts on the right. For instance, if we look at the visualization with the multiples, it starts with September and ends with January. Here is another example from Al Jazeera website, so that I'm not biased. I collected these visualizations from the same article, where some visualizations have the y-axis on the left. Other times, they had it on the right.
There is clearly an alignment issue. A reader must constantly shift their reading direction between reading the title, reading the content, reading the visualization, and also the numbers, because the numbers are written from left to right.
Here are other examples from CNN Arabic. Sometimes they have the y-axis positioned on the right. Other times they have it on the left. During my research, another colleague brought to my attention an intriguing case from the Inkifada website, which is an independent media outlet based in Tunisia. The website presents its content in Arabic, French, and English, and they customize the visualizations according to the chosen language.
For instance, in the English version, all of the text, all of the web interfaces, even the visualizations, are aligned to the left. Conversely, in the Arabic version, they're positioned to the right.
Support for right-to-left visualizations
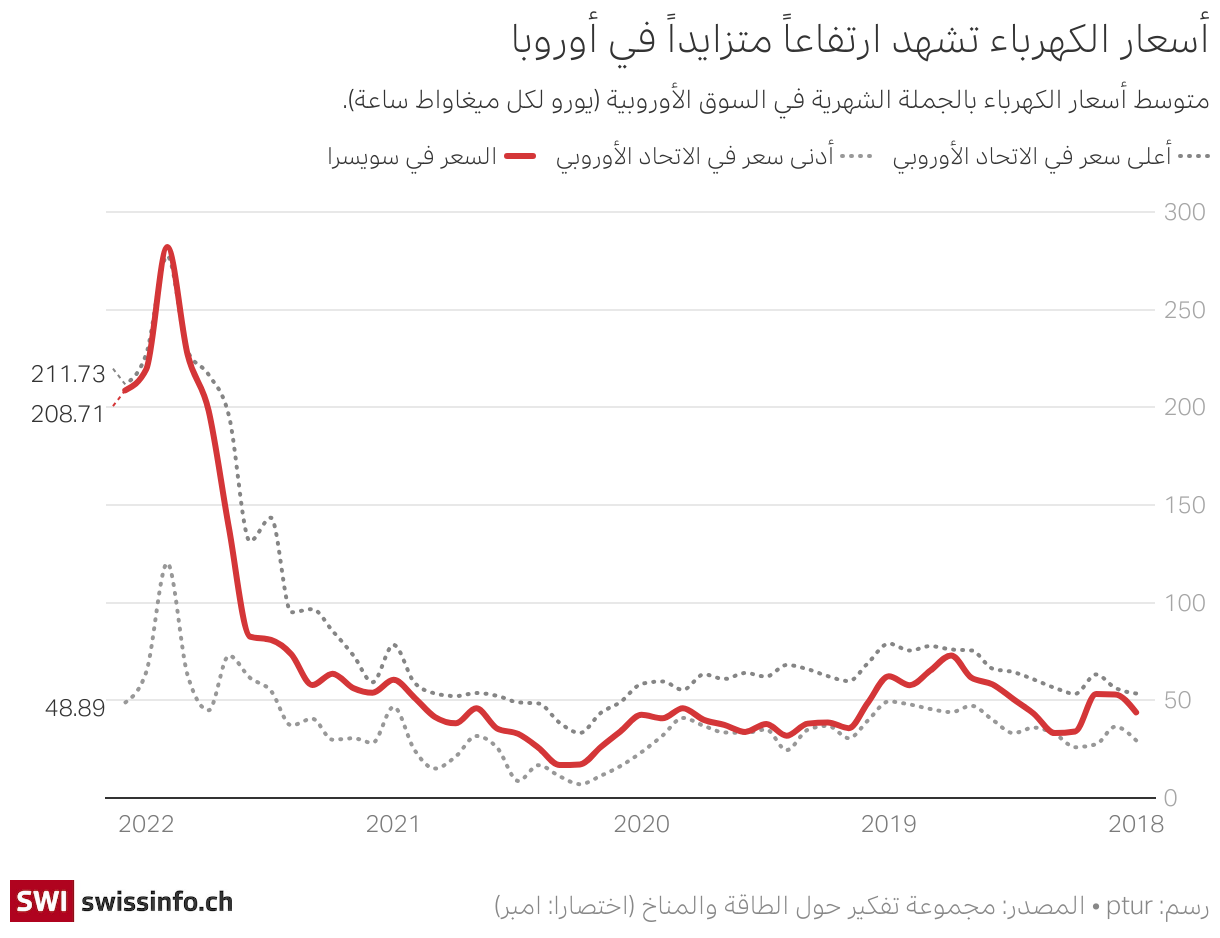
[00:07:34] Muna Alebri: The inconsistency of visualization design for right-to-left users found in the media shows that there are no clear guidelines. As this post demonstrates, someone is asking whether charts need to be reversed for right-to-left users. While mirroring might be a solution, it needs to be done with caution. In May 2022, I was really pleased with the announcement when Datawrapper announced a new feature to support designing right-to-left visualizations, where you can set the visualization's orientation to right to left based on your language.
This includes flipping customizable design elements, such as the annotations and legends, as well as basic visualization designs that are normally fixed, like the direction of the bars in a bar chart and also the x-axis for a line chart. So you don't have a reason not to support right-to-left users if there are tools that actually make it really easy with just changing one of the features.
What can we do?
[00:08:51] Muna Alebri: So what can we do? The first point is to maintain consistency, especially if you're designing visualizations to be embedded in an article. And also utilize the existing tools that support right-to-left visualizations.
We could also start to explicitly state the directionality on which a design guideline was based. This would emphasize that left-to-right is not the default and should not be generalized. We could also run our empirical investigations with two samples varying in direction tendencies to demonstrate a more universal knowledge.
Finally, I would recommend getting inspired by the W3C web design guidelines, where the web community collaborated in creating detailed documents that handle interfaces and how they should be mirrored based on the direction. I hope that my talk will inspire some of you to advocate for a better representation of potential visualization users and better visualization designs for right-to-left users. Thank you.
[00:10:04] Elliot Bentley (host): Thanks so much, Muna, really interesting talk. I actually saw a similar talk you gave at InformationPlus in November. And we actually thought it was so fascinating that we really wanted to invite you to Unwrapped.
Q: Other tools to create right-to-left charts?
[00:10:21] Elliot Bentley (host): My question for you is, aside from Datawrapper, which I appreciate the call out of, of course, are there any other tools that you know of for easily creating right-to-left-oriented charts?
[00:10:36] Muna Alebri: Actually, when I was looking for tools, I only found Datawrapper to be supporting right-to-left visualizations. It's possible, of course, that you can use other tools like Microsoft Excel or Tableau, but it's not very easy to apply the changes, and you need to be very familiar with the language to be able to do it.
But I think what Datawrapper is providing is that even if you don't speak the language, if you're not familiar with the language, then this is done for you. So the research is done for you. All of the design aspects are done for you. It's just a matter of a click, which is very convenient, and it makes it very accessible to do that. No, I was not able, unfortunately, to find any tools. You win.
[00:11:33] Elliot Bentley (host): That wasn't a loaded question. Oh, we've got some questions in the comments, actually, so I'll read some of those out. Let's see.
Q: Other blind spots in data vis accessibility?
[00:11:44] Elliot Bentley (host): Michi asks, thanks for your insights and ideas. I'm curious what similar blind spots you've noticed with regard to accessibility in data vis.
[00:11:54] Muna Alebri: Yeah, I think also maybe in terms of literacy, I think there is this expectation that everyone knows how to read a visualization. And so you generalize this assumption. And I think we need more guidance in reading the visualizations, particularly. Because I did my PhD, I did a project where I was collecting a lot of visualizations from the news, like English content, so I use BBC, Daily Mail, and Telegraph, I was able to collect a lot of visualizations. But then, when I'm doing this project with Arabic content, I was not able to really see the same number of visualizations. So firstly, I think data visualizations are not very common. Partially, I think it is because of data literacy, as well.
Q: Vertical language?
[00:12:59] Elliot Bentley (host): Cool. Let's see. We've got another question here from John. It says, " Great talk. Have you done any thinking about vertical languages?
[00:13:07] Muna Alebri: No, I always get this question. I wish that I did, but at the moment I'm wrapping up my PhD. I don't really have time to look at this, but I would love to. But I also don't want to... So I feel like I can say stuff about right to left, because I speak Arabic and I write in Arabic, but I feel like I need someone else who's an expert in vertical languages, to be able to not be ignorant in my research and bring their perspective as well. So yes, I would love to do that in the future.
Q: Better support for right-to-left in software development?
[00:13:50] Elliot Bentley (host): Yeah, whole new, a whole new angle for it. I have a quick question of my own. As a web developer, I've noticed that there have been new properties added to CSS and things over the years to better support right-to-left directions. Do you get the sense that it is improving in the world of software in general and in software development?
[00:14:20] Muna Alebri: Yes, definitely. Yes, definitely. And that's why I feel like, why are we not doing the same for data visualizations? Everything is now shifted for people who use Arabic and Arabic scripts. You get to see your navigation on the right side, even the rating. When you get to rate something, the stars start from the right. So everything is flipped. And that made me wonder why we're not seeing the same thing with visualizations.
I think it's also a burden on researchers because these communities have not been used as samples, have not been represented in research. Although the population is huge, so your target audience is really large. So it's definitely improving and I'm happy to see that and I wish that we can do the same for visualizations.
[00:15:18] Elliot Bentley (host): Room to grow, perhaps.
Q: Linguistic tools in Arabic to speak about data vis?
[00:15:20] Elliot Bentley (host): I have another question from a viewer. Noelle asks: visualization literacy is so very linked to language literacy and other forms of literacy. Do you think the Arabic language has enough linguistic tools to speak or think about data visualization?
[00:15:37] Muna Alebri: Thank you, Noëlle. I think that we do lack that. I think we do have the vocabulary, but I am ashamed to say that I don't really know it. I think that we do need like a dictionary or a taxonomy to help these languages, to help people who design those visualizations, how they teach those visualizations, and how to talk about them.
So I think that we definitely need to improve that and make it more accessible for everyone to know how to explain those visualizations. Yeah. I don't know if there is one, but I hope to be able to see that. Because in the Viz community, we do have taxonomies that help people to understand the visualization, to describe it, and to teach it as well.
Yeah, I'd be happy to work on a project where we could have a dictionary for every language to describe the visualization.
[00:16:47] Elliot Bentley (host): Sounds like a big project to me. Let's see, I have a question from Elana from Datawrapper. Just thank you for the talk. Do you think inverting everything that goes from left to right can be considered a generally good rule of thumb, or do you know of exceptions?
[00:17:04] Muna Alebri: Okay, I hate to say this, but I can't really make any claims because I did not do empirical investigations. I don't know if it frustrates people or not, or does it improve? I don't know their reading. They find information more quickly. But in my expectation, I think I would hypothesize that it is expected to invert everything. And, I think that if it were not a necessity, then we would not have seen the feature added in Datawrapper. And maybe one of the reasons that we're not seeing a lot of visualizations in these outlets is that, maybe people are not spending time on them, and it could be that maybe because of the direction, people feel frustrated, just keep shifting between right to left, reading one article.
So I think, yes, it might be increasing their receptivity to the visualization. But I think a rule of thumb for the timeline is always to start from right to left. Because I don't think that we can negotiate about that.
[00:18:29] Elliot Bentley (host): Great, thank you so much, Muna, really appreciate you being here.
We asked Muna some additional questions before her talk:
Muna, what will you talk about?
There has been a growing concern over generalizing our knowledge of human behavior and cognition, as most research is based on Western-educated, industrialized, rich, and democratic (WEIRD) samples. Languages of these communities are read and written from left to right (LTR). Reading direction is essential for design, influencing where people unconsciously direct their attention and make decisions. So most of our visualization knowledge is mainly based on LTR readers.
In contrast, right-to-left (RTL) readers constitute over 500 million people worldwide, but are left out of empirical investigations in the visualization community. In practice, there is a lack of consistency in visualization design for RTL readers. While there are no clear guidelines for RTL readers, we could borrow findings from cognitive perception research. By the end of my talk, I hope the audience will consider the reading and writing direction in visualization design.
What Datawrapper is providing is that even if you don't speak the language, if you're not familiar with the language, the research is done for you, all of the design aspects are done for you. It's just a matter of a click, which is very convenient, and it makes it very accessible. Muna Alebri, UCL, in minute 11:05 of her talk at Unwrapped 2024
Where does your interest in data visualization come from? Why keeps you interested in it?
I have always been a visual person. I have always had hobbies related to visuals, whether photography, doodling, or simply admiring art. But I honestly was first fascinated by visualizations when I saw the Chernoff faces visualization while I was working on my master's thesis. It's a visualization that uses human features to depict multivariate data:

What keeps me interested in visualizations is empirical research and that it is an area that requires revisiting our assumptions.
What aspects of data visualisation design would you like to explore more?
I want to explore design for RTL readers because I am part of that community and feel we are underrepresented in the visualization industry. I want to give my community a voice and understand our differences to improve everyone's knowledge of data visualization.
I also want to explore trust in visualizations. There is a historical assumption that visualizations need to be objective by showing the data only. With the spread of false information, I wonder if we want people to see all visualizations as trustworthy and factual. I think it is important to encourage readers to be skeptical and invest time in reading and exploring the chart. In particular, I am keen on investigating how the combination of visual metaphors and sketchiness (e.g., in Mona Chalabi's work) would be suitable to achieve that goal.


What advice would you give to data visualization designers?
From a researcher's perspective, I would suggest talking to their audiences to get feedback and understand their requirements. Also, the research community is making tremendous efforts to elicit design guidelines, so it might be worth frequently checking what the community has to offer.
We loved Muna's talk at Unwrapped! You can find her on LinkedIn, X, and Google Scholar. To learn more about Datawrapper's support for right-to-left visualizations, head to this feature announcement. And to read about the Unwrapped conference and hear other great speakers, visit our blog.


