Rose Mintzer-Sweeney, Datawrapper, about three years of trends in news visualizations


Our data vis writer Rose Mintzer-Sweeney spoke at the Unwrapped conference about “Three years of trends in news visualizations.”
Rose had been with Datawrapper for three years, creating, editing, and writing about data visualization. She published new Datawrapper charts every Thursday in the Weekly Chart column and edited a weekly roundup of the best new data and visual journalism in the Data Vis Dispatch.
Watch her talk here:
02:25 – Going beyond data vis
06:01 – Dashboards
08:08 – Humanizing data
10:15 – Fewer rules
12:16 – The rise of mobile
14:05 – Video
15:40 – Twitter/X
18:31 – Q: Data vis community
20:32 – Q: Process?
Full transcript
[00:00:04] Rose: Hi, everyone. It's great to be here. As was just said, my name is Rose. I work at Datawrapper, writing and editing for the blog. I'm on the comms team with Lisa. And today I'm going to be talking about the past three years of trends in news visualizations. So why am I the one to talk about this?
Well, one of the main things that I'm doing on the blog is publishing this Data Vis Dispatch column. So that's basically, if you haven't read it, a best-of kind of roundup of the most interesting, beautiful, exciting new visualizations that have been published in the past week. Although this isn't a rule in practice, it's pretty much exclusively focused on work that gets published by journalists in newsrooms.
We have published it, mostly I have published it, along with some of my colleagues, weekly, from June 2021 until today. So almost three years. Which adds up to a lot of hours looking at really beautiful news data visualizations. So I've had a chance to kind of see the developments and trends in the field firsthand as it has unfolded, and from a kind of bird's-eye view of trying, although, of course, also failing, to actually see every new news visualization that has come out every week as it happens.
So, for today, I basically reached out to practitioners, people who work in newsrooms themselves, as well as other fellow watchers of the data viz scene, as well as some of my colleagues in Datawrapper, to ask them what trends they're seeing in news visualizations. And I looked into my own archive to ask myself what trends I was seeing.
And so what we're going to do for the next 10 minutes is really, really simple. I'm just going to give you a big list of the most interesting trends that I heard about and noticed myself, along with some of the especially beautiful examples that we've seen of them. So let's get going.
Going beyond data vis
[00:02:25] Rose: One thing that various people mentioned in one way or another
is that the moment in data vis is about going beyond data vis. And by data vis in this case, I think most people are referring to charts and maps and other kinds of straightforward numerical representations of the kind that you could make in Datawrapper, and that these days there's a sort of movement of finding a way to go beyond that or go do something further in some way.
So, one kind of straightforward way that we can see that is in trying to mix up the way that we're visually representing data. Using creative methods like sort of analog or photographic imagery. For example, in numeric terms, this chart is basically a totally standard bubble chart that's using the size of a circle to represent a number, but it sort of gets taken to the next level by this photographic friendship bracelet motif.
This may or may not have been actually made physically. This one definitely was, it's a cross-stitch embroidery. This one is from the #30DayMapChallenge, and I often find that the #30DayMap and #30DayChartChallenges are a great place to see people trying out experimental methods of all kinds, including, in medium.
Again, this one is probably digitally created, but it's also using a sort of embroidery. This is from Reuters, about tennis.
Another kind of beyond data vis technique that I heard mentioned was the use of satellite imagery, both satellite data for analysis and also using and sort of annotating and presenting satellite imagery directly as part of a data visualization. So, for example, this is a recent piece from the New York Times that takes satellite imagery of Northern Gaza and analyzes it to try and visualize the position of the Israeli military.
This is from Bloomberg on electric vehicles; the Wall Street Journal on, again, military positions in Ukraine. So, of course, I had liberty to pick whatever three visualizations I wanted, but in this case, I don't think it's really a coincidence that two of these have to do with war. I feel like satellite imagery is definitely a case of something that comes up pretty often where the trends, if you can call them that, or simply the events of the news itself, what's happening in the world, has a kind of pretty one-to-one relationship with the trends in the visualization techniques that are being used to represent them.
Because one type of data is especially salient, visualization techniques that are suited to it sort of have a moment, alongside. And so, unfortunately, as we've seen so many occasions to visualize war and conflict data over the past two years, that satellite imagery as a trend kind of goes along with that.
Dashboards
[00:06:01] Rose: Another place that we've clearly seen that is with pandemic data. So the sort of three years timeframe of this is ostensibly because that is the amount of time that I've been working at Datawrapper and publishing the Data Vis Dispatch, which is true. But it's also clearly, I think, sort of a real era in news visualizations in that, you know, the pandemic in 2020 was such a huge event in the world, but also specifically in terms of the salience of data and data visualization and data reporting around the world. And the three years since then have been kind of coming off of that era. And seeing what has stuck and what hasn't stuck.
So my colleague Luc thinks, and I tend to agree with him, that the dashboard, which was such a major piece of all COVID reporting, is probably not here to stay, but it really had its moment. I've chosen a few to show you here. But picking them was basically impossible. We did, in fact, like a whole special edition of the Dispatch that's just focused on the dashboard specifically as a sort of genre, the COVID dashboard.
And whether or not, it seems like in fact most organizations that developed this great expertise in that sort of form over the course of their COVID reporting have more or less chosen to pack it away. I've seen a few dashboards on topics like energy, but for the most part, it doesn't seem to be a lasting form for news visualizations.
Nevertheless, obviously, it was a real defining moment.
Humanizing data
[00:08:08] Rose: Meanwhile, something from the kind of post-COVID era that I feel like is here to stay is a more kind of conceptual, I don't even know if you can call this a trend, but, the concept of humanizing data or the efforts to humanize or individualize personal stories within data, especially when the topic is somehow sad,
however you want to construe that. I think because this was a story where the vast numbers involved were obviously such a huge part of what was being reported, there was a real struggle to figure out how we could continue to tell individual people's stories and not flatten out the human element, even as, of course, some amount of flattening and aggregation is necessary, or else, you know, you're writing thousands of biographies and you're not doing data reporting at all.
So I feel like there's just been like a sort of real flowering of techniques for doing that and creative ideas for doing some amount of narrative disaggregation within a big story. So, this piece from the New York Times on 100,000 American deaths from COVID obviously was kind of a landmark, but then, you know, there's so many more.
This is an illustrated piece from the Guardian just a few weeks ago, about the fate of people in Gaza. This is a piece about loneliness. And really, any time that you see a kind of negative news story, I think from now on, you'll almost always see some effort towards including this human or narrative element, and I would really say that that seems to be here to stay.
Fewer rules
[00:10:15] Rose: Overall, though, if that's a new rule, I would say most people that I talk to have said that the trend is overall towards fewer rules and breaking rules. Andy Kirk of Visualizing Data said, the shouty voices saying don't do that or never do this are a bit less shouty, which I like.
So, what does rule-breaking mean? John Schwabish said he sees a softening of the dogmatic rigidity in the field, and he and more than one other person specifically mentioned the data-ink ratio and other bits of dogma that maybe people are either moving away from or, just generationally, a younger sort of cohort of practitioners haven't been exposed to or haven't taken to heart in the first place.
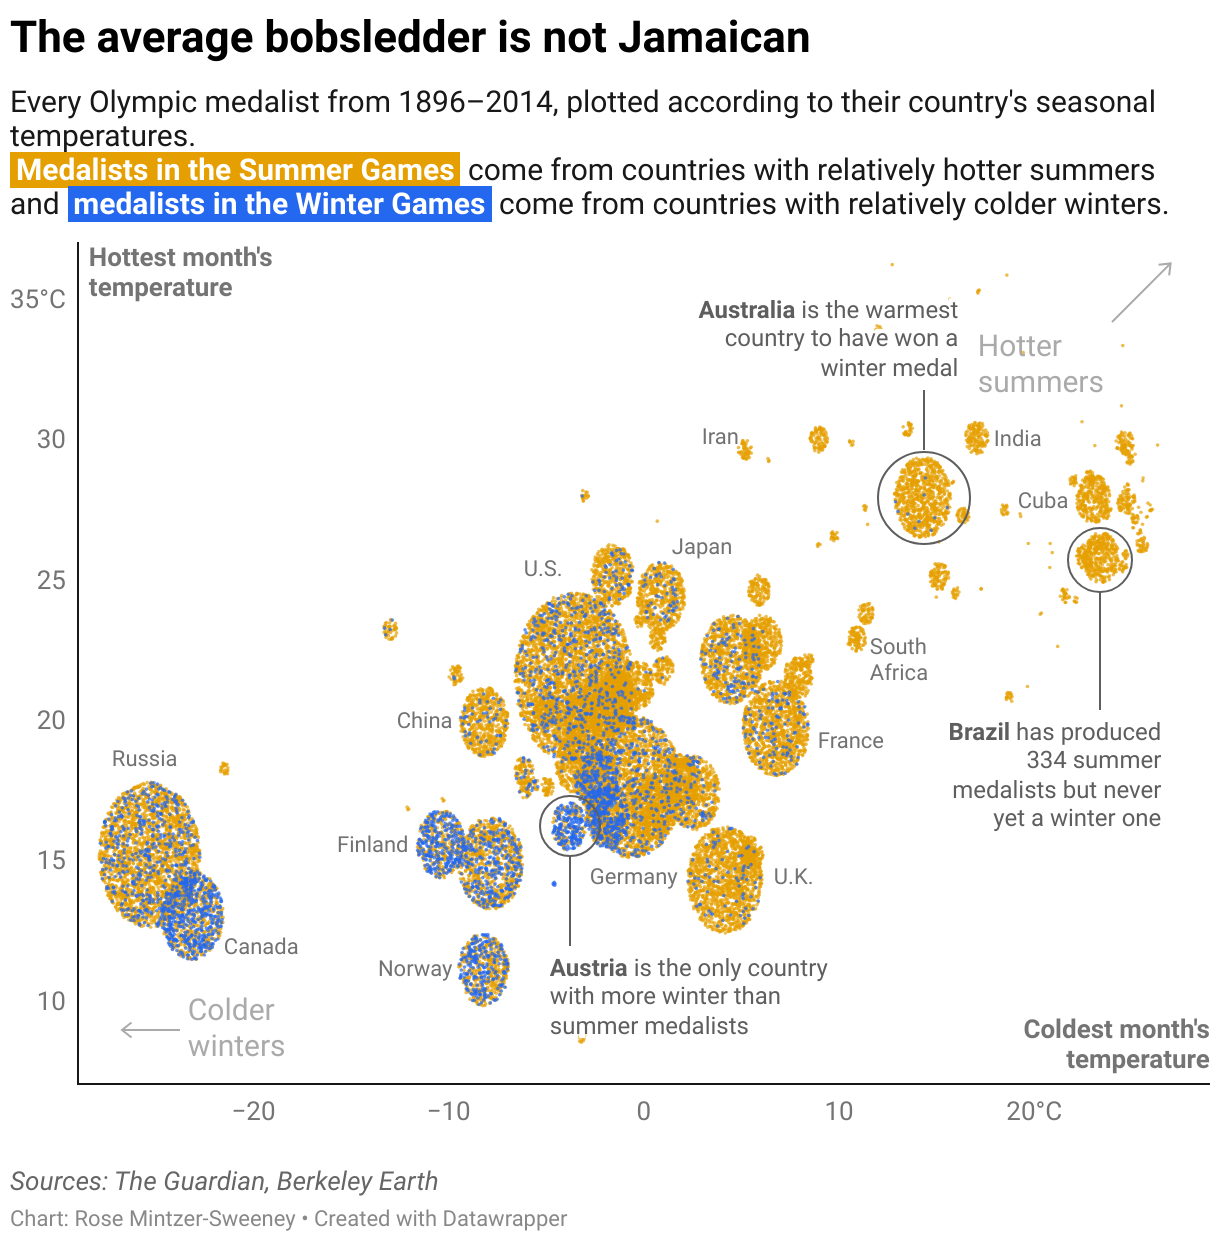
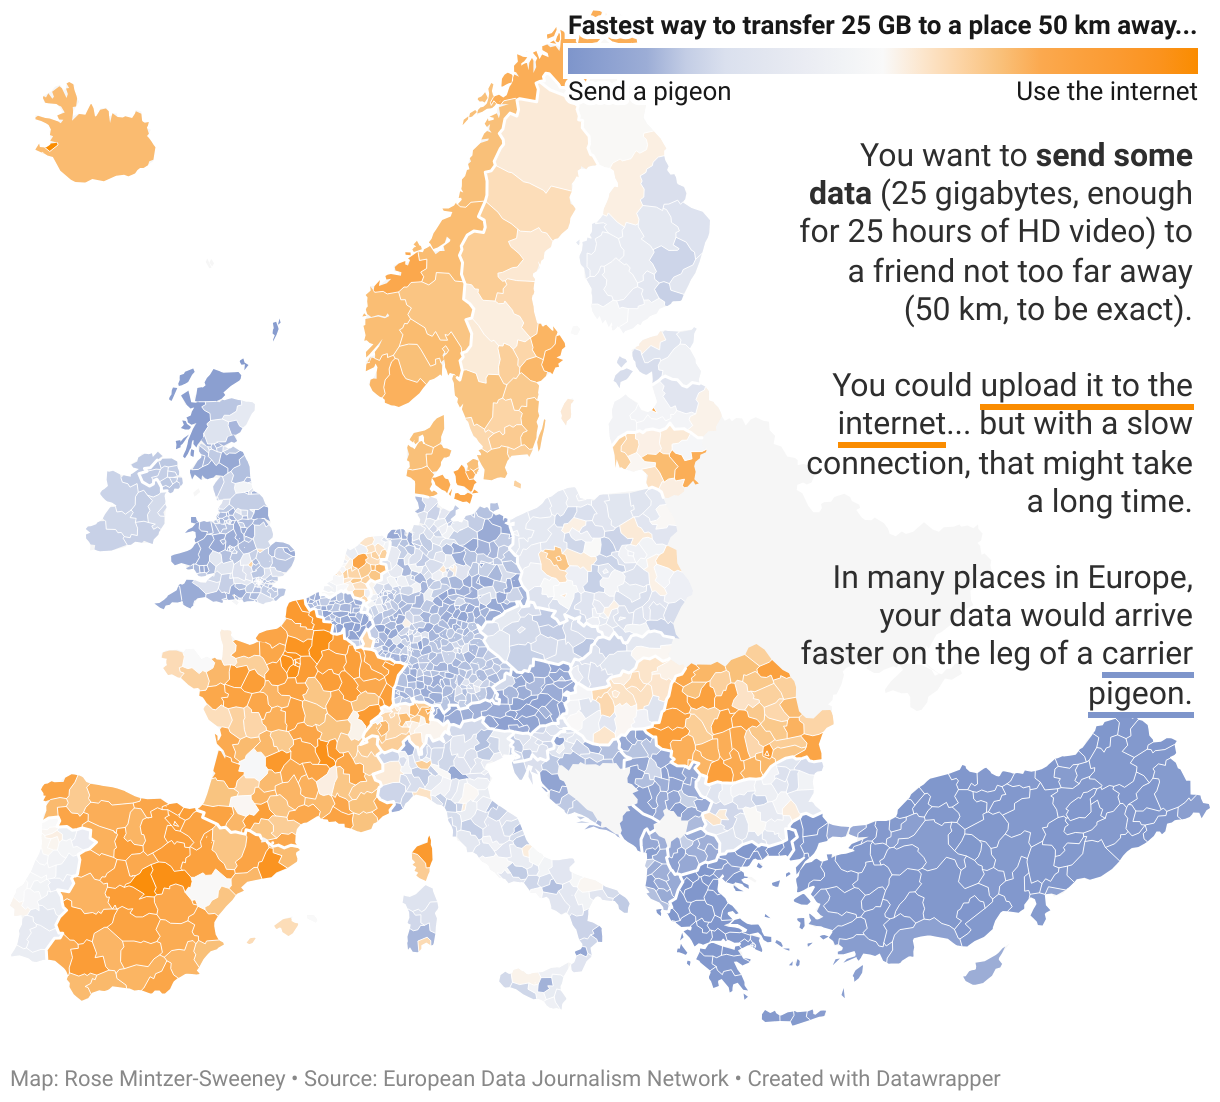
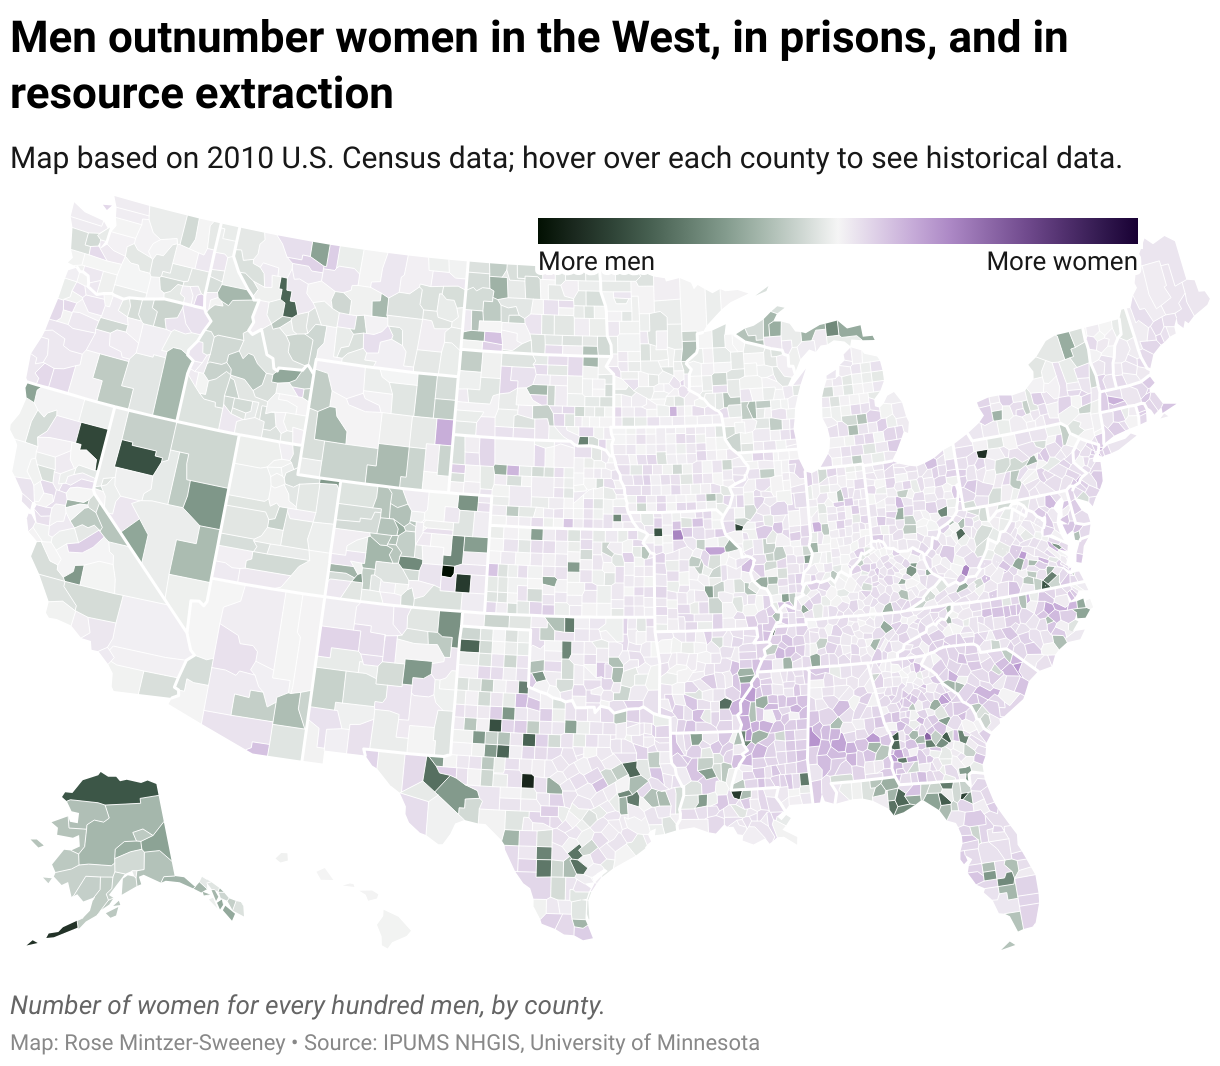
So I see that for sure. I immediately thought of this chart, which I love, in that it's a pie chart. It has all of these little doodles that don't necessarily represent everything in the most hard, efficient, little ink way possible. But at the same time, I think anybody who sees it would have to say it's totally successful and effective and not like gratuitous in its use of those elements.
Likewise, this little, animated chart from Politico, which has all of these sort of fun graphical and animated elements. Could a line chart have told the same thing? Yes. But basically, I think you can put all of these charts under the headline of "having fun with it." Which, just to editorialize, I love to see people having fun with it.
I hope that everybody continues to have fun with it because it's fun for me as a reader to read. It makes it more fun.
The rise of mobile
[00:12:16] Rose: Okay, so, maybe there are no rules, but there are still some constraints. I can't believe... the rise of mobile", can we still call this a trend? It's still a trend in the sense that it's continuing to increase. And as it's continuing to increase, or at least just proving to be a durable change in how people are viewing visualizations, you're continuing to see people apply all of their creativity to the question of how to make it look good. which basically means it's the same problem, but you see the new solutions to it all the time. So I've just collected a few. New solutions can take the form of different map projections so that the area in question actually has a different, more mobile-like vertical orientation.
It could mean just chopping up what you have, so that it fits on a smaller screen, which also, of course, means making decisions about the sequentiality of the visualization and kind of deciding what order you're going to present information in that maybe originally had a more holistic design. It could mean taking something that was one visualization and just making it two separate visualizations.
This, again, like, this is impossible to choose three examples because literally every single chart and map that we see, if it's from a publication that's putting any amount of effort into a digital presentation, every single visualization is grappling with this, you know, more or less successfully in one way or another.
So it's always very cool to see someone bring a new idea to that problem.
Video
[00:14:05] Rose: Another kind of medium delivery that came up was the use of video. I have to admit this is a real blind spot for us because we've never included true video formats, not like animations or scrollytelling, in the Dispatch.
I myself am not as plugged in to what's happening on platforms like TikTok or YouTube. But every now and then, I have a peek so I can say I've seen visualizations take a few different forms. The bars are, the columns are scrolling by, and sort of effectively annotating with real economic data, the sort of talking heads video. Another sort of format that we sometimes see in video is like this one from The Economist, where it's basically a sort of video applied version of a chart that was already published in a static or scrollytelling format, on their regular, digital channels... sort of reformatted to suit a video audience on TikTok. This is a social channel, so we also see social interaction happening, like, for example, this video is from Zeit Online, and it's an examination of, or response to, a chart from The Economist, presenting the chart to their readers and kind of explaining what it shows, which is cool to see.
Twitter/X
[00:15:40] Rose: Okay. But there's definitely an elephant in the room here, which is the other social media site.
So, people that I talked to, almost all brought it up. They had different language to describe it. Some people said Twitter is getting less popular. Other people had more dire assessments. Twitter is essentially gone. The demise of the data vis Twitter community. This is real. I am on Twitter every week looking for visualizations, and you can't deny that this is something that we're seeing.
It's a real shame for everyone, especially for us. So, having taken on this project of attempting to see every new visualization every week, everywhere in the world, it's really easy to see where we're falling short of that goal. This is a map showing the geographic origin of sources that made it into the Dispatch just in its first year.
So we've expanded a little bit since then, but not as much as we'd like. And you can see major, major geographical blind spots, and not just geographical blind spots, but really, that clustering represents a clustering of just a few big publications with a lot of muscle and money and human effort to throw behind their data visualization teams.
So this is just like the top 15 sources. Obviously we have included hundreds of individual sources, but it's undeniable that there's sort of an echo chamber and that social media had been a really great way to kind of break outside that and discover individuals and publications that were not already commonly known to you or your circle and that the fragmentation that's happened over the past year or so is a challenge and basically this is a trend that I hope is not a trend or a trend that I hope reverses itself soon, because if we can't see each other's work, we can't learn from it.
And getting inspired from seeing other people's data visualizations is a really great thing and can only make everyone's work better. So this is something that we're seeing now, but I hope that we stop seeing in the future, and hope that we all can continue to share work and learn and get inspiration from each other.
And that is all that I have to say for now. You can get the slides online and check out the Data Vis Dispatch if you have not already.
Q: Data vis community
[00:18:31] Elliot (host): Thank you, Rose. Fascinating stuff. I was curious about your last slide about fragmentation in the data vis community, which I have definitely noticed myself. Where's everyone gone? Where's the party now?
[00:18:50] Rose: I think the party has, to some extent, just broken up and gone to different places. I know this from seeing individual people that I follow closely enough to take note that they're taking their things and going to BlueSky or to Mastodon or to Instagram, or any of these other sites that have presented themselves as the next Twitter or trying to create the sort of worldwide community that Twitter did.
I think it's not unfair to say that at the moment there is no place that can serve that purpose of not just connecting you with people that you already know, but with people that you don't know and have no connection to. So I hope that one of them takes off and becomes that again.
[00:19:33] Elliot (host): And to put you on the spot, is there anything you would like to see more in the visual journalism space? Any trends that you were expecting to see or hoping to see that did not come up in your research?
[00:19:45] Rose: Hmm, that's a good question. I guess I am always hopeful that we'll just see more outlets and especially more outlets that have a local or a national, but not the same 10 nations that we're always seeing focus, covering data stories from their perspective. Because when it's always clear that when there's a big story that has a clear data angle, it's easy to see how that's unfolding in the U. S., in Germany, in Spain, in the UK, and it's not easy to see how it's unfolding elsewhere in the world or at a more local level. So fingers crossed for that.:
Q: Process?
[00:20:32] Elliot (host): Let's see, what other questions do we have here? All right, we've got some Data Vis Dispatch superfans in the chat, so perhaps a bit of inside baseball. Simran says their Tuesday afternoon ritual is making chai and going through the projects included, so they'd love to hear more about the process of curating the visuals, the questions you reflect on when deciding what projects to include.
How are you finding the source of inspiration now that Twitter isn't as active?
[00:21:04] Rose: Okay, well, first of all, thank you so much. That's very great to hear. The process is extremely simple: it's brute force. I have a list of sources that I like, and I go through them every week. Or now my colleague Vivien, who isn't here right now because she's in Taiwan, where it's very late at night, but is creating them every week. And we literally just look at the sites of hundreds of individuals, newspapers, RSS feeds, aggregators that are faster than us, of which there are very few, and see what we like. And of course, we're always having to pick and choose because we look at hundreds of visualizations every week.
And it's a mixture of always wanting to include anything that's visually remarkable, whether or not it's totally successful, and also including a variety of perspectives on a topic or a data set that is getting a lot of attention.
[00:22:12] Elliot (host): All right. I think that's all the questions in the chat. So thank you, Rose, so much. Really interesting distillation. Appreciate it.
[00:22:25] Rose: Thanks, Elliot.
We asked Rose a few questions before her talk:
Rose, what will you talk about?
What’s happening in the world of visual and data journalism? What formats, techniques, and topics are having a moment, and which ones have proven their staying power? We’ll take a look at some visual and organizational trends of the past three years through the eyes of reporters, editors, and observers of the data vis scene.
What do you like most about working at Datawrapper?
Everyone working on the tool is really interested in what great data visualization can be. A huge part of my job is drawing inspiration from the world of data vis outside our company, noticing what’s beautiful and interesting no matter how it was made. I think it makes the tool better in the long run and it definitely means I see a lot of amazing projects from all kinds of creators.
Getting inspired by other people's data visualizations is a really great thing and can only make everyone's work better. [...] I hope that we all can continue to share work, learn, and get inspiration from each other. Rose, Datawrapper, in minute 17:56 of Unwrapped 2024
What’s your guiding principle when working on data visualizations?
Talk to your reader. A chart is just another form of communication, and a good one can speak as plainly and convincingly as a good paragraph — provided you know what you’re saying!
What’s your favorite Datawrapper feature?
I have a lot of fun with the freeform tooltips in choropleth maps and scatterplots. Some extra color coding, emoji data scales, miniature charts… And then looking at other people’s designs and realizing I still haven’t explored all the possibilities.
We loved Rose's talk at Unwrapped! You can learn more about her on X. To find out more about Unwrapped and hear other great speakers, visit our blog.