Lalon Sander, taz/NDR, about automating HTML buttons to link multiple charts


Lalon Sander from taz/NDR spoke at our Unwrapped conference about "How we automated HTML buttons to link multiple charts."
Lalon is a data journalist for the German daily taz and the public broadcaster Norddeutscher Rundfunk (NDR). He analyzes data about climate change, enjoys automating processes and building data pipelines.
Watch his talk here:
01:25 – Datawrapper's solution
02:52 – Problem with Datawrapper's solution
06:35 – Our better solution, a Python app
10:56 – Benefits of the Python app
Full transcript
The problem
[00:00:04] Lalon Sander: I'm going to spend the next 10 minutes presenting a very, very simple tool that we created to solve a problem that's not a very big problem, but it gets very tedious. It's related to code and HTML buttons. And this is what we did.
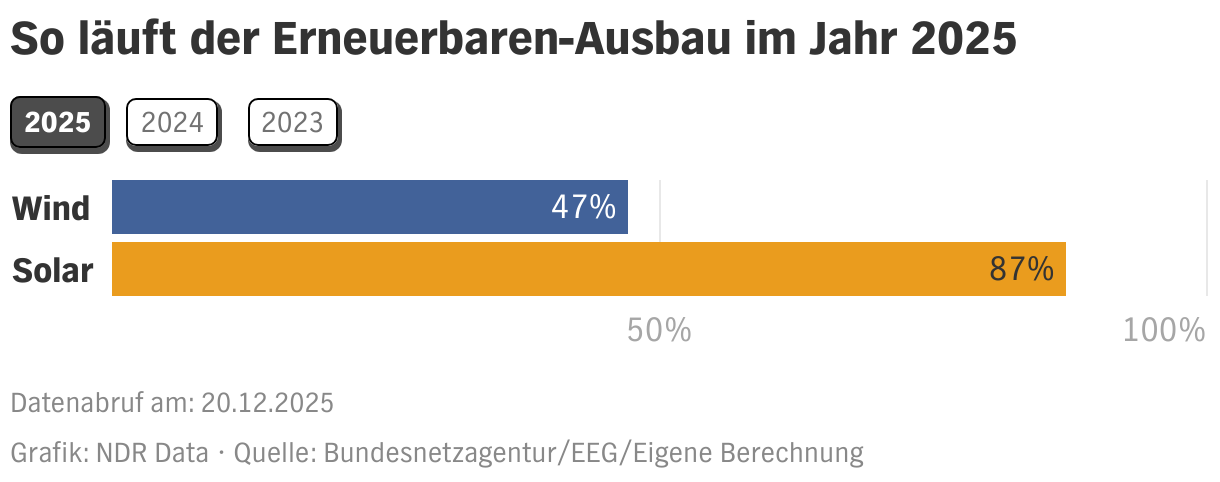
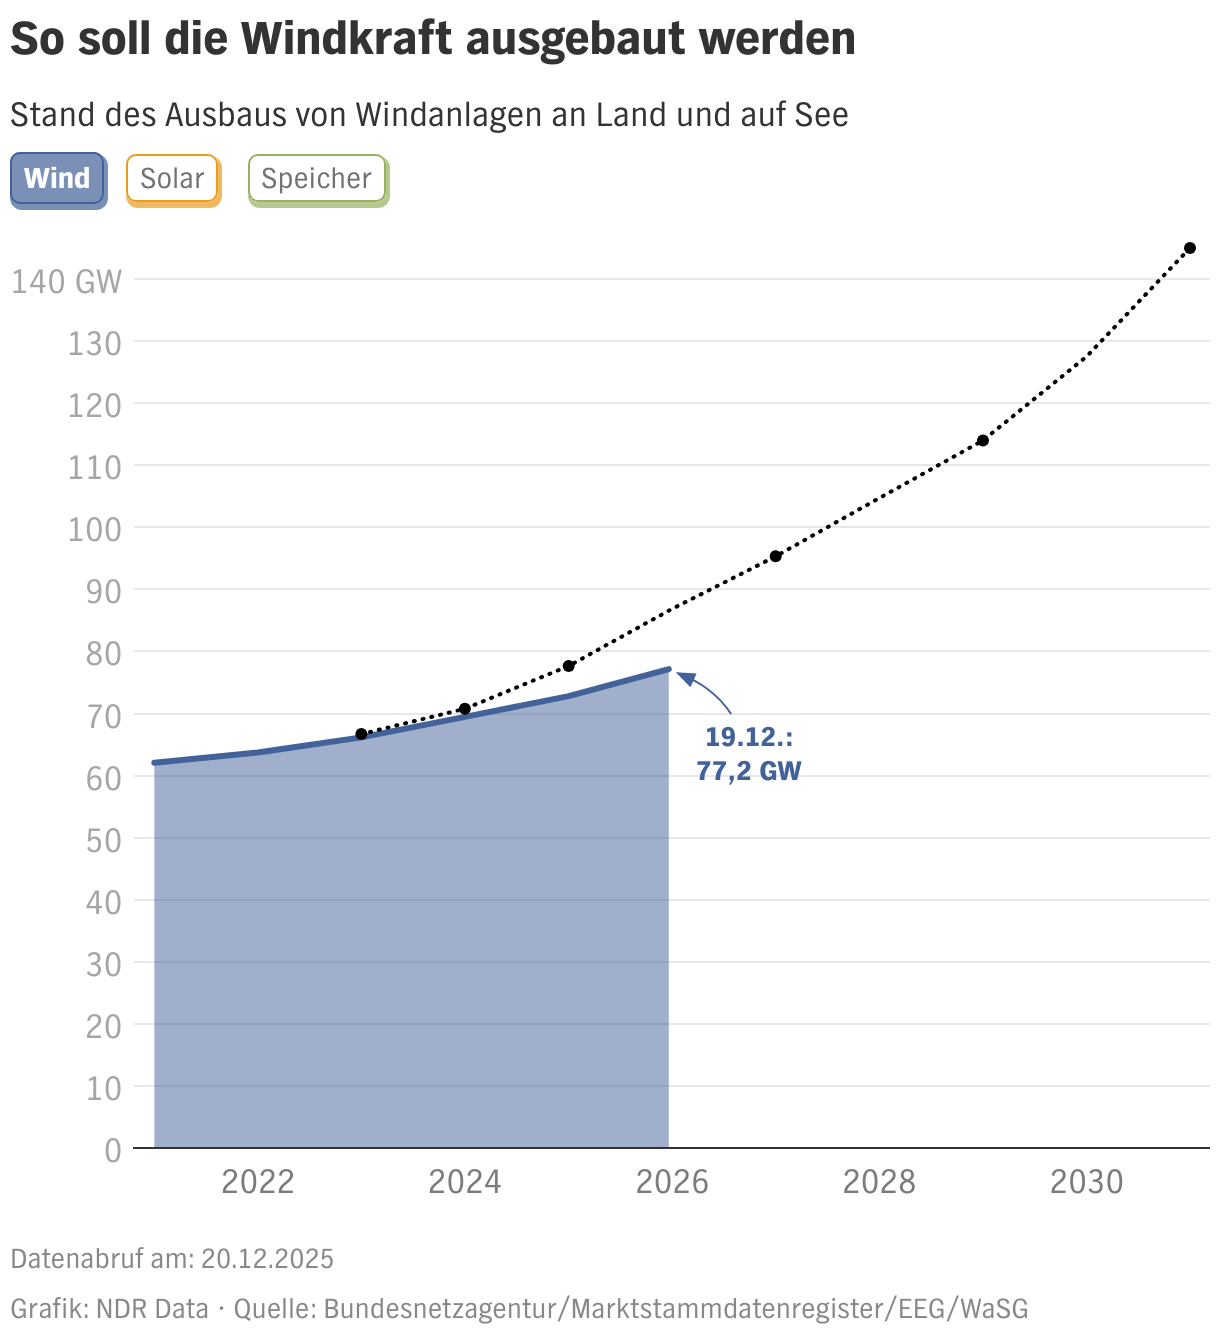
So the problem that we had is sometimes you have very similar charts that you want to present together, but Datawrapper doesn't really allow you to do this. The example I've got here is how renewable energy systems are being expanded in Germany. One chart is for solar energy and one is for wind energy, and we wanted to link them together so that they look like they do in the next slide with this little button and in the top left, where you can switch from wind to solar, as you like. So we're going to be looking at a bunch of code in here. Please don't try and screenshot the code, because I'm going to give you a working copy of the code that we use later on. And then you're welcome to just copy it and use it.
Datawrapper's solution
[00:01:25] Lalon Sander: This is what the code looks like that Datawrapper suggests that you use. So the end effect, I think Amanda showed yesterday, is a chart like this, where you can switch between Spain, Germany, Italy, UK, France, and Europe. And basically, this is what we're working with. This is a set of HTML links, which are put into the description box in your Datawrapper chart.
The details really aren't that important. You can go look them up on this blog post on the Datawrapper Academy to see how to do this in detail. And so basically each one of the charts needs its own button and it's basically the same HTML code each time.
And there are three things that are varied. One is the chart ID of the chart that you're linking to. One is the label, like the piece of text that says "Spain" or "Italy" or "Europe". And in some cases, or you could, if you wanted to, vary the color of the button that you're creating. And once you've made this code, you just add it into this description field for each of your charts, and then basically you have this sort of chart where you can click through from one to the other.
Problem with Datawrapper's solution
[00:02:52] Lalon Sander: The only problem we had with this solution is that all of these buttons look the same. So if we're looking at this chart, we don't really know which one of these charts we're looking at. Except if we start reading the title and we see, oh, this is Europe.
And if you've been using buttons on computers, you know that there's a very intuitive way of doing this, making it look like the button's been pressed. Or somehow differentiating the button that is currently active, from the other ones.
And another problem that arises over here is, all of the buttons are clickable, so even the one for the chart that we're looking at. So if we click on that button, it just reloads the file. The problem is: If you want to have a different button for each of these, or if you want to have a different look for the button, whenever the chart is active, you actually have to start varying the code for each of these buttons. So the code for the active button needs to look slightly different for each of the other ones. And that means you have to go through all of these charts and change one button in the HTML code each time. And this is actually a very good example of what's really annoying with creating these buttons then: is that you have six charts, which each have a unique set of code, and in each of these bits of code you need to vary different parts of the code. And so basically you need to, in the worst case write 36 bits of HTML link code, to create this. And when you start doing that, you start getting into problems like:
You forgot to change the label. So there's Spain twice, but which one is the correct Spain and which one is actually Italy.
You forgot to change the chart ID. You have Spain and Italy, but both of them are showing the same chart. And you need to find out which one's the correct chart.
The chart ID and label don't match, so you have a button for Spain and Italy, but the Spain button is showing the Italy chart and the Italy button is showing this Spain chart.
People like me who don't do a lot of work in HTML have the problem, they messed up the HTML, but which bit? I have no idea. I need to go look through this whole thing again.
I fixed something in one chart. A link that was swapped out, I fixed it. Now I have to do it in all of the five other charts. I need to go through there and fix the link swap there as well.
I want to exchange the orders. So I don't want Europe to be at the very end. I want Europe to be at the front. I need to go through the code for all six of these charts to move that from one end to the other.
I'm going through this just to try to give you the feeling that I had, when I came across this problem while trying to link a bunch of charts. And what I thought then was, this really isn't something that I need to be sitting down and doing for an hour. I can write code, that can loop through this and write this for me in the correct way for each of the charts that I want. And as we saw earlier, there are actually only three things that I need to vary on code that looks very similar.
Our better solution, a Python app
[00:06:35] Lalon Sander: So this is the solution that we came up with for the NDR. The TAZ, who I work for, they have a similar solution. Or we basically implemented a similar solution at TAZ first and then at NDR. And each of these used the style guides for each of these organizations.
This is a chart of election results. So each of the buttons is colored to match the color of the party being shown. There's a visible cue showing which chart is currently being shown, the chart for SPD. And each of these eight charts now has its own unique HTML code, because in each of these charts, a different button is being shown as the active button.
So this is an example for when we really appreciate the tool that we have, because, as I said earlier, if you have six buttons, you're writing 36 pieces of code. If you have eight buttons, you're writing 84 pieces of code. And there are so many ways to mess up label, chart and colors in these. And then you're debugging for ages.
We need three inputs to automate this. We want a list of charts in the order that we want to link them. We need a list of labels, what do we want to call them? Europe, Spain, Italy, and so on. And we need a list of colors, in case we want to change around the colors for each button.
But we can also just repeat the same color if we want to have the same color button for each of the buttons.
And then, basically what a piece of code does is loop through each of the charts and loop through them again to create for each chart its own particular combination of active chart buttons and not active chart buttons. So the active chart button basically generates the button for the chart that is currently being shown and the non active chart button shows all of the other buttons. And it basically, it's two loops within each other, and it runs through this and creates the buttons for all of them, and then uses the Datawrapper API to push that HTML code into the description field and uses the Datawrapper API to republish that chart.
So I usually use Python for everything. And what Python has is a library called Streamlit, which can be used to make a sort of simple form web app. And there's also a platform where you can host these apps. So basically what we have is our button tool on the open internet, where you can add the chart IDs, you can add the labels, and you can choose various different colors which match up with our internal style guides. And you can also add some extra text for the description field.
You need a passcode because, as I said, this app is on the open internet, and we don't want anyone to just go in there and start linking our charts. You get the passcode, when I personally show how to use the app. So basically only users from within our organization can actually use it. And what happens when you filled all of this out, you press at the bottom, it says, click here when it can start and then it runs through the, I think, the eight buttons that we just looked at, they get generated for all eight charts within maybe 10, 15 seconds. And basically, at the end of that, all of the charts are republished with all eight of these buttons.
Benefits of the Python app
[00:10:56] Lalon Sander: It's extremely fast compared to having a human do all of this. With the web app that we use at the end, you don't need any knowledge of HTML or Python. And there are very few errors that you can make. And if you do have errors, you can correct them by just rerunning the app again with the correct inputs.
What we have is, we have hardcore coded styles and colors. If you look at this, you can see that there are a number of shades of each of these colors in use here. You only add the red, but it'll add a transparency layer to the red for the center of the button. And when it's the non active button, it'll actually be a slightly different color of red.
It does all of those calculations by themselves, so you don't have to sit there and transform your hex codes into RGB codes and add transparencies and stuff like that. You can correct mistakes and make changes in seconds.
And what we can also do is standardize other things. Like we started noticing that we don't want buttons which have multiple words to be on two sides of a line break. We want them to break completely as one button. So you can add things like non breaking spaces and non breaking hyphens, which are hard-coded into this app. So you can enter your labels with a space, but it'll be converted into a non breaking space.
I've prepared a Google Collab notebook, which coder people who use Python among you can open up and look at the code and recreate the code using your own styles if you like. Anyone who's not a coder will actually just see the form over here. Which works exactly as I described in our app. You basically need to add the inputs at the top and then run both cells with Shift+Enter. Collab is Google's way of hosting the coding notebooks. So it works a bit like sharing a Google document. You copy it into your own Drive and then you can start writing in there.
What you need to do to use the notebook is generate a Datawrapper API token. And it's not safe to keep your API token in your Colab notebook, even though it's in your Drive and so on. So create an API token, use it, revoke it after using it. Next time you use this, create a new API token.
This is set up in a way that it'll produce the buttons as shown on the Datawrapper tutorial blog. Except that non active buttons will be in gray and the active buttons will be in the color that you define. But you can also just go into the code and change the HTML if you like. And if you have Python developers on your teams, you can ask them to create like a Streamlit app or something. But mainly, I'd love for Datawrapper developers to steal my code and make this into a function on the Datawrapper main product. Because then I don't have to maintain the sloppy code that I wrote for my teams. And, you can do a lot of other stuff, which might make it better. Just, like having a as you create the buttons and so on. Or maybe not having to hack the buttons into the description field, but having an own button field or something where those buttons could appear.
And that's my talk. I hope it saves you a lot of time in the future when you want to link up charts.
[00:15:28] Gregor (host): Thank you so much, Lalon, for your talk. The struggle is definitely real. We are a bit behind of time, so we have to skip the questions, but I still want to show some of the comments, quickly. So we have, I hear you Lalon. I did all of this by hand. And, I feel these examples so much. And I myself, also had to do this manually. Great tool that you built.
We asked a few additional questions before his talk:
Lalon, what will you talk about?
Datawrapper offers a clever workaround to link multiple charts by adding HTML links to the chart descriptions. However, the process is repetitive and a little tedious – if you're linking five charts, you have to write and modify code for 25 buttons. Using Python and Streamlit, we built a tool with which we can link any number of charts together, while ensuring a standardized look over all our articles and conforming to our corporate color schemes.
Why/how did you start using Datawrapper?
The taz had a Datawrapper account quite early on (2016, if not earlier), which we used to migrate our charts away from Google Charts, which had served our purposes well till then. Datawrapper didn't have a map function at the time and was often very cumbersome. It's exciting to see how Datawrapper has added numerous features over the past years and has now become the industry standard for data journalists.
What has changed since you started using Datawrapper?
The biggest change for me has been the ability to create and update Datawrapper charts via API. This has made it effortless to create dashboards that update their data daily, as well as to create many similar charts from one data source.
The linking tool I am presenting has made our everyday work extremely easy and would be unthinkable without an API. In my day-to-day work, charts created completely by hand are now the exception rather than the rule.
We loved Lalon's talk at Unwrapped! You can find more about him on X, Mastodon, and Bluesky. To find out more about Unwrapped and hear other great speakers, visit our blog.


