Say hi to Moritz!

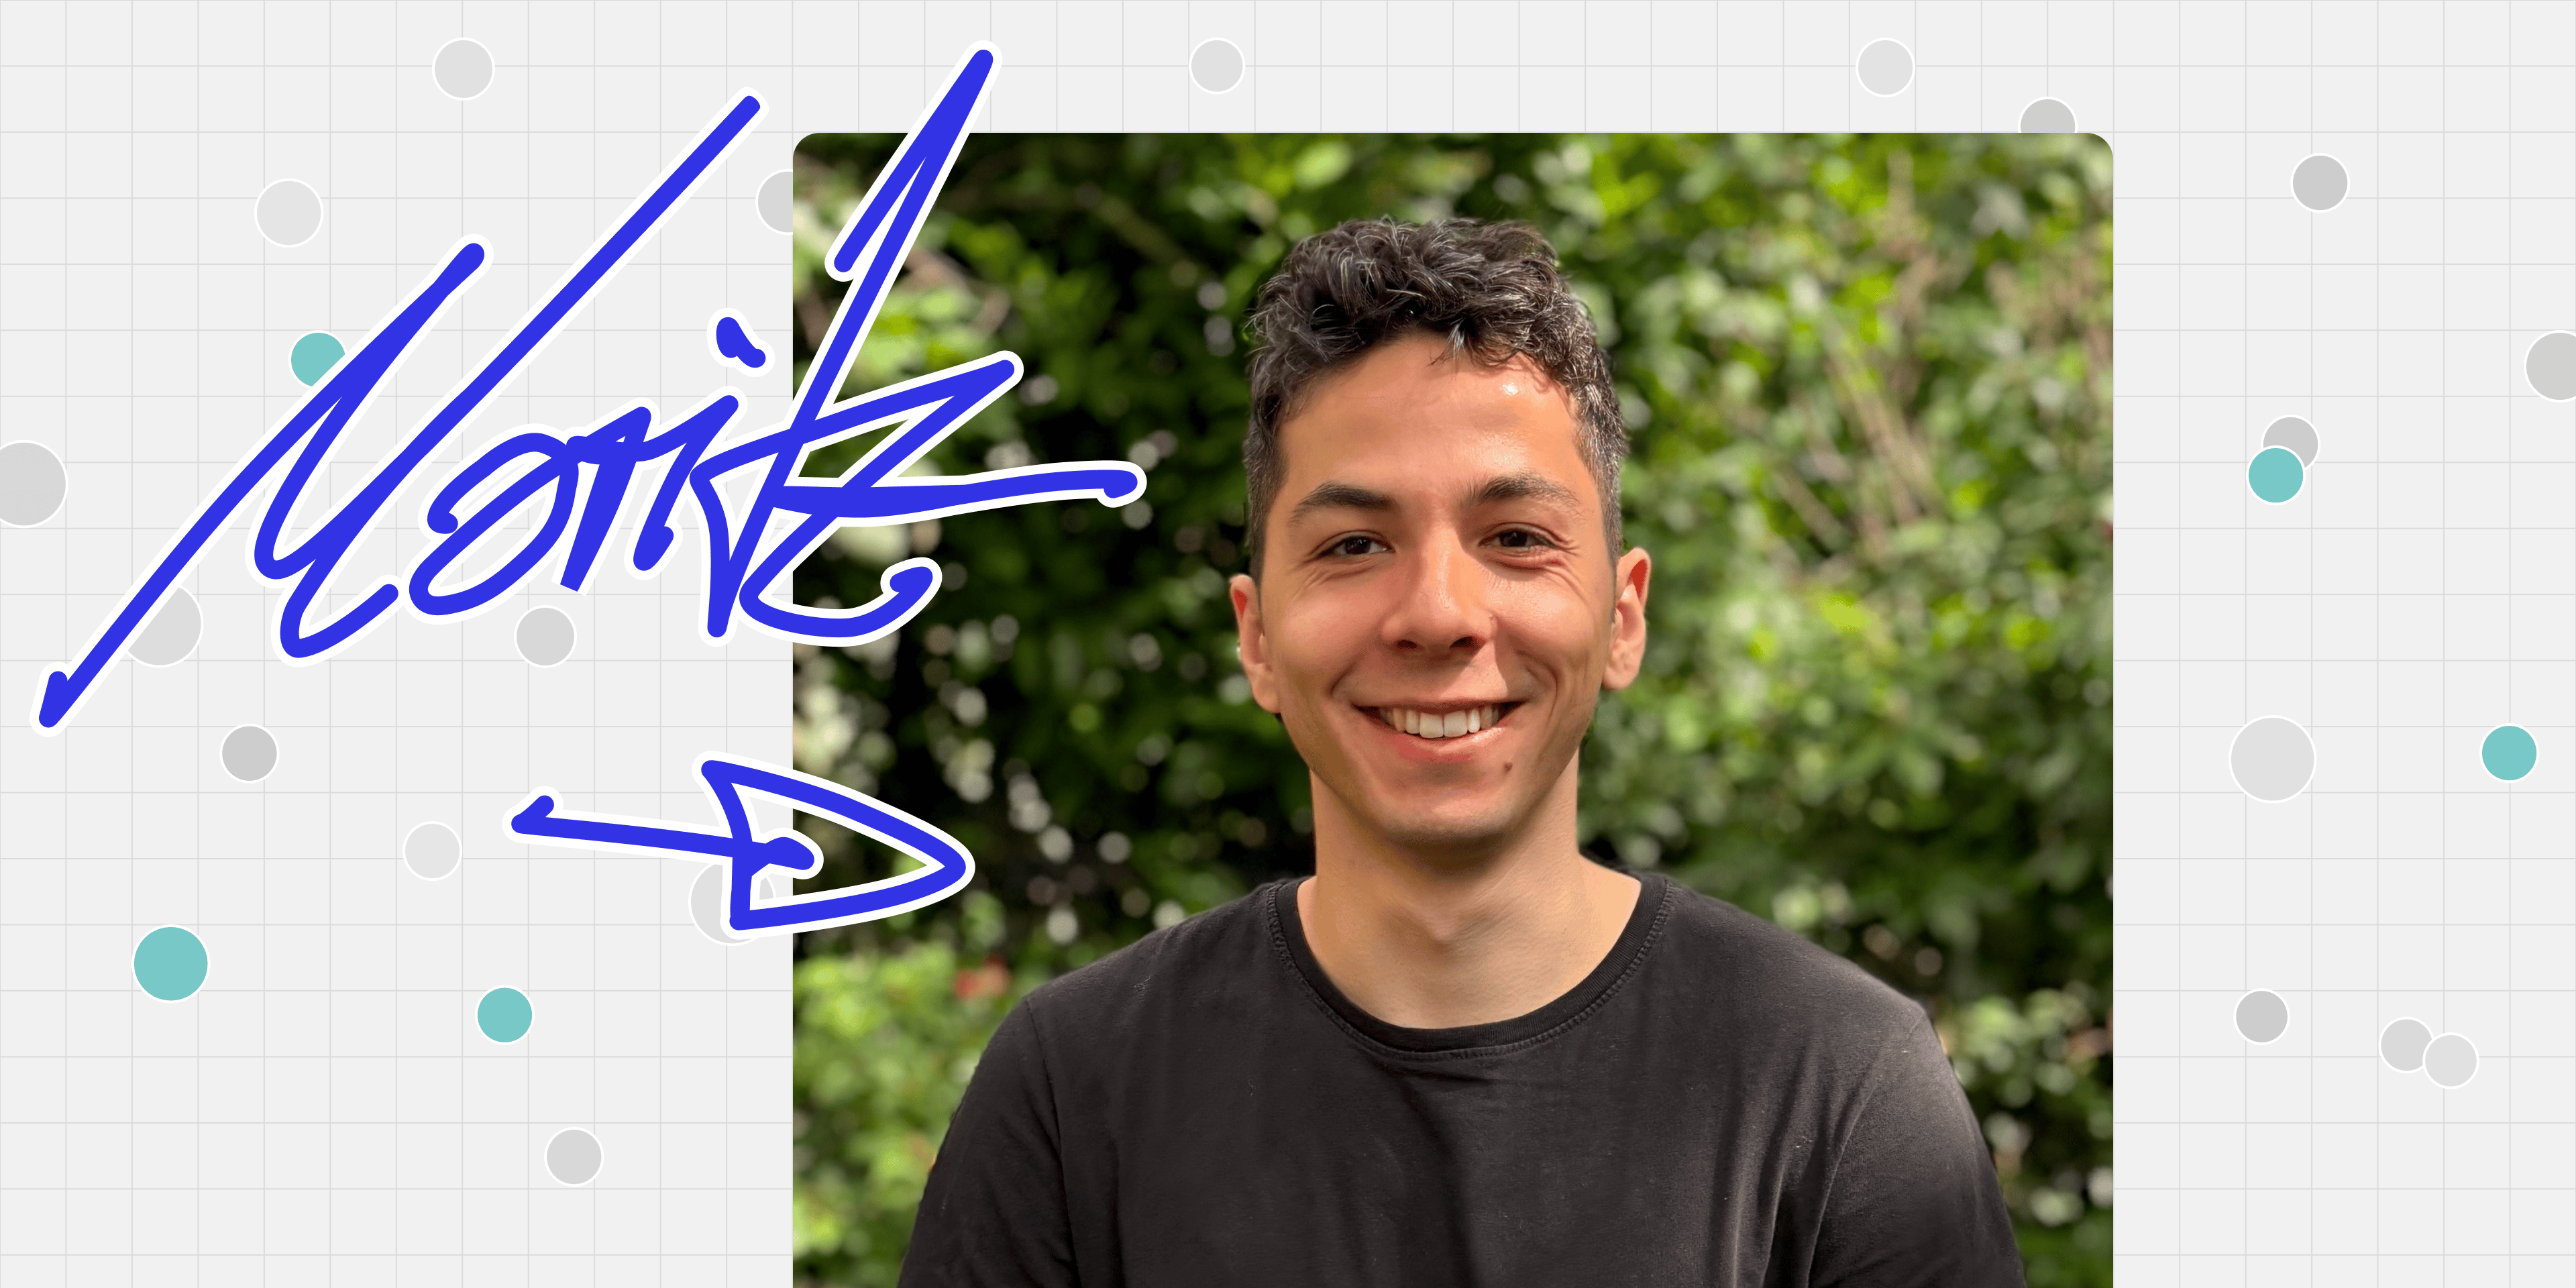
Our goal at Datawrapper is to help you create beautiful visualizations — and that means making our app intuitive, easy-to-use, and even beautiful too. Product design is an important part of all our design team's work, and we're now growing that area more with the help of Moritz Kuhn, who joins us four days a week from Frankfurt as a product designer.
Let's get to know him with a few questions
Hi there! Could you introduce yourself?
Hello! My name is Moritz, and I joined Datawrapper as a data vis product designer in April. I’m based in Frankfurt am Main and work mostly remotely, but visit Berlin every now and then.
What did you do before working at Datawrapper?
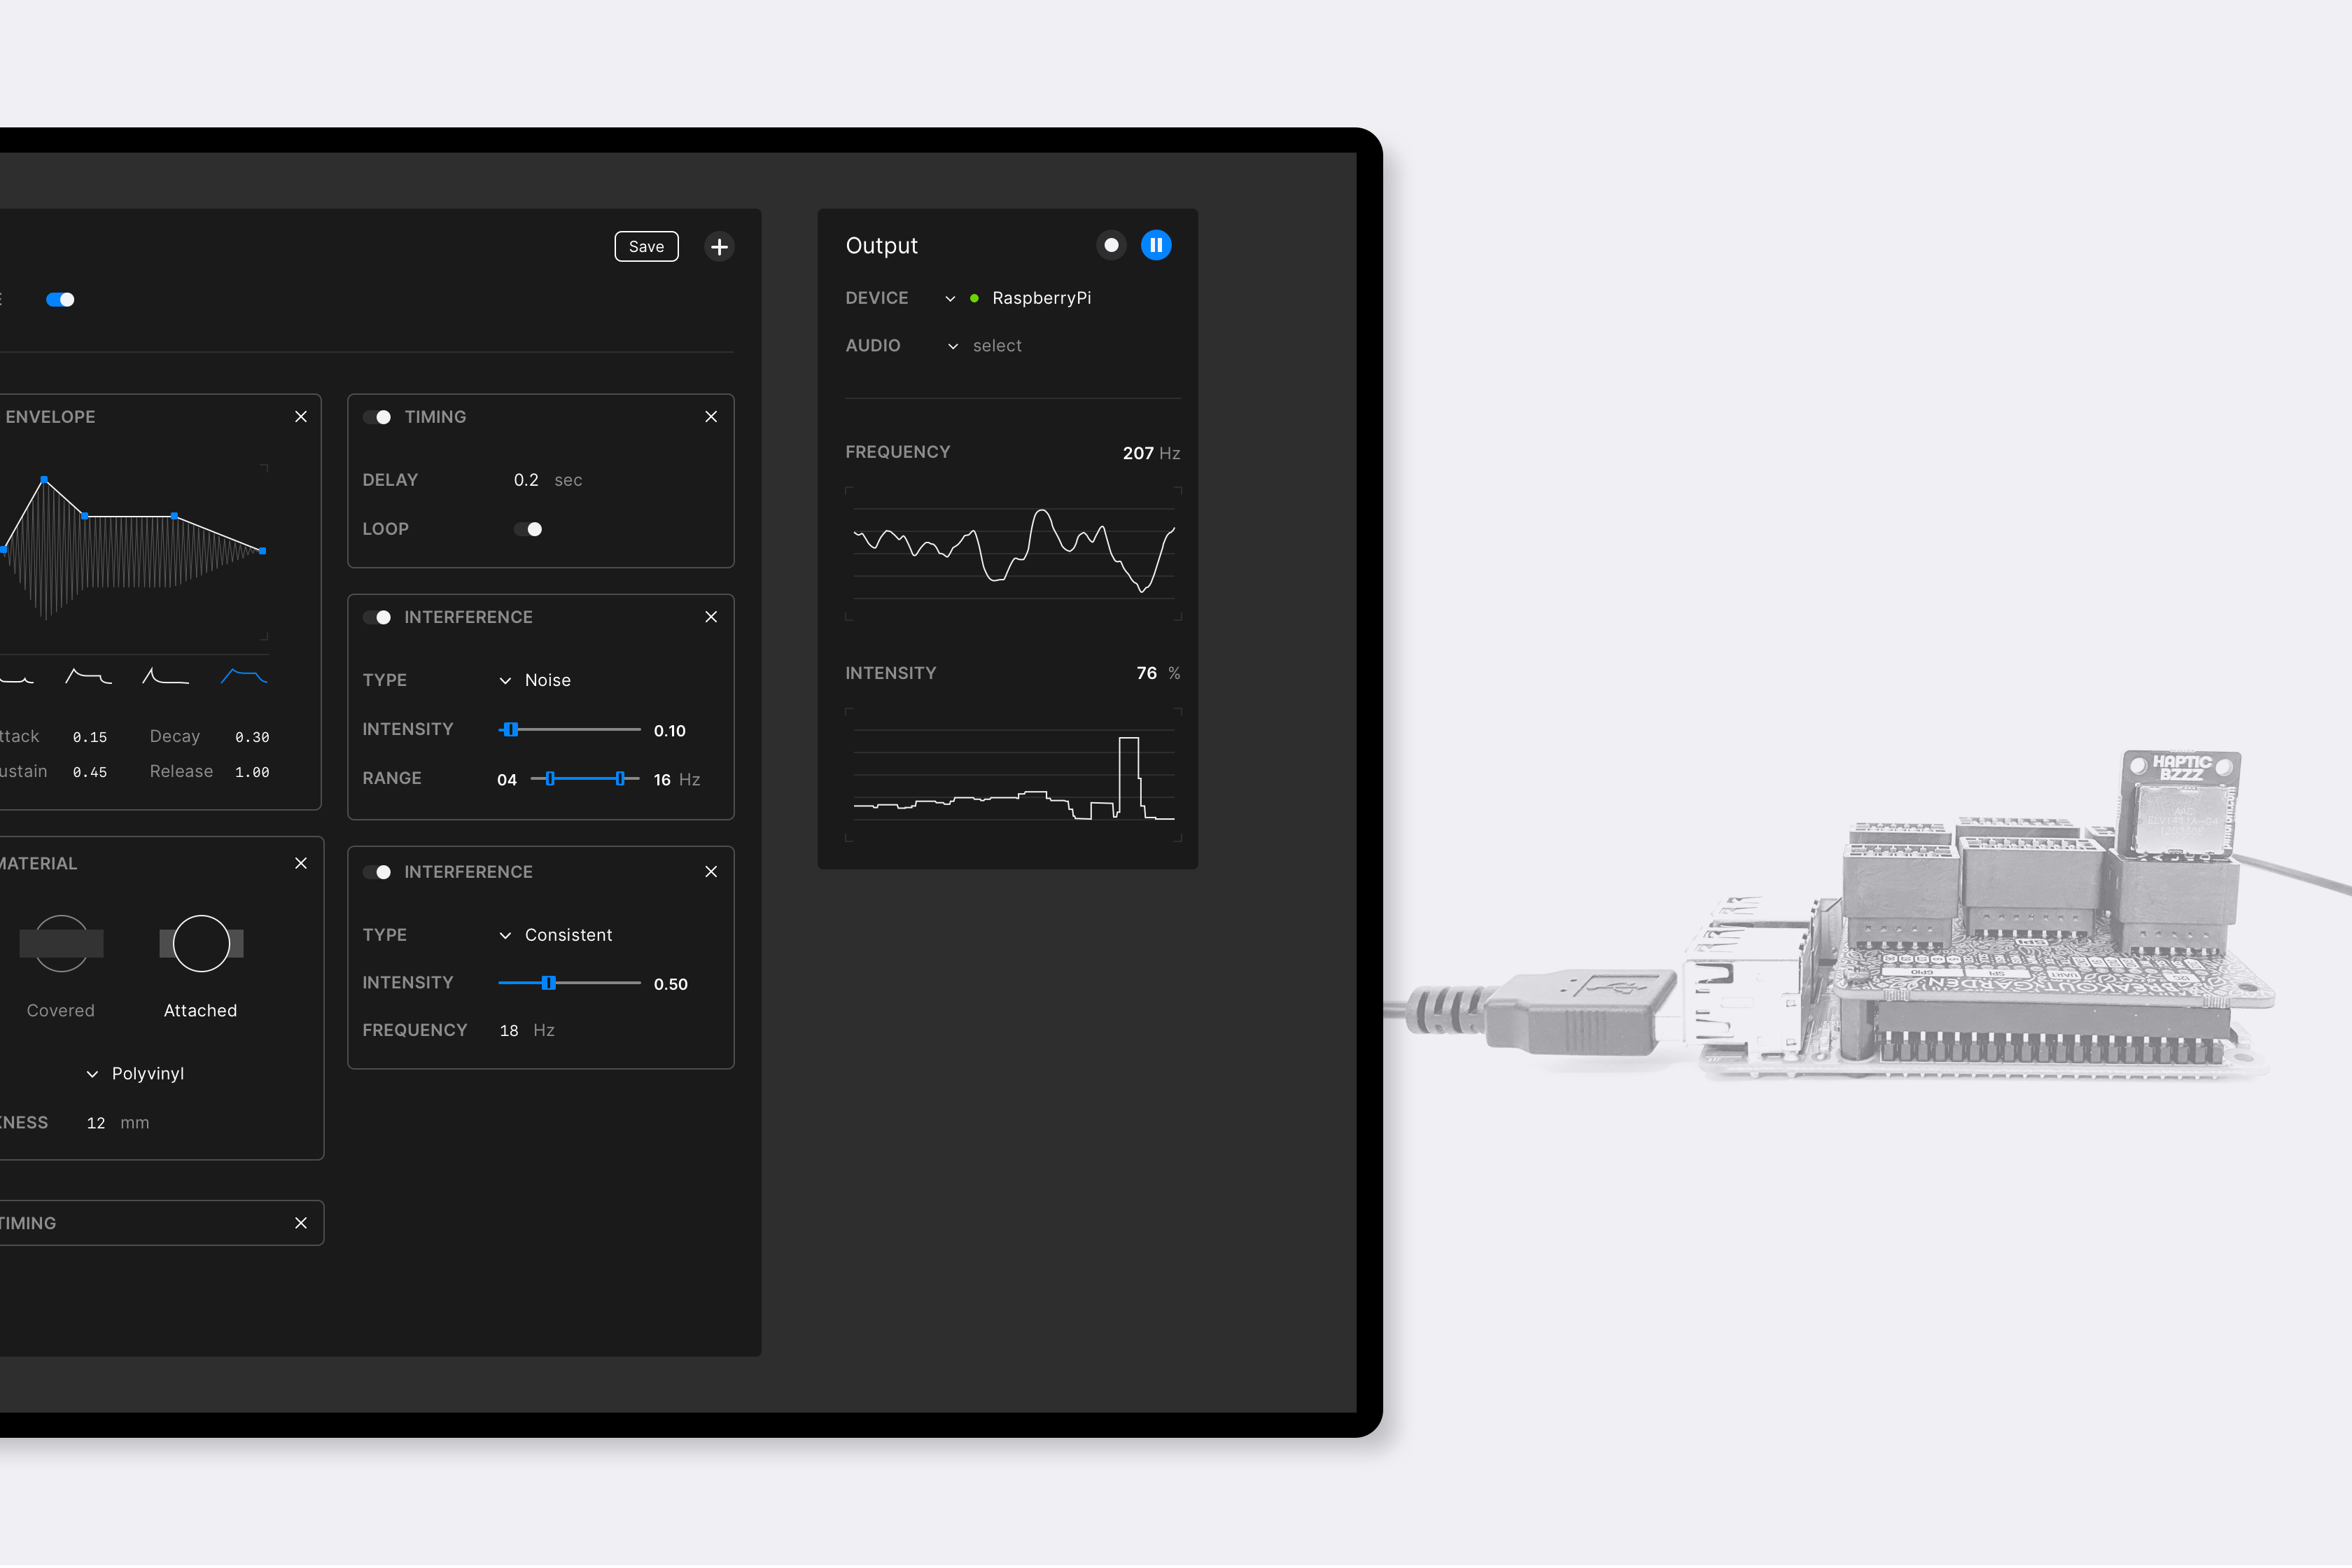
I explored architecture and communication design before ultimately deciding to study design at HfG Gmünd, where I graduated with a bachelor's degree in interaction design. My thesis focused on haptic feedback for digital products.
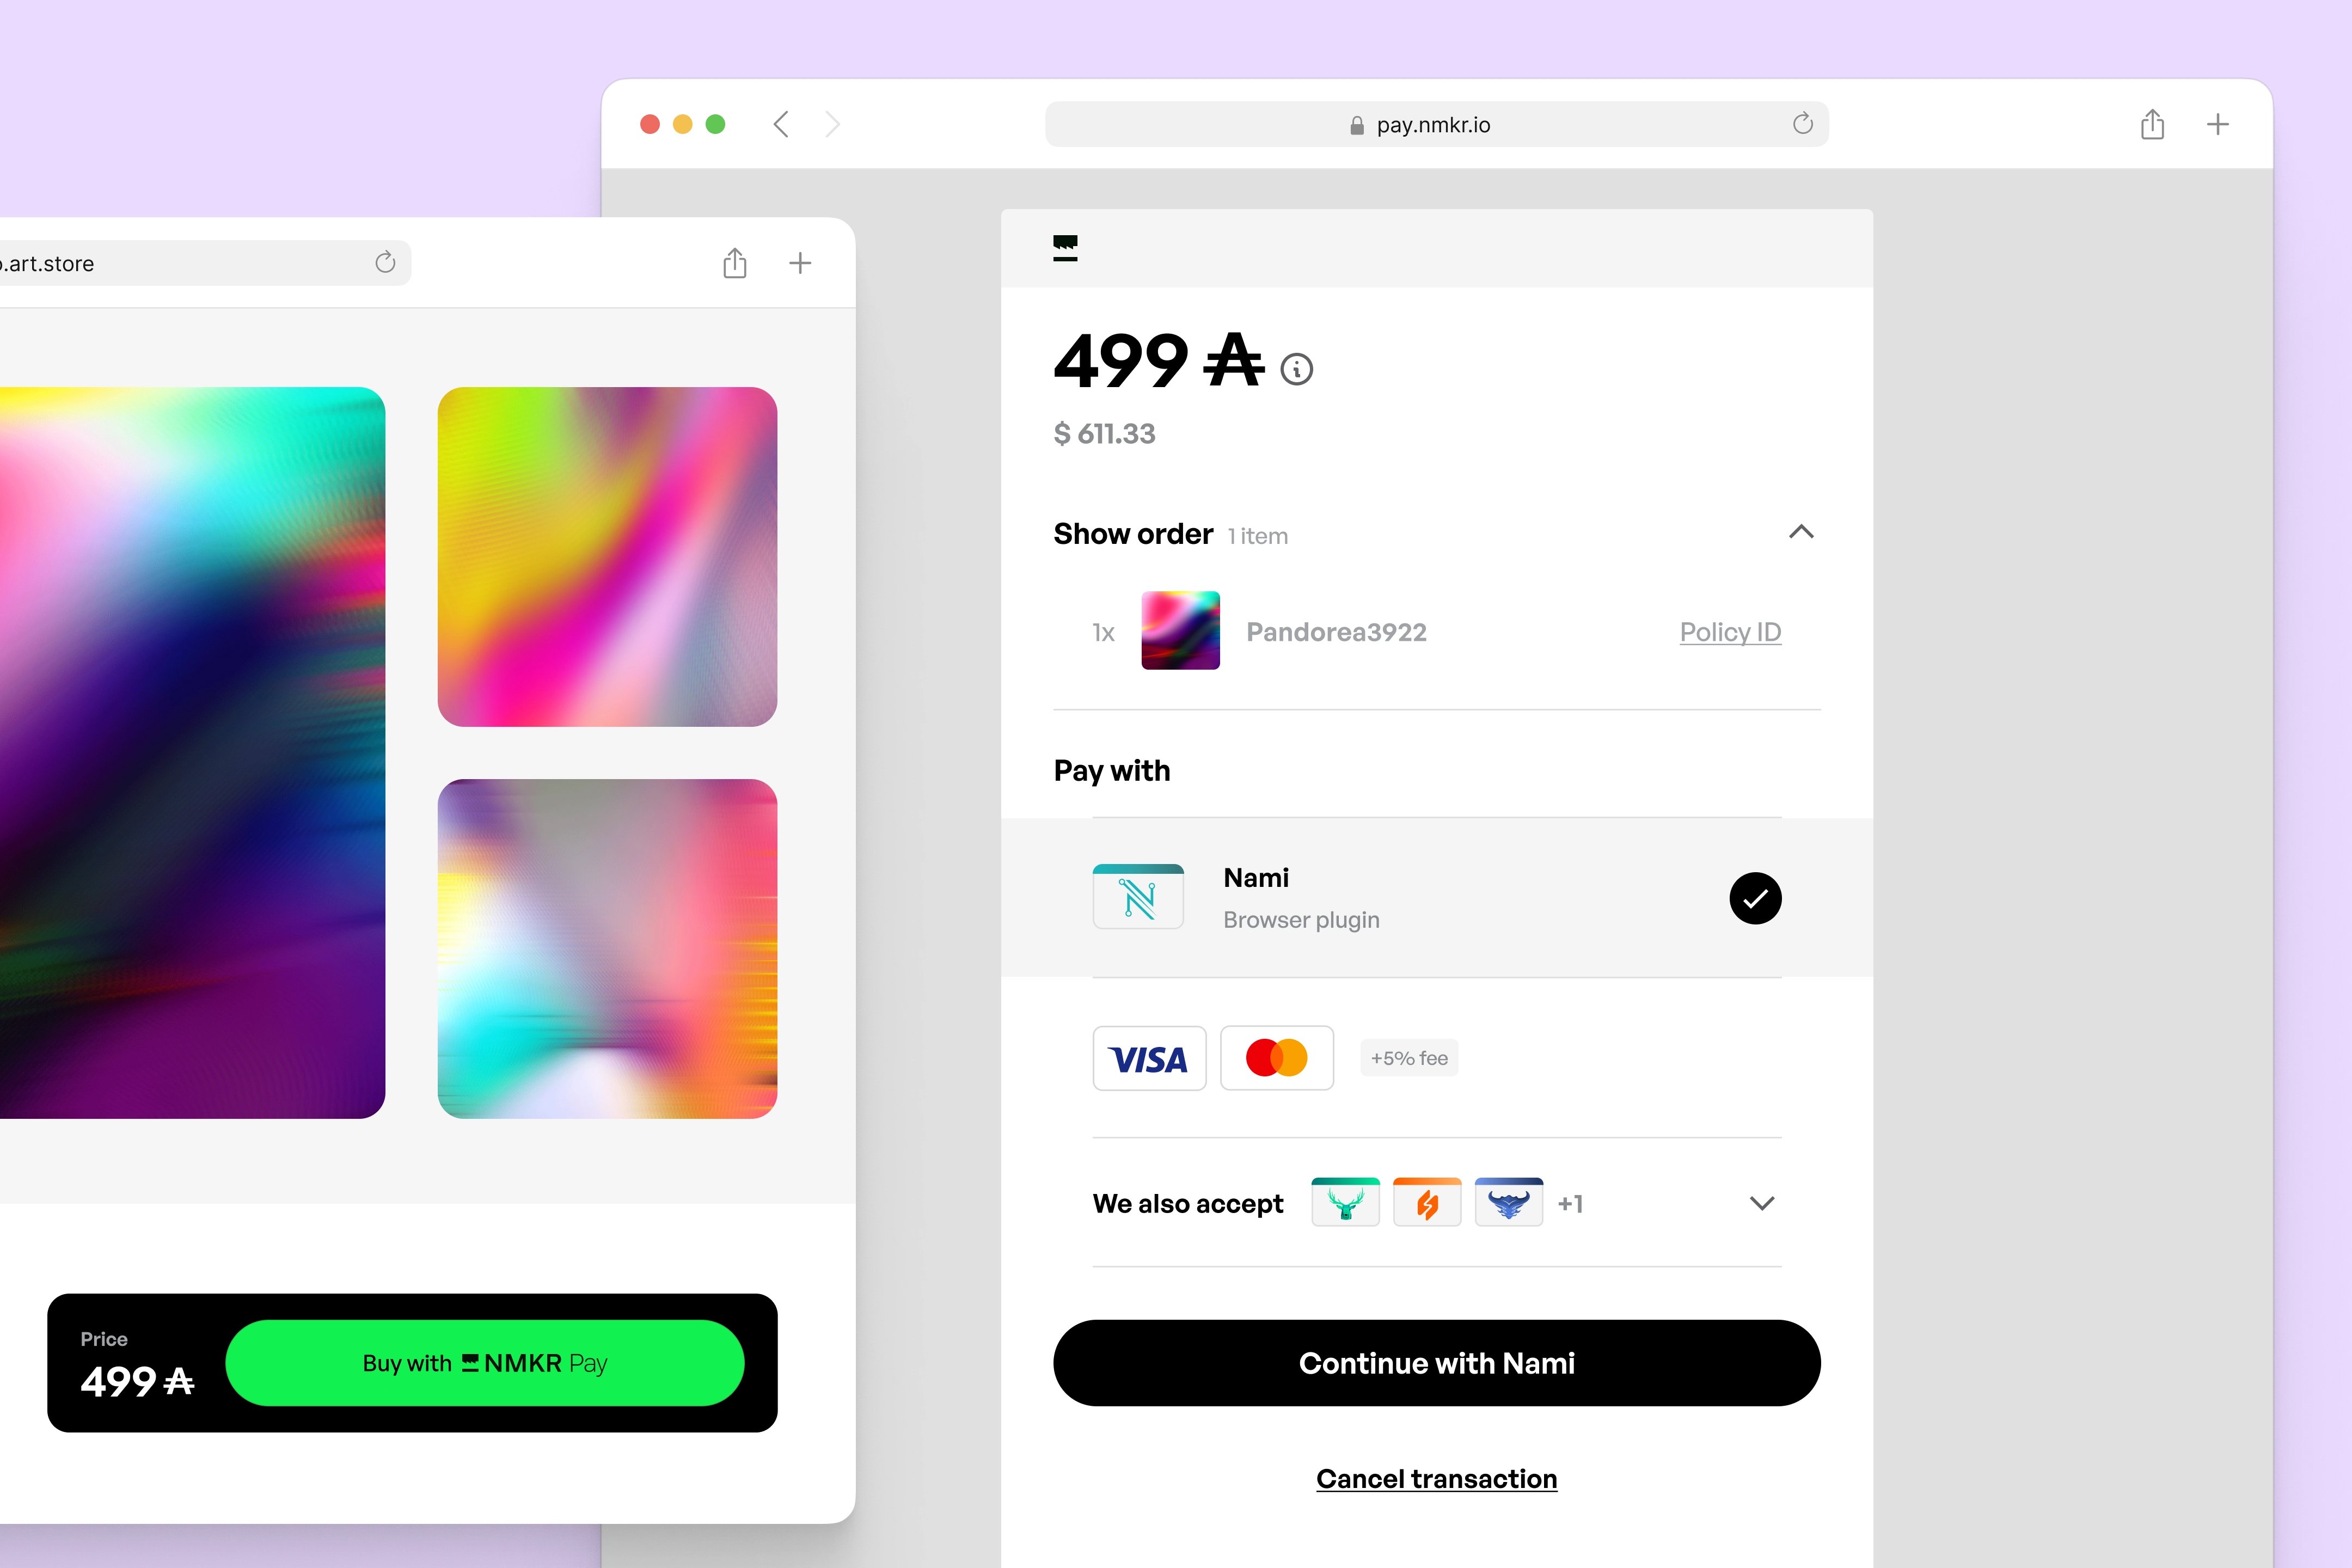
I'm a curious person and strongly believe in learning by doing. After my studies, I was eager to explore different areas of design work. I had the opportunity to work in a more strategic role as a service designer and also collaborate with a good friend on a payment services startup. These experiences helped me realize that I’m happiest when working in a team and contributing long-term to a purposeful product.
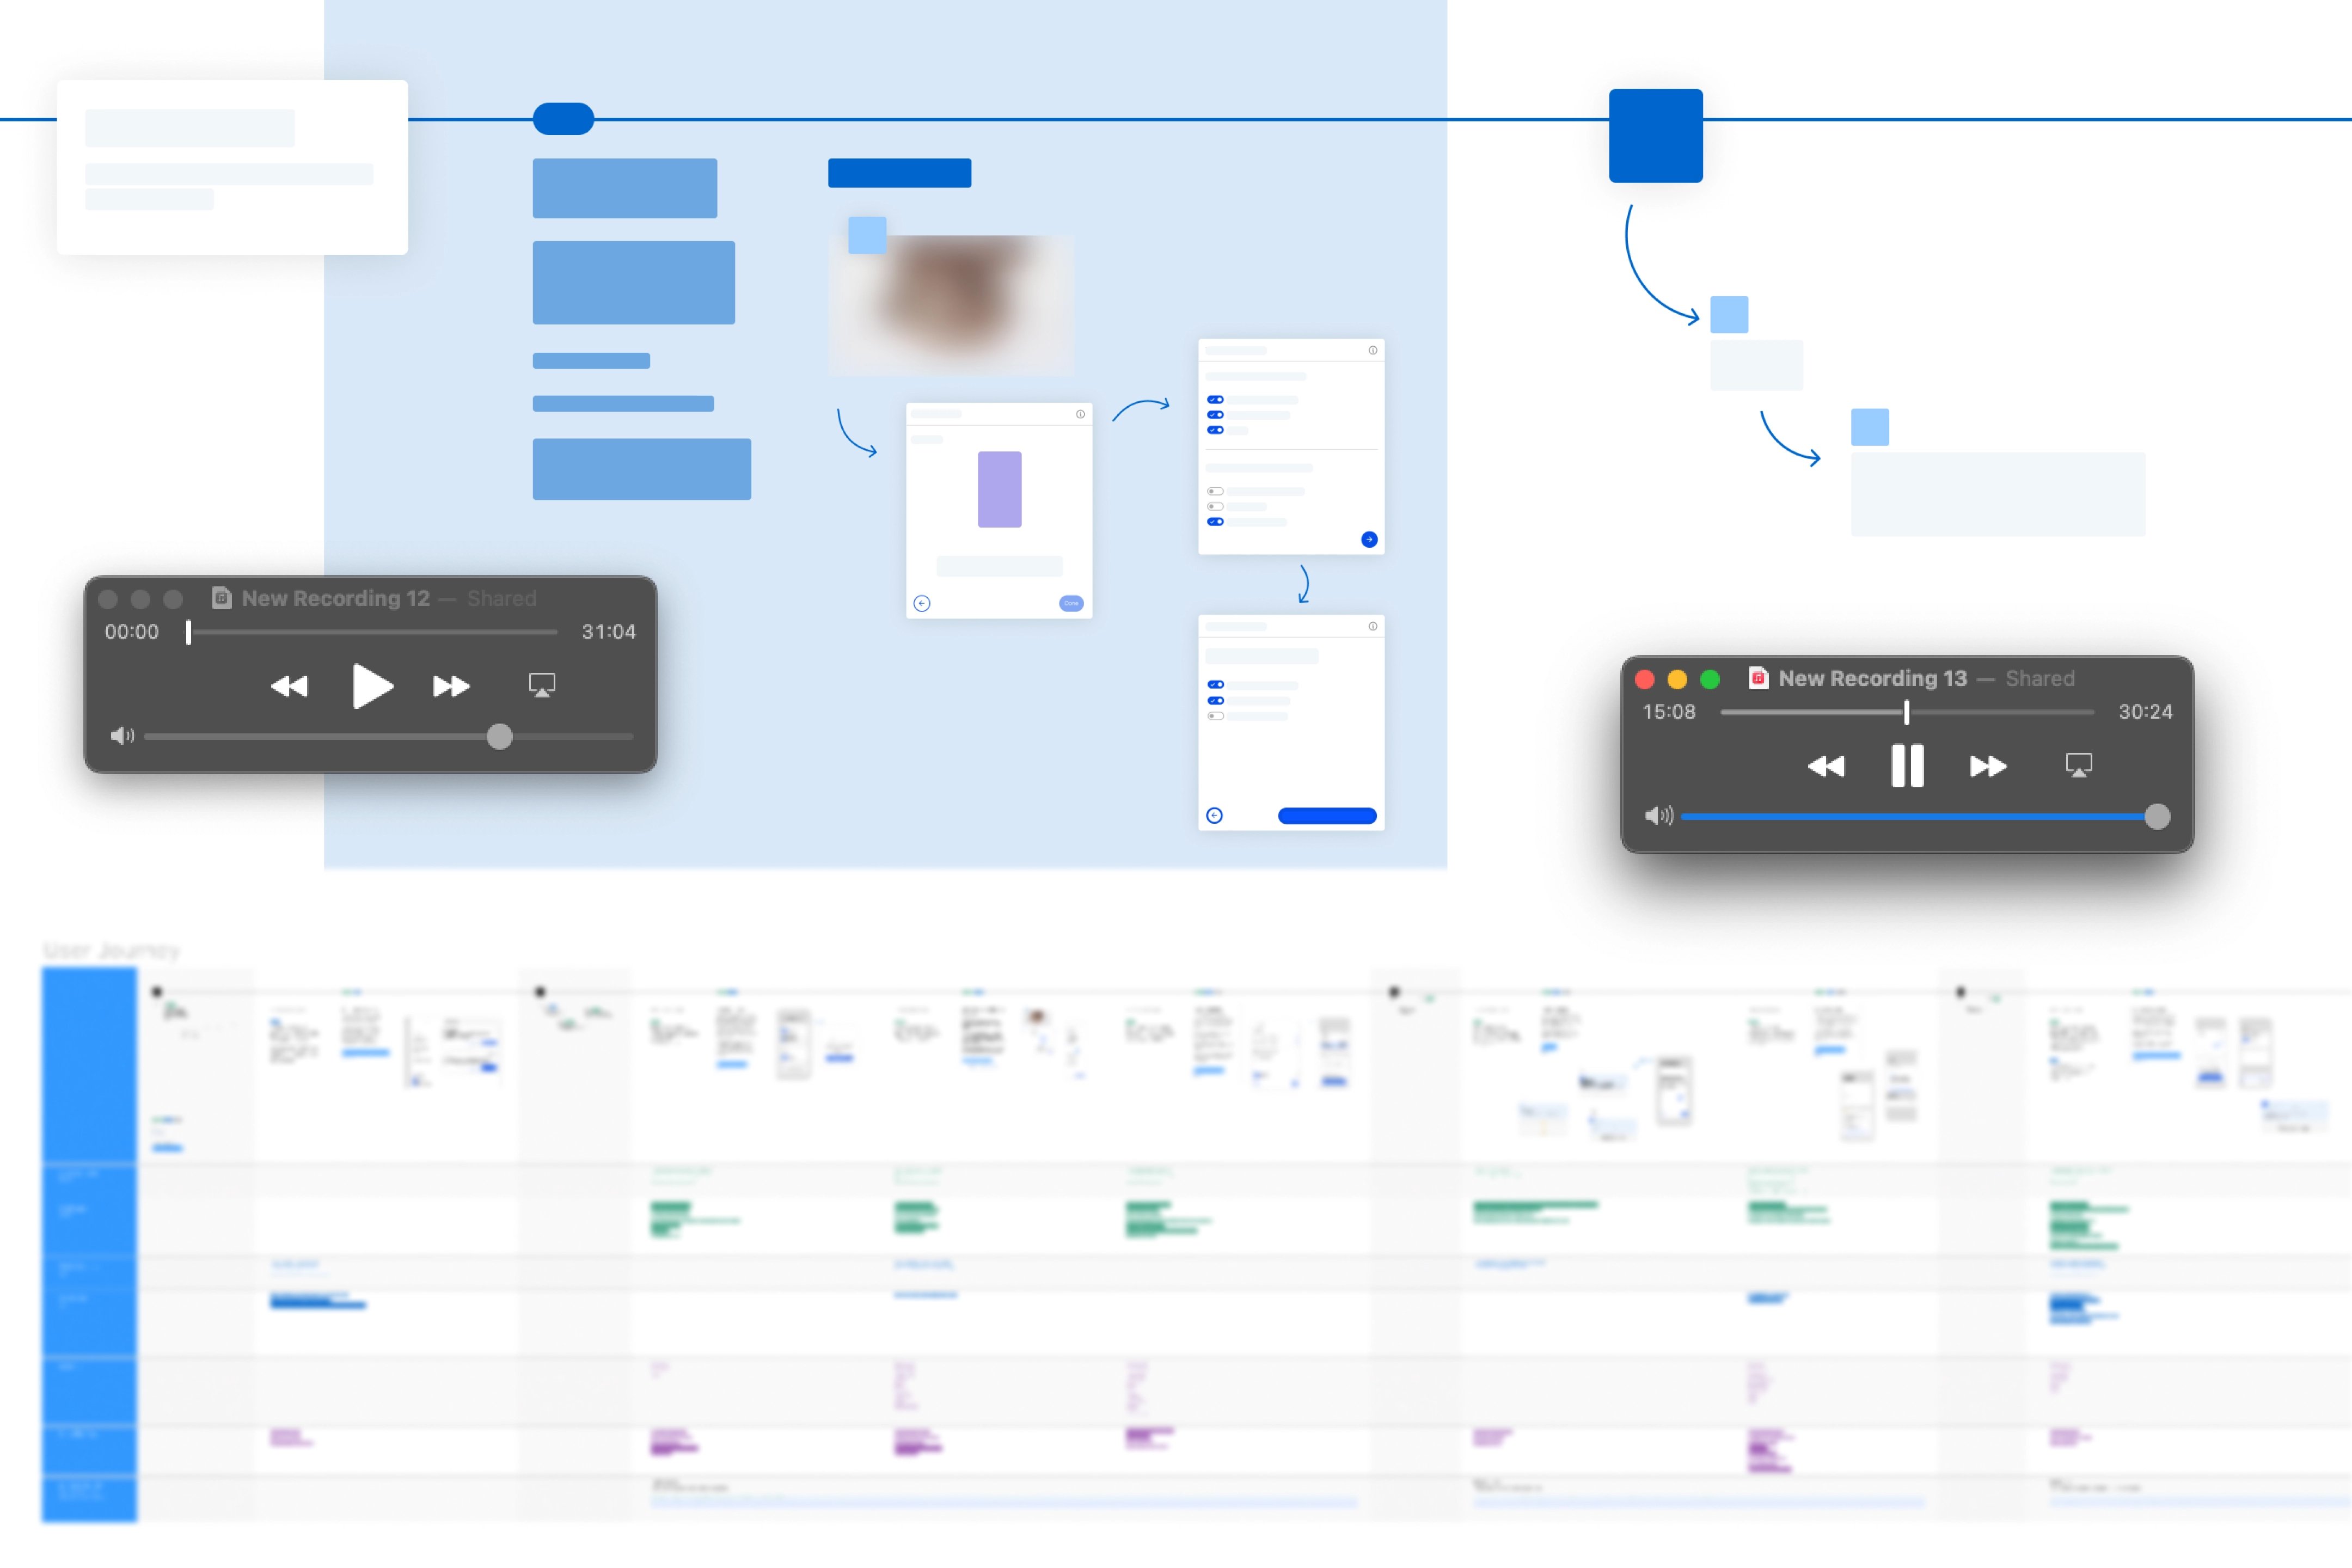
I had the chance to sharpen my product design skills at a digital design agency. One of the projects I worked on there was an outdoors platform with over a million active users. We developed an extensive white label design library to make the system compatible for other brands under the same umbrella brand as well.
How did you get interested in data visualization?
During my studies, I was introduced to interactive and generative data visualization by my professors Benedikt Groß and Hartmut Bohnacker, coauthors of the book "Generative Design." I loved how data visualization brings storytelling together with all the other important aspects of design.
At the same time, I was also working as a freelance reporter for a newspaper. While I didn’t often get to do data visualization there, the experience allowed me to explore design and journalism in parallel, something that deepened my interest in creative storytelling and the combination of these two fields.
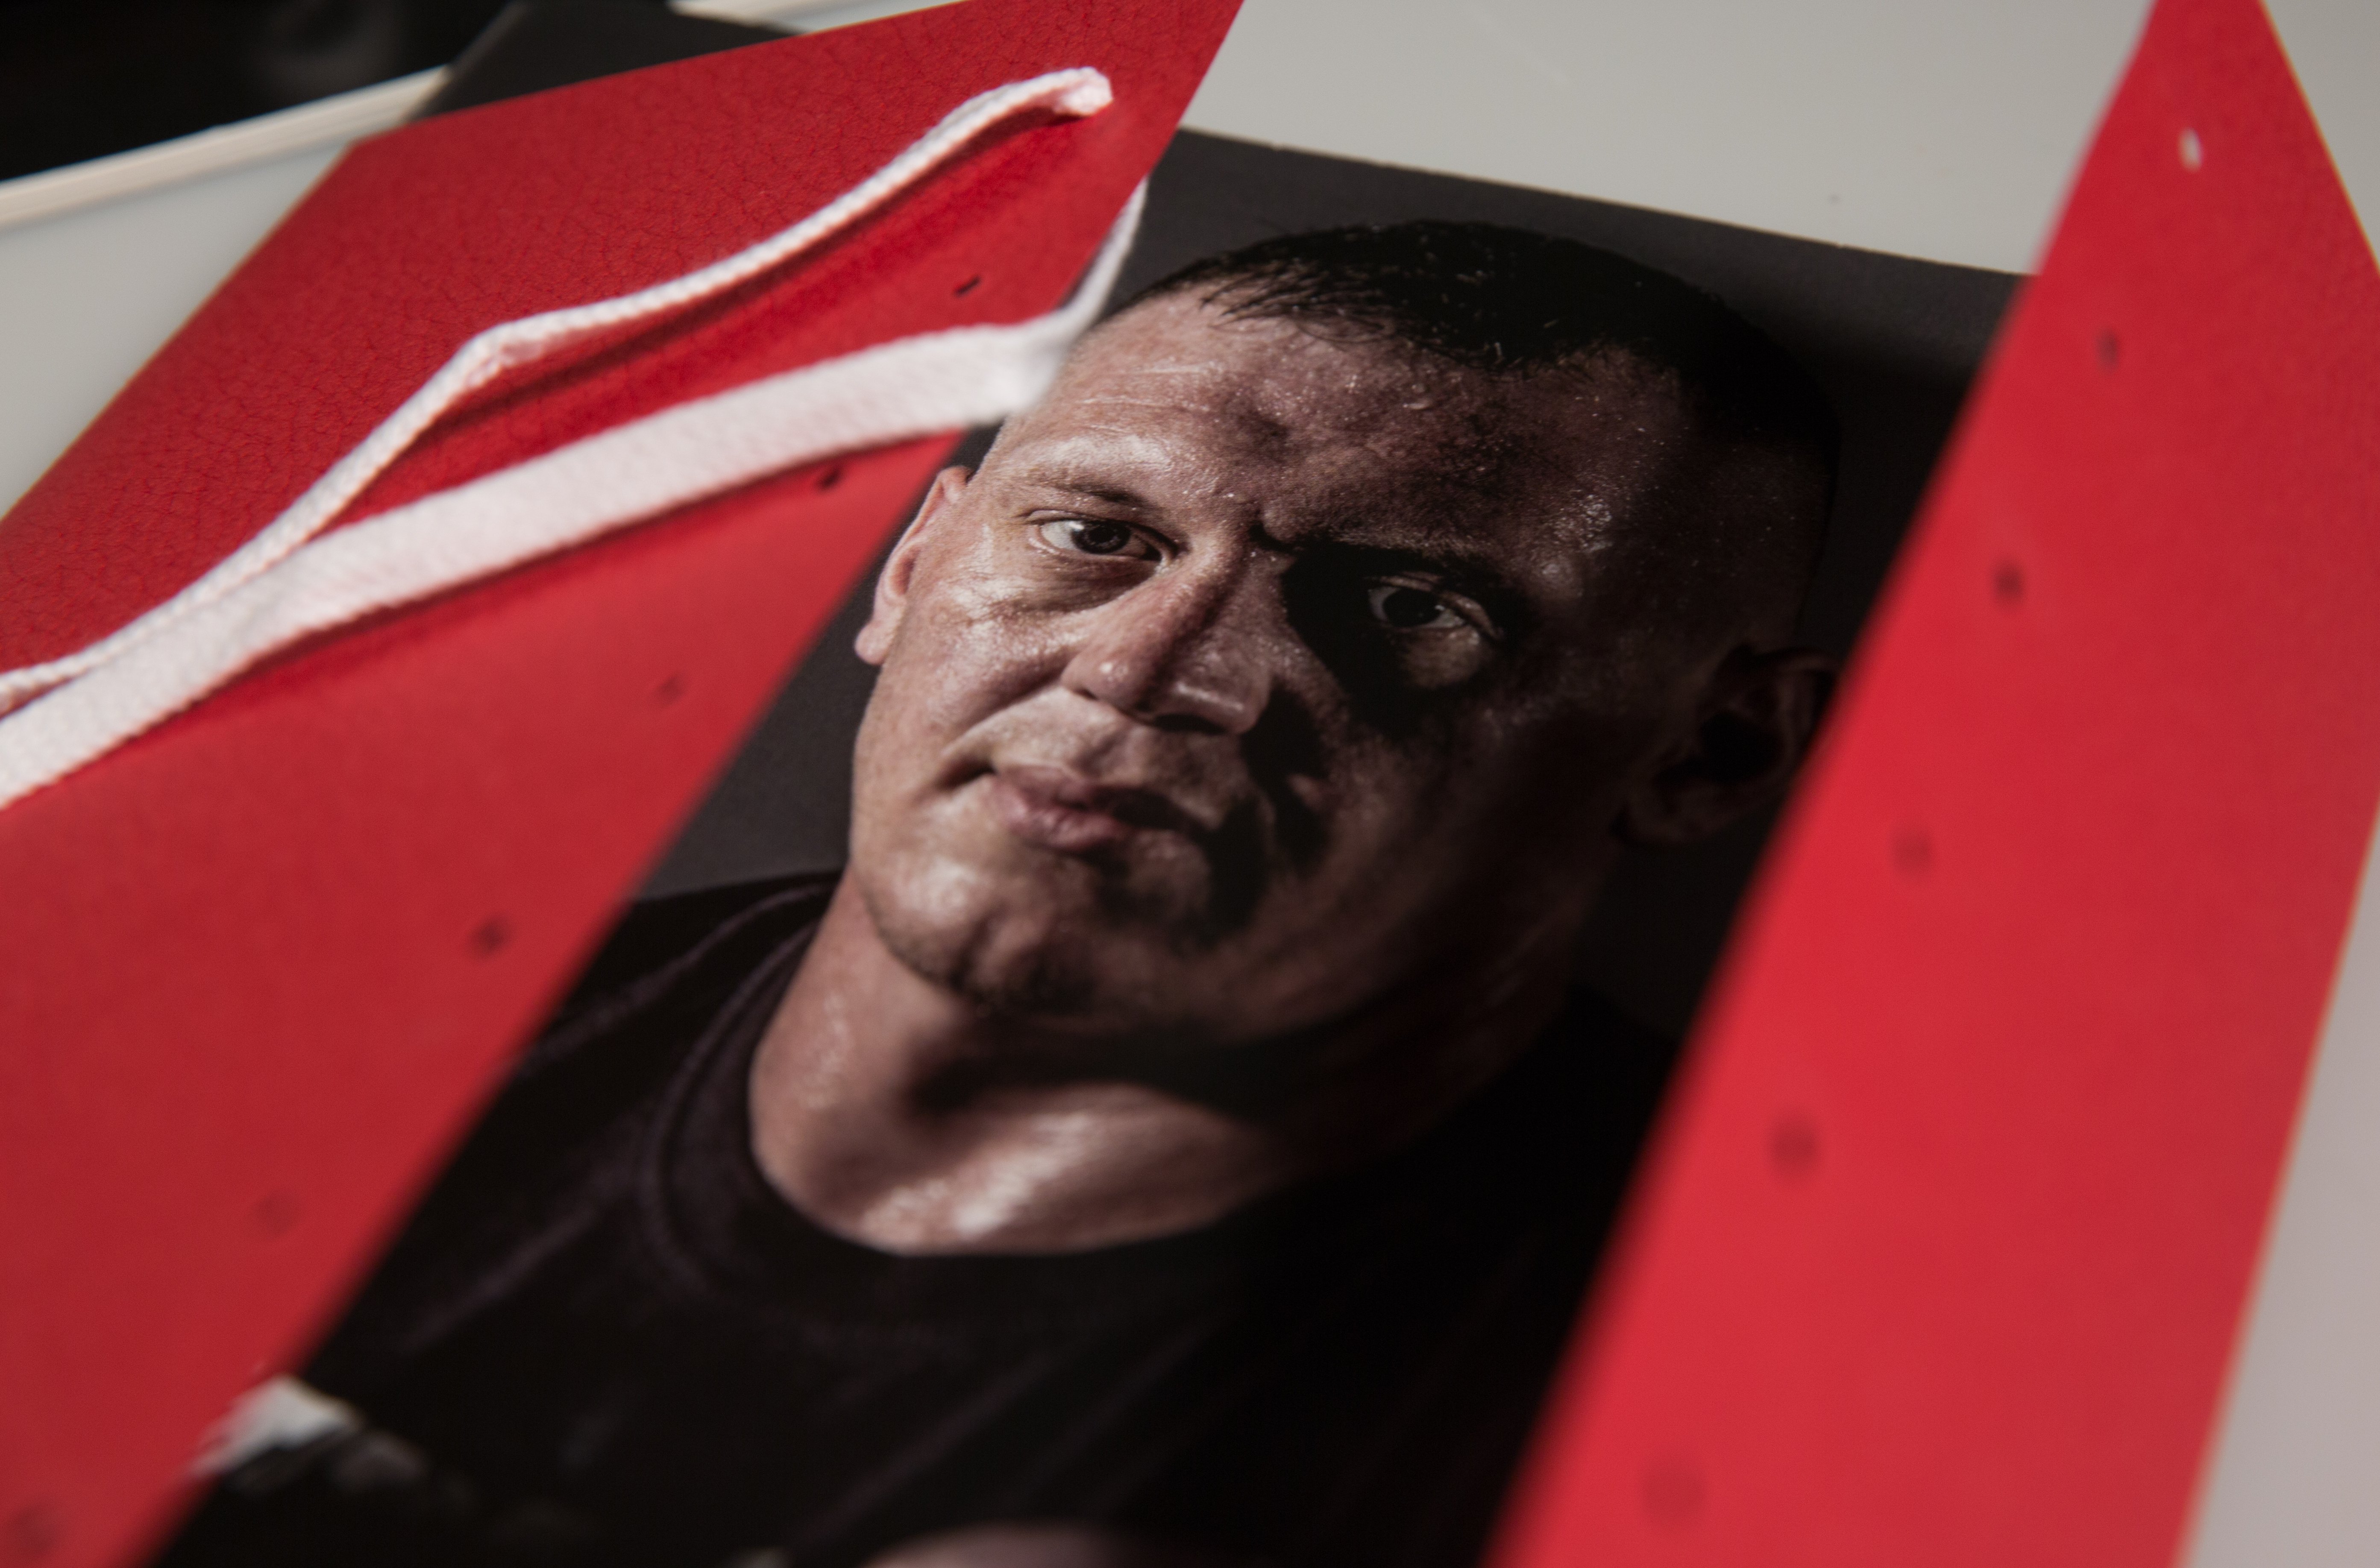
Later, working at the design agency, I contributed to a major digital transformation project for a high-profile sports club. I helped build a design system, charts, and interfaces for complex and fairly unique data visualization use cases. That project reignited my passion for data vis and showed me how it can be meaningfully combined with my design expertise.
Why did you want to join Datawrapper?
What drew me to Datawrapper was the opportunity to contribute to a product with a positive impact of helping people communicate data more effectively. Given the complexity of today’s societal challenges, that mission feels more relevant than ever. I’d already been following Datawrapper for a few years, ever since Lisa gave a presentation at my university, so when the job posting popped up, I didn’t hesitate to apply.
What will you do here?
My role is similar to that of an interface or user experience designer, but I also contribute to the design of the charts themselves. It's a unique role to have, and I feel really lucky to have found it. I've already had the pleasure of working on some exciting new features, such as the globe projection for locator maps, and many more amazing things we can’t wait to show you!
What are you looking forward to learn / get yourself into in the future? Or what’s an area you’d still like to explore?
I'm eager to deepen my data visualization skills; with so many people at Datawrapper who truly excel at this, it’s been an inspiring place to learn already. I’m also very interested in product strategy and user research, which is why I’m especially excited about all the new chart types and visualization features in the works. Besides that I’ve recently signed up for my first ever triathlon (sprint distance!) — wish me luck!
Welcome, Moritz! It's great to have you with us.