Data Vis Dispatch, September 23: Politics, Palestine, and interactive tools

Welcome back to the 211th edition of Data Vis Dispatch! Every week, we’ll be publishing a collection of the best small and large data visualizations we find, especially from news organizations — to celebrate data journalism, data visualization, simple charts, elaborate maps, and their creators.
Recurring topics this week include politics, the recognition of the Palestinian state, and all kinds of interactive tools for daily life.
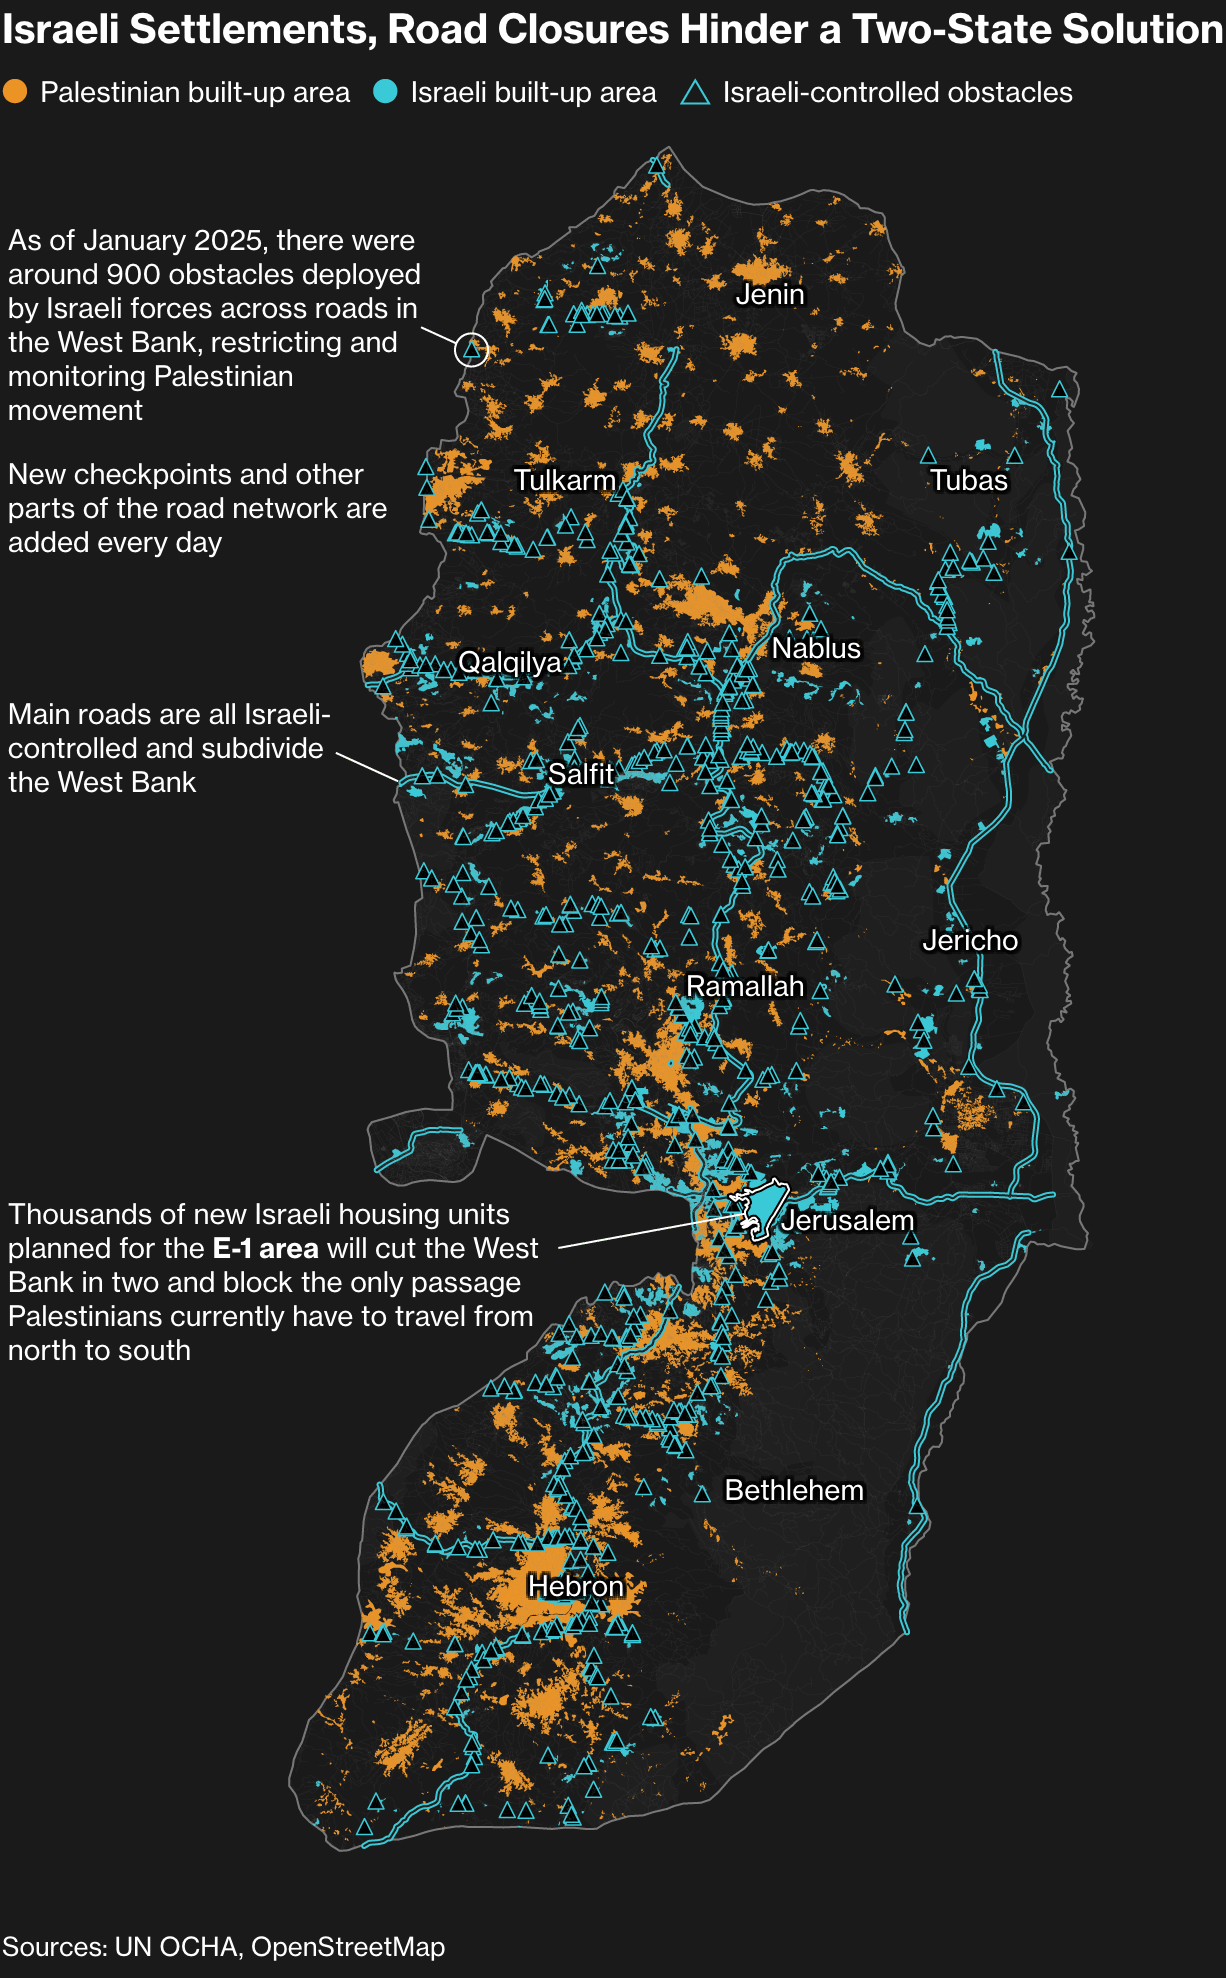
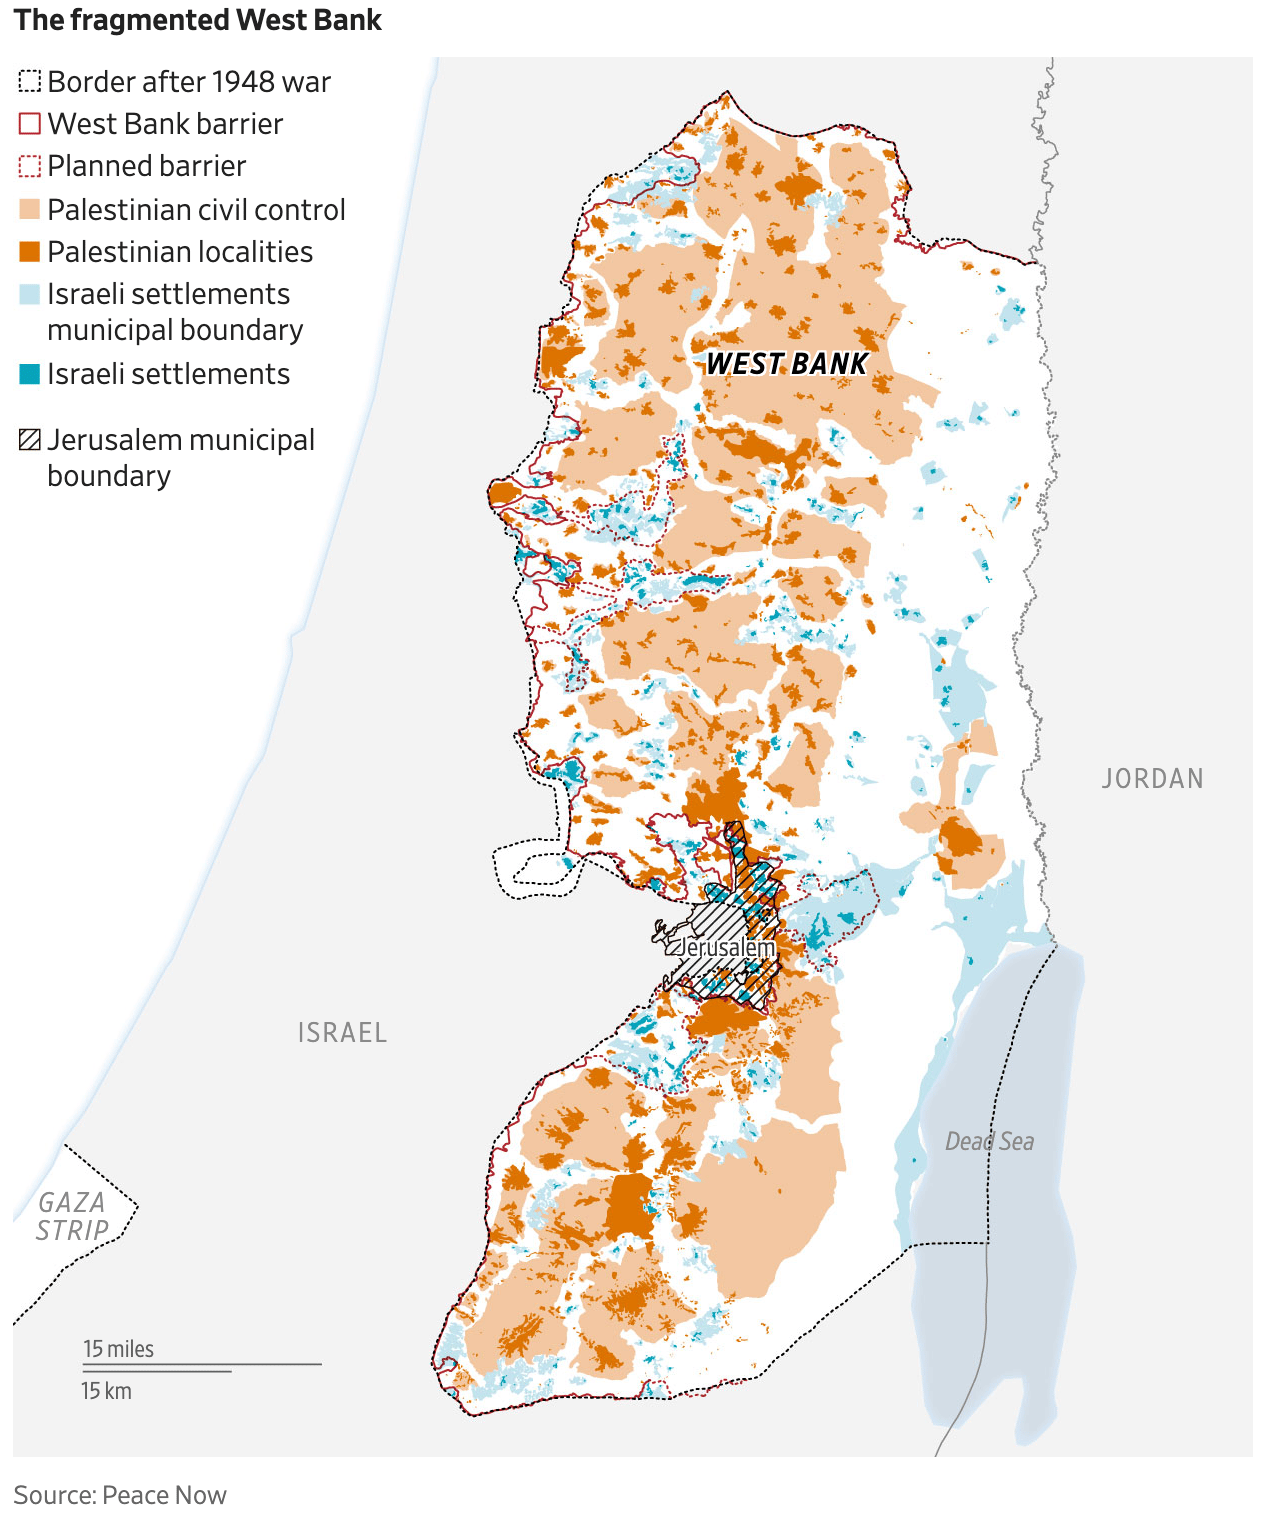
On Monday, France officially recognized the State of Palestine. However, maps of the West Bank suggest that a two-state solution might lack viability. Meanwhile, Israel's ground invasion continues in Gaza City.
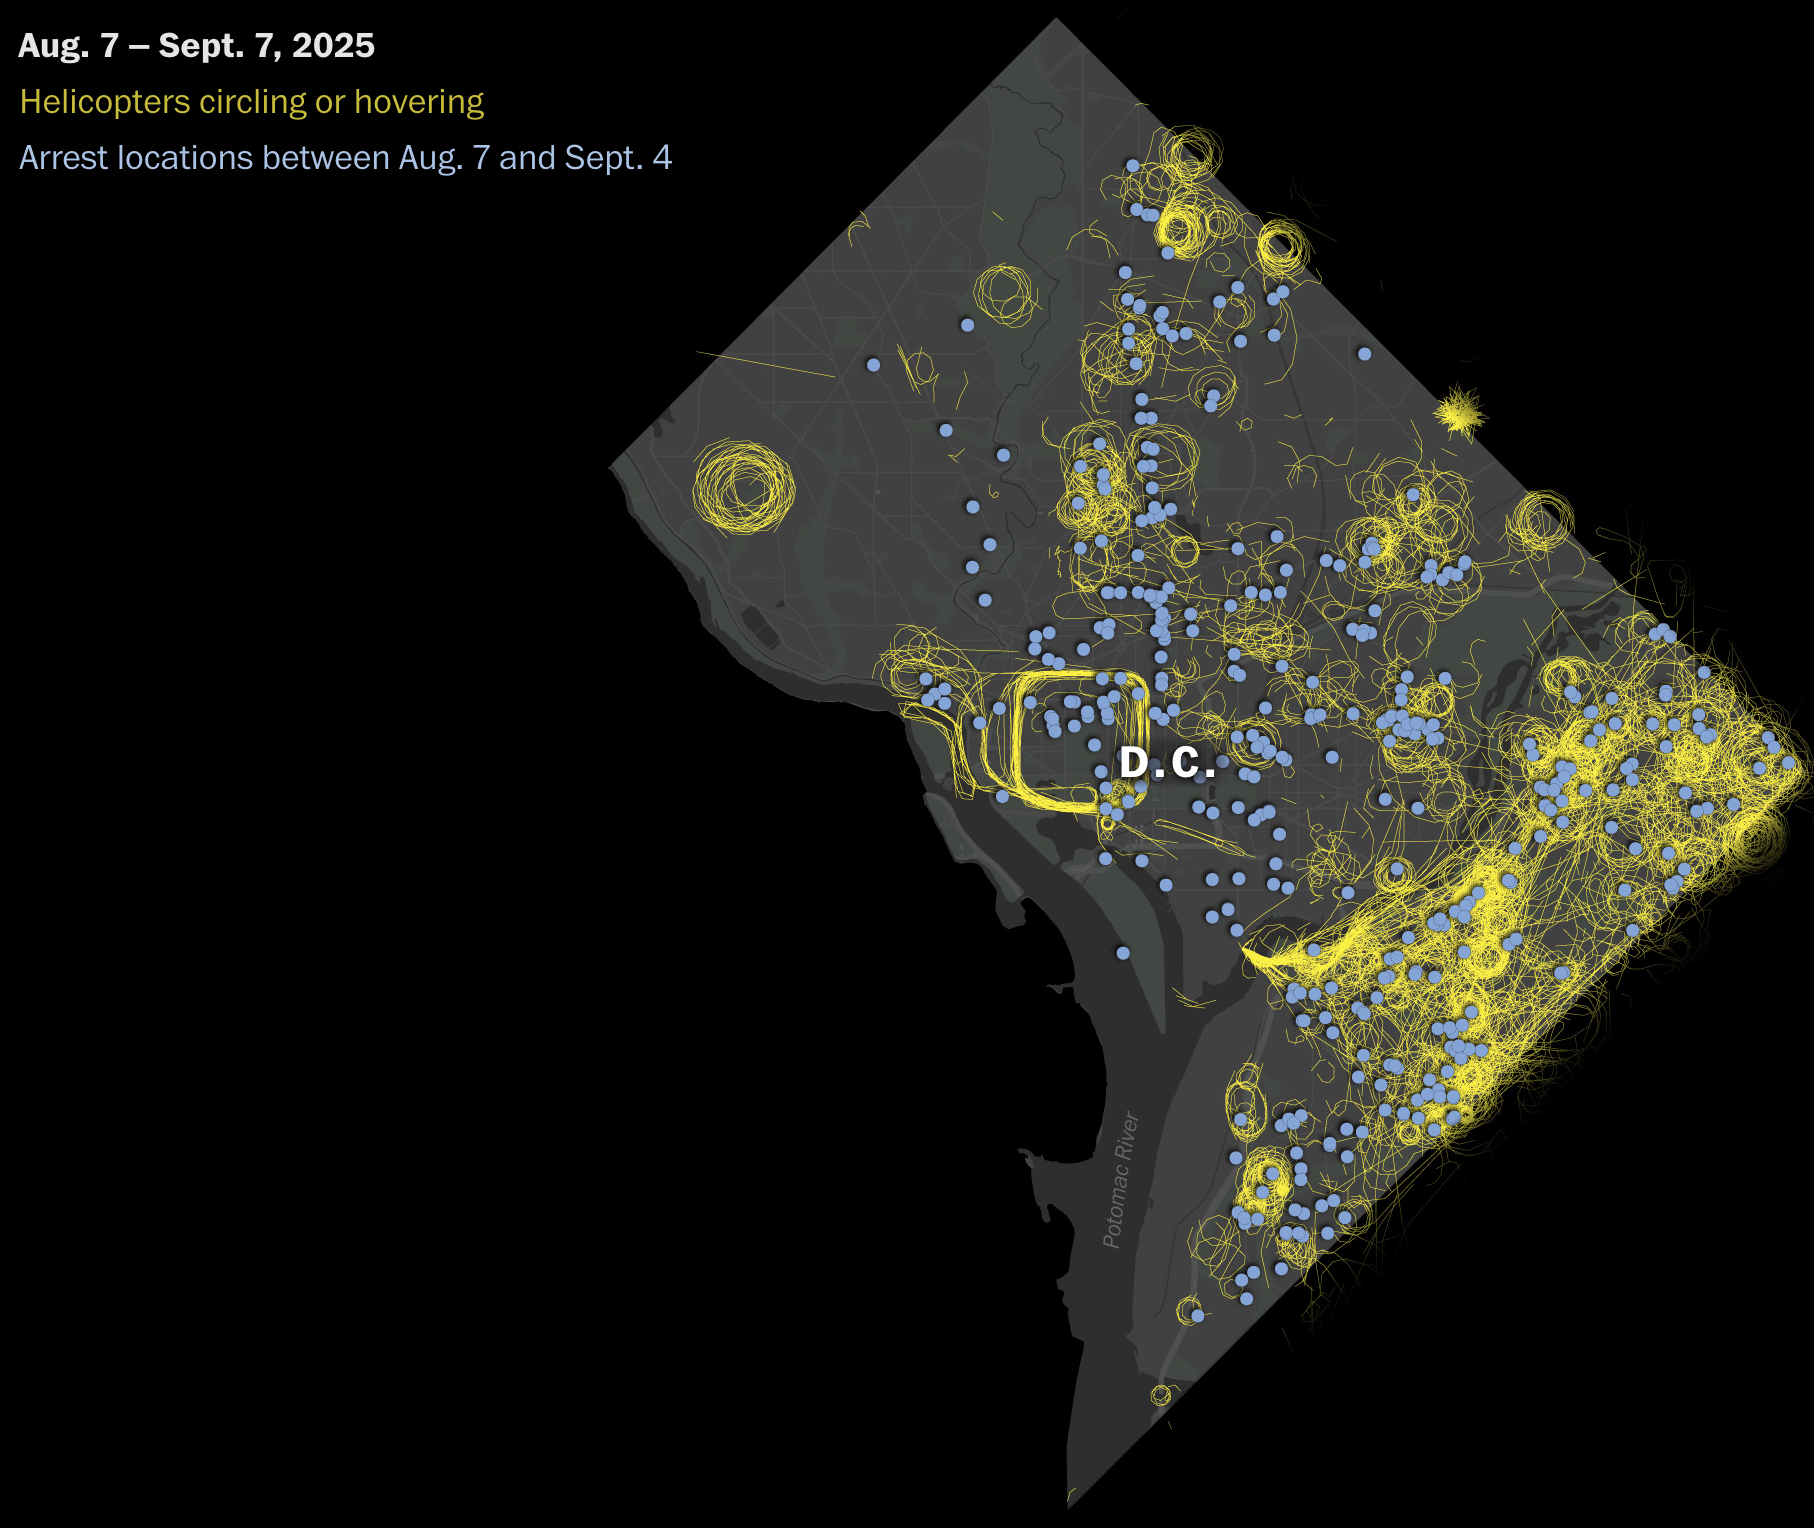
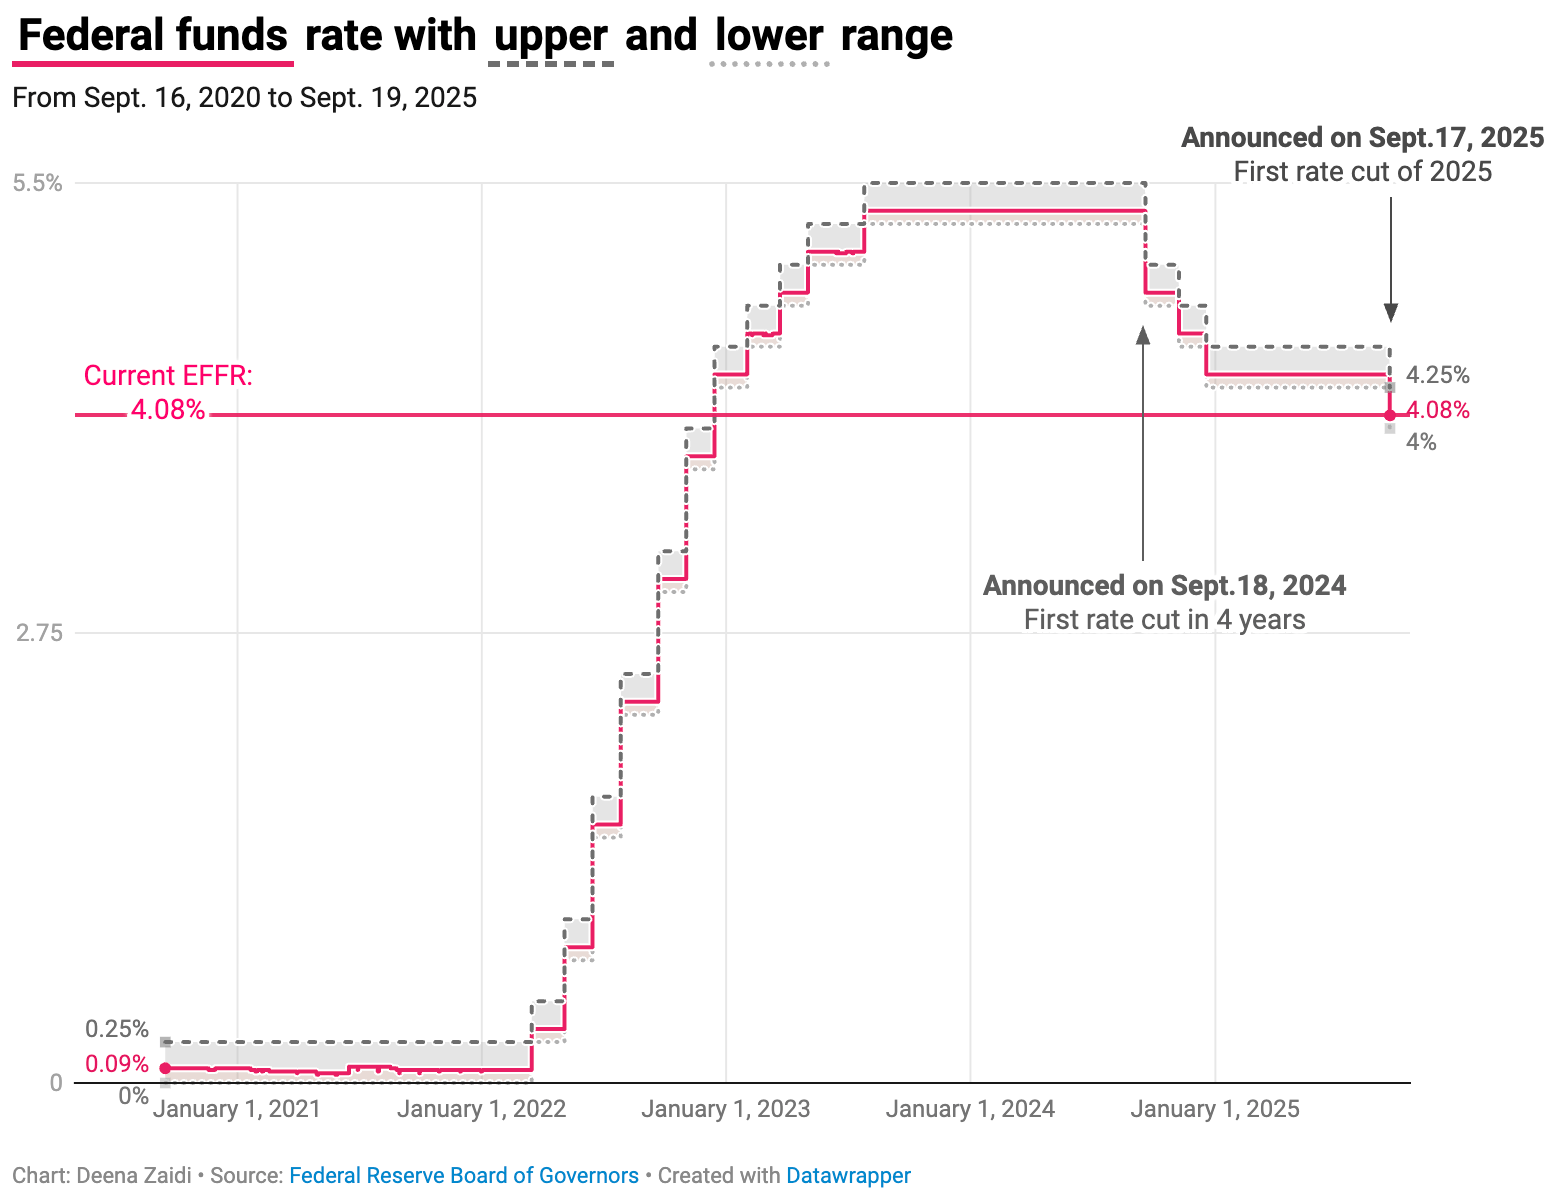
Visualizations about the United States are closely tied to President Trump’s actions, covering his anti-crime surge in Washington, D.C. and recently announced Fed rate cuts.
Other political charts track Thailand’s parliament and explore how German electoral groups view the welfare state.
![WeVis: <a href="https://wevis.info/the-committees"><strong>Look through the Committees จับจ้อง ส่องติดตาม ‘คณะกรรมาธิการ’ รัฐสภา</strong></a><strong> </strong>[<em>Keep an eye on the parliamentary 'committee'</em>], September 16](https://datawrapper.de/cdn-cgi/image/quality=85,width=1702,f=auto,fit=cover/https://kirby.datawrapper.de/media/pages/blog/data-vis-dispatch-september-23-2025/9be1705ea3-1758620576/cleanshot-2025-09-23-at-11.38.19@2x.png)
![Die Zeit: <a href="https://www.zeit.de/politik/deutschland/2025-09/rechtspopulismus-armut-umverteilung-sozialpolitik-afd"><strong>Wer wenig hat, ist in ihren Augen selbst schuld</strong></a> [<em>Chart title: What is your opinion on the subject of taxes and social welfare benefits?</em>], September 16](https://datawrapper.de/cdn-cgi/image/quality=85,width=1440,f=auto,fit=cover/https://kirby.datawrapper.de/media/pages/blog/data-vis-dispatch-september-23-2025/500456e9ec-1758573571/cleanshot-2025-09-22-at-22.33.41@2x.png)
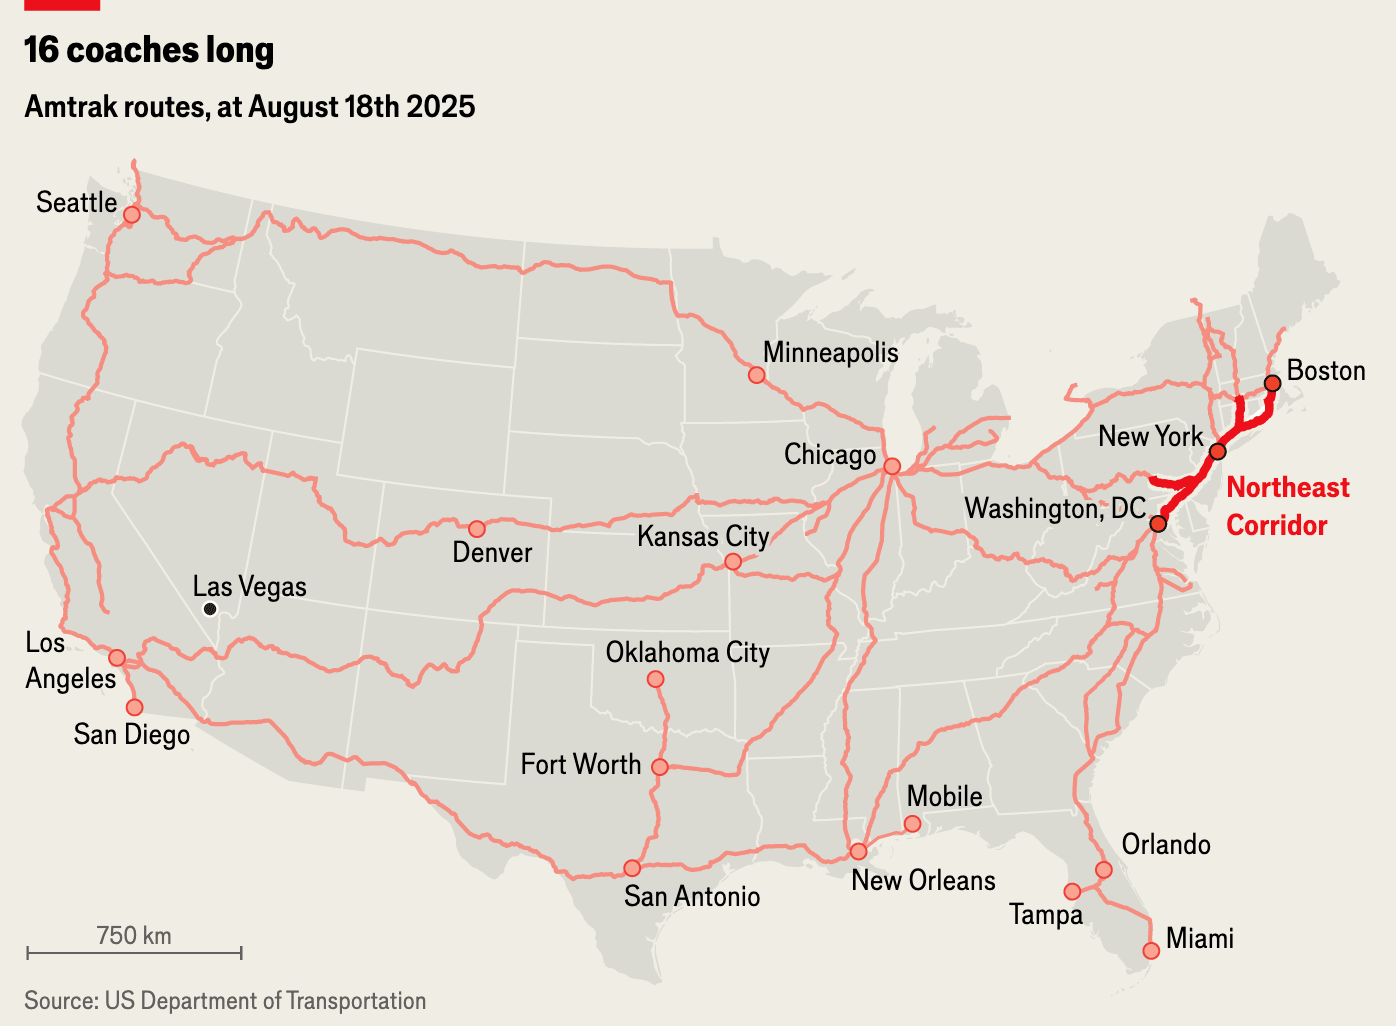
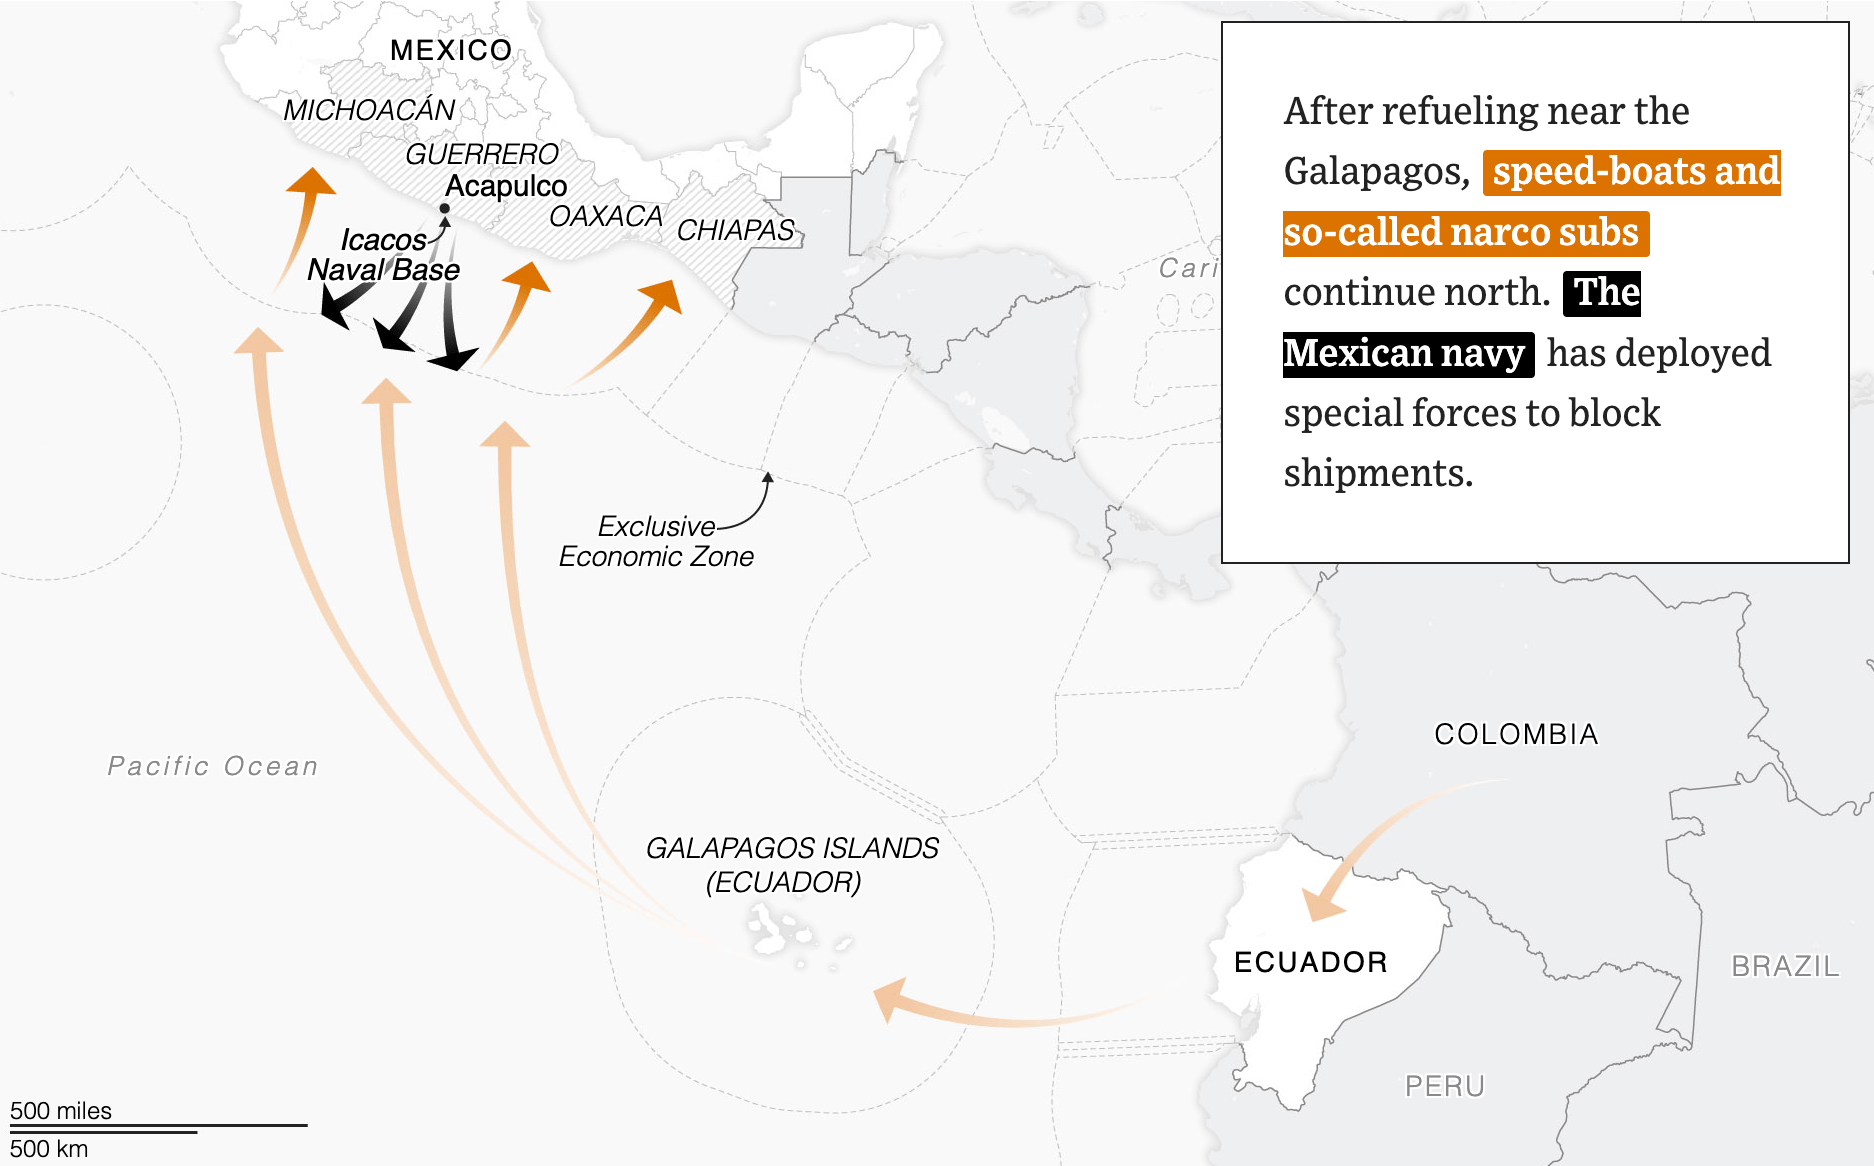
Maps cover the routes of trains and cocaine shipments this week.
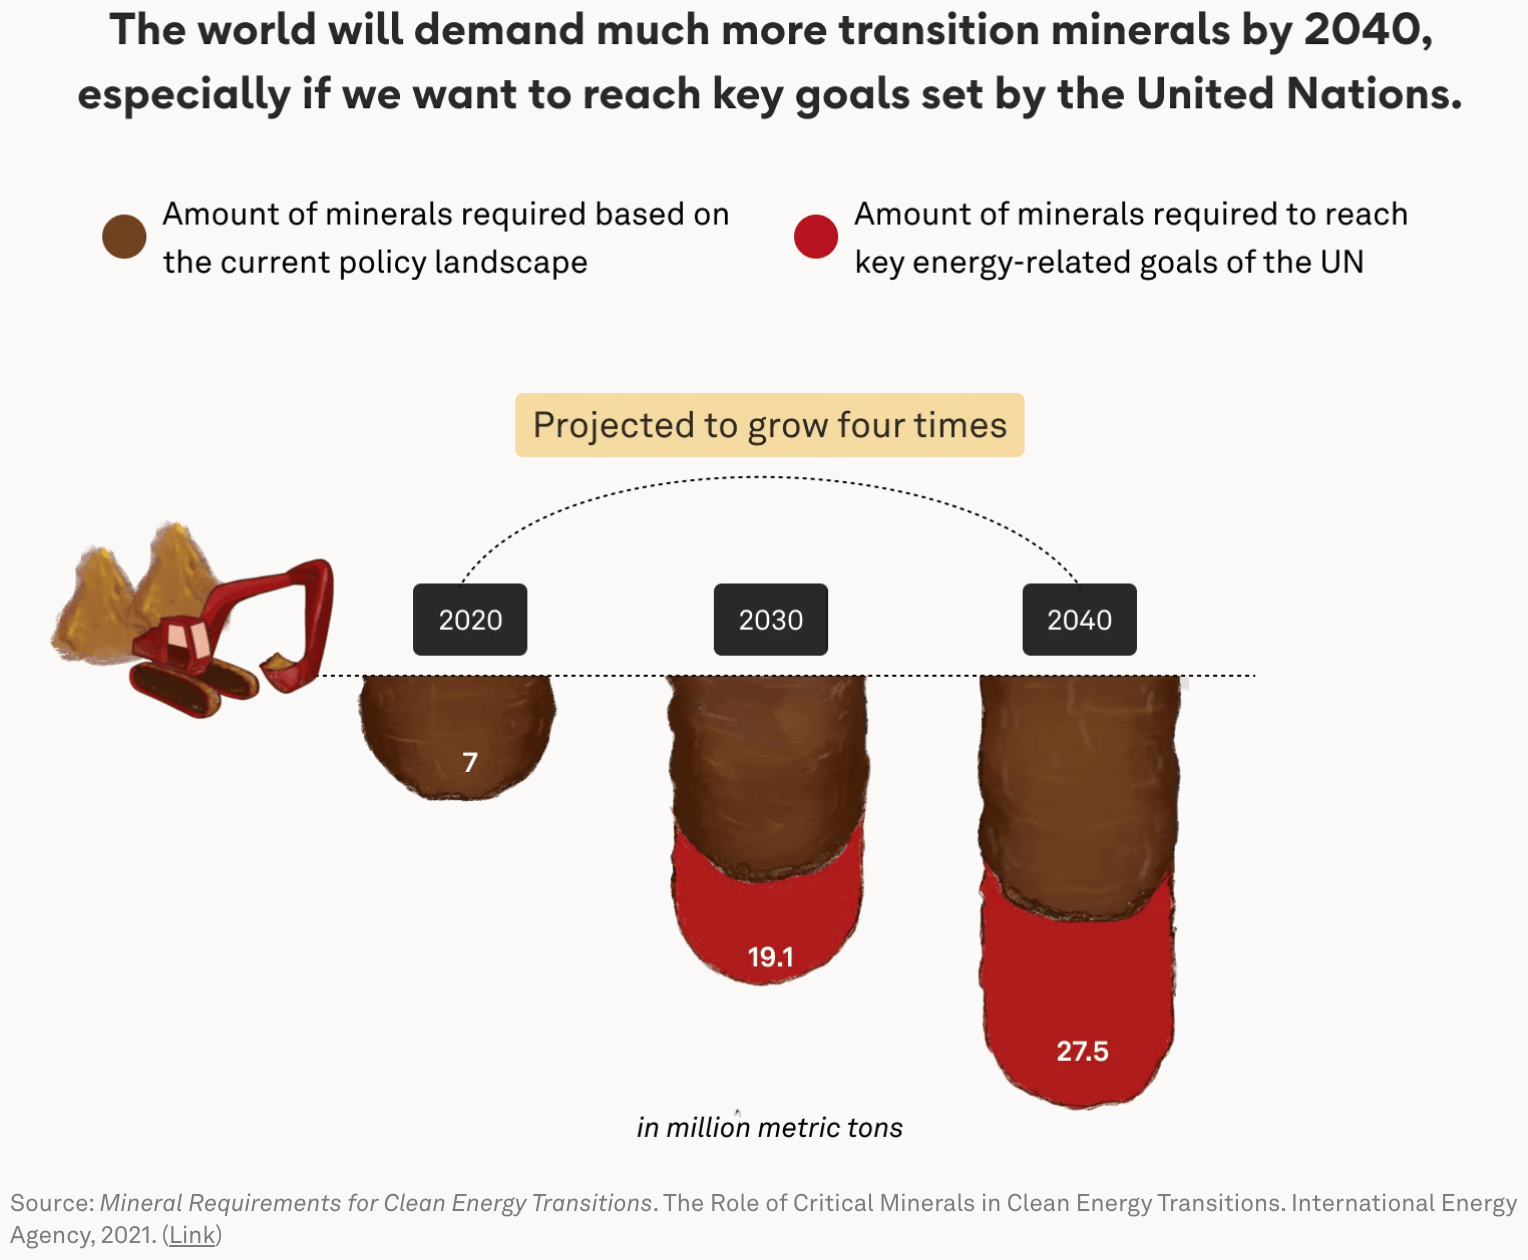
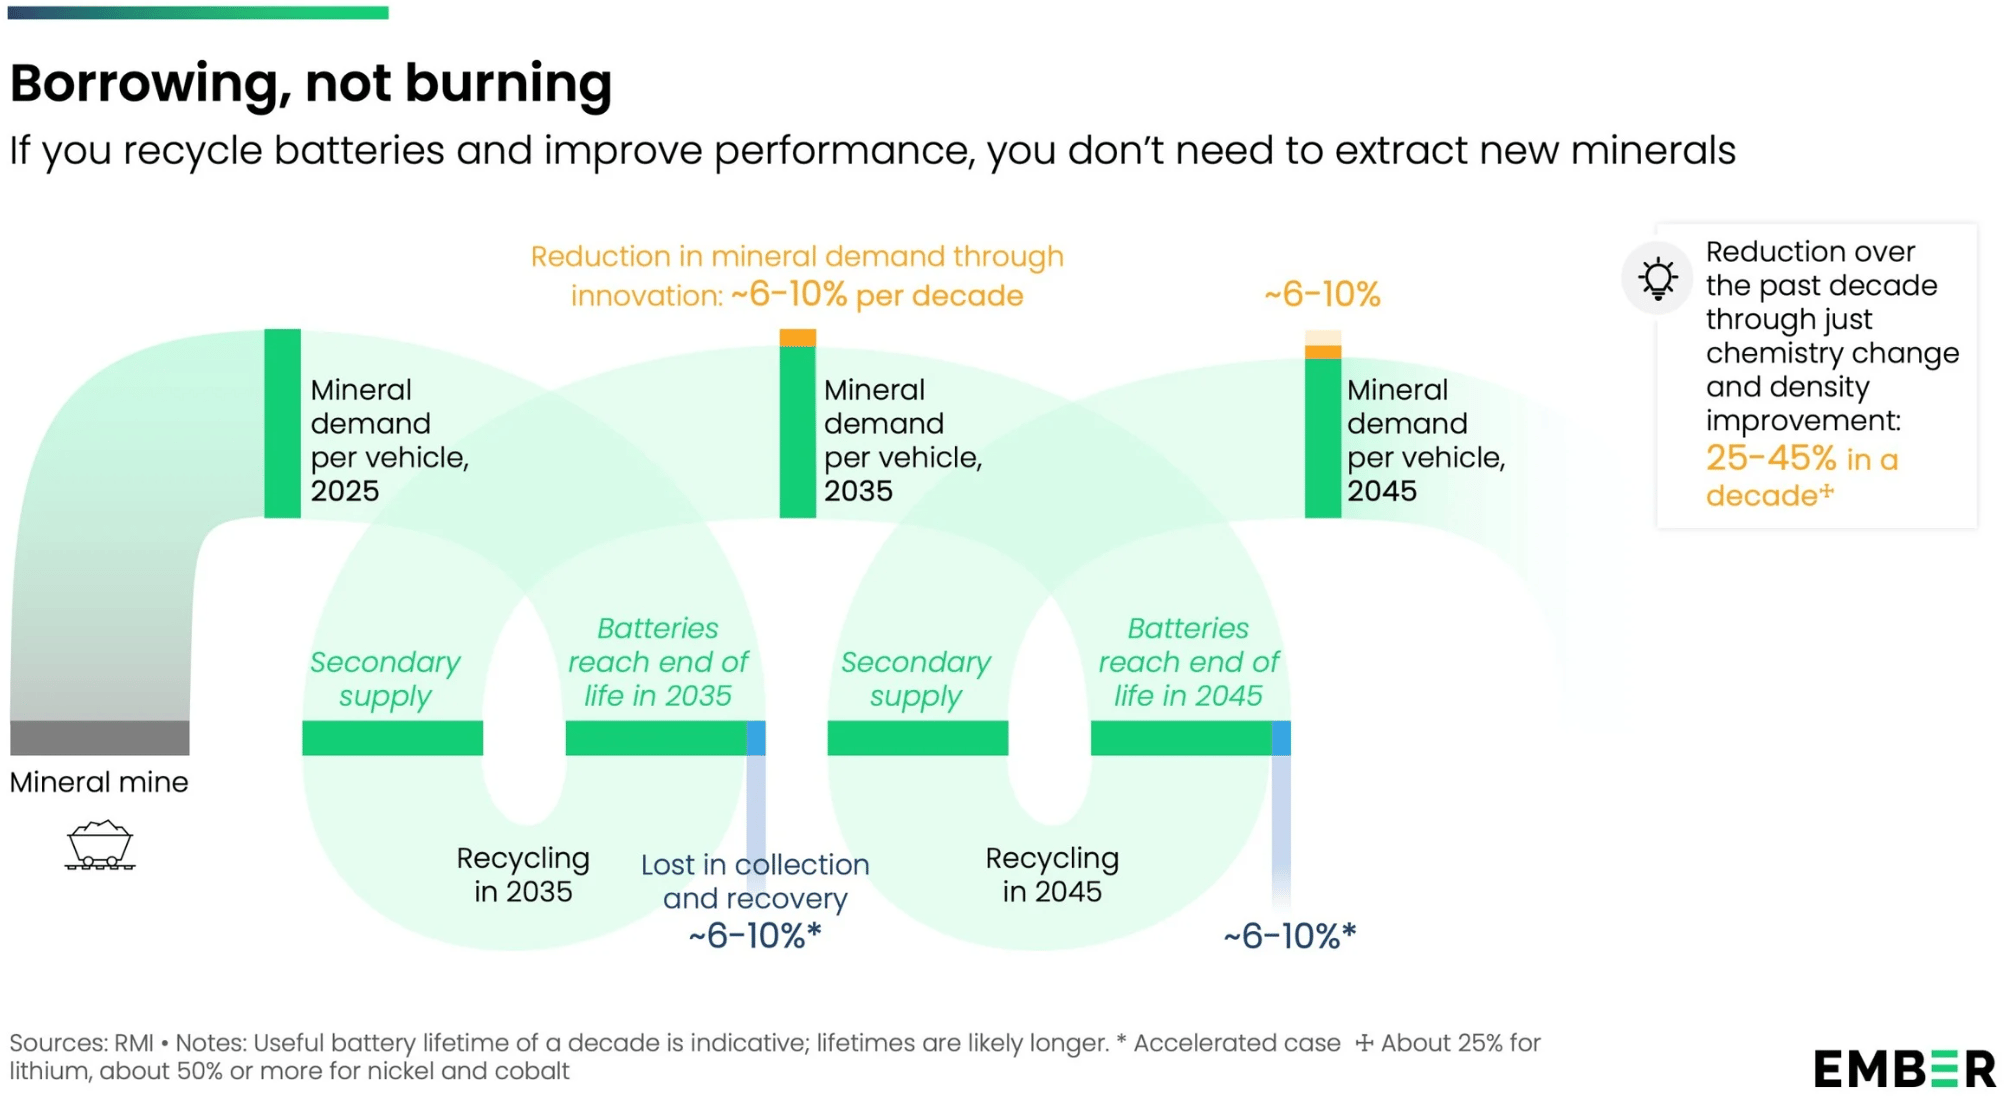
The future of energy transition relies on rare minerals. The challenge? Meeting a growing demand and effective recycling.
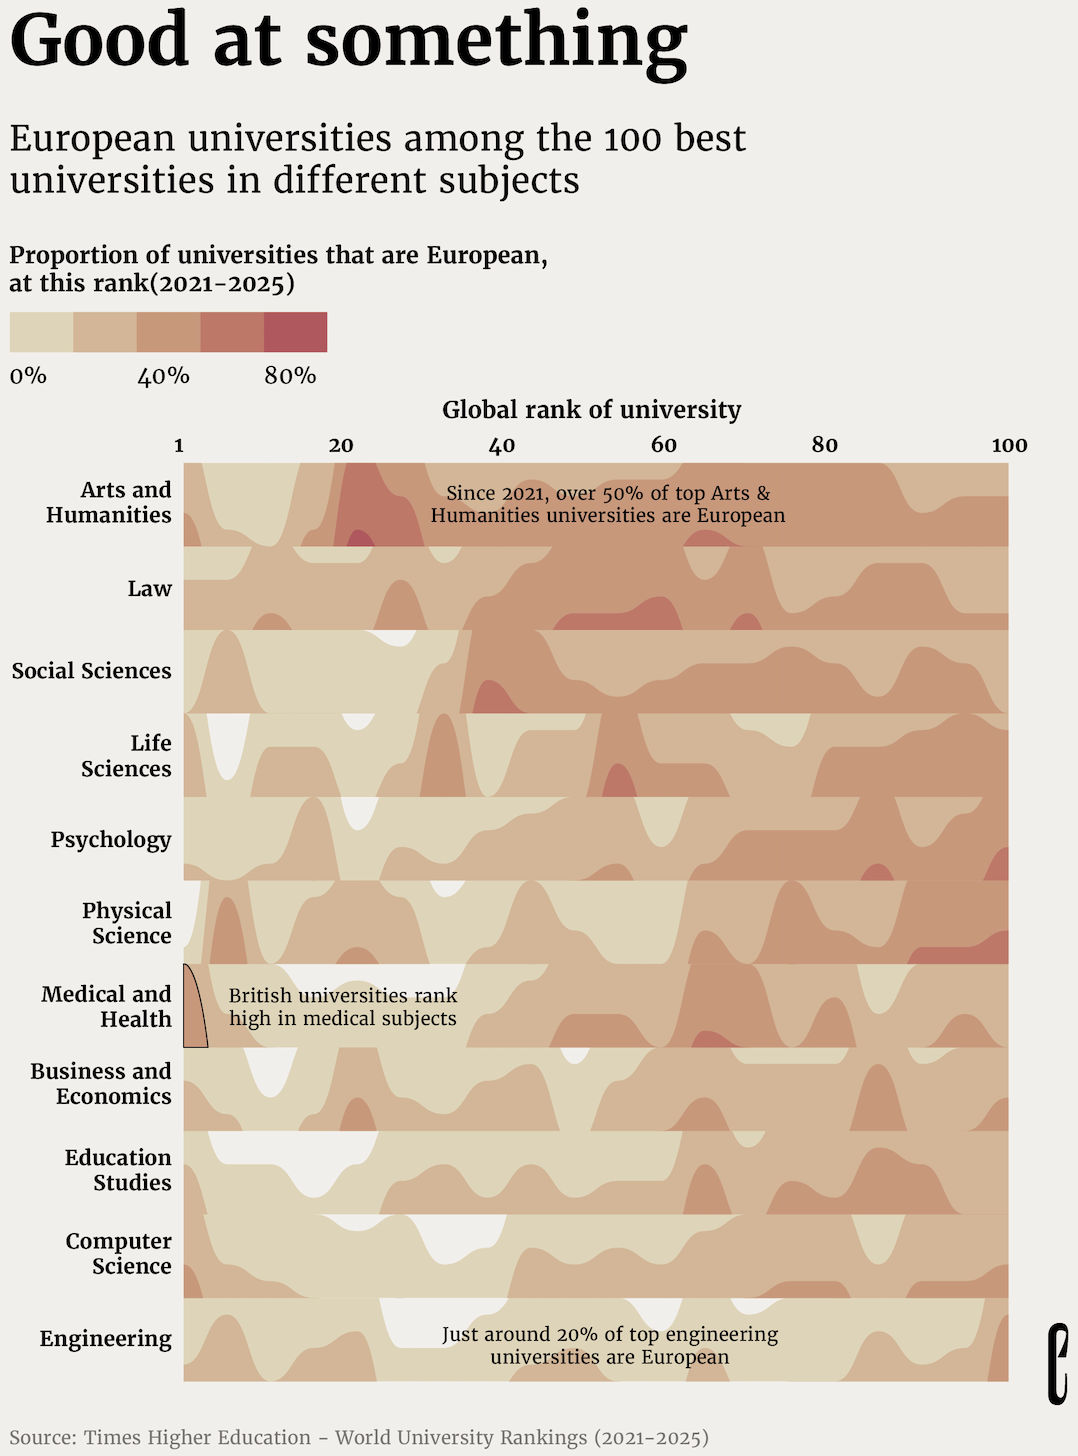
On the education front, eight million students in Brazil lack internet access in school, while European universities excel in fields like Arts, Humanities, and Law, but fall behind in Computer Science and Engineering.
![Folha de S.Paulo: <a href="https://www1.folha.uol.com.br/educacao/2025/09/8-milhoes-de-alunos-nao-tem-internet-para-aprendizado-dentro-da-escola-no-brasil.shtml"><strong>8 milhões de alunos não têm internet para aprendizado dentro da escola no Brasil</strong></a> [<em>Chart title: Number of schools with internet access for educational purposes</em>], September 21](https://datawrapper.de/cdn-cgi/image/quality=85,width=1258,f=auto,fit=cover/https://kirby.datawrapper.de/media/pages/blog/data-vis-dispatch-september-23-2025/d574e286b8-1758621344/cleanshot-2025-09-23-at-11.54.50@2x.png)
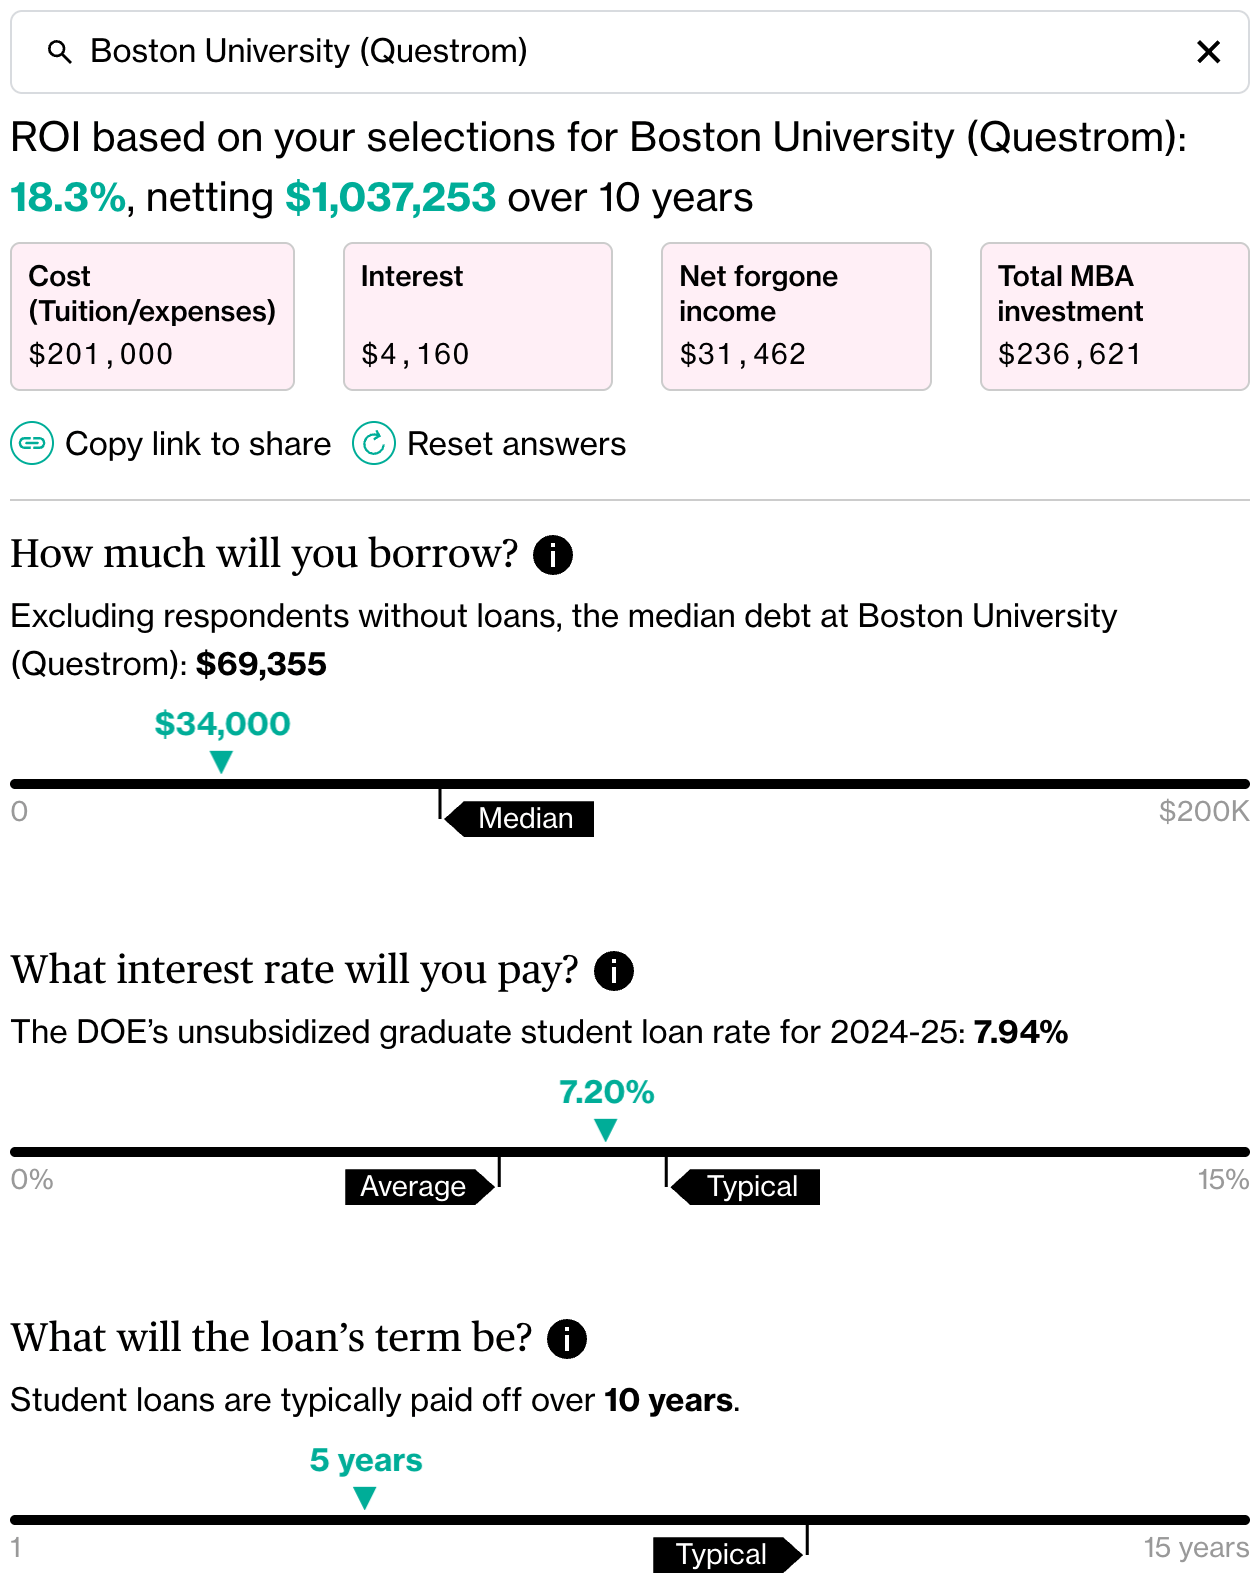
Below, you can explore interactive tools that allow you to create your own HIIT workout, see if an MBA degree is worth the money, or compare your rent in Germany.

![Der Spiegel: <a href="https://www.spiegel.de/wirtschaft/service/mietspiegel-rechner-zahlen-sie-zu-viel-miete-a-17126383-523a-411c-aab0-06dbfef8658f"><strong><span>Zahlen Sie zu viel Miete?</span></strong></a><strong><span> </span></strong><span>[</span><em><span>Do you pay to much rent?</span></em><span>], September 16</span>](https://datawrapper.de/cdn-cgi/image/quality=85,width=1264,f=auto,fit=cover/https://kirby.datawrapper.de/media/pages/blog/data-vis-dispatch-september-23-2025/f7cd0874eb-1758621830/cleanshot-2025-09-23-at-11.32.01@2x.png)
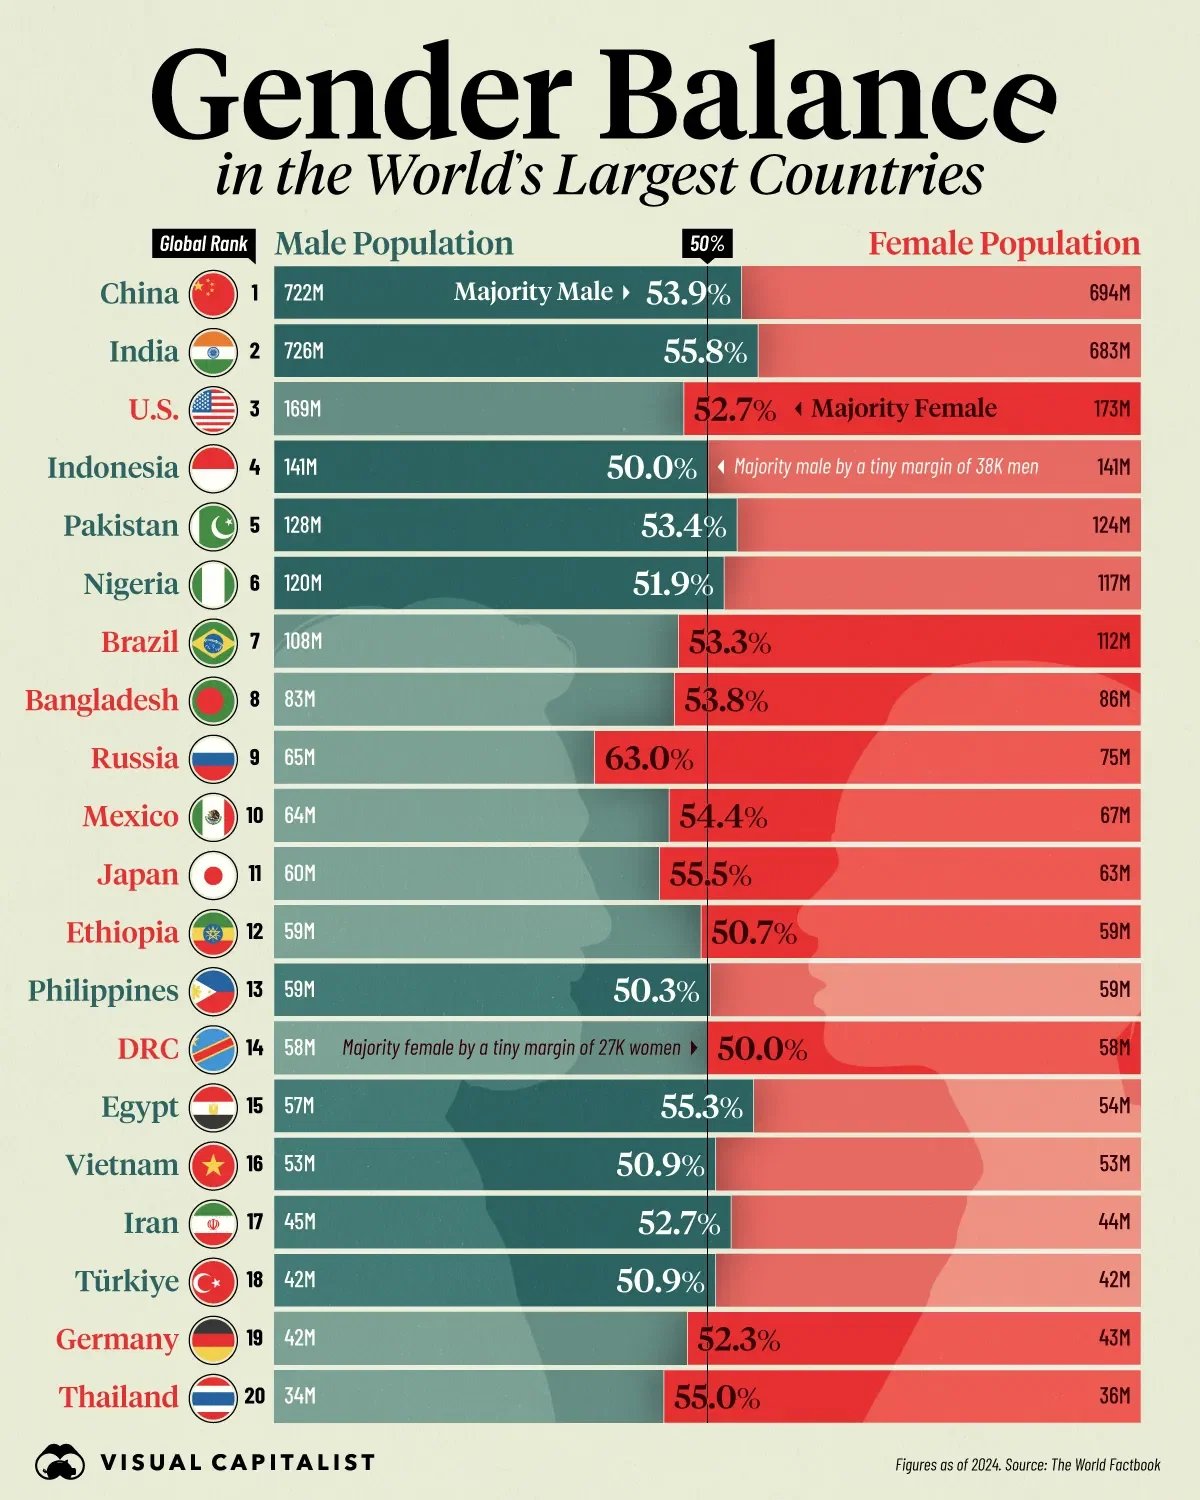
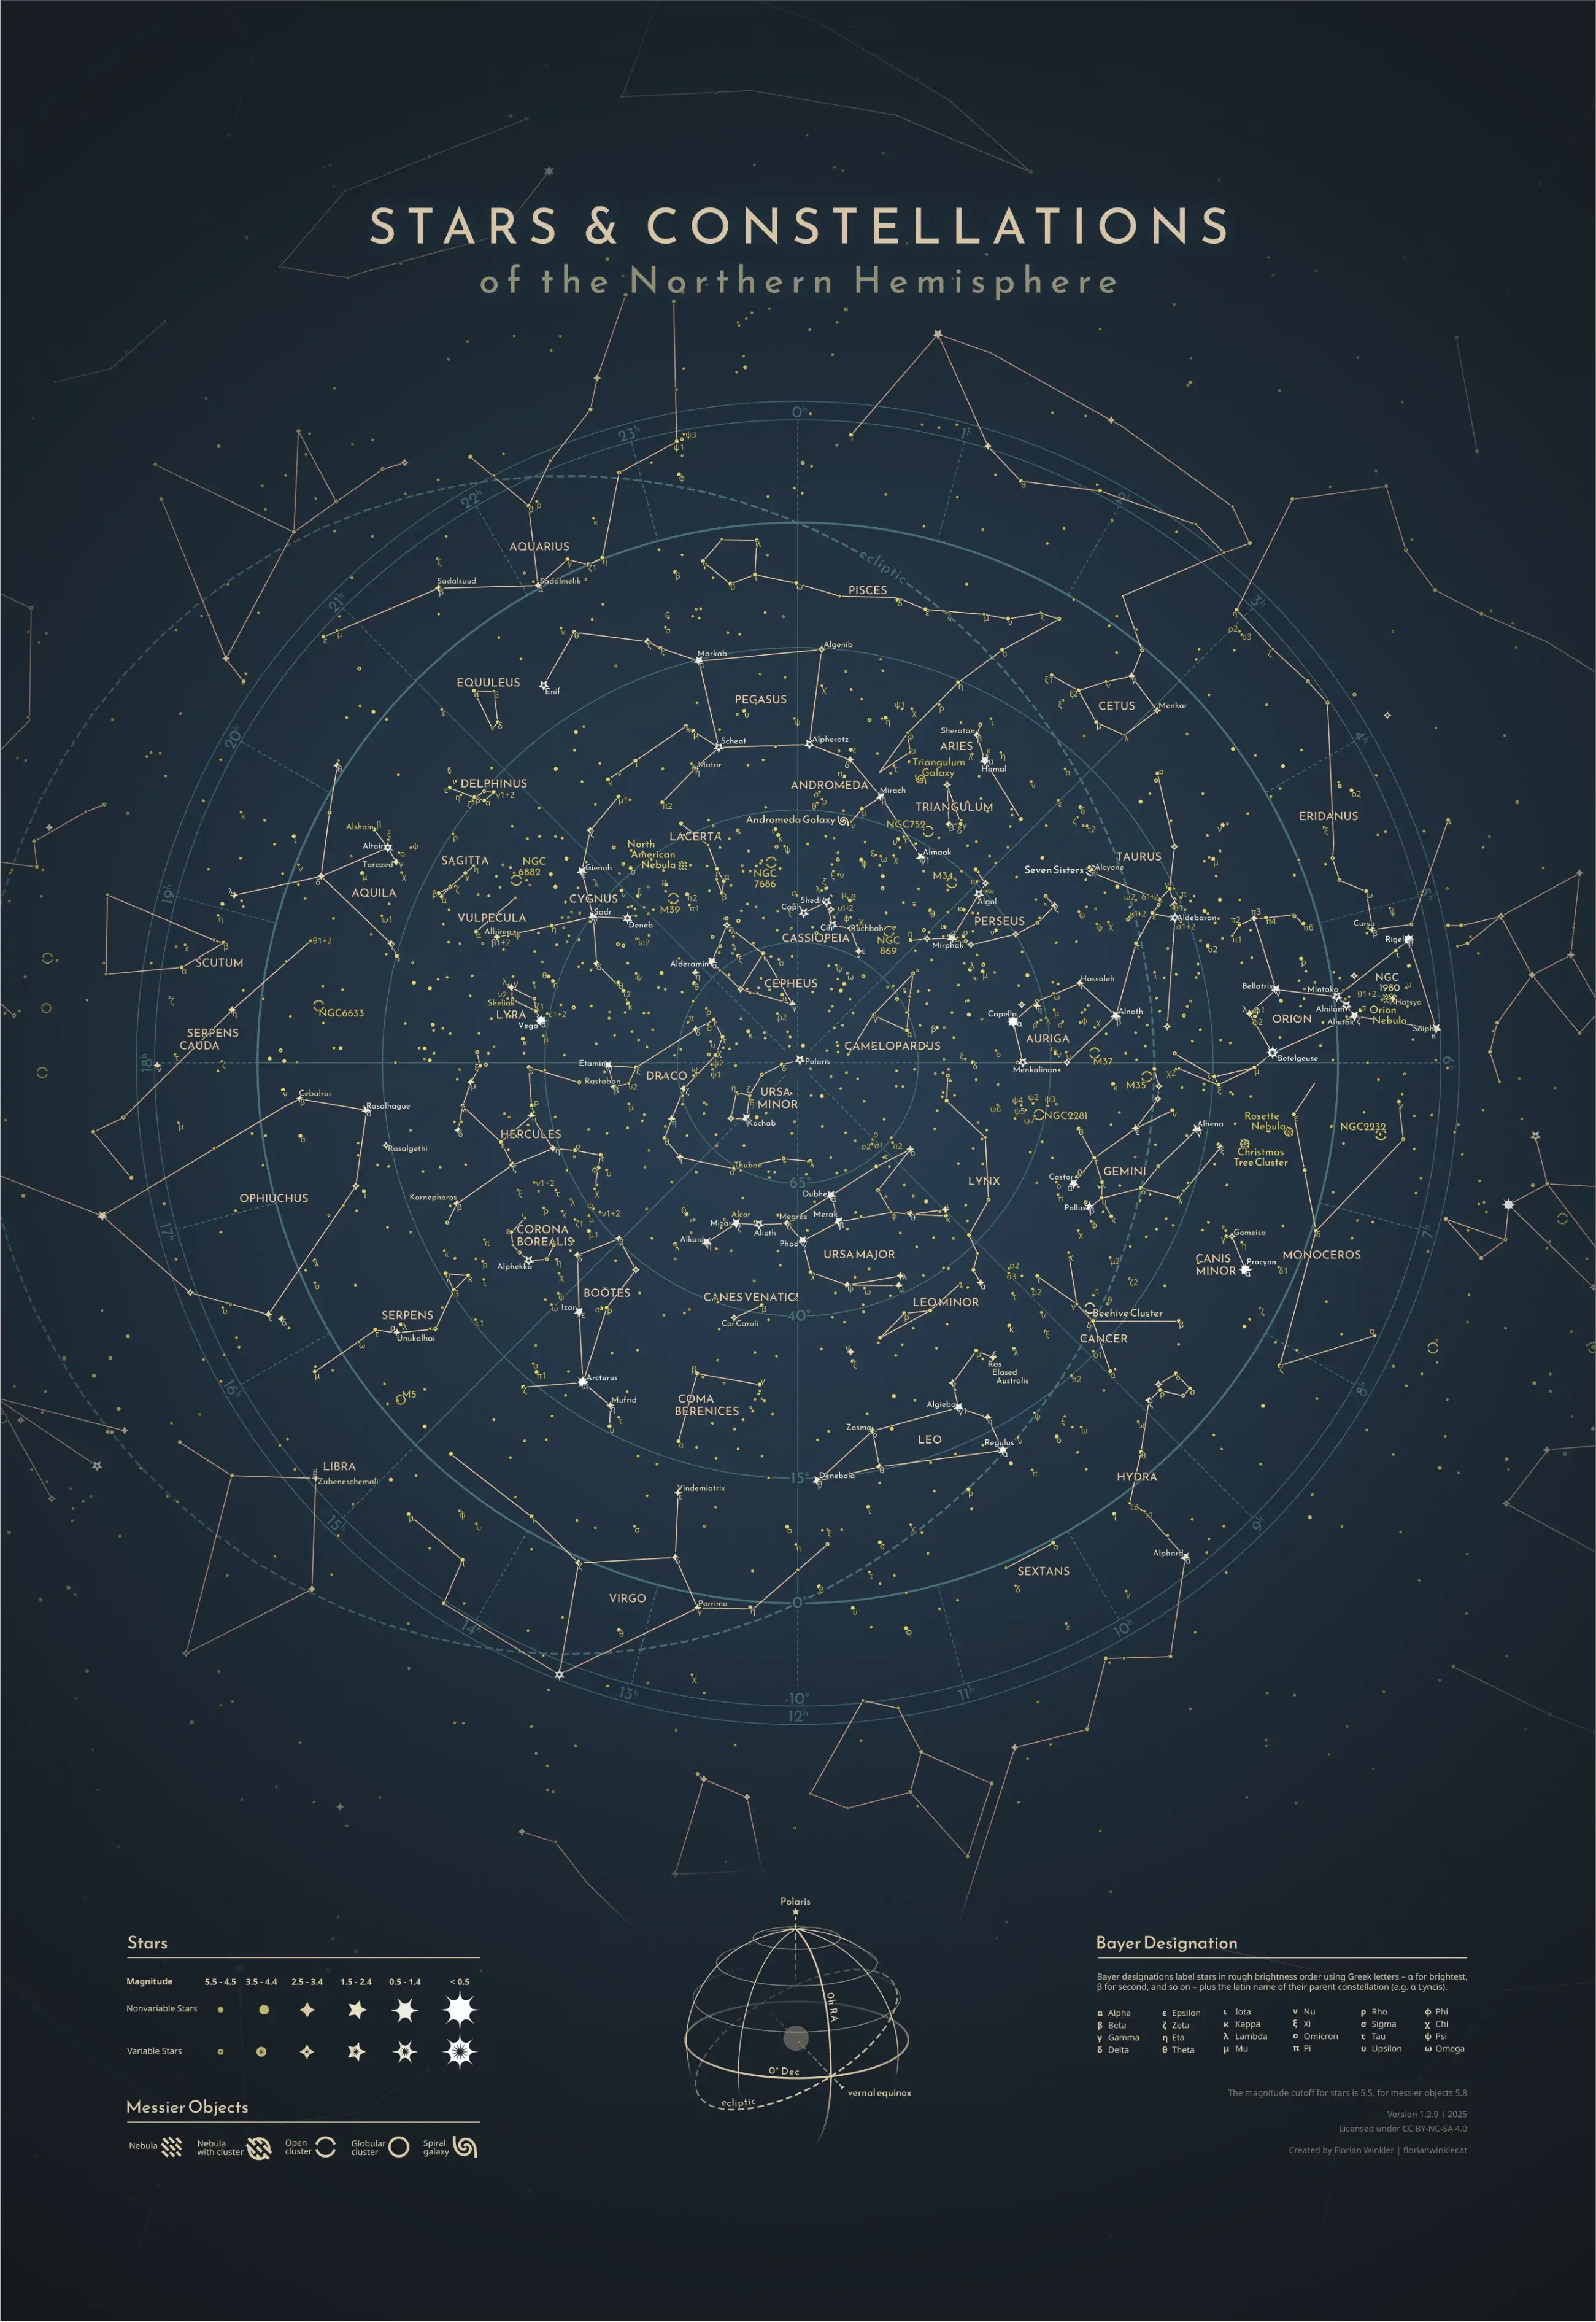
Our final selection of data visualizations covers gender balance, energy demand of data centers, TV shows, and the night sky.
![Le Monde: <a href="https://www.lemonde.fr/sciences/article/2025/09/19/comment-recuperer-la-chaleur-des-data-centers-pour-mieux-diminuer-leur-consommation-d-energie_6641816_1650684.html"><strong>Comment récupérer la chaleur des data centers pour mieux diminuer leur consommation d’énergie</strong></a> [<em>How to recover heat from data centers to better reduce their energy consumption</em>], September 19](https://datawrapper.de/cdn-cgi/image/quality=85,width=1296,f=auto,fit=cover/https://kirby.datawrapper.de/media/pages/blog/data-vis-dispatch-september-23-2025/1097572173-1758619740/cleanshot-2025-09-23-at-11.26.44@2x.png)
![Diario Sur: <a href="https://www.diariosur.es/pantallas/series/series-conquistado-mundo-20250923110910-ntrc.html"><strong>Cómo las series han conquistado el mundo</strong></a> [<em>How series have conquered the world</em>], September 23](https://datawrapper.de/cdn-cgi/image/quality=85,width=1300,f=auto,fit=cover/https://kirby.datawrapper.de/media/pages/blog/data-vis-dispatch-september-23-2025/b14fba48b2-1758621205/cleanshot-2025-09-23-at-11.51.13@2x.png)
What else we found interesting
Applications are open for…
Director of Operations at School of Visual Arts


