
This article is brought to you by Datawrapper, a data visualization tool for creating charts, maps, and tables. Learn more.

All Blog Categories

Data Vis Dispatch, April 21: Sea routes, AI, and penguins

The best of last week’s big and small data visualizations
Portrait of Michelle Otiji
Michelle Otiji

Welcome back to the 241st edition of Data Vis Dispatch! Every week, we’ll be publishing a collection of the best small and large data visualizations we find, especially from news organizations — to celebrate data journalism, data visualization, simple charts, elaborate maps, and their creators.

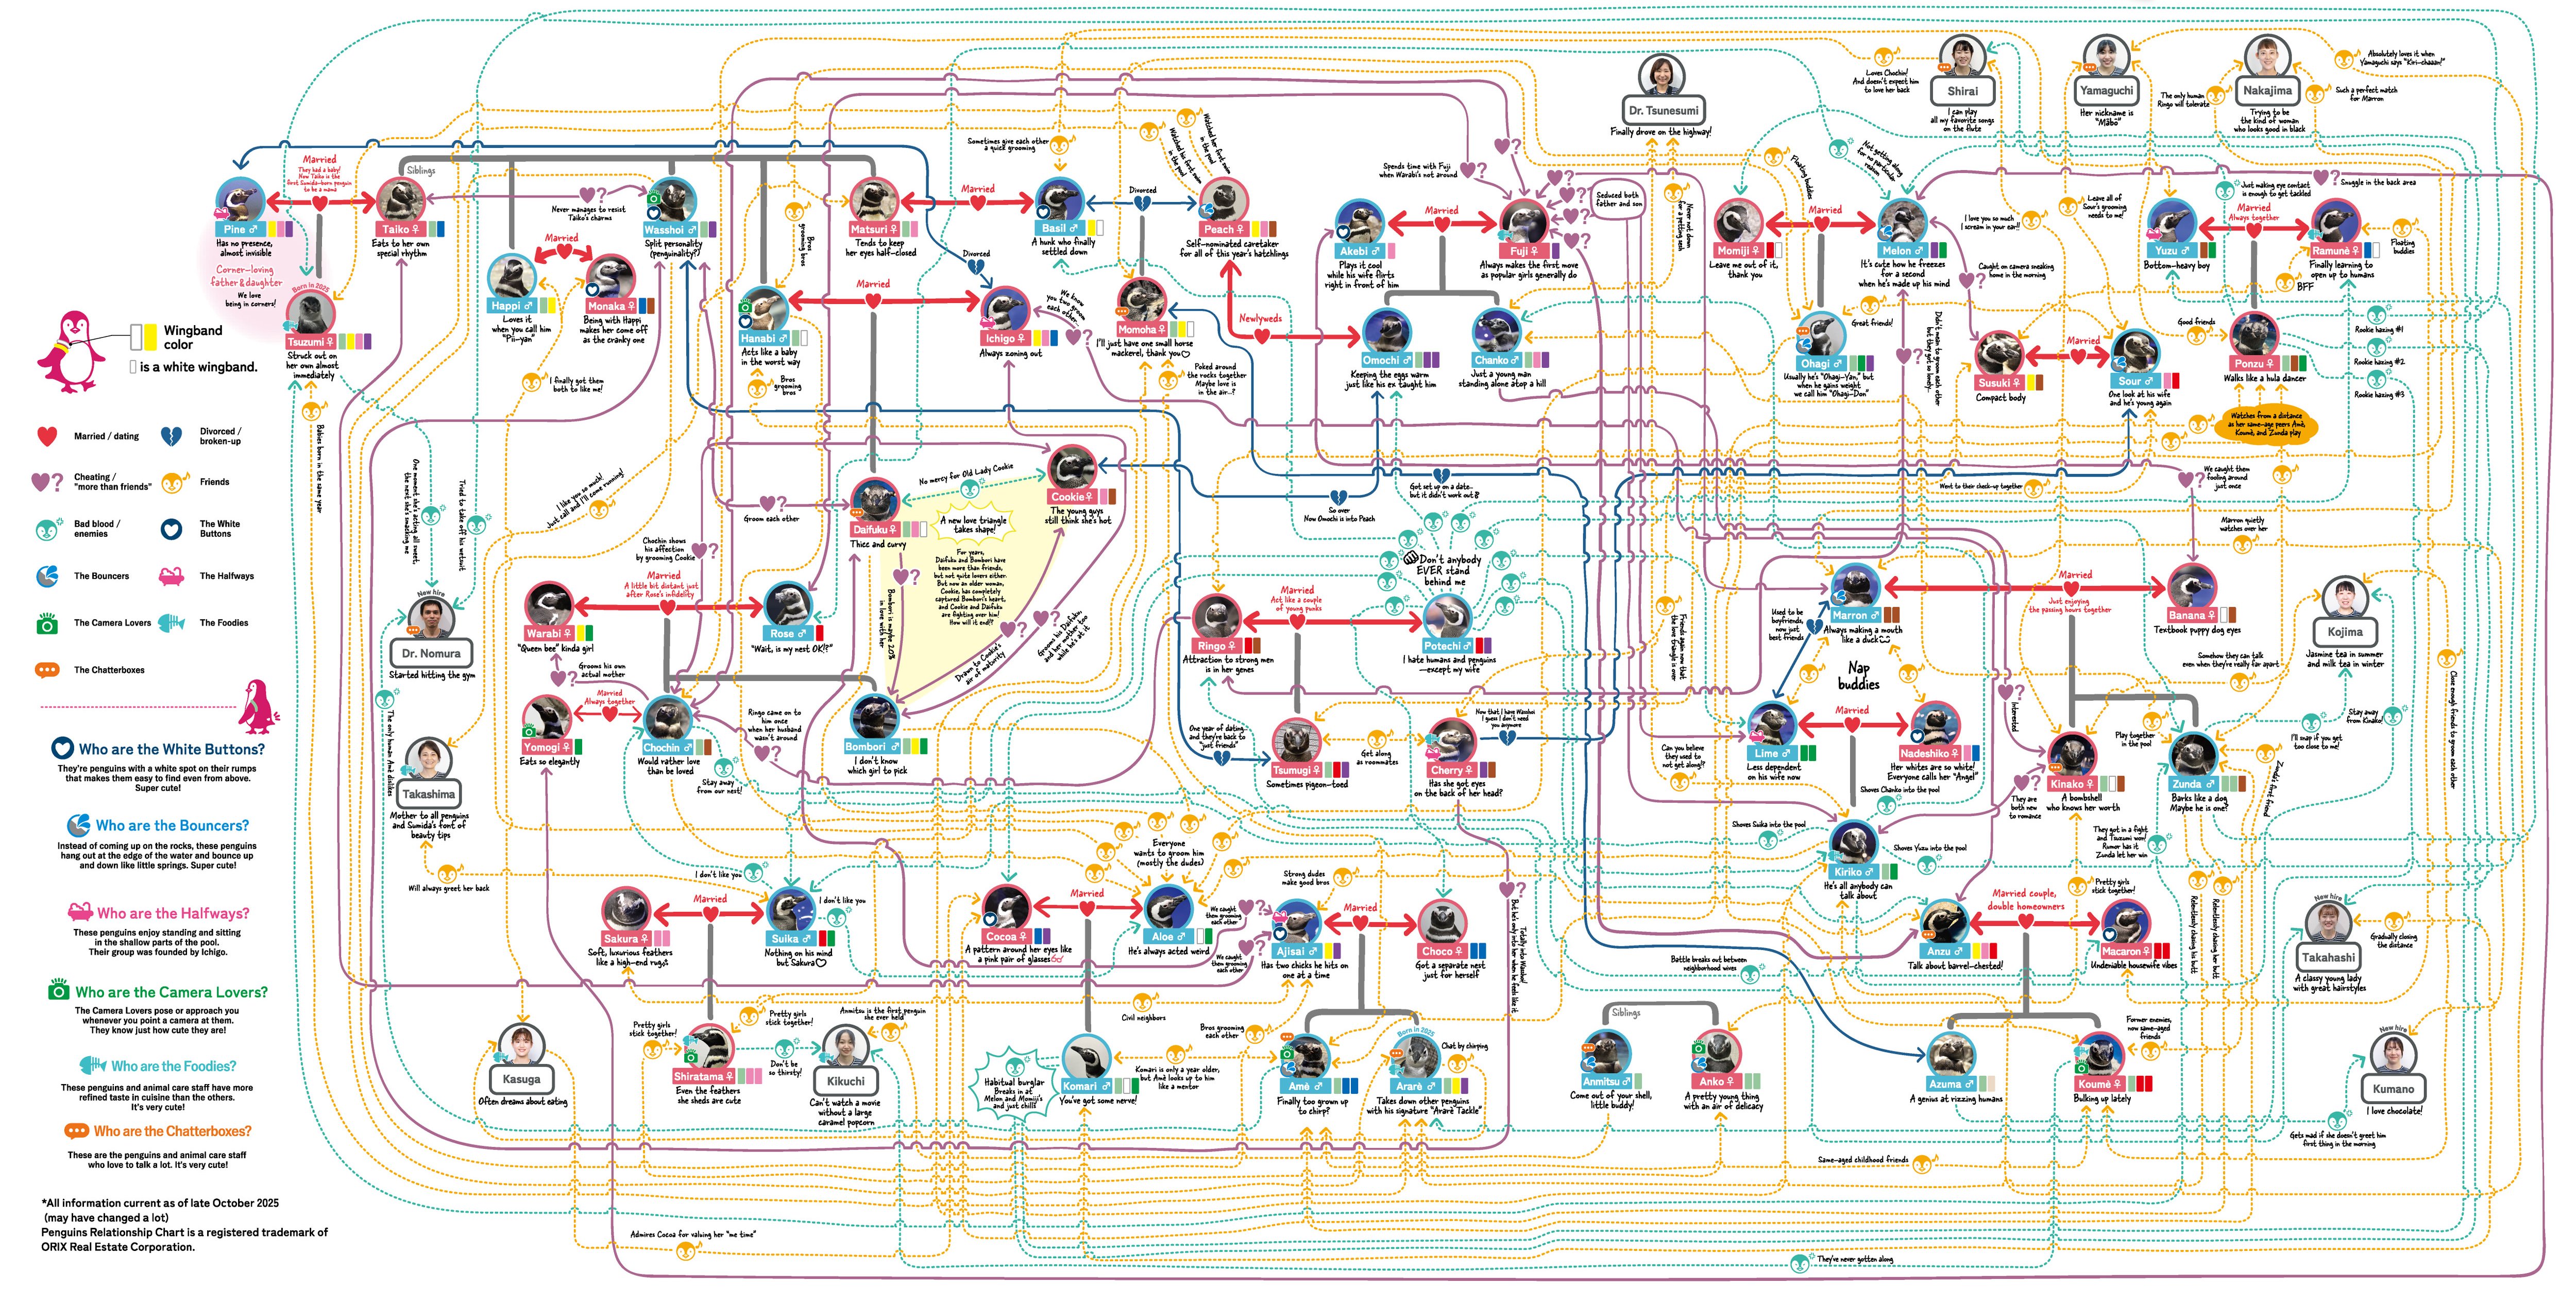
Recurring topics this week include sea routes, the boom of AI, and penguin relationships.

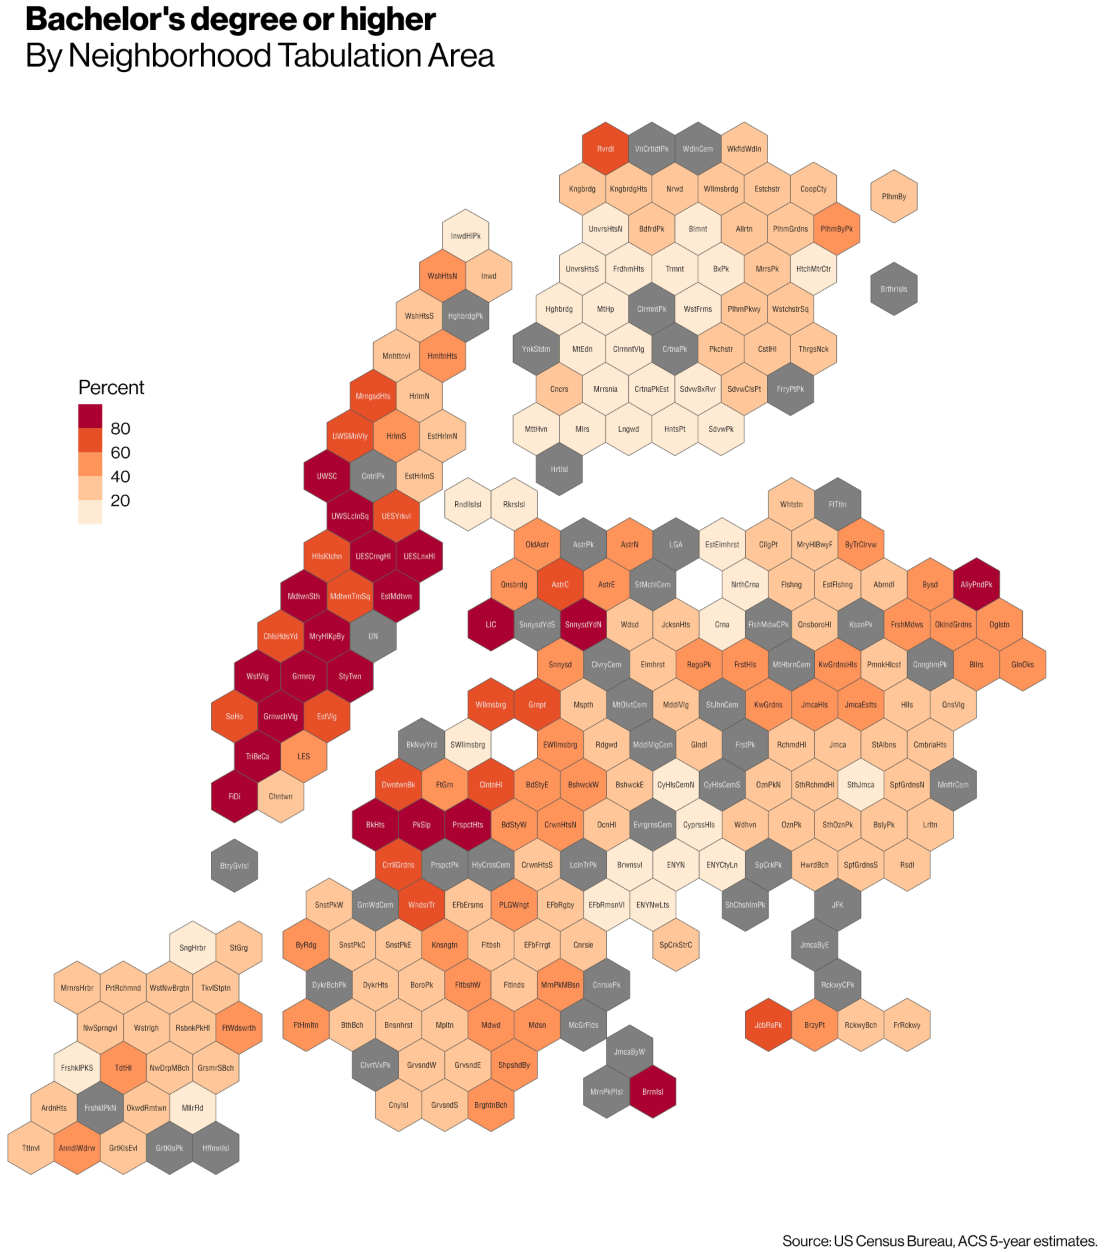
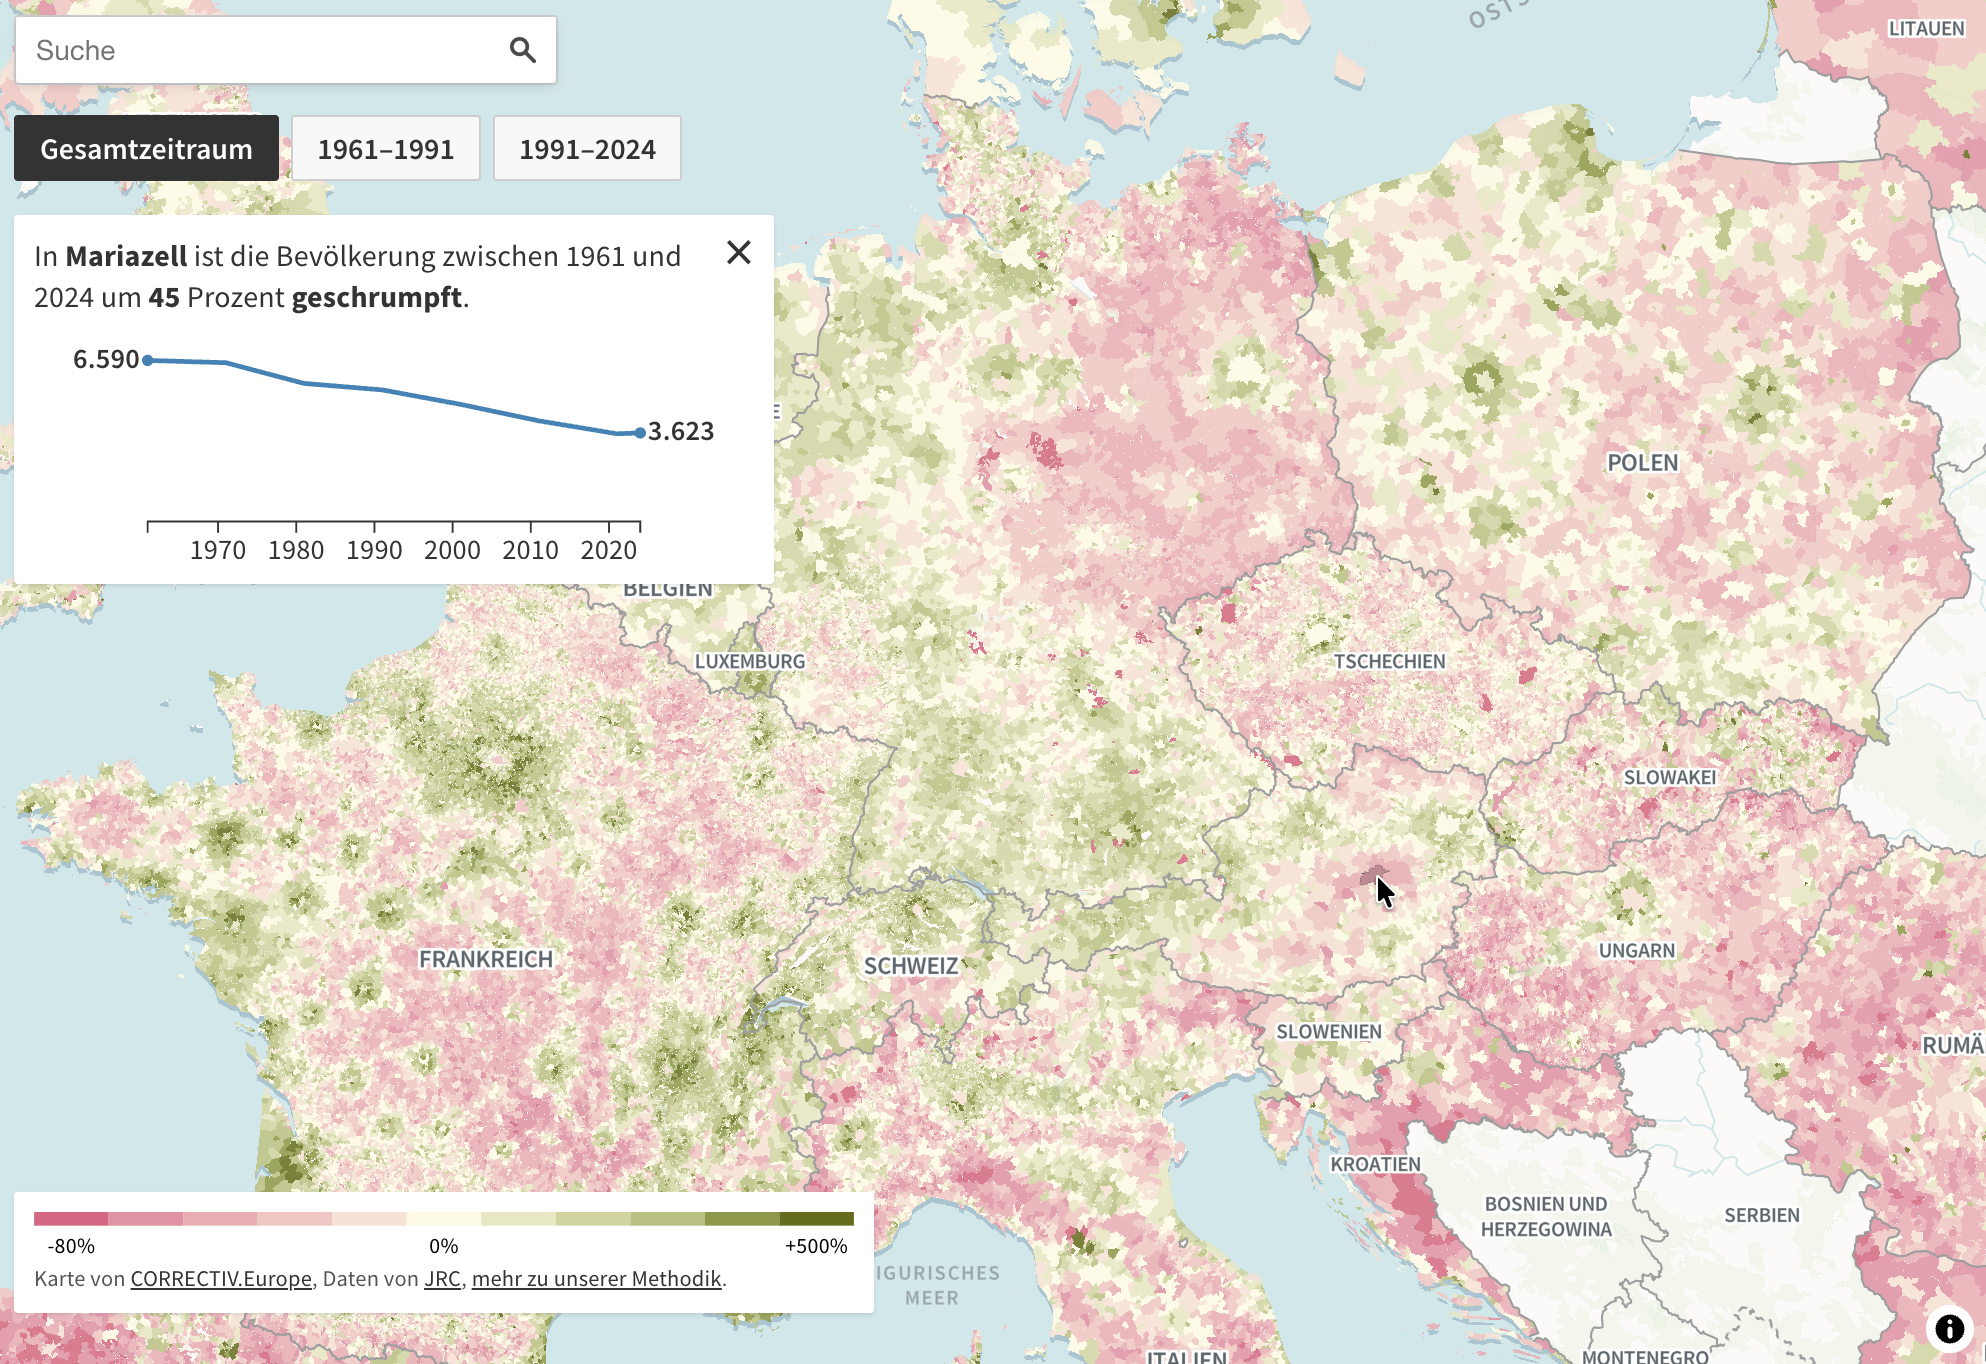
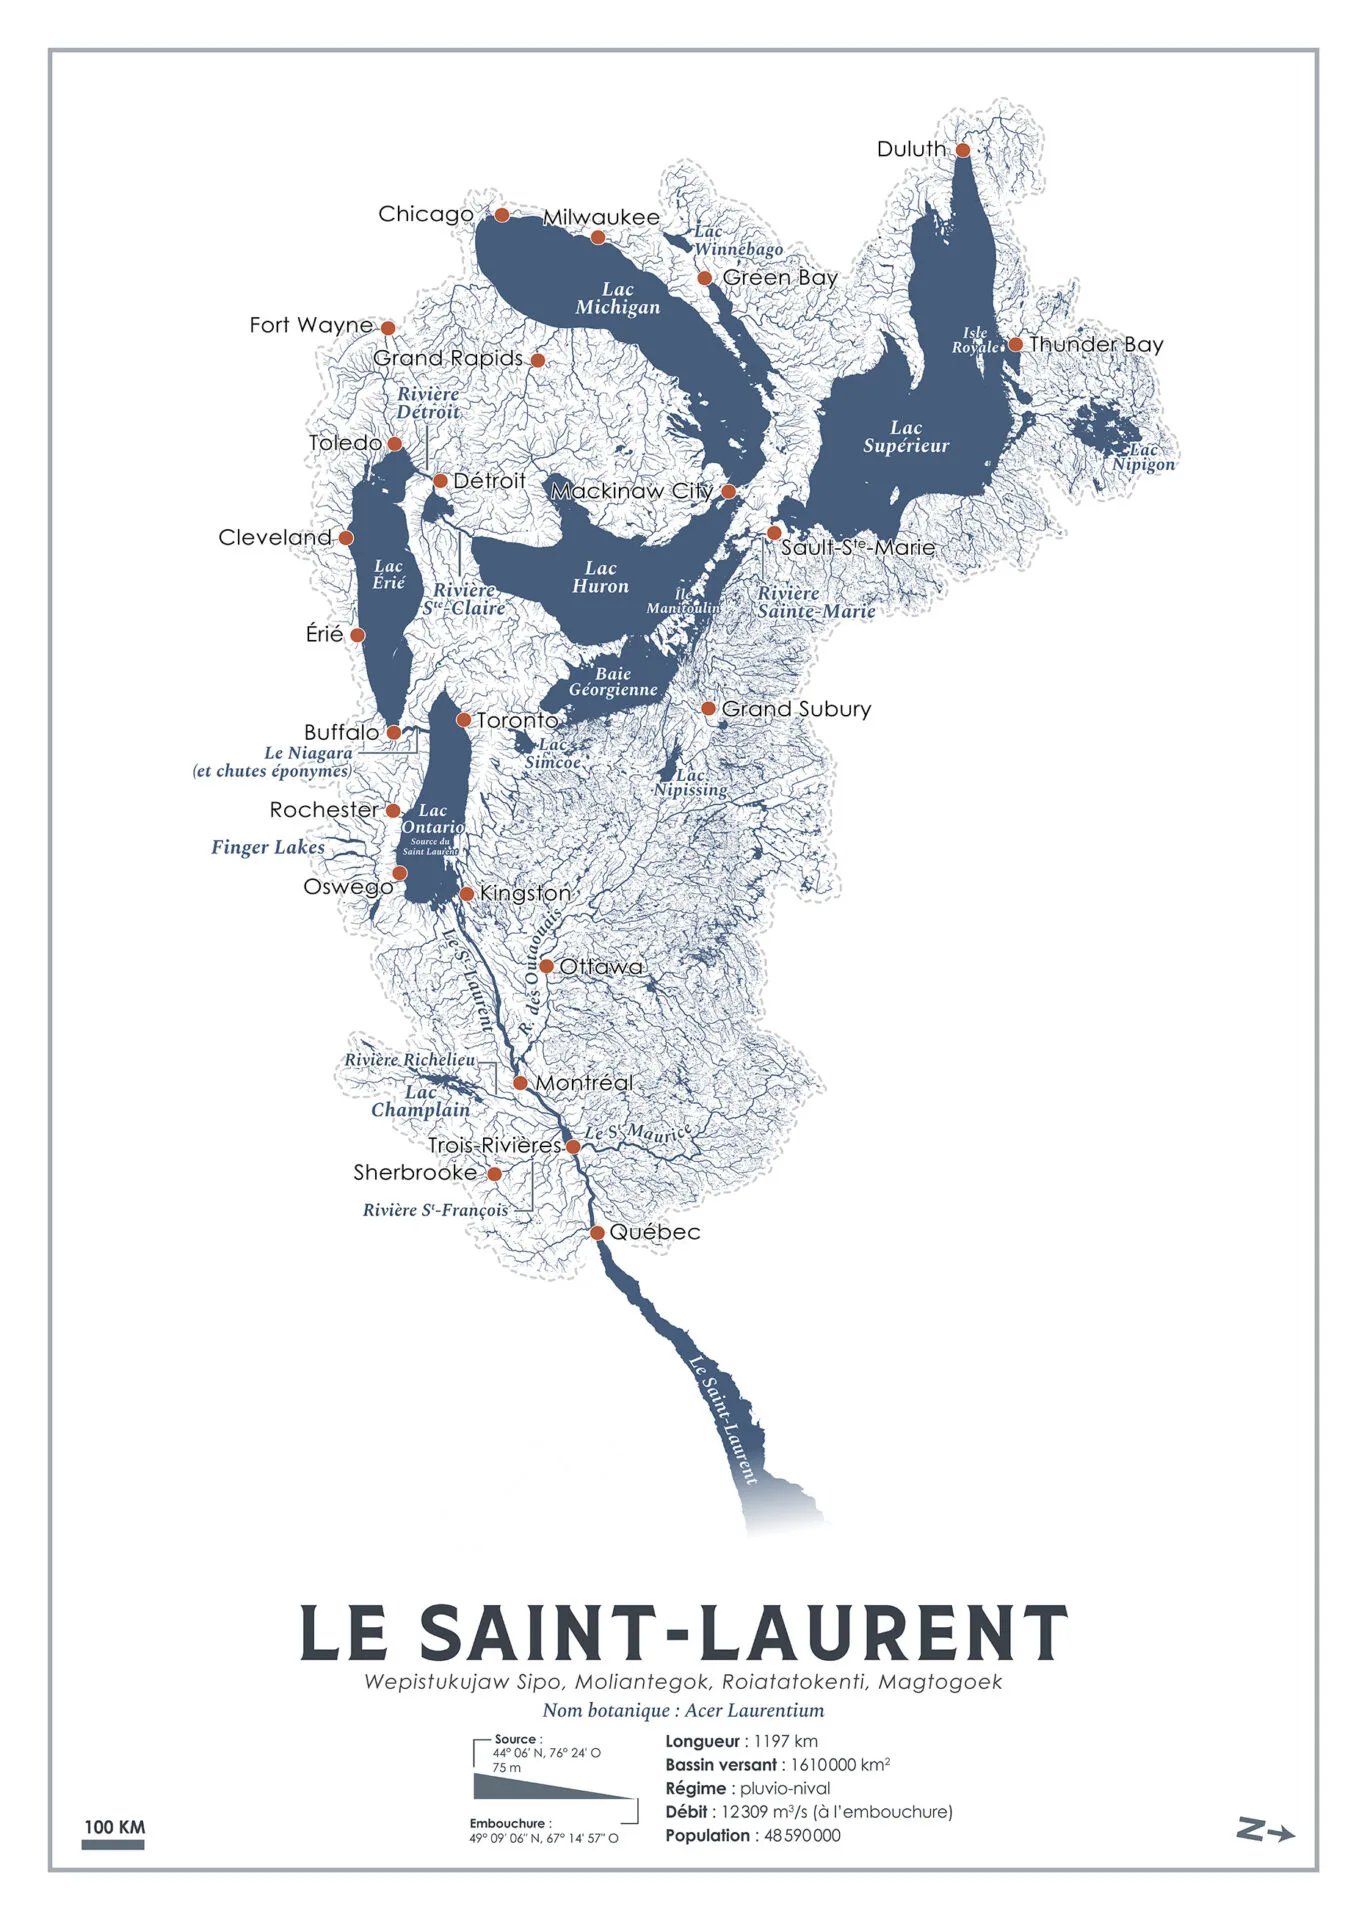
We start this week's Dispatch with maps, the ideal way to visualize location-based information — from cross-border movement to education levels, changing town populations, and even rivers reimagined as trees!

SRF: Wo es die Zuzüger aus dem Ausland hinzieht [Where newcomers from abroad are drawn to]
Kieran Healy: <a href="https://kieranhealy.org/blog/archives/2026/04/19/new-york-city-hexmaps/"><strong>New York City Hexmaps</strong></a>, April 19
Kieran Healy: New York City Hexmaps, April 19
Correctiv: <a href="https://correctiv.org/en/europe/2026/04/21/half-of-europes-towns-and-villages-have-fewer-residents-than-60-years-ago/"><strong>Half of Europe’s towns and villages have fewer residents than 60 years ago</strong></a>, April 21
Correctiv: Half of Europe’s towns and villages have fewer residents than 60 years ago, April 21
Maps.com: <a href="https://www.maps.com/river-tree-maps-reimagine-worlds-largest-watersheds-as-trees/"><strong>Mapping River Trees</strong></a>, April 20 <span class="badge">Check out the stunning collection of river trees!</span>
Maps.com: Mapping River Trees, April 20 Check out the stunning collection of river trees!

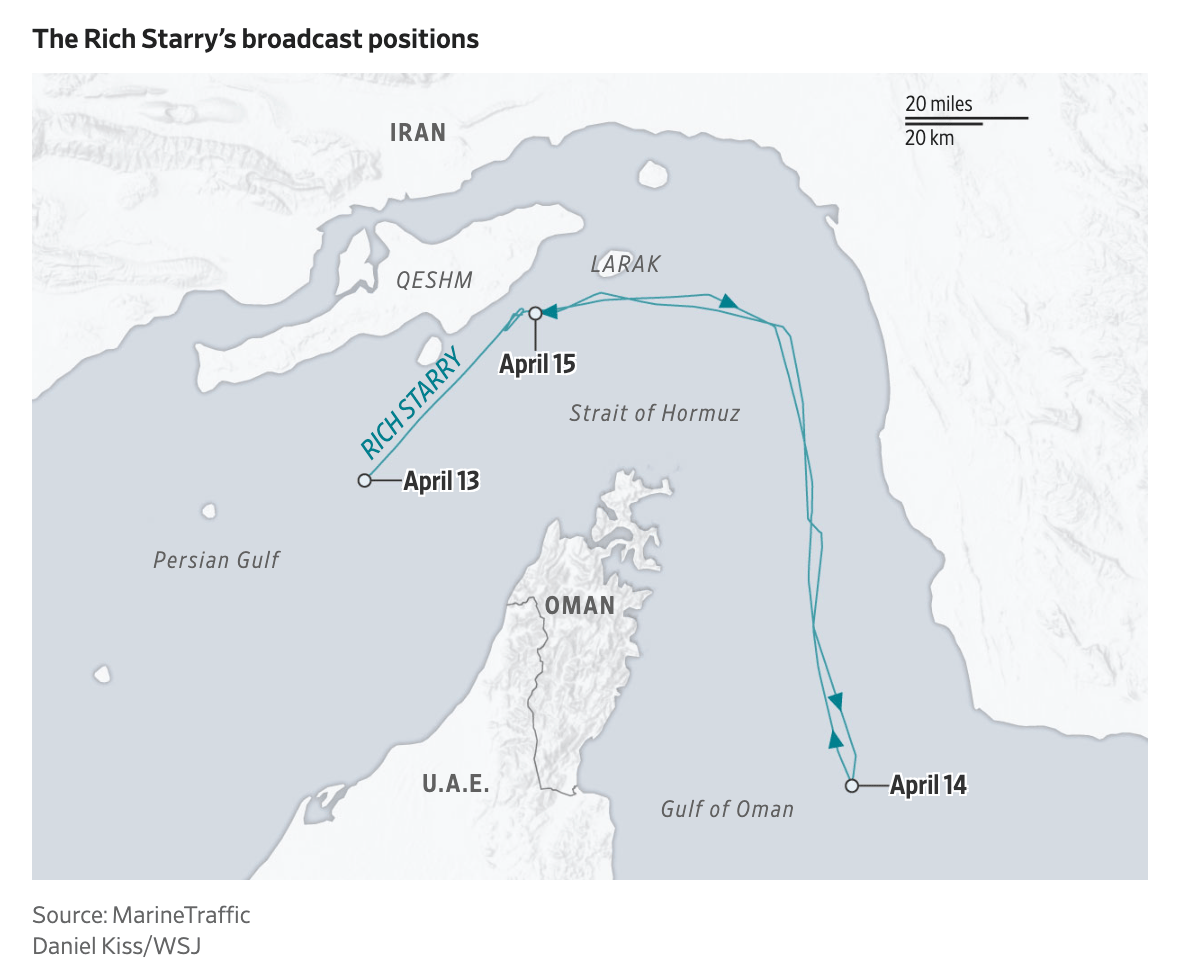
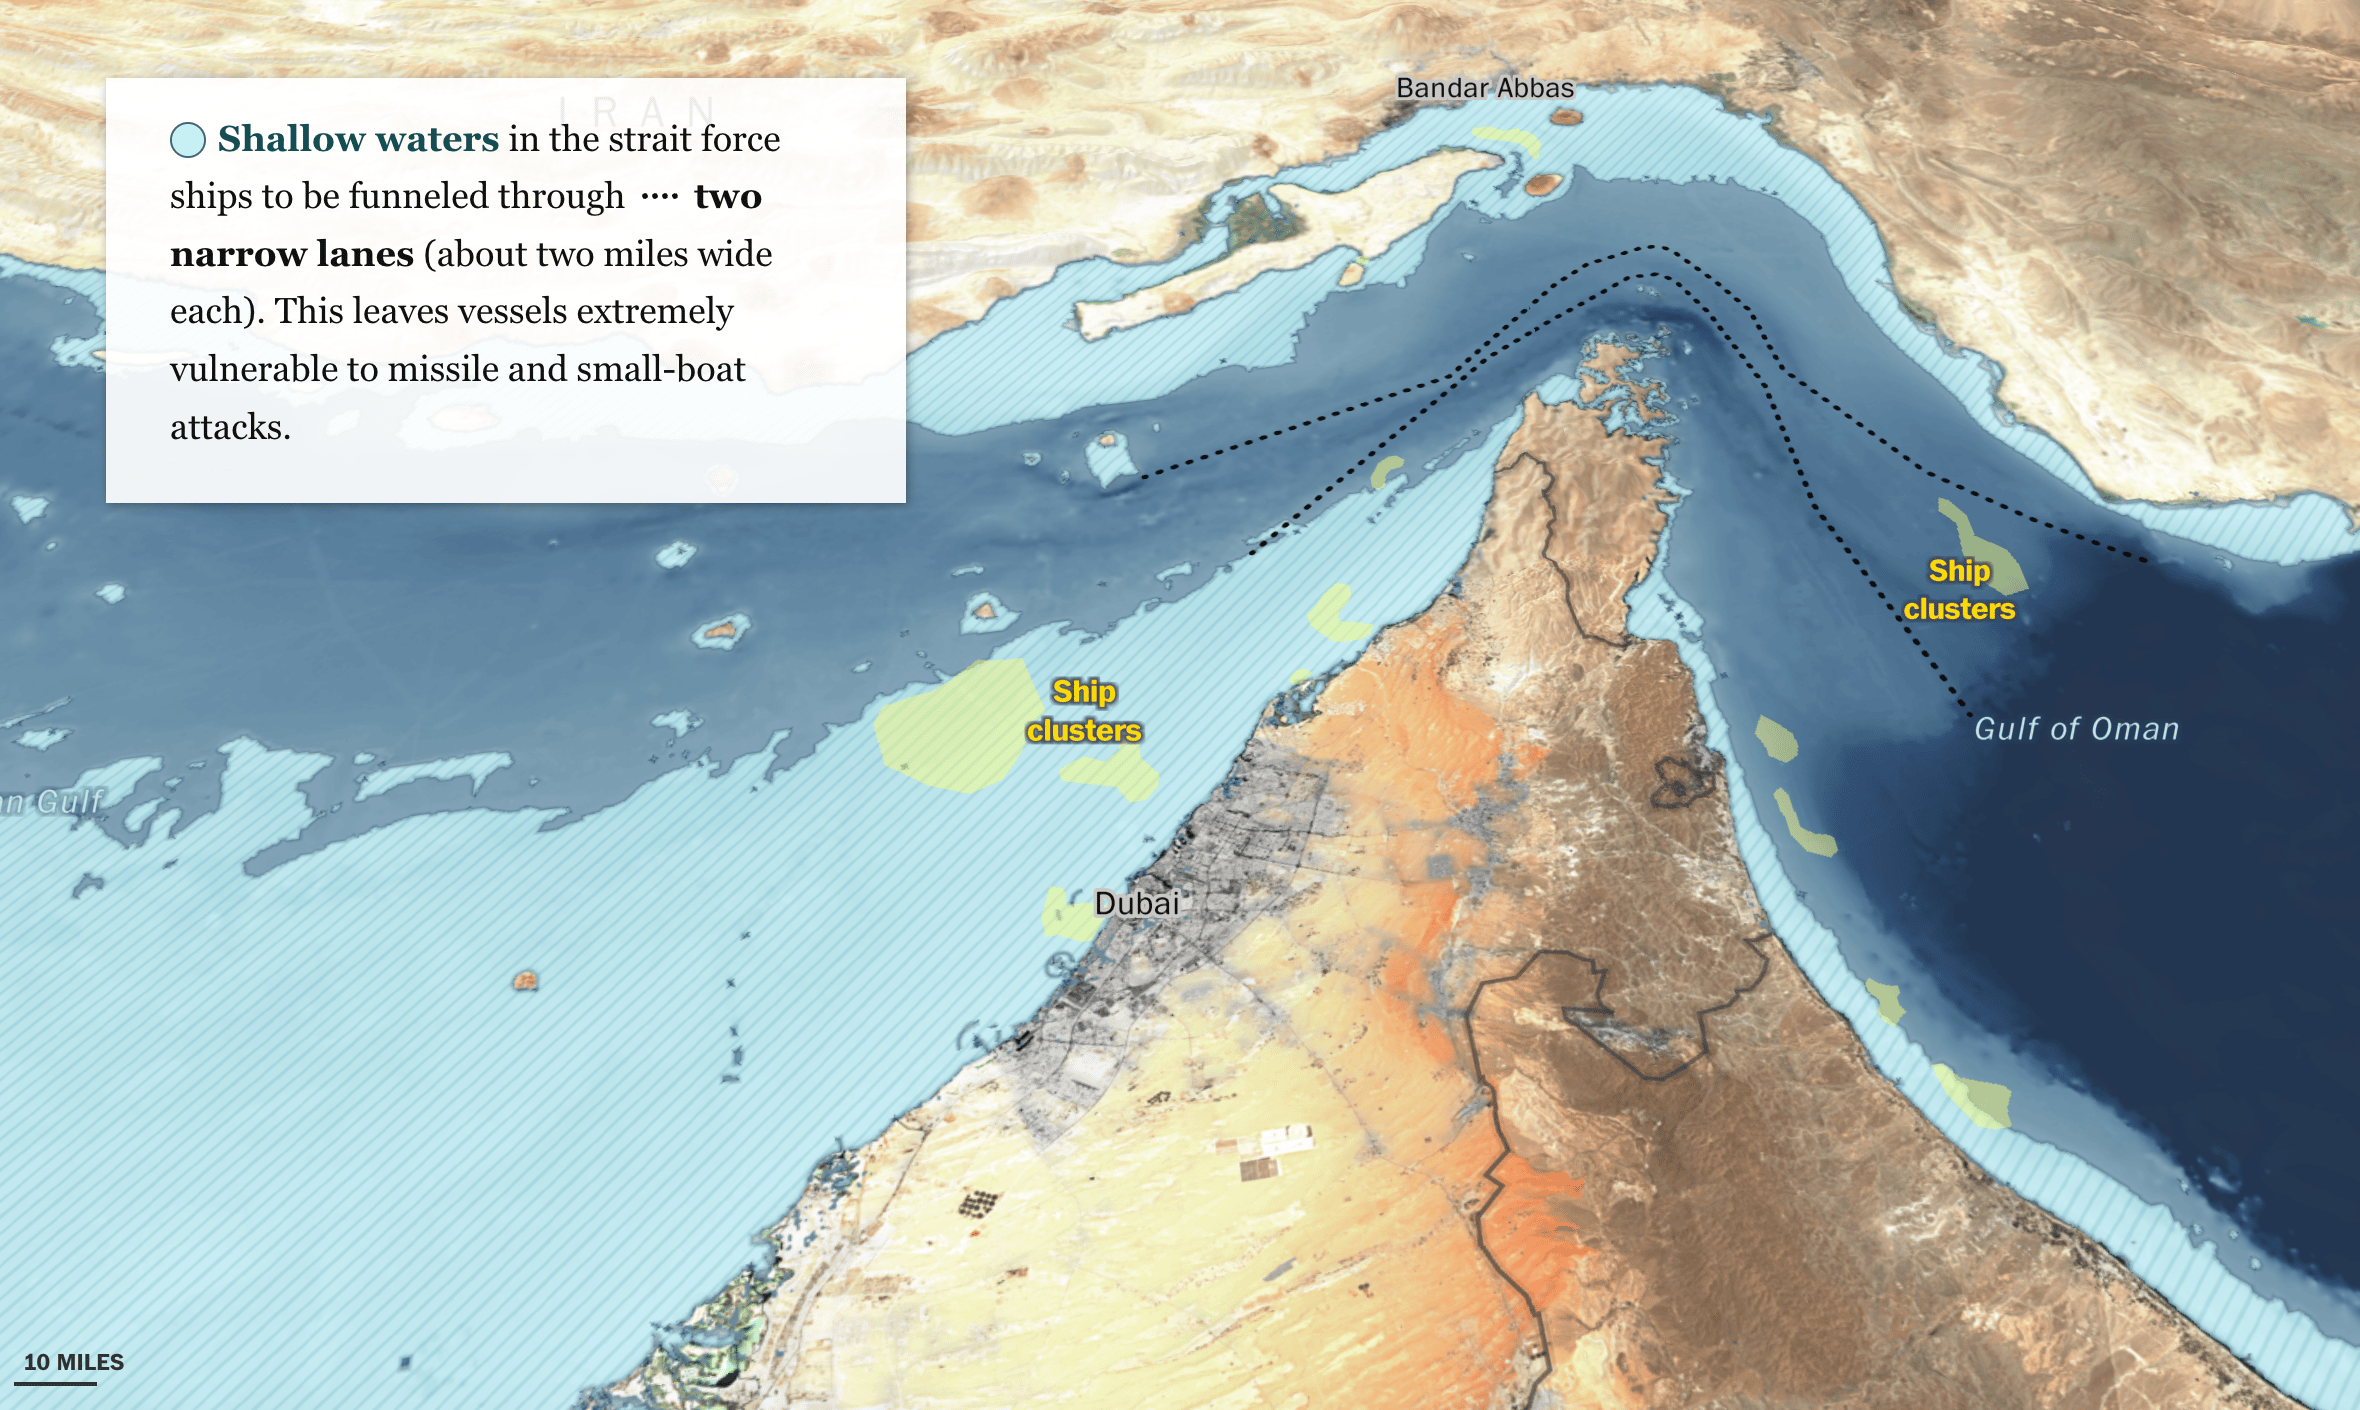
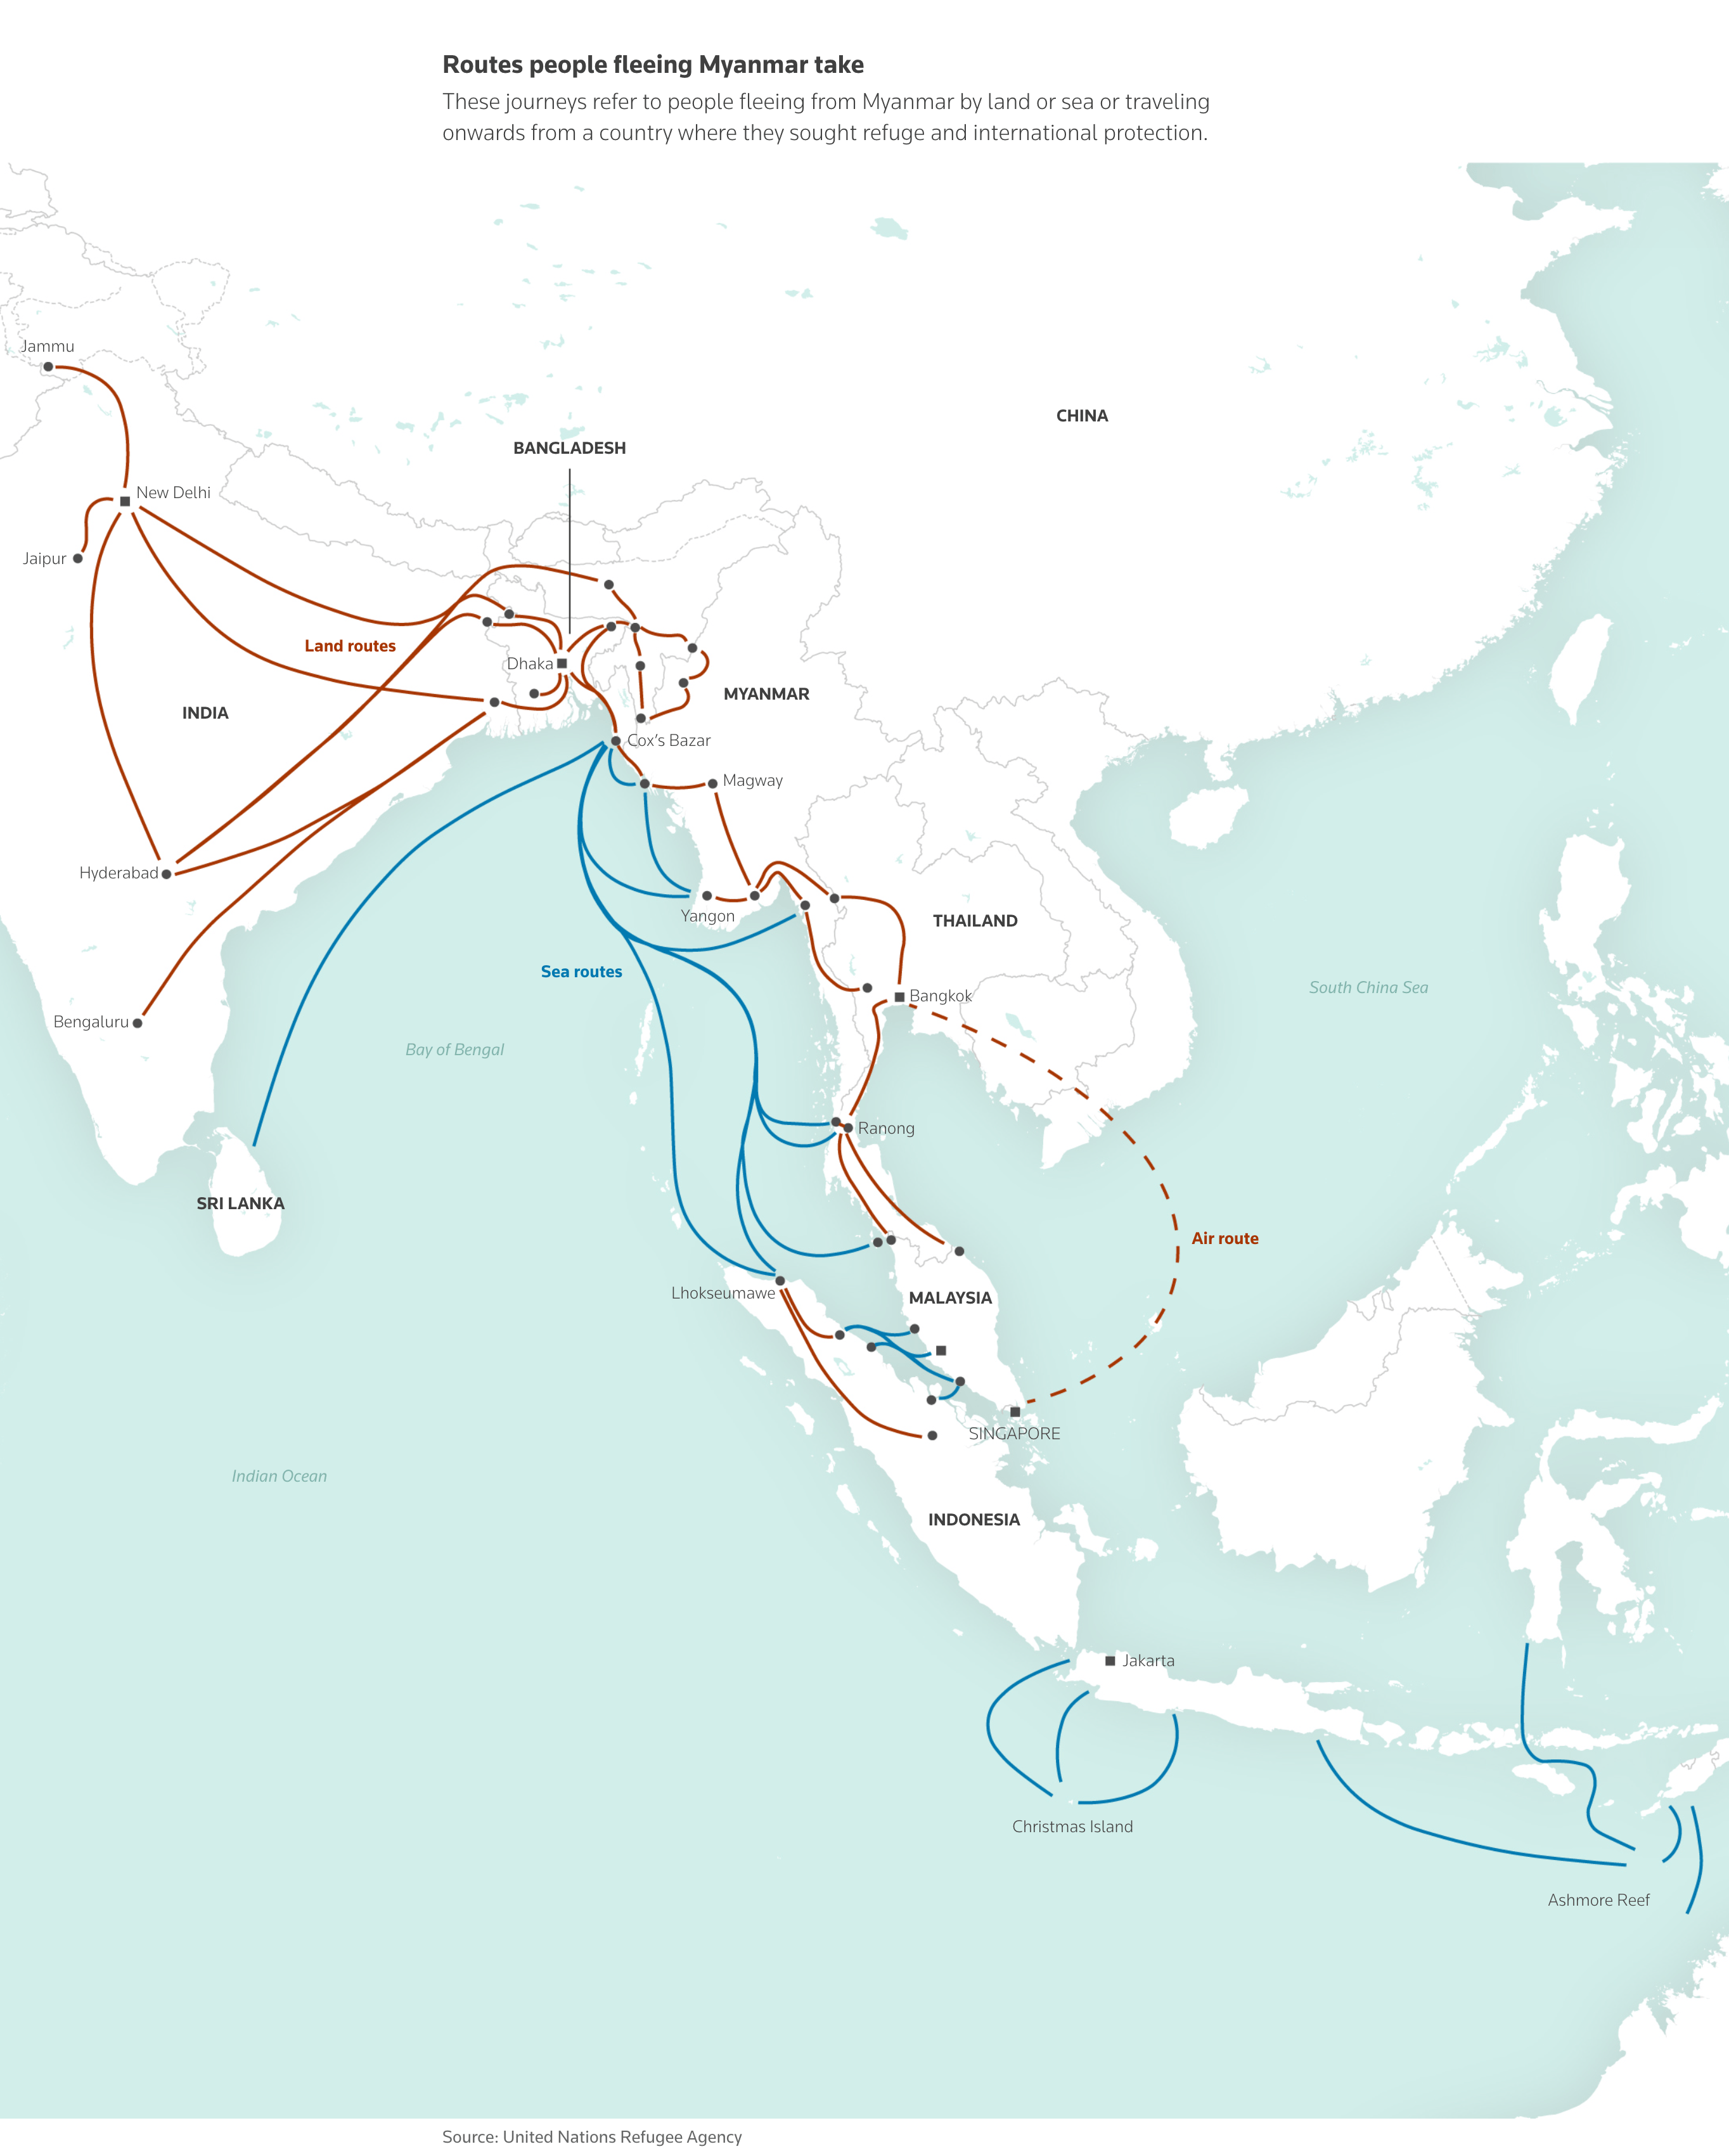
Maps are also useful for visualizing sea routes, including the blockade of the Strait of Hormuz and the journeys of Myanmar refugees seeking safety.

The New York Times: The Slow-Motion Battle for Hormuz, April 16
The Wall Street Journal: <a href="https://www.wsj.com/world/middle-east/irans-shadow-fleet-meets-its-match-in-u-s-blockade-8533f23b?mod=e2twg"><strong>Iran’s Shadow Fleet Meets Its Match in U.S. Blockade</strong></a>, April 15
The Wall Street Journal: Iran’s Shadow Fleet Meets Its Match in U.S. Blockade, April 15
The Washington Post: <a href="https://www.washingtonpost.com/world/interactive/2026/hormuz-strait-control-blockade/"><strong>How geography powers Iran’s grip on the Strait of Hormuz, despite U.S. blockade</strong></a>, April 14
The Washington Post: How geography powers Iran’s grip on the Strait of Hormuz, despite U.S. blockade, April 14
Reuters: <a href="https://www.reuters.com/graphics/BANGLADESH-ROHINGYA/zjpqmonmzpx/"><strong>Myanmar refugees seek risky sea routes to safety</strong></a>, April 16
Reuters: Myanmar refugees seek risky sea routes to safety, April 16

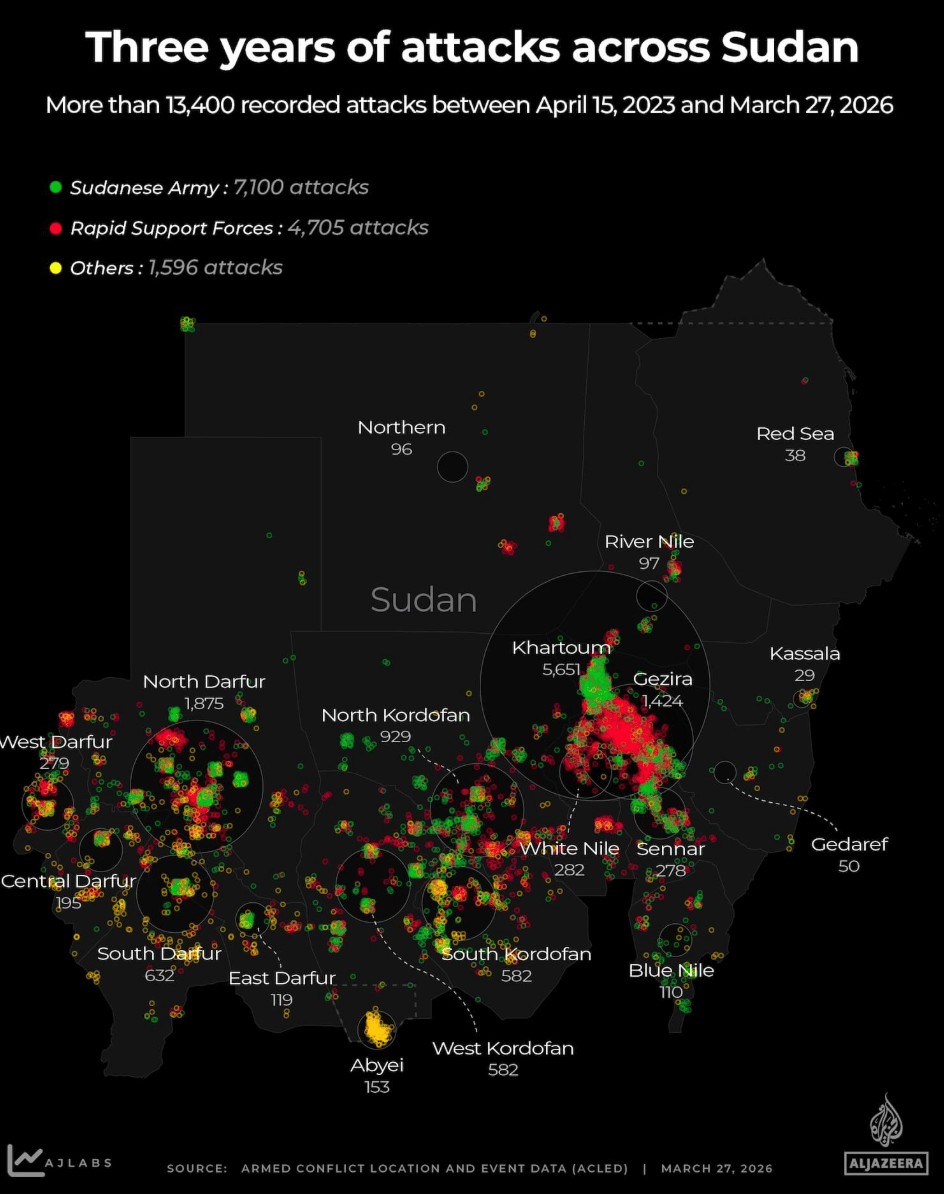
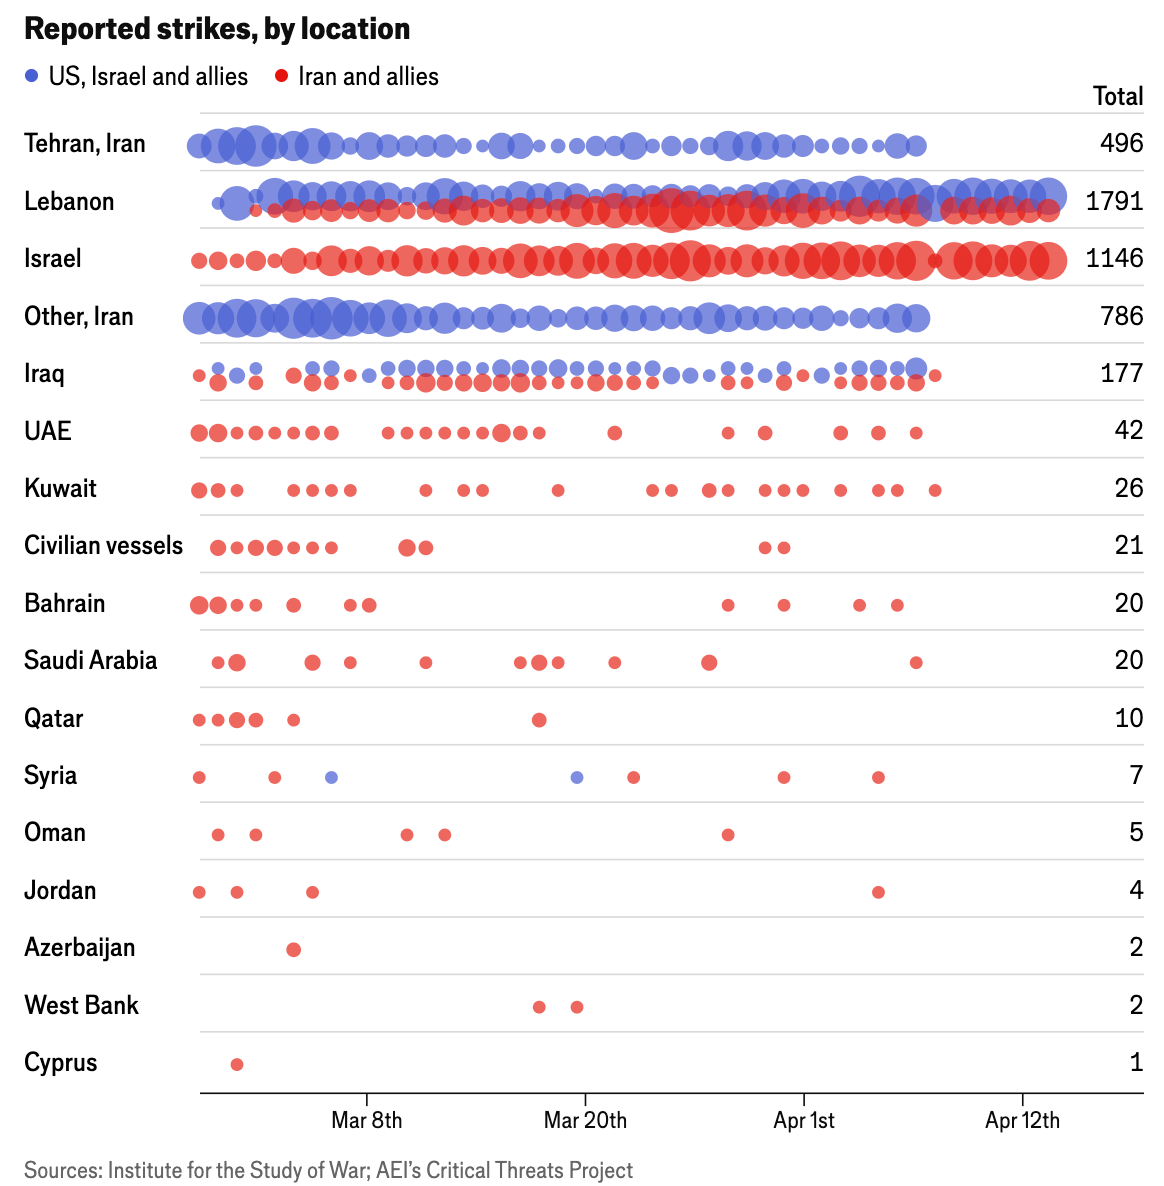
Regarding ongoing conflicts, various attacks have taken place across Sudan, a high number of strikes are being reported in the Middle East, and an increase in air alerts has been recorded in Russia.

Al Jazeera: <a href="https://interactive.aljazeera.com/aje/2026/sudan-under-fire/"><strong>Three years of Sudan under fire</strong></a>, April 15
Al Jazeera: Three years of Sudan under fire, April 15
The Economist: <a href="https://www.economist.com/interactive/2026-iran-war-tracker"><strong>The Iran war in maps and charts</strong></a>, April 15
The Economist: The Iran war in maps and charts, April 15
Texty.org.ua: <a href="https://texty.org.ua/articles/117234/kudy-bye-ukrayina-po-rosiyi-heohrafiya-lohika-ta-priorytety-udariv/"><strong>Куди б’є Україна по Росії: географія, логіка та пріоритети ударів</strong></a> [<em>Chart title: Air alerts in Russia</em>], April 20
Texty.org.ua: Куди б’є Україна по Росії: географія, логіка та пріоритети ударів [Chart title: Air alerts in Russia], April 20

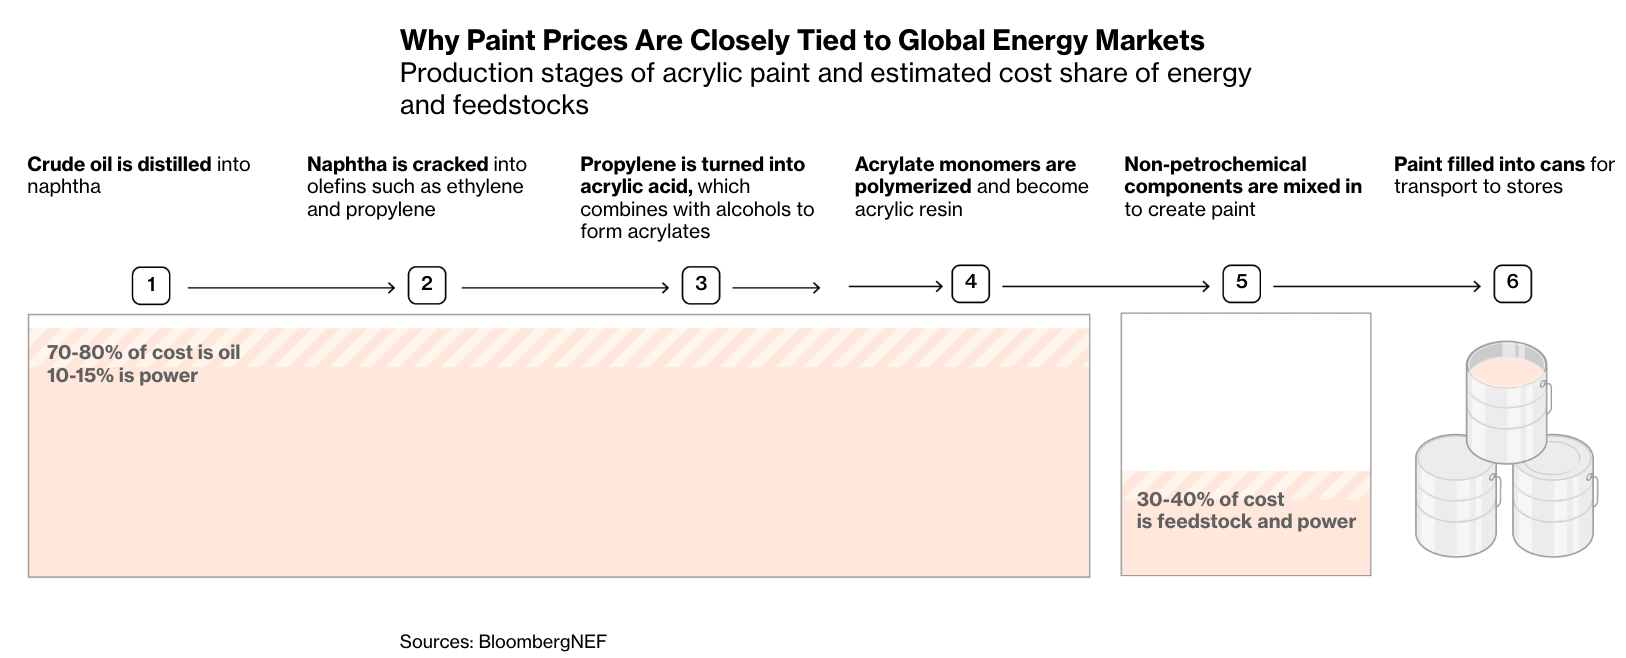
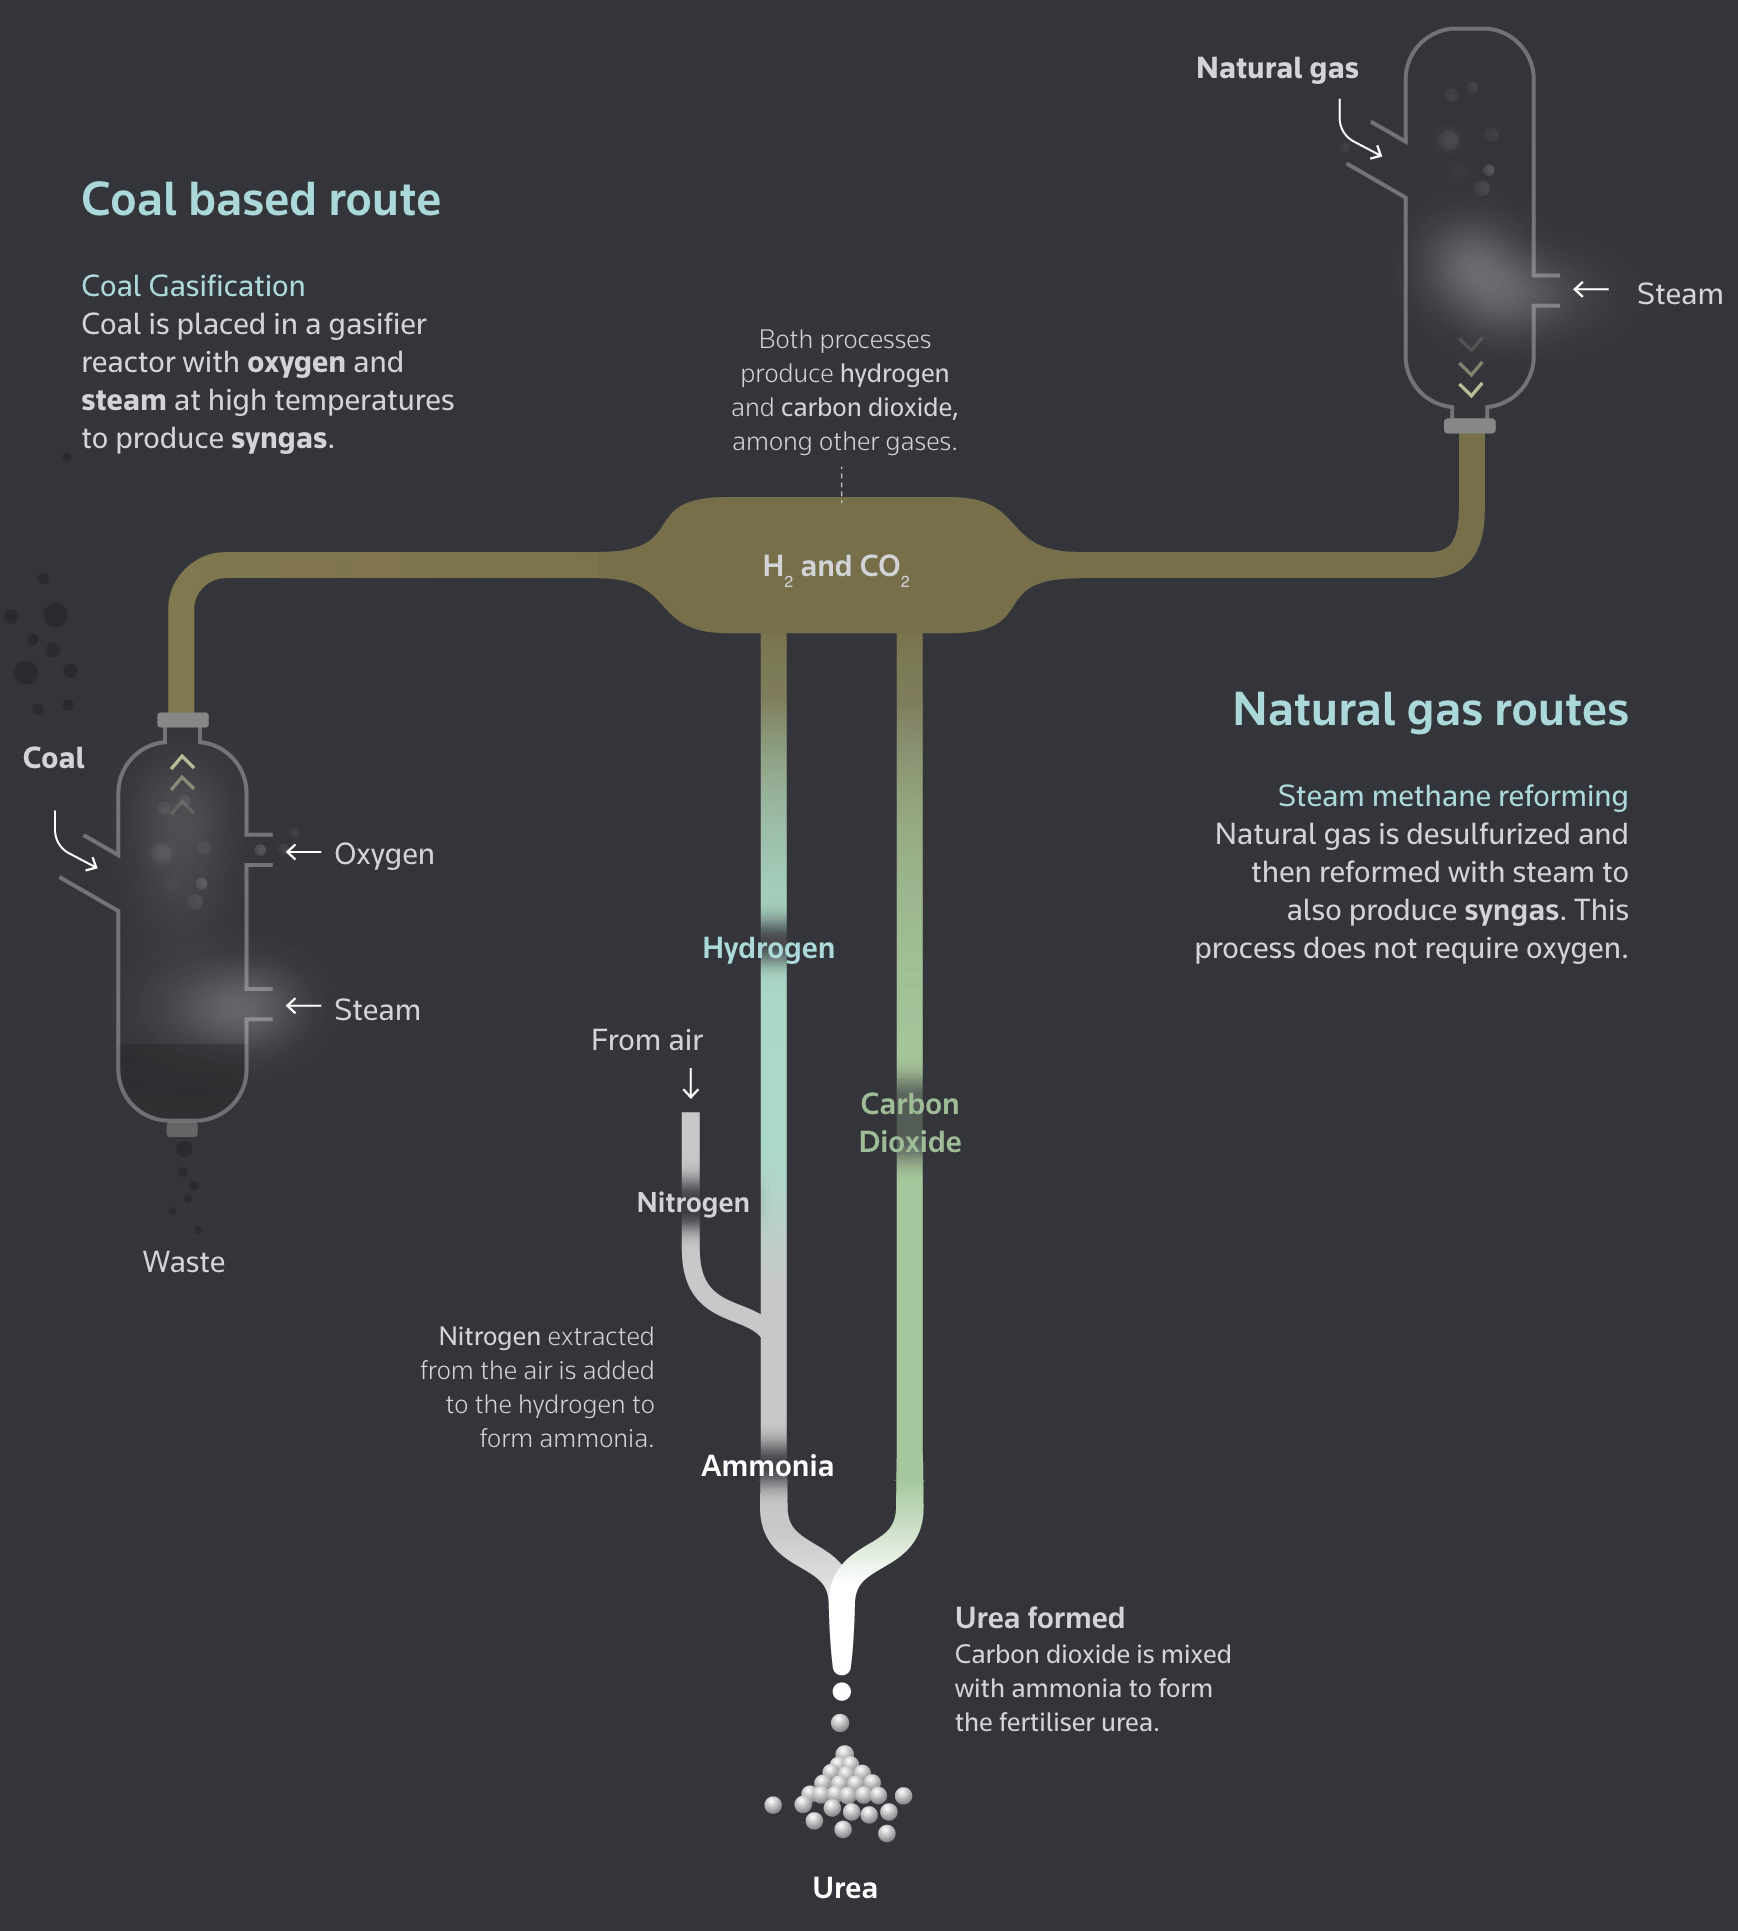
The war in the Middle East is still driving up prices worldwide, from military interceptor costs to paint production costs. Meanwhile, China has not been as affected by rising fertiliser costs, thanks to its self-sufficiency in urea production.

The New York Times: How Iran’s Cheap, Low-Tech Drones Have Cost the U.S., April 18
Bloomberg: <a href="https://www.bloomberg.com/graphics/2026-europe-chemicals-iran-war/?srnd=phx-graphics-v2"><strong>Iran War Threatens the Building Blocks of Europe’s Food and Car Production</strong></a>, April 15
Bloomberg: Iran War Threatens the Building Blocks of Europe’s Food and Car Production, April 15
Reuters: <a href="https://www.reuters.com/graphics/IRAN-CRISIS/CHINA-UREA/zgpolzxlqvd/"><strong>How China turns coal into urea</strong></a>, April 20
Reuters: How China turns coal into urea, April 20

And speaking of costs, Trump's plans for the 250-foot Triumphal Arch come to mind, with construction set to be funded by public and private sources.

The New York Times: How the Giant D.C. Arch Would Compare to Others Across the World, April 15
La Razón de México: <a href="https://www.razon.com.mx/infografias/2026/04/16/un-arco-del-triunfo-a-capricho-de-trump/"><strong>EU presenta Arco del Triunfo a capricho del magnate</strong></a> [<em>The US unveils the Arc de Triomphe at the whim of the tycoon</em>], April 16
La Razón de México: EU presenta Arco del Triunfo a capricho del magnate [The US unveils the Arc de Triomphe at the whim of the tycoon], April 16

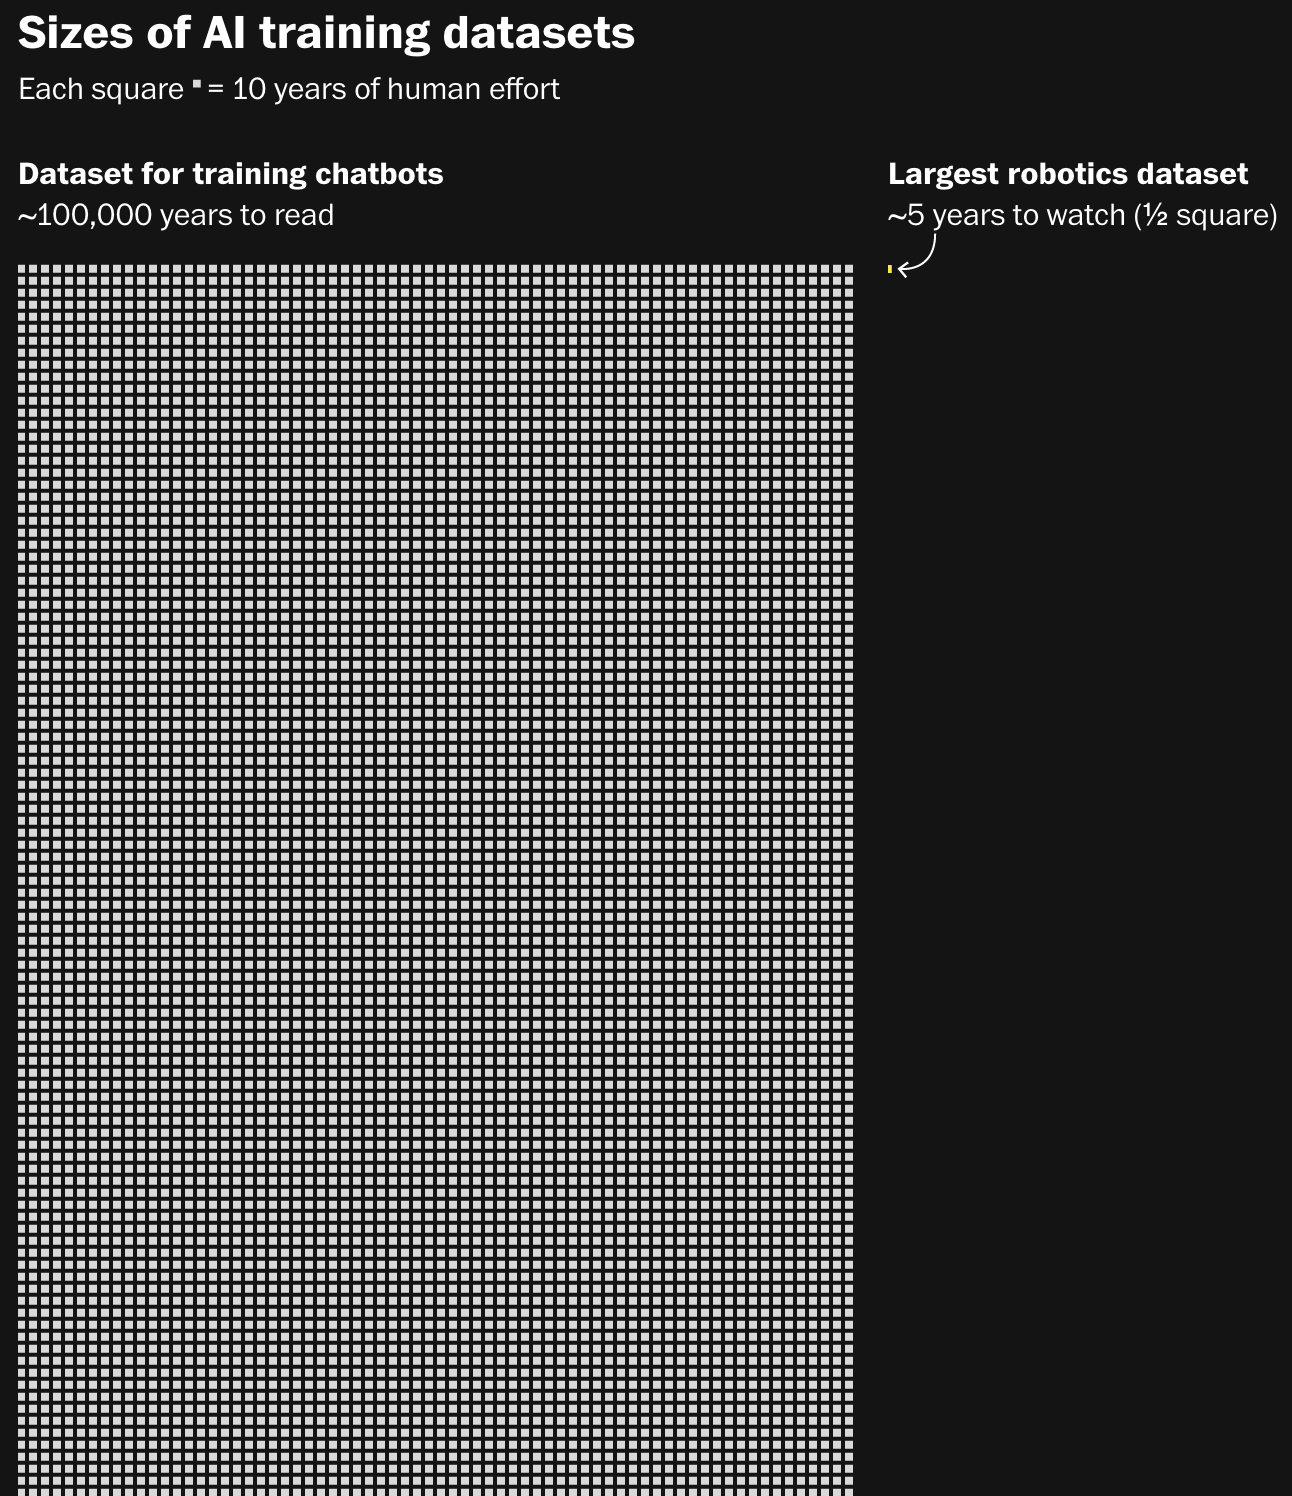
The boom of AI has led to an increase in its use, resulting in more testing and training to improve performance.

Not-Ship: <a href="https://www.not-ship.com/ai-could-mean-the-death-of-anonymity/"><strong>AI could mean the death of anonymity</strong></a>, April 15
Not-Ship: AI could mean the death of anonymity, April 15
The Straits Times: <a href="https://www.straitstimes.com/multimedia/graphics/2026/04/ai-chatbots-privacy-risk/index.html?shell"><strong>AI chatbots know more about you than you realise</strong></a>, April 14
The Straits Times: AI chatbots know more about you than you realise, April 14
Mabu News: <a href="https://mabunews.stibee.com/p/331"><strong>🎩 미국이 금융계 거물 CEO들을 긴급하게 소집한 이유는?</strong></a> [<em>Chart title: Claude Mythos Preview Model Performance</em>], April 17
Mabu News: 🎩 미국이 금융계 거물 CEO들을 긴급하게 소집한 이유는? [Chart title: Claude Mythos Preview Model Performance], April 17
The Washington Post: <a href="https://www.washingtonpost.com/technology/interactive/2026/robot-chores-video-data/"><strong>See why tech companies are paying people to do chores</strong></a>, April 17
The Washington Post: See why tech companies are paying people to do chores, April 17

With record-breaking temperatures already being reported this year, trees are being widely affected. Meanwhile, the U.S. has experienced a surprising spread of cold air across the country.

The Guardian: <a href="https://www.theguardian.com/world/2026/apr/15/cherry-blossom-1200-years-japan-climate-scientist-yasuyuki-aono?CMP=oth_b-aplnews_d-5"><strong>After 1,200 years, cherry blossom record to live on despite Japanese scientist’s death</strong></a>, April 15
The Guardian: After 1,200 years, cherry blossom record to live on despite Japanese scientist’s death, April 15
One Day Isang Bagay: <a href="https://onedayisangbagay.substack.com/p/data-surprisingly-hidden-plain-sight-inventory-trees-luneta-rizal-paco-park"><strong>[Data SHIPS] Tree's a crowd in Luneta, Paco parks</strong></a>, April 18
One Day Isang Bagay: [Data SHIPS] Tree's a crowd in Luneta, Paco parks, April 18
The New York Times: Northeast Swings From 90 Degrees to Freezing Cold in Just a Few Days, April 20

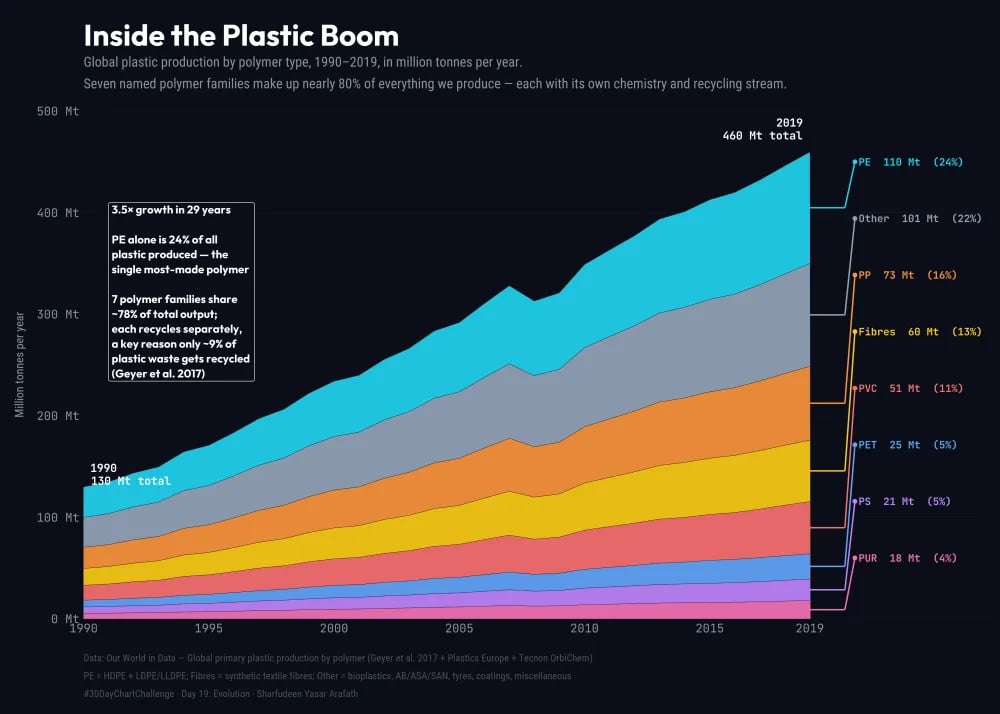
And last but not least, we present to you this week's selection of the #30DayChartChallenge visualizations!

Georgios Karamanis: "This week's #TidyTuesday dataset comes from the at-sea seabird records held by Te Papa Tongarewa, built largely from the handwritten logbooks of Captain J. Jenkins, who recorded 6583 bird sightings on Southern Ocean voyages from 1969 to 1988," April 18 (<a href="https://bsky.app/profile/karaman.is/post/3mjrj3ljsnc2j"><strong>Bluesky</strong></a>)
Georgios Karamanis: "This week's #TidyTuesday dataset comes from the at-sea seabird records held by Te Papa Tongarewa, built largely from the handwritten logbooks of Captain J. Jenkins, who recorded 6583 bird sightings on Southern Ocean voyages from 1969 to 1988," April 18 (Bluesky)
Miki: "El tapiz del calentamiento global (1880-Pres). 🌍🔥 La matriz térmica revela un cambio de régimen: el azul del s.XIX ha sido devorado por un avance implacable del calor extremo. Las estaciones ya no importan, el exceso es sistémico [<em>The Tapestry of Global Warming (1880–Present). 🌍🔥 The temperature map reveals a paradigm shift: the blue of the 19th century has been swallowed up by an unrelenting advance of extreme heat. The seasons no longer matter; the excess is systemic</em>], " April 20 (<a href="https://bsky.app/profile/mikipe.bsky.social/post/3mjw3zjh2342q"><strong>Bluesky</strong></a>)
Miki: "El tapiz del calentamiento global (1880-Pres). 🌍🔥 La matriz térmica revela un cambio de régimen: el azul del s.XIX ha sido devorado por un avance implacable del calor extremo. Las estaciones ya no importan, el exceso es sistémico [The Tapestry of Global Warming (1880–Present). 🌍🔥 The temperature map reveals a paradigm shift: the blue of the 19th century has been swallowed up by an unrelenting advance of extreme heat. The seasons no longer matter; the excess is systemic], " April 20 (Bluesky)
Ansgar Wolsing: "Where does Germany get its cheese? 🧀 And where do they sell it to? 🧀  The network graph and the dot plot essentially show the same data. While the network is probably more playful, the dot plot reveals the results more accurately," April 15 (<a href="https://bsky.app/profile/ansgarw.bsky.social/post/3mjkf4igo7s2h"><strong>Bluesky</strong></a>)
Ansgar Wolsing: "Where does Germany get its cheese? 🧀 And where do they sell it to? 🧀 The network graph and the dot plot essentially show the same data. While the network is probably more playful, the dot plot reveals the results more accurately," April 15 (Bluesky)
Yasar Sharfudeen: "Day 19 #30DayChartChallenge — Evolution  130 Mt in 1990. 460 Mt in 2019. Global plastic production has tripled in 29 years — and "plastic" is 8 different polymer families.  PE alone = 24% of all production," April 19 (<a href="https://bsky.app/profile/newbie2k25.bsky.social/post/3mjueitiy322s"><strong>Bluesky</strong></a>)
Yasar Sharfudeen: "Day 19 #30DayChartChallenge — Evolution 130 Mt in 1990. 460 Mt in 2019. Global plastic production has tripled in 29 years — and "plastic" is 8 different polymer families. PE alone = 24% of all production," April 19 (Bluesky)
Ansgar Wolsing: "The evolution of BEV sales in Germany. 🚗," April 19 (<a href="https://bsky.app/profile/ansgarw.bsky.social/post/3mjtulxk7pc2p"><strong>Bluesky</strong></a>)
Ansgar Wolsing: "The evolution of BEV sales in Germany. 🚗," April 19 (Bluesky)

What else we found interesting

Sumida Aquarium: <a href="https://www.sumida-aquarium.com/special/sokanzu/en/2026/"><strong>Three minutes to figure it out, hours to take it all in! Sumida Penguins Relationship Chart 2026</strong></a>
Sumida Aquarium: Three minutes to figure it out, hours to take it all in! Sumida Penguins Relationship Chart 2026
FlowingData: Data portraits of population, April 16 (project website) an incredible archive of hand-drawn charts
Alexa Cristina: "Day 66. Disco Earth 🪩 Sometimes a serious dataset is a good excuse for something playful, especially when the goal is material and motion rather than reference mapping. Built for #30DayMapChallenge 2023 (Day 11: Retro), this version takes real ETOPO1 relief and pushes it into a deliberately dated mirror-ball aesthetic. For Day 66, ETOPO1 becomes an equirectangular environment map driving both the background and reflections in a disco-style Earth built with Three.js and WebGL [...]," April 16 (LinkedIn)
FlowingData: Job turnover by occupation, April 16

Applications are open for…


Help us make this dispatch better! We’d love to hear which newsletters, blogs, or social media accounts we need to follow to learn about interesting projects, especially from less-covered parts of the world (Asia, South America, Africa). Write us at hello@datawrapper.de or leave a comment below. Want the Dispatch in your inbox every Tuesday? Sign up for our Blog Update newsletter!
Portrait of Michelle Otiji

Michelle Otiji (she/her) is a working student on Datawrapper’s communications team. She creates the Data Vis Dispatch to keep data visualization enthusiasts up to date on exciting new projects. Michelle studies interface design in Potsdam.

Sign up to our newsletters to get notified about everything new on our blog.