Ceren Dolma, freelance cartographer, will speak about mapping narratives with Datawrapper


Cartographer Ceren Dolma spoke at our Unwrapped conference about "Visualizing 'Place' with Datawrapper." If you're curious about our locator map feature, watching this talk is a great place to start.
Ceren Dolma was a self-employed cartographer and a data visualization designer at the time of her talk. Transitioning from a full-time consultancy role to being a freelancer, she was constantly working on learning new tools and stretching those tools’ capabilities to meet her projects' needs. She was a Datawrapper beginner and began using its cartographic features as a part of her 30-Day Map Challenge contributions in 2022 and 2023. Ceren is now part of the Datawrapper support team.
Watch her talk here:
02:30 – Inspiration: Google Maps vs Mrs. Dalloway
04:09 – Process: geojson.io and Datawrapperz
05:24 – The final map
07:20 – Q: Learning more about space vs place?
08:29 – Q: Why not use more advanced tools?
09:51 – Q: Preferred mode to go to the bar?
Full transcript
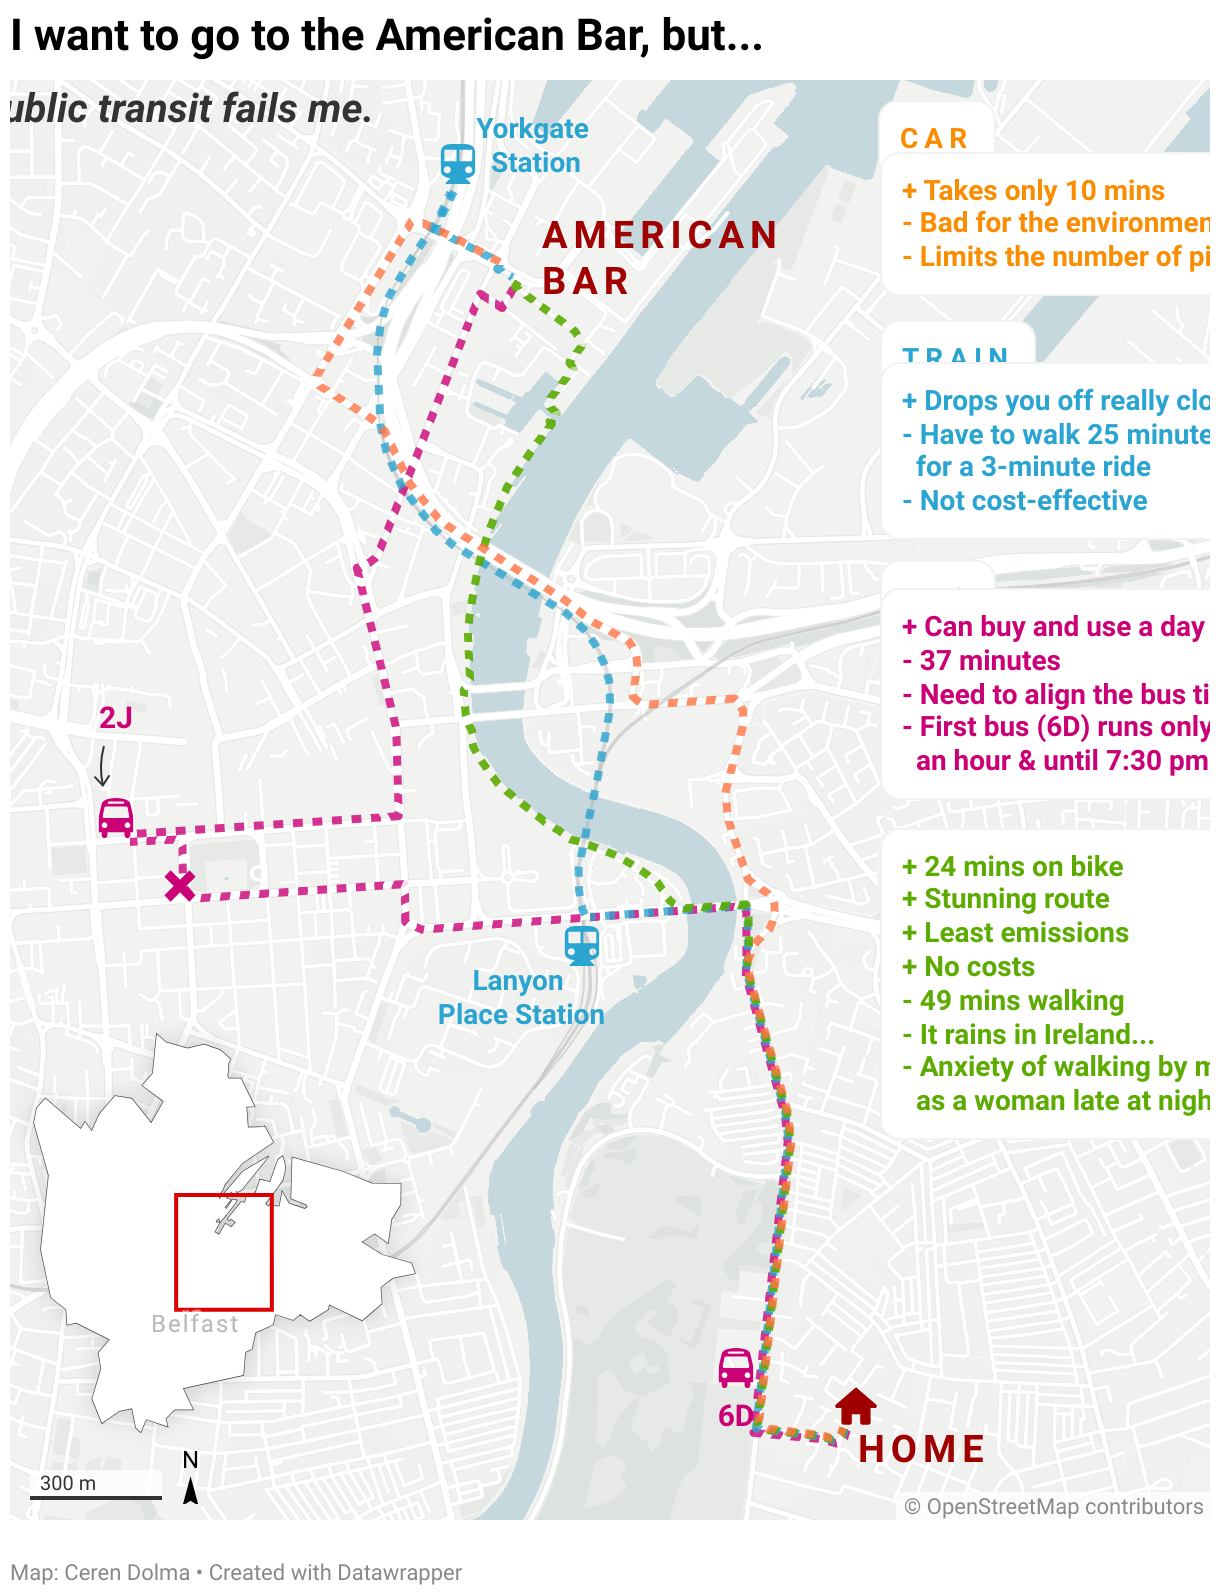
[00:00:04] Ceren: My name is Ceren and I'm a freelance cartographer and a data visualization designer. And today I'll talk about my experience of visualizing place with Datawrapper. And I'll do that by walking you through my process of creating this particular map titled, "I want to go to the American Bar, but public transit fails me".
American Bar is my favorite bar in Belfast, which is where I live. And we have a tricky public transit situation here. So I wanted to use this map to communicate all my frustrations and declare my love of this pub. And just to get everyone up to speed, this is the American Bar and what it looks like. If you're ever in town, I would absolutely recommend checking it out.
Space vs Place
[00:00:46] Ceren: Let's get into it. I'd like to first distinguish between what I mean when I say space and what I mean when I say place and why I chose to italicize and have that word larger in my title. When I'm talking about space, I am often talking about a location with clear X and Y coordinates. So space is measurable and it's functional.
It doesn't change depending on who you ask. An example of this could be: If we're talking about a hospital, the address of that hospital would be the space. You would be able to measure that, And you'd be able to use that to give people directions, or you could give relative directions to tell someone it's across the road from something else. And it will be the same, no matter who you ask.
Whereas when I say place, I am talking more about how we relate to those spaces. So our perception of place will often be informed by our feelings and experiences and identities. And they also vary. They depend who you ask. Because all of our feelings and experiences will be different, too.
For that same example of a hospital, your perception of it would change if you had a child there, or if you lost a loved one, or if you're a medical professional who started training there. Those kind of experiences refer to a place.
Another example of this I quite like is the question of where are you from and where's home for you. When we ask people where they're from, the answer you get is quite often a fact. It's on their passport, it's where their family is, or there's usually a documentation to go with it. Whereas when we ask someone where home is for them, that will be informed by our experiences and story. If you're interested in this distinction, I have a couple of sources listed at the bottom. Feel free to check them out.
Inspiration: Google Maps vs Mrs. Dalloway
[00:02:30] Ceren: Let's go back to visualizing place. So as Lisa mentioned, I was partaking in the 30-Day Map challenge this past November and the theme for day 7 was navigation. And I wanted to think about what navigation would look like from a space point of view and what it would look like from a place point of view.
And for space point of view, I came up with a screenshot on the right, which is what you get in Google where you put my former address. So don't worry, I'm not giving my home address there, and the directions to my favorite bar. So you get a lot of facts there. You get the time it takes, you get, traffic information, you will get different schedules and that won't change no matter who you ask.
But what I really wanted to get with this map is what does this look like from a place point of view? So why do I make the choices I make when I'm trying to get to this bar? And what are the factors that go into that decision and how could that be visualized in the map context? Around the same time, I think a little bit before actually, I came across this Datawrapper blog by Luc on Sounds and Paths crossing Mrs. Dalloway's London. Mrs. Dalloway's a book by Virginia Woolf. And when I saw this, I immediately thought that's actually a really good way to visualize place, because you get a lot of flexibility in terms of adding annotations to guide the reader through what are all these feelings and thoughts. And even sounds can be a part of that placial experience. And you can also play around with styling of these lines to add importance or choose certain colors to communicate certain feelings. So I was quite inspired by this map and Luc's process.
Process: geojson.io and Datawrapper
[00:04:09] Ceren: So the next thing I wanted to do is I wanted to create one of my own. So I went into Datawrapper and I started to create a locator map and I found all the answers to my questions when I toggled the import line and area markers. And I came across some documentation from Datawrapper on how to do the step by step. And also a link to a tool called geojson.io, which I'll talk a little bit more. But if you're interested in doing something like this, I would highly recommend going into geojson.io, which looks like this. You get a map and you get a side panel. And highlighted in red there is the line tool. You can click on that. And once you draw a line of your choosing over the base map, you get what that looks like in a geojson. And all you have to do after that is copy that information, stick it back into Datawrapper, and you have a line that you can stylize and annotate and use in a way that is suitable for your purpose. And that looks like this. So what I did with using that tool, I went in and drew all the different ways I could get from home to American Bar with a car, with a bike or walk, the train, and, the other one, I think, is bus, but this must have been my work in progress one.
The final map
[00:05:24] Ceren: And after I've done that, I ended up with this final map where I showed four different routes. The most important part of that was reflecting on all of these different routes and thinking about why I choose to take them and why not. And just a couple of examples of that is, for example, with the car, even though it's the quickest one, it doesn't quite make sense to go to a bar with a car because you have to think of getting back home. So not a desirable option.
With a train, from where I start, it's a one stop train ride, but you have to walk 25 minutes to get to that, which can be quite frustrating.
And with the bus, I was mainly complaining about infrequency of public transit in Belfast, where you sometimes have to wait a long period of time to connect two buses. So even though that could be a good option, the way things are, it currently isn't.
And bike and walk option is my absolute favorite, and there's a lovely little path through the river, so it's quite pleasant. But I do live in Ireland, so rain can be quite a frustrating factor that comes into my decision when I'm trying to get to the American Bar.
So what I did with this map after I had created it is I shared it on Twitter as a part of the challenge, and I was quite pleased to see that I wasn't the only person feeling this way. I had some recommendations to share this with my local councillors and bring their awareness to this issue, and I also found that some people felt quite similarly, so this is an issue that a lot of us are affected by and feel similarly about.
And with that, I hope that you have taken away two things from this talk. One is visualizing individual experience can be insightful and fun, and maybe that could be applicable in research and newsroom environments. And Datawrapper is a tool that you can use to do that with, using custom GeoJSONs and annotations within the locator maps. Thank you so much. Let me know if you have any questions.
Q: Learning more about space vs place?
[00:07:20] Lisa (host): Thank you so much, Ceren. That was super, super interesting. I think it was interesting that you made this distinction between the objective space and the subjective place. I don't think I've heard it before so clearly communicated. If I want to learn more about that or our attendees, where would be a good place to start?
[00:07:43] Ceren: I'd say that there is a book, I think it's called "Space and Place". I think it's straightforward. It's an older book by Yi-Fu Tuan. It's the one that I listed at the bottom of that slide, once these talks are live. That would be a really good starting point. I think he's one of the earliest authors to make that distinction.
But since then, I think it's a conversation that's been quite loud in the cartographic sphere, especially if you've heard of terms like counter mapping or mental mapping, There's a lot of interest in mapping things that are not so easy to map, so mapping relations, mapping senses, sounds, those sorts of things.
So I would say looking up those terms will lead to quite good sources.
Q: Why not use more advanced tools?
[00:08:29] Lisa (host): So interesting. I think I've actually done some mental mapping without knowing that it's called like that. So it's great to put like a name on that. That's good. And I guess, you're a trained cartographer, you know lots of map tools, I would say, like QGIS, maybe ArcGIS. These are more complicated tools for creating maps, but why did you choose Datawrapper for this map and not one of the more advanced mapping tools?
[00:09:00] Ceren: Yeah. I think one of the really good reasons is that like seeing Luc's map was, I think, one of the first things that triggered how I wanted to do this. I was like, there's a tool, it's possible how to do it.
But I think also in the context of 30-day-map challenge, it is a really fast paced challenge. So my priority there was creating something that I feel good about and proud of on a short term, but in quite a high pace. And I think with those slightly more complicated tools, that can take a bit longer. Another thing is: The range of choice you have with those tools is a curse and a blessing.
If I could sit there playing around with everything, I could spend way longer than I needed to, whereas with Datawrapper, like those restrictions were actually quite helpful in terms of getting something quickly that I feel good about.
Q: Preferred mode to go to the bar?
[00:09:51] Lisa (host): I see. Thanks. And I guess the last question I have, I'm not sure if you've mentioned that and I missed it, but what is actually now your preferred mode to go to the American Bar? What do you end up doing?
[00:10:03] Ceren: So I moved, but it actually didn't really make my life any easier. It's quite pretty similar. And that's the unfortunate thing. I love this bar, but it's so hard to get to. I often won't go to it unless I'm going from somewhere else. So I would quite often only go to it if I'm already in the city center and then I only need to take one bus. So it's a very serious problem.
[00:10:27] Lisa (host): Oh, I really hope they improve the public transport in Belfast. Thank you so much, Ceren. That was a great first talk of the day. Thank you.
We asked her some questions:
Ceren, what will you talk about?
When we look at a map to navigate ourselves from point A to point B, we all see the same visual. However, our experiences differ. When I wanted to create a counter-cartographic visualization of my own experience of navigating Belfast as a young immigrant woman, I came across many tools that Datawrapper offers or works in conjunction with to customize and fine-tune visualizations. In this talk, I will walk through the process of creating "I want to go to the American Bar, but… public transit fails me" using custom JSONs and annotations. My hope for this talk is to leave you curious to explore Datawrapper’s functionalities to tell your own experiences of place, and maybe even bring it to newsrooms, workplaces, or research groups.
Ceren: "As a cartographer who is very interested in counter-mapping (for those who haven’t heard the term before, I’d roughly define it as mapping against the status quo), I can’t go without mentioning this map about my experience of getting to my favorite bar. But I'll explain more about that in my talk!"
Why did you start using Datawrapper, and what has changed since then?
Initially, I started using Datawrapper out of personal curiosity to explore its mapmaking capabilities. Fairly quickly, I also started to use it as a data visualization tool because you can get clean and professional-looking visualizations really quickly, and there are very few barriers to entry. Nowadays, whether for a personal project or a work-related one, quite often I will start by throwing my data into Datawrapper and exploring what it looks like with preliminary visualizations. Sometimes I finish everything right there, without further tweaking and refining.
The range of choice you have with more complicated tools is a curse and a blessing. I could sit there playing around with everything and spend way longer than I needed to, whereas with Datawrapper, the restrictions are actually helpful in quickly getting something that I feel good about. Ceren Dolma, freelance cartographer, in minute 9:34 of her talk at Unwrapped 2024

Other times, when I might want to have more control, I might move it to other tools like R and Adobe Illustrator, though those tools have higher barriers to entry.
What's your guiding principle when working on data visualizations?
Typically, my aim when creating data visualizations is to tell a story or get a point across. Because of that aim, I always ask myself how the choices I am making support my intended message. This becomes an anchor when I'm deciding what type of chart to use, how many variables to include, how to visualize each of those variables, and more.
Another consideration I keep coming back to is the audience. How can I make sure, to the best of my ability, that the audience received my intended message? This becomes especially relevant when deciding whether to use more traditional approaches or experiment with different visualization techniques, or how much explanatory text is needed in order to assist the viewer.
What's your favorite Datawrapper feature?
My favorite Datawrapper feature is the ability to interact with and edit data during the upload process. Especially when working with global spatial data at a country level, it's common to have missing data from some countries, or the name of the country will be spelled slightly differently based on your data sources. Datawrapper is great at highlighting data that doesn’t match the countries in their basemaps and allows you to edit it right there at that moment, instead of having to go back and edit the source data.
We loved Ceren's talk at Unwrapped! You can find more about her on LinkedIn, X, and her website. To learn more about the conference and other great speakers, visit our blog.


