Phil Holm, Associated Press, about syncing your brand to Datawrapper


Phil Holm, lead creative for interactive news graphics at the Associated Press, spoke at our Unwrapped conference about "Syncing your brand to Datawrapper and custom style sheets."
Watch his talk here:
02:51 – Defining colors for the color picker
04:22 – Setting visual hierachies
05:57 – Locator maps colors in your brand's style
08:53 – Presents in locator maps
10:41 – Secondary themes
14:15 – Q: How long did it take?
15:17 – Q: Trickiest thing when implementing the style guide?
16:29 – Q: Advice for other organizations?
17:24 – Q: Reactions to the new theme?
Full transcript
[00:00:04] Phil Holm: Hi everyone! I'm Phil Holm. Thank you for joining today. I am the lead creative of interactive news at the Associated Press. Today, I'm going to talk about some of the essential reasons to leverage custom themes in Datawrapper.
I've created a few different custom Datawrapper themes for AP, and I'm here to talk about why taking the time to set up a theme is essential to your brand. I'm also going to touch on some of the points that I've learned along the way in the design process and show you one of our secondary theme types, which I believe you'll find quite useful, as well as some of our other theme variants that we've also applied.
There are many advantages to syncing your brand, and there's a lot to cover and I don't have a lot of time, so I just want to get right into it.
Why a custom theme?
[00:00:52] Phil Holm: Let's talk about some of the reasons why we want to go this way. First off, you might be wondering why this is so important or why, when Datawrapper's default theme already checks a lot of the boxes and looks really great, should I go custom? Why should I bother taking the time to implement a custom theme? Well, one of the main reasons, and I can't stress enough why doing so is so important, is that this really captures the essence of your brand. Whether AP's Datawrapper content lives on our own platform or someone else's, cross-pollinating our brand across Datawrapper's array of visualization options is essential in ensuring that to our readers, the content stands by AP's integrity, its non-biased values, and is always advancing the power of facts.
Custom themes ensure that your brand's voice resonates and is detectable wherever your audience chooses to consume your content. Custom themes can transform your Datawrapper embeds into a direct extension of your brand, reinforcing your distinct visual identity and brand recognition, which provides a trusted experience for your readers. A customized theme ensures that your brand's personality, values, and messaging are accurately conveyed through visuals, fostering a cohesive and memorable brand image. The consistency not only extends brand recall but it also contributes to a professional and overall polished experience, making your brand more appealing and recognizable to your target audience.
At the Associated Press, we strive to ensure that our data visualizations seamlessly complement our storytelling. A custom theme ensures your brand's voice resonates and is detectable where your audience chooses to consume your content.
Defining colors for the color picker
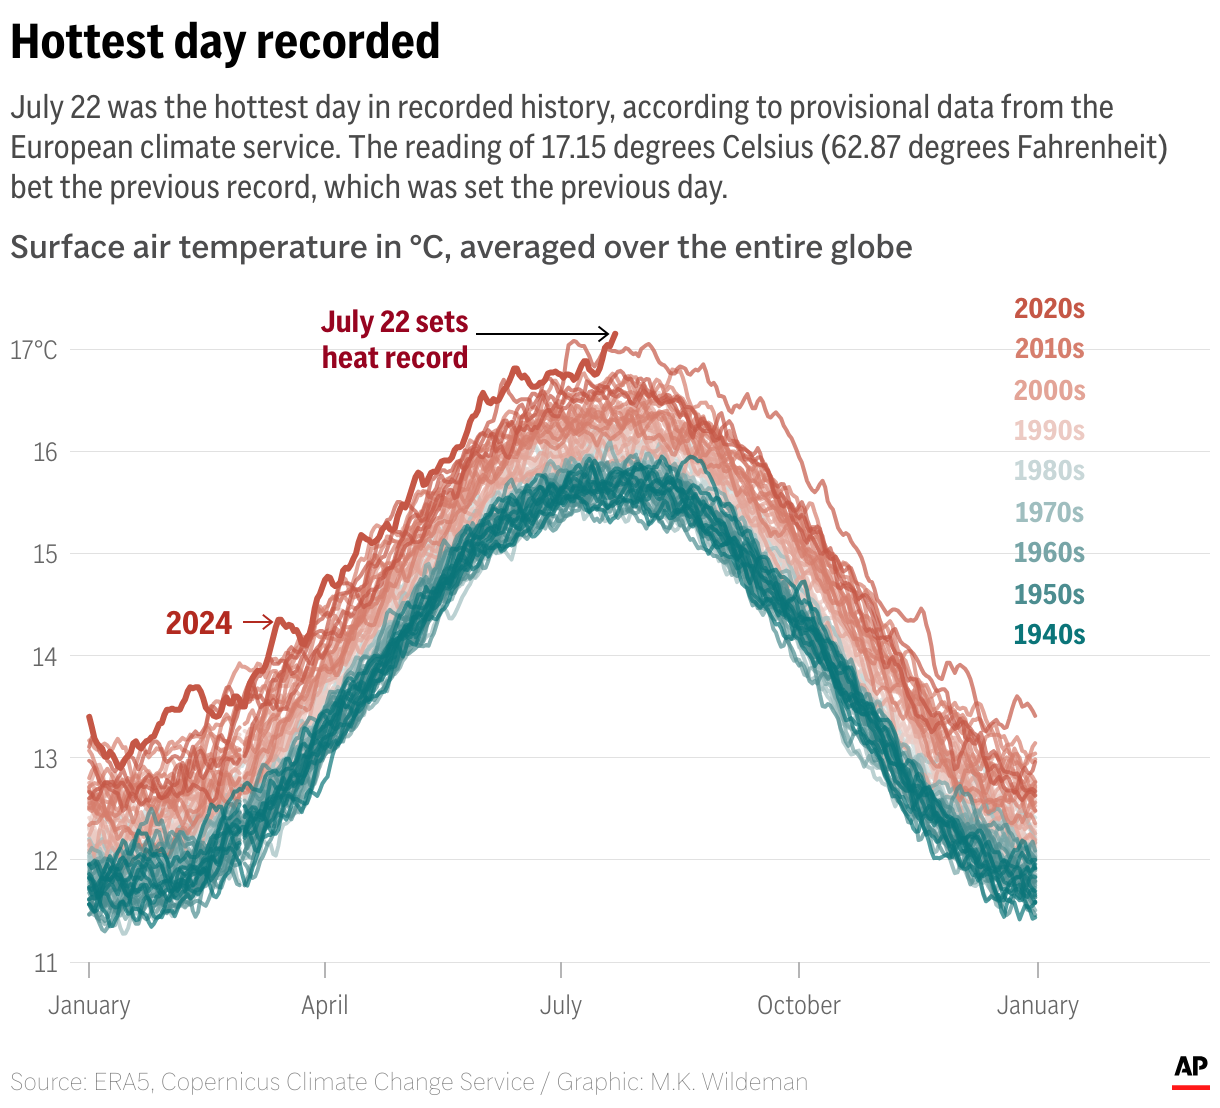
[00:02:49] Phil Holm: In 2023, the Associated Press relaunched its website with a more vibrant color palette and a bespoke font. Aligning all of our visual formats across the company rebrand was a significant undertaking and a high-priority objective that also included updating our Datawrapper style guide.
Getting our new colors into a document where I was going to work on the Datawrapper redesign seemed like a practical first step. So I included a complete visual reference of the new AP color palette. If you're working with a wide array of colors in your palette like I was, organizing them into meaningful color groupings for Datawrapper's color picker was a must.
You want to think of that more of a custom swatch panel that you've used in other creative software applications. You can also add things like predefined gradient ramps, which come in useful for choropleth mapping. In the color picker that was set up for AP, we chose the primary colors from the AP brand and gave them a top position in our color picker. It's just like the most used. And then I also created color bucket sets for our election coverage to ensure consistency and accuracy. You can organize your color group style in any way that suits your needs best.
Setting visual hierarchies
[00:04:20] Phil Holm: One other notable design choice we made, with color in general, was to only use true black in the main headers and the callout labels. Limiting the scope of black text establishes a visual tier of importance in our text elements. Other labels are various shades of gray to help the eye define what's most important, second most important, and so on. If we didn't establish this visual hierarchy, we run the risk of our labels and descriptions blending in too much with one another.
For example, our starter guide has a large bold black header paired with more condensed lighter shade description fields below it. This helps our headlines stand out. Just like the color palette, I made a visual cheat sheet of all our typography styles, which I used for reference throughout the redesign process.
All the hierarchy considerations are designed to let the visual data viz portion of the graphics steal the show. We believe data visualizations should pop off the page and contain just a few meaningful callouts around them that best guide the storytelling. To help with this, we've also toned down the appearance of things like our axis labels or horizontal gridlines. You will likely spend a lot of time getting your visual hierarchies just right, as this depends on your design goals.
Locator maps colors in your brand's style
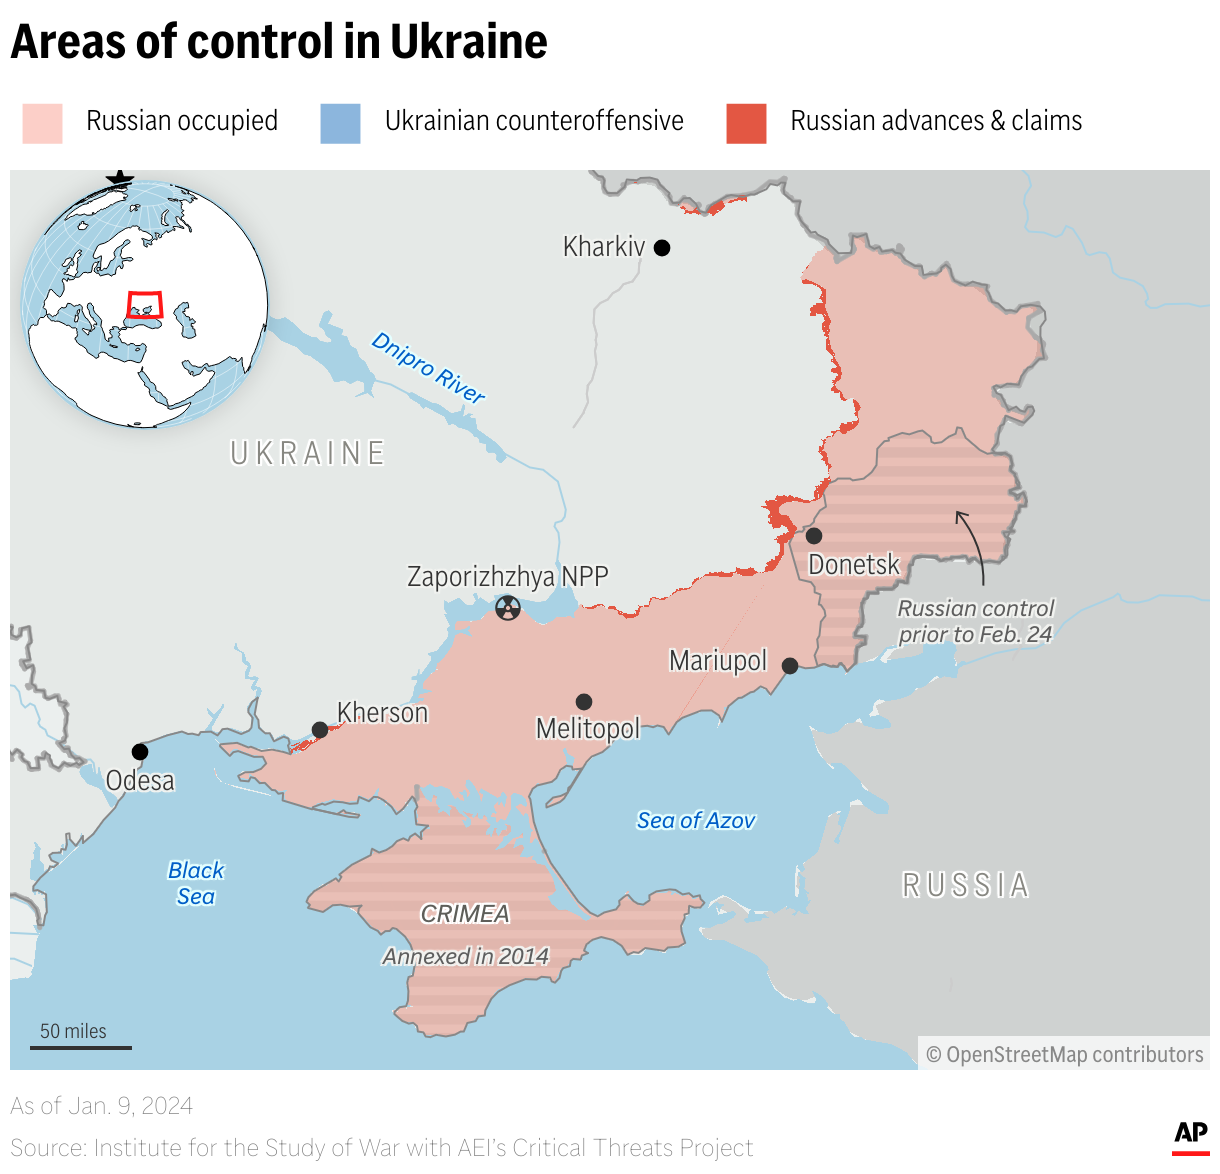
[00:05:55] Phil Holm: Now that I've talked a little bit about the essential setup, let's pivot into stitching your brands into mapping. With custom themes, your brand cohesion continues to flow into your mapping products. AP Locator Maps recently got a significant facelift with the emphasis of enhancing contrast in their appearance overall to better align with the bold new look of our website.
If you're starting out and creating a custom Datawrapper theme, or considering doing so, one of the areas you want to spend some time with is designing what your locator maps will look like at the various zoom extents. This is a fun challenge for designers. I started out with the country view perspective. And then worked down to the regional view, to the city, and then finished up at the neighborhood level. The country view is typically the easiest because it's much less geographic detail to design, but it's also one of the most important, as it sets the tone for what's to come as your users dive deeper into your maps.
If you zoom in a few levels, you'll see water, forest, and urban layers begin to emerge along with interstates and motorways. If you zoom in even closer, you'll see more detailed roads appear. along with parks, smaller waterways, and building structures.
Getting the label hierarchy set up was easy because I had this typography cheat sheet that I made. So you can go back and reference it, which I showed a few slides back. It ensures that you can stay on brand and make picking and choosing labels for your locator maps a much simpler task.
Another thing to consider when defining your map styles is to remember to color shift your stroke colors from dark to light, just past the regional view. Why do we do this? There's no mandatory rule that says we have to. However, for our map style, we saw advantages in having darker roadways at global and regional views so that the sense of population appears. Then we use lighter roadways at city and neighborhood levels to prevent maps from looking too noisy and to allow street labels to be easily seen. Your callout markers, text, and other annotations that you're going to be putting on the map, they become much easier to read with lighter streets at those levels. Our goal is to allow our reporting content to pop off. And be one of the first things your eye travels to, and not the underlying base map details.
Presents in locator maps
[00:08:51] Phil Holm: This is definitely one of my favorite features when constructing locator maps. The presets menu for locator maps is like a bookmark of all your geographic styles that you're able to set up. You set this up once and streamline your production process for making maps.
It ensures accuracy and brand alignment. It's a plus for your team as well. It makes them happier knowing that they don't have to fumble around with styling decisions on the fly. Especially when the newsroom is getting crazy. This relatively simple feature makes carrying content easier.
When designing your organization's theme, it's imperative to consider which marker styles and presets you're going to want to add for your team and workflow.
You want to check your data too. As I was working through the process, there was a bit of iteration going back and forth. It's important to test your theme and you're likely going to have a little bit of iteration involved to get it just right. Street data can be messy. It definitely pays to spot-check various areas of the world to ensure all your road data is showing up as intended. With a few rounds of trial and error on my end, I'm happy to say that the Golden Gate Bridge has returned in our map styles, as it was missing along with a few other road networks around it in earlier stages of our development.
So that wraps up some of the mapping and charting best practices and best uses for applying your themes and creating themes.
Secondary themes
[00:10:39] Phil Holm: I want to pivot a little bit now and talk about something we've been using for a while. What other ways can we leverage the themes?
We examined the possibility of getting these up and looking good on places like Instagram, Facebook, and Twitter, or X. So we started exploring the options for a social media theme. At first, we defined... And this is the interface of what our themes look like. We have various layout options for all the themes that we have created at the AP. You can see in the dropdown menu that there are quite a few. We started to look at the different canvas sizes that these platforms are using to display their content.
We started out by defining what those sizes are, using that as a canvas size in Datawrapper. Then we began tweaking things. We began enlarging font sizes or increasing the margins around the graphics. We made our AP logo larger. Things that are imperative when you're flipping through your phone, and the content comes across your eyes so fast, you want to try and have an object that stands out. Definitely capturing with a big, bold headline, and using bright colors, to capture the audience, are some tips for that.
This theme concept, though, does come with some limitations. Locking in a canvas size is not conducive to every chart type. This theme works best when the height of the graphics is not dependent on the data. However, when the requirements are met, the social theme easily scales our content out to audiences on different platforms, which is what we're looking to do — get our stuff out to as many people as possible.
In addition to this social media theme, we have another series of breakout themes. We have one for partnerships. If you're an organization working with the AP, like we have in the past, collaborating with folks on stories in series that are longer-term and require some brand representation for the stakeholders involved in those projects. These typically incorporate different company brand colors or combine logos, using those in the credits. Simple switches that tailor the content for the purpose of your partnership.
We also have a dedicated theme for darker backgrounds. This is for when special AP presentations use black backgrounds for story pages. It has proven pretty useful in some of our biggest stories.
That's all I have for right now in terms of how to put forth the best custom theme. If you don't currently have a custom Datawrapper theme or have been considering one, I hope you can see some of the added benefits of syncing your brand to Datawrapper and the potential that it unlocks for your organization.
Yeah, so with that, just thank you for listening in, and I can take any questions now that you might have.
Q: How long did it take?
[00:14:13] Elliot (host): Thanks so much, Phil, for a really great talk. The whole custom theme and multiple themes that you did for Datawrapper seem like a huge undertaking. Can you give us a sense of how long that took to define those styles?
[00:14:34] Phil Holm: The first time we did this, this was kind of a new space. It took a little bit of time to set up and test out. But as I did it more and enhanced it a little bit more, it took, I don't know, a couple of weeks to go back and forth, mixing it up with the day-to-day tasks I also have to be responsible for, and doing this on the side. It took a couple of weeks. I think the last redesign brand that I did with you guys, we started in December, and that was through the holidays too. It was pretty much done by mid to end of January.
Q: Trickiest thing when implementing the style guide?
[00:15:16] Elliot (host): Cool. I'm curious because I know that all style guides, especially ones as detailed as the APs, tend to have their quirks. So I'm curious what the kind of trickiest thing you found when implementing it.
[00:15:29] Phil Holm: The trickiest thing was just making sure that people listen and apply the right presets and making sure that our staff is using it as intended. The execution of it in practice can be tricky. But with a little run-through and some familiarity with what our graphics need to look like, everyone picks it up pretty quickly. In terms of our development standpoint, the trickiest part definitely is the roads. Getting the roads and the geographic for locator maps was...I kind of want to hit that sweet spot, so I looked around for inspiration from other maps that I found online and thought, okay, they're doing this and they're doing that. I think we can improve on both of those areas and put forth our own suggestions and ideas. I spent most of the time working on getting the roads just right.
Q: Advice for other organizations?
[00:16:28] Elliot (host): I'm curious if you have any advice for organizations looking to implement their own custom theme in Datawrapper, but they don't necessarily have this detailed style guide already like the AP does.
[00:16:44] Phil Holm: Definitely come up with a mood board or some kind of brand assets. You don't have to make it super detailed to make it successful. Some of the most successful graphics are very simple. Consider what your design goals are. What are you trying to build? Everyone's projects and goals might not be the same. My advice there would be to do what you feel is best. That's always the right path forward.
Q: Reactions to the new theme?
[00:17:22] Elliot (host): I'm curious. Within the AP, when you showed them the Datawrapper theme that you've been working on, what kind of reaction did you get?
[00:17:33] Phil Holm: Oh, everyone loved the... So we got a new font last year too. We have a new bespoke font that we've included in our new Datawrapper theme. Not only did the color palette change, but everything changed last year. We launched a new website, a new color palette, and a new font. So everything kind of changed, so when folks saw it, they said, "Oh my gosh, it's so much more high contrast. It's bolder." They liked the really bold color palette and the more bold fonts. Bringing that into locator maps was the most visible change. I think folks were really pleased to see the improvements there. Originally, the biggest improvement was that we had very washed-out road layers. Admittedly, that was my fault. So I spent a lot of time getting it right this time, making sure it was very eye-pleasing. I think folks were responding really positively to that.
[00:18:35] Elliot (host): This is a little bit off topic, but, something I was wondering. You've spent 20 years at the AP. What kind of charting tools and approaches to charting have you seen come and go over those 20 years?
[00:18:48] Phil Holm: Oh my god. Wow. Okay, yeah. I can go back in time and talk about Macromedia and things like that if I have to. Charting, that's where we started in Freehand a long time ago. I did a lot of print work when I first started. We did a lot of graphics for print and pivoted to Illustrator rather early on. A lot of that stuff was produced there. We experimented with building our own chart builders and things like that. Newer tools come around and they're just easier to maintain. It's hard to maintain and keep things up to date on your own and still do all the reporting and the data visualization work itself and the storytelling aspects, working with other editors. So taking that burden off of us and looking out to other tools. We worked in Flash, did some D3 or Net, and now we're leaning on tools that do this for us in a clean and well-packaged way. It's getting easier and easier. It makes our jobs super easy, but it takes the weight off of us for having to produce these things so we can focus more on our storytelling and narratives and really produce higher quality content. The repetitive parts of the process are being removed for us with these really nice tools.
[00:20:25] Elliot (host): Great. I think we're ready to introduce our next speaker, but thanks so much, Phil. Really appreciate you being here.
[00:20:32] Phil Holm: Thanks, guys. Appreciate it.
We asked Phil a few questions before his talk:
Phil, what will you talk about?
Come set up a style guide with me! I run through some of the things I’ve learned and the design considerations I’ve made when defining several Datawrapper style sheets for the Associated Press (AP). I’ll touch on everything from why you should have a custom theme, to some design best practices in applying font styles and colors, as well as some types of custom themes you may not have realized you actually need.
How did you start using Datawrapper at the AP?
I’ve been with the AP and held multiple roles in news graphics production for over 20 years. I’ve conquered visualization challenges from natural disasters to crisis events to elections and everything in between. Several years ago, I needed to solve a production blocker in our group – there was too much graphic output demand for what could be supplied in a timely manner. So I did something we’ve all done at some point: I frantically began googling for help! Lo and behold, I stumbled across a Datawrapper Academy article, which then exposed me to the world of Datawrapper.
Now we're leaning on tools that do this for us in a clean and well-packaged way. It's getting easier and easier [...], it takes the weight off of us for having to produce these things, so we can focus more on our storytelling and narratives and really produce higher quality content. The repetitive parts of the process are being removed for us with these really nice tools. Phil Holm, Associated Press, in minute 20:00 of his talk at Unwrapped
I quickly realized that my concerns about production demand were soon to be solved; I just needed to convince those who controlled the budgets. It was an easy sell following our proof of concept trial run. We soon signed on as a customer and designed our custom chart and mapping themes, all with AP branding, and trained our staff on how to create content using Datawrapper. And just in time, too, as Datawrapper at AP got its first true test during the 2020 global pandemic.
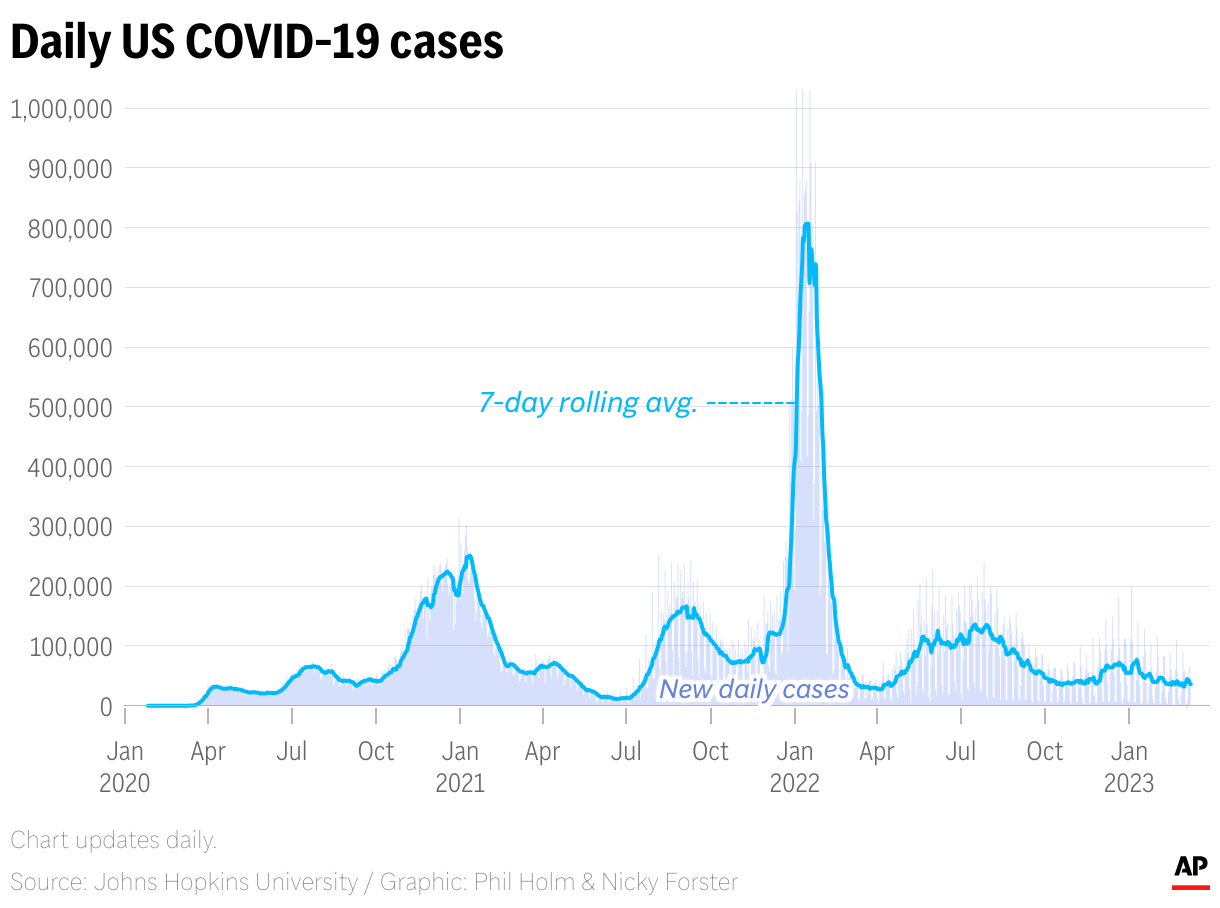
Honestly, without Datawrapper, our interactive coverage of the pandemic would not have been as well-rounded and complete. The speed at which coronavirus narratives began to form around the story was quite intense. At one point, it felt like every week, there was a new angle of data to explore – from outbreaks and surges in cases and deaths to vaccination rates and the global impact of shutdowns. It’s safe to say we gave Datawrapper a true test of strength from the onset of AP’s adoption of the tool.
How has it been integrating Datawrapper into your organization's workflow?
The technical setup of integrating Datawrapper into our workflow was relatively simple, as was the implementation of our style sheets, thanks to design applications like Figma. Shout out to the talented team at Datawrapper for making that effort essentially effortless! We initially had a minor snag getting embeds to play nice on our older and now retired AP News website. AP’s new site, which launched last June, thrives with embeddable content and the issues of yesteryear are gone.
Following the technical integration, the next step was getting AP staff integrated. This required creating documentation for staff to refer to as they became accustomed to Datawrapper. We also leaned on the immense catalog of tutorials and guides at Datawrapper Academy. Team members quickly praised Datawrapper’s ease of use and ability to work with live data, customize text fields with HTML, and import GeoJSON data layers in locator maps. As with anything, though, you get out what you put in. If someone someone spends time learning about the features of Datawrapper, well, that really shows in their work.
What's your favorite Datawrapper feature?
I’m so glad you asked. Because I have so many favorite features it’s quite the challenge to choose just one! We love the option to hide/show labels only on desktop or mobile. It allows us to create labels specifically for either – maybe the size needs to be different on desktop or the positioning must be aligned in a certain way to make things fit. I know this is a relatively simple feature, but it’s one that we use quite a bit and helps us create mobile visualizations that are not a watered down version of their desktop counterparts.
My response would be amiss if I didn’t mention the built-in color deficiency contrast checks! We at AP strive to make our products fully accessible for everyone, and we’re doing more and more every day to fulfill that mission. Having these checks in place helps alert our staff to immediate conflicts which need to be addressed.
We loved Phil's talk at Unwrapped! You can find more about him on LinkedIn or X. To learn more about Unwrapped and hear other great speakers, visit our blog.


