Data Vis Dispatch, July 15: "Big Beautiful Bill," extreme weather, and other challenges


Welcome back to the 201st edition of Data Vis Dispatch! Every week, we’ll be publishing a collection of the best small and large data visualizations we find, especially from news organizations — to celebrate data journalism, data visualization, simple charts, elaborate maps, and their creators.
Last week we mentioned that Dispatch fans could look forward to a few cool new features in the coming weeks, and the first one is already here! Check out the table of contents for an overview of topics in this week's post — or click your favorite section to jump there directly.
Recurring topics this week include the Big Beautiful Bill, extreme weather, and other challenges.
Since we were busy last week celebrating the 200th Dispatch and spilling the tea on what goes into making one, this will be a rare double edition where we look at great data vis created in the past two weeks.
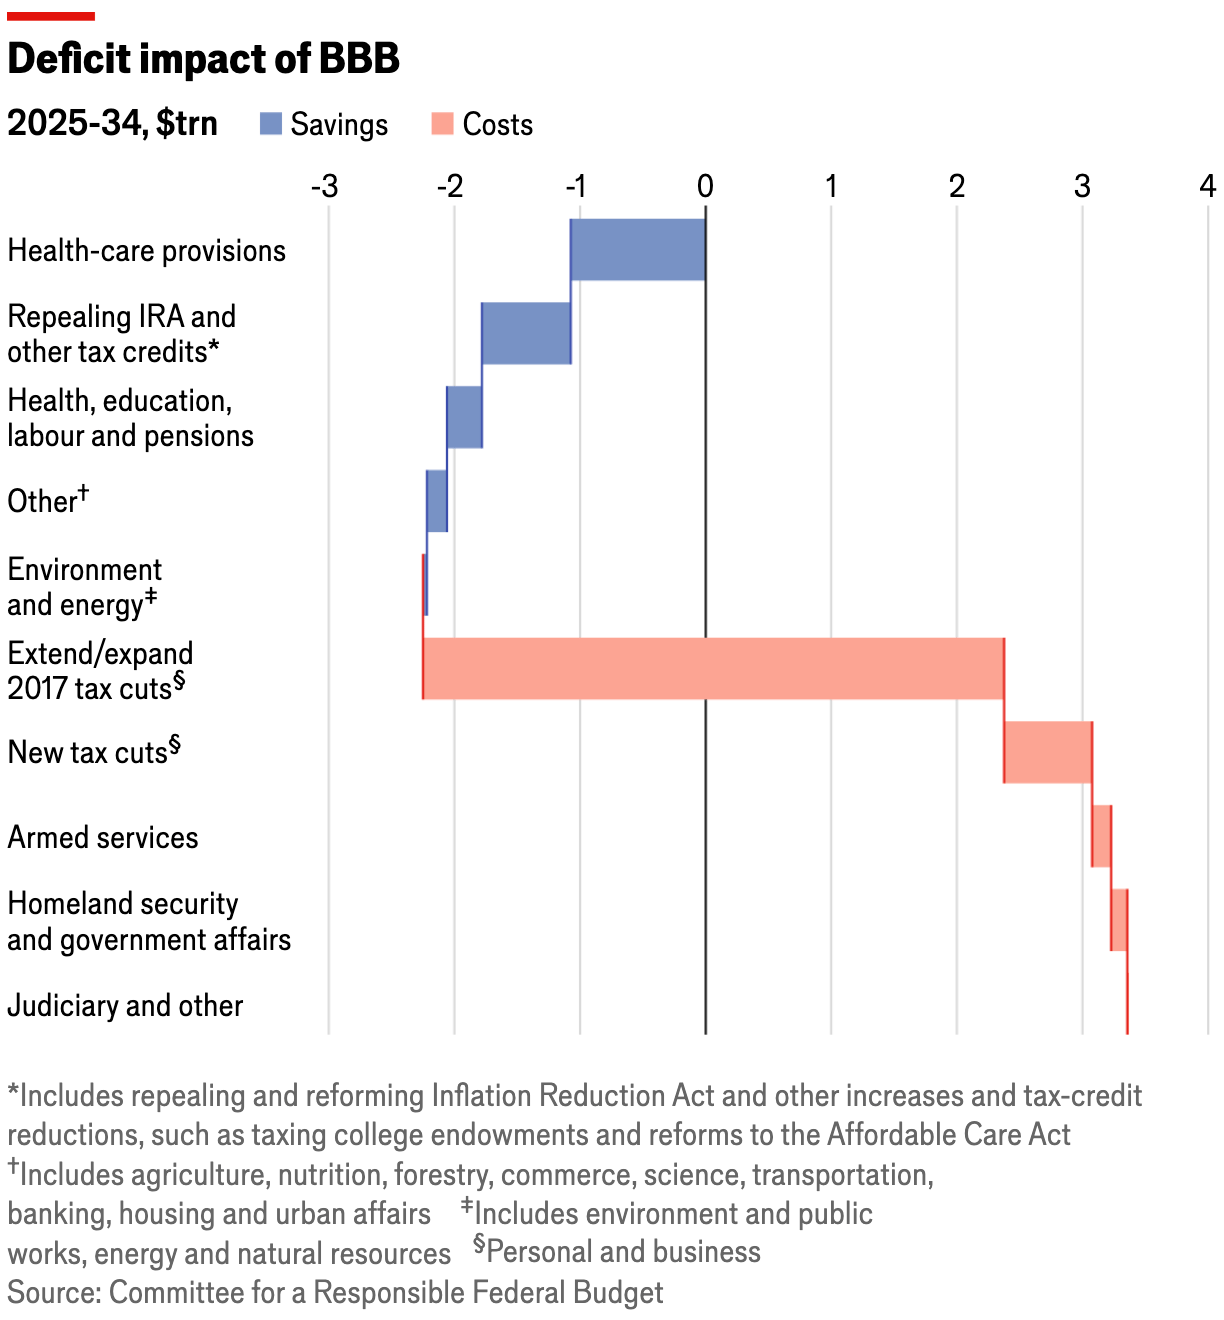
That's why our first topic is the Big Beautiful Bill, a controversial package of laws signed by U.S. President Trump on July 4, and its consequences:

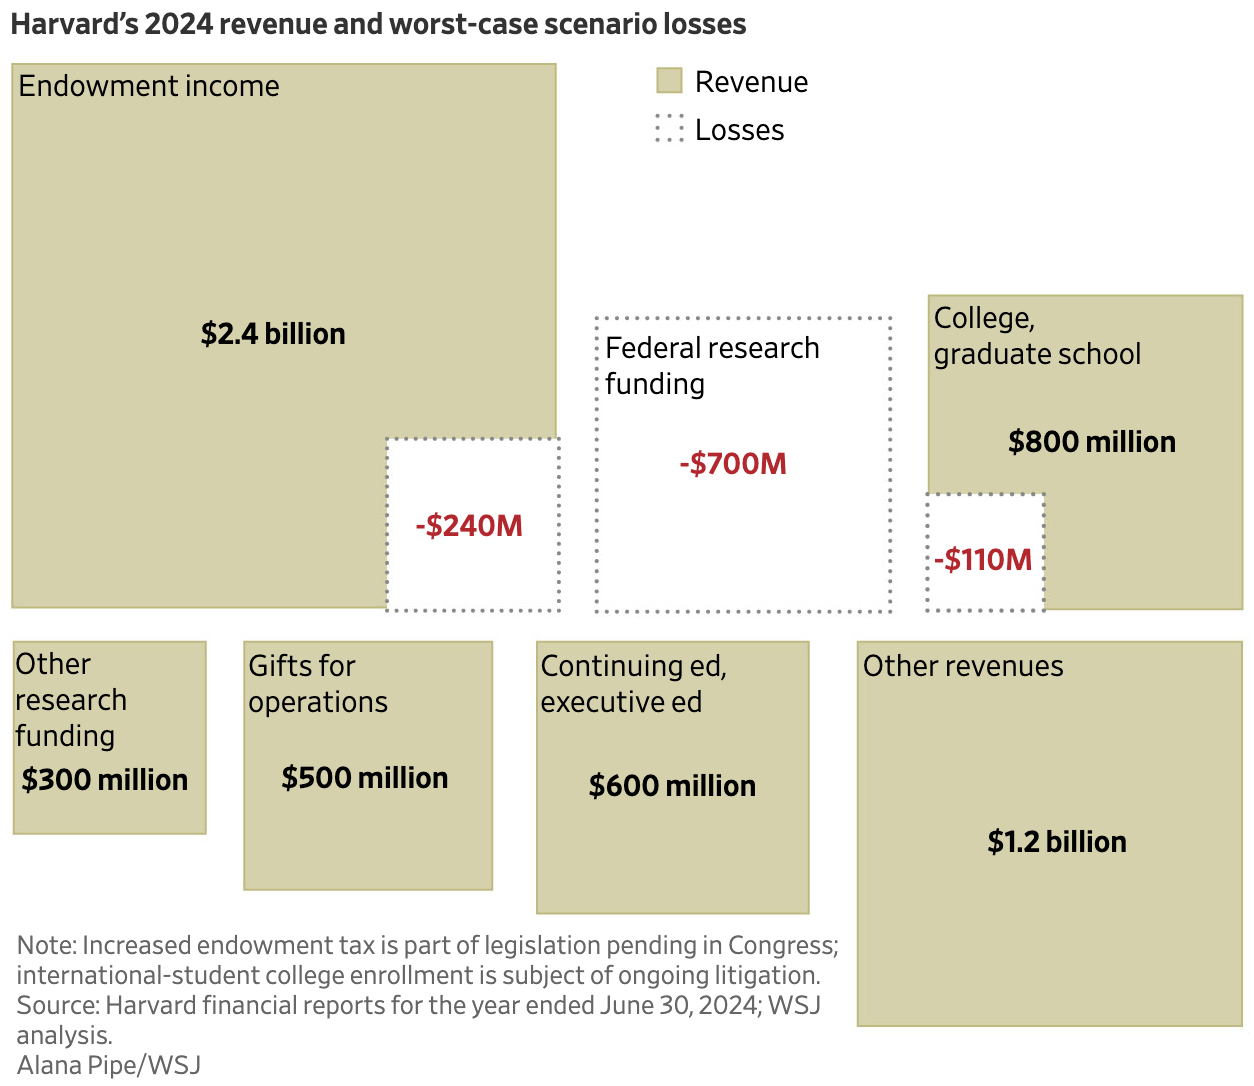
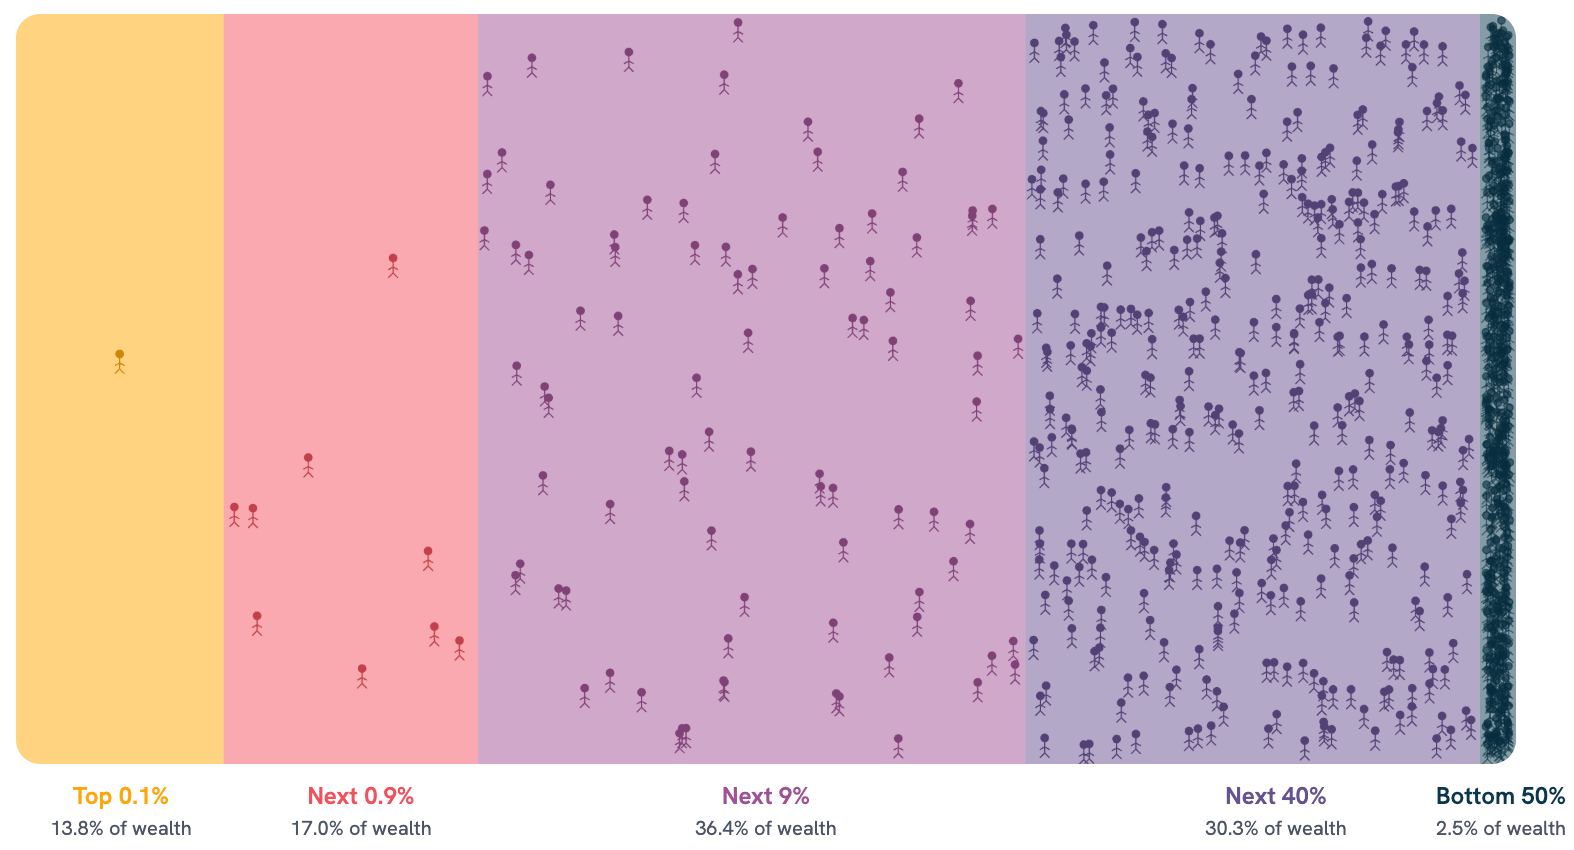
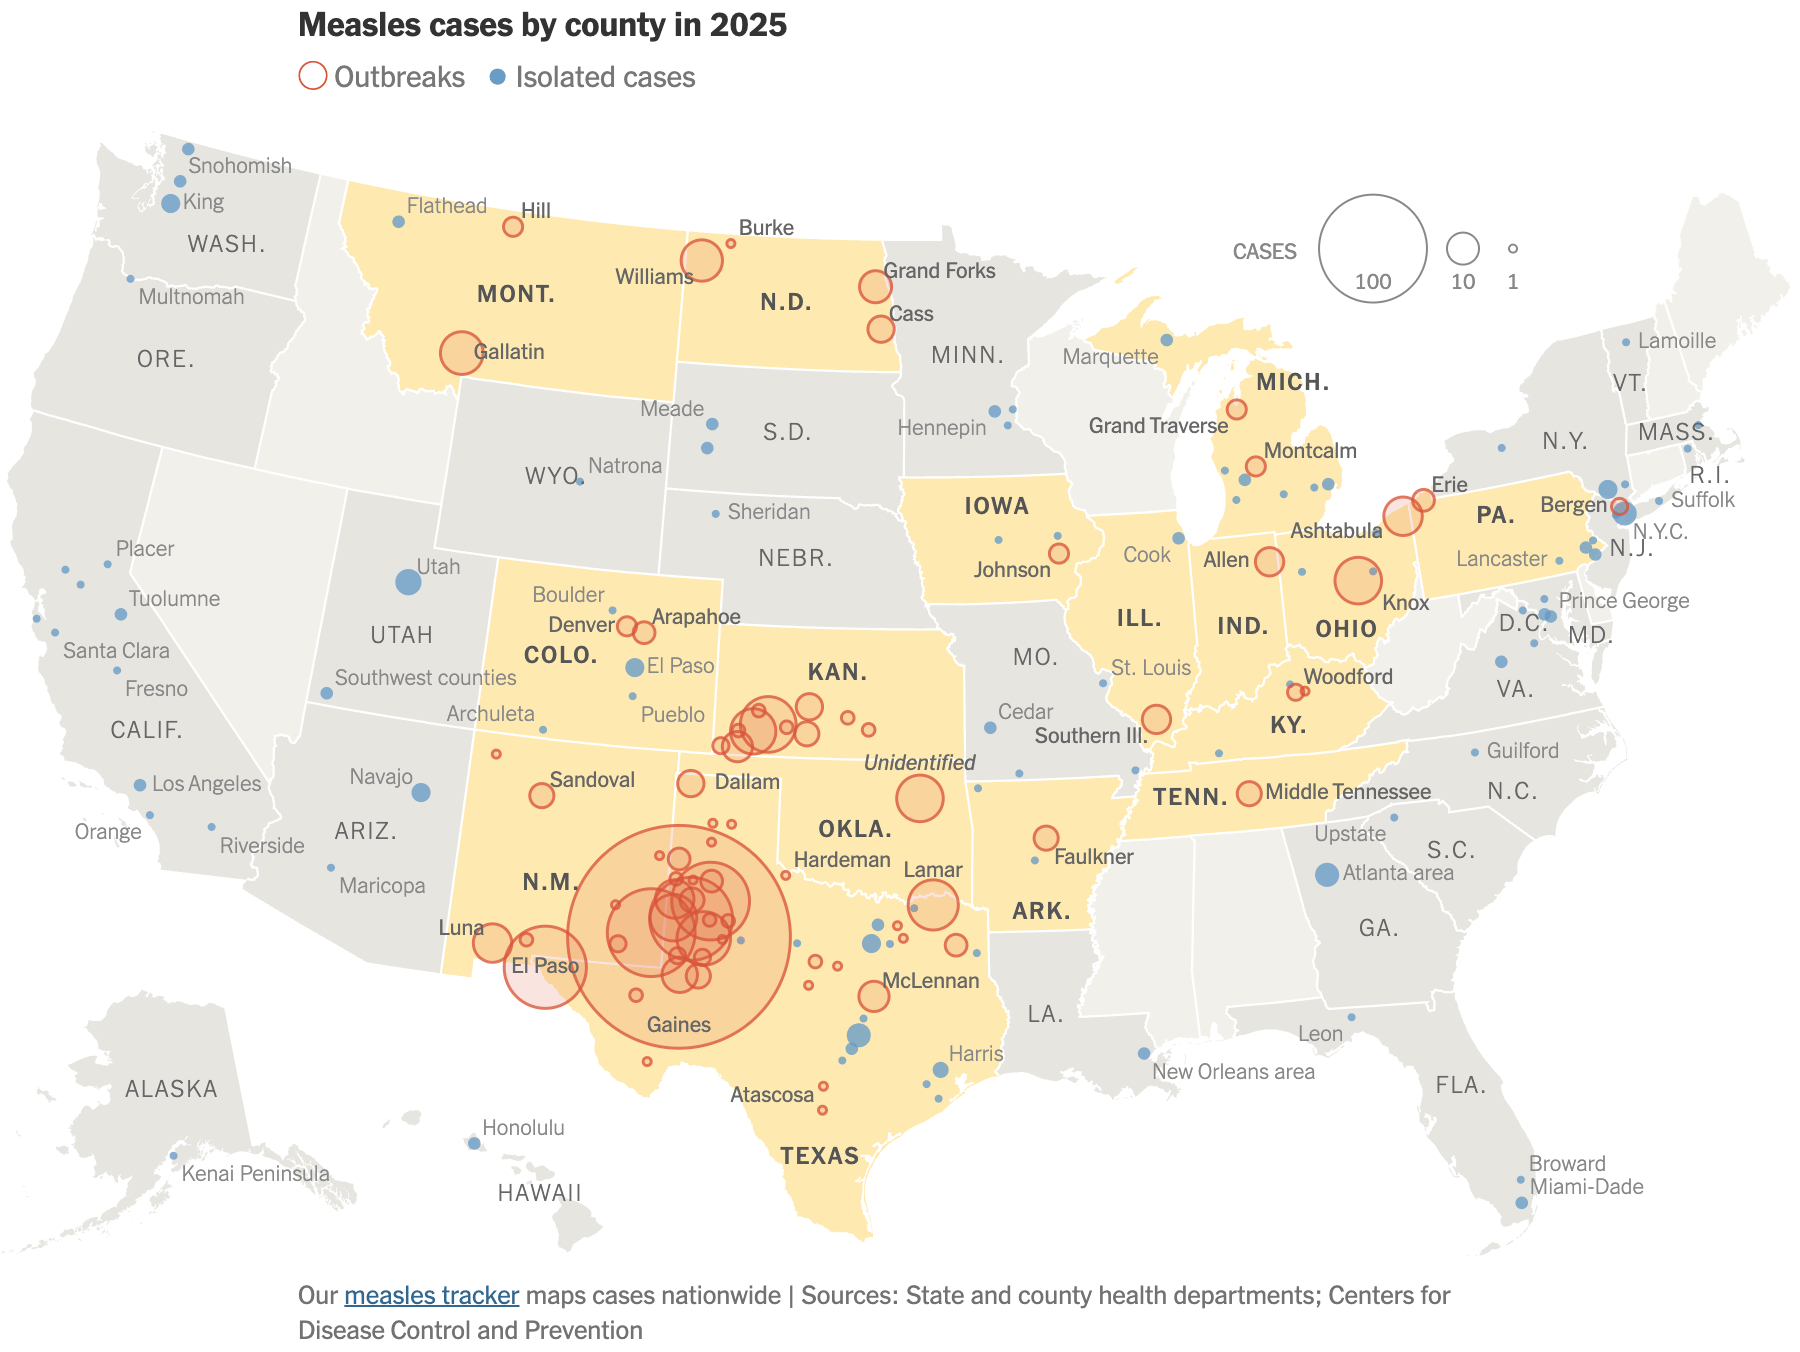
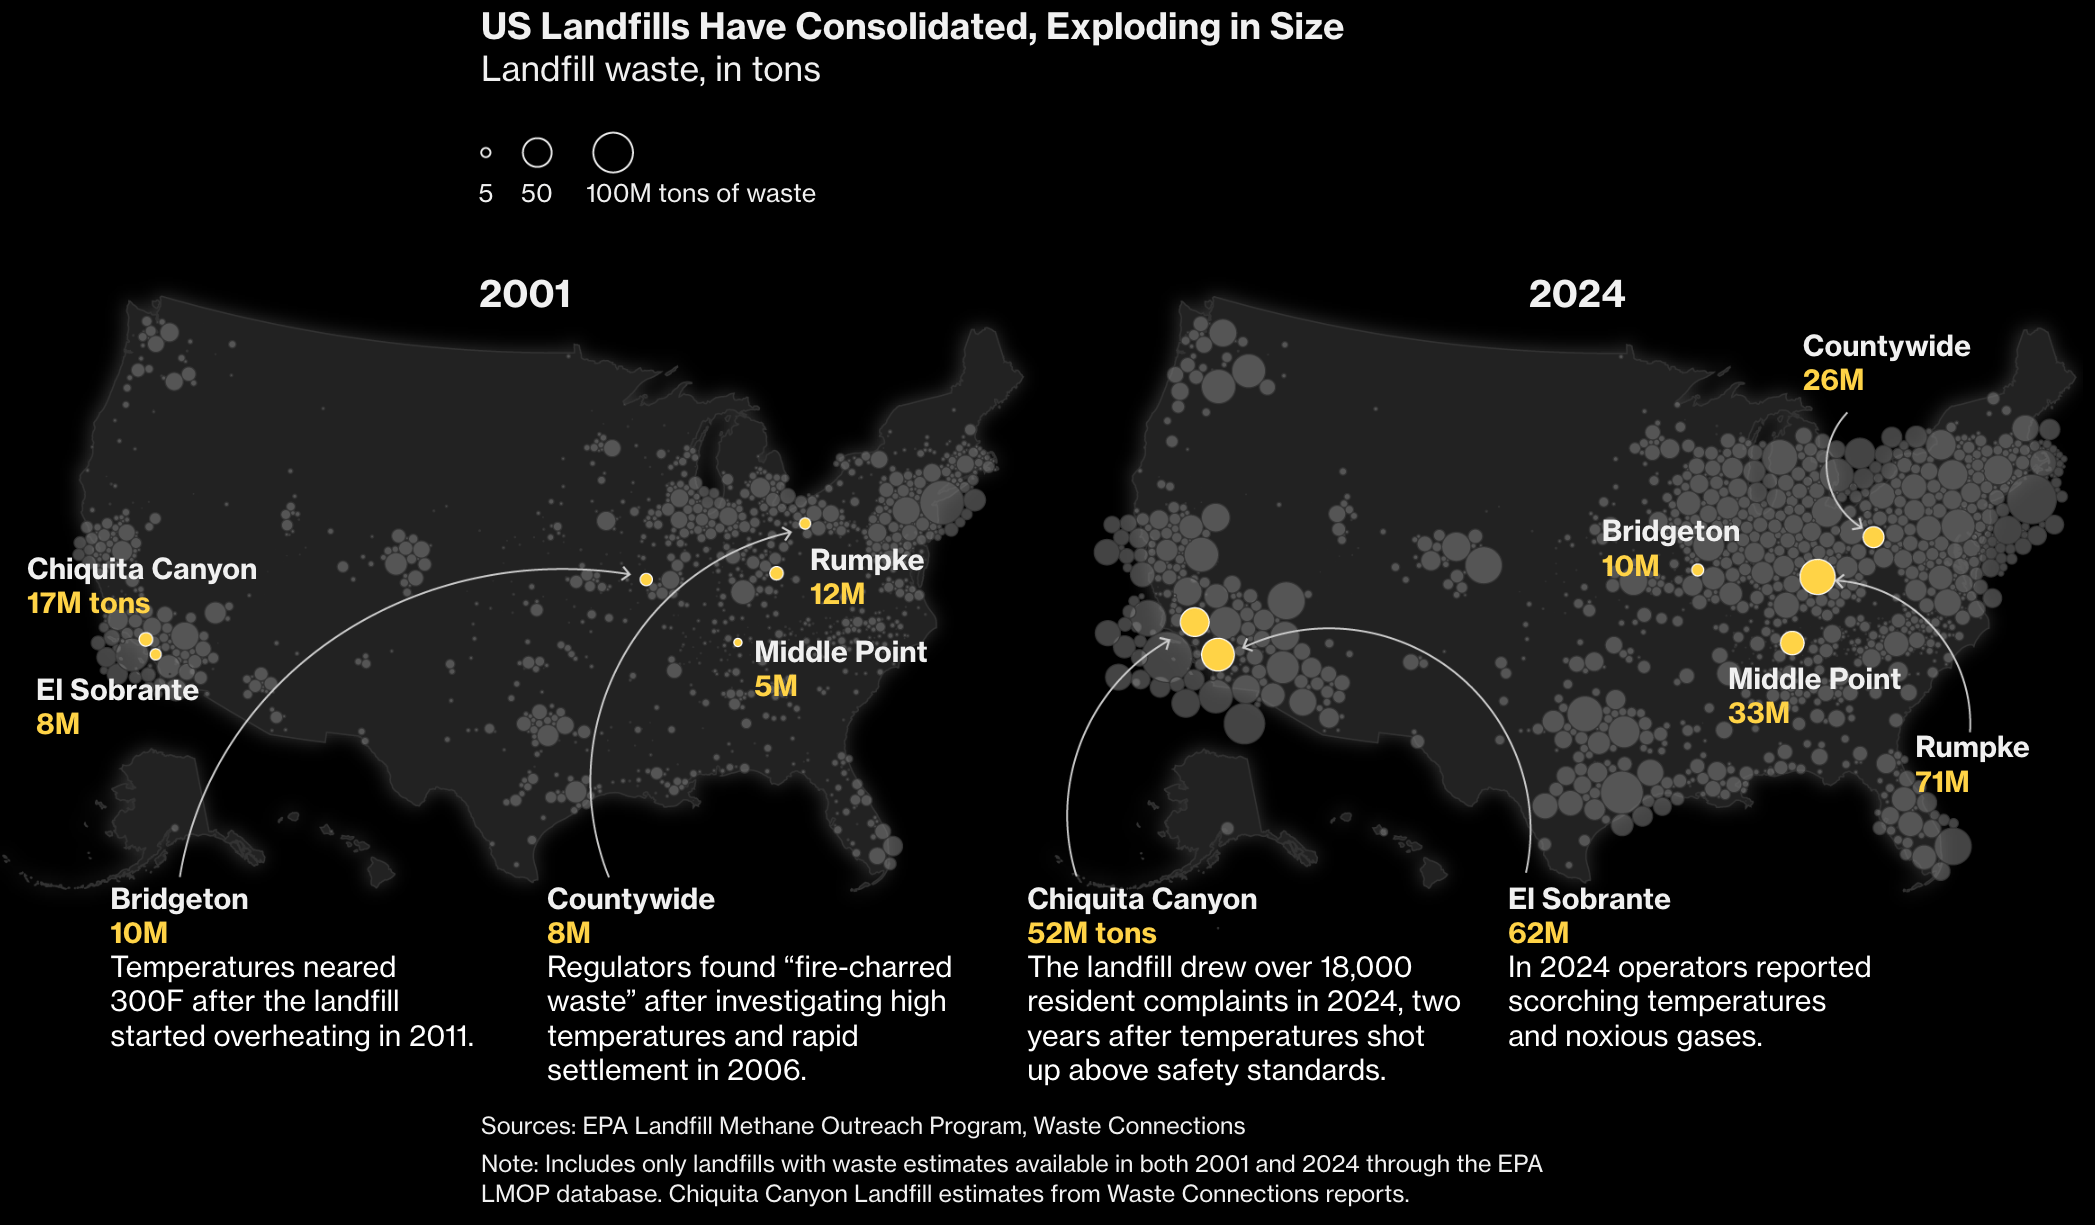
While Harvard University is looking at major budget cuts, people in the U.S. are facing a number of other challenges, including wealth inequality, measles, and massive landfills:
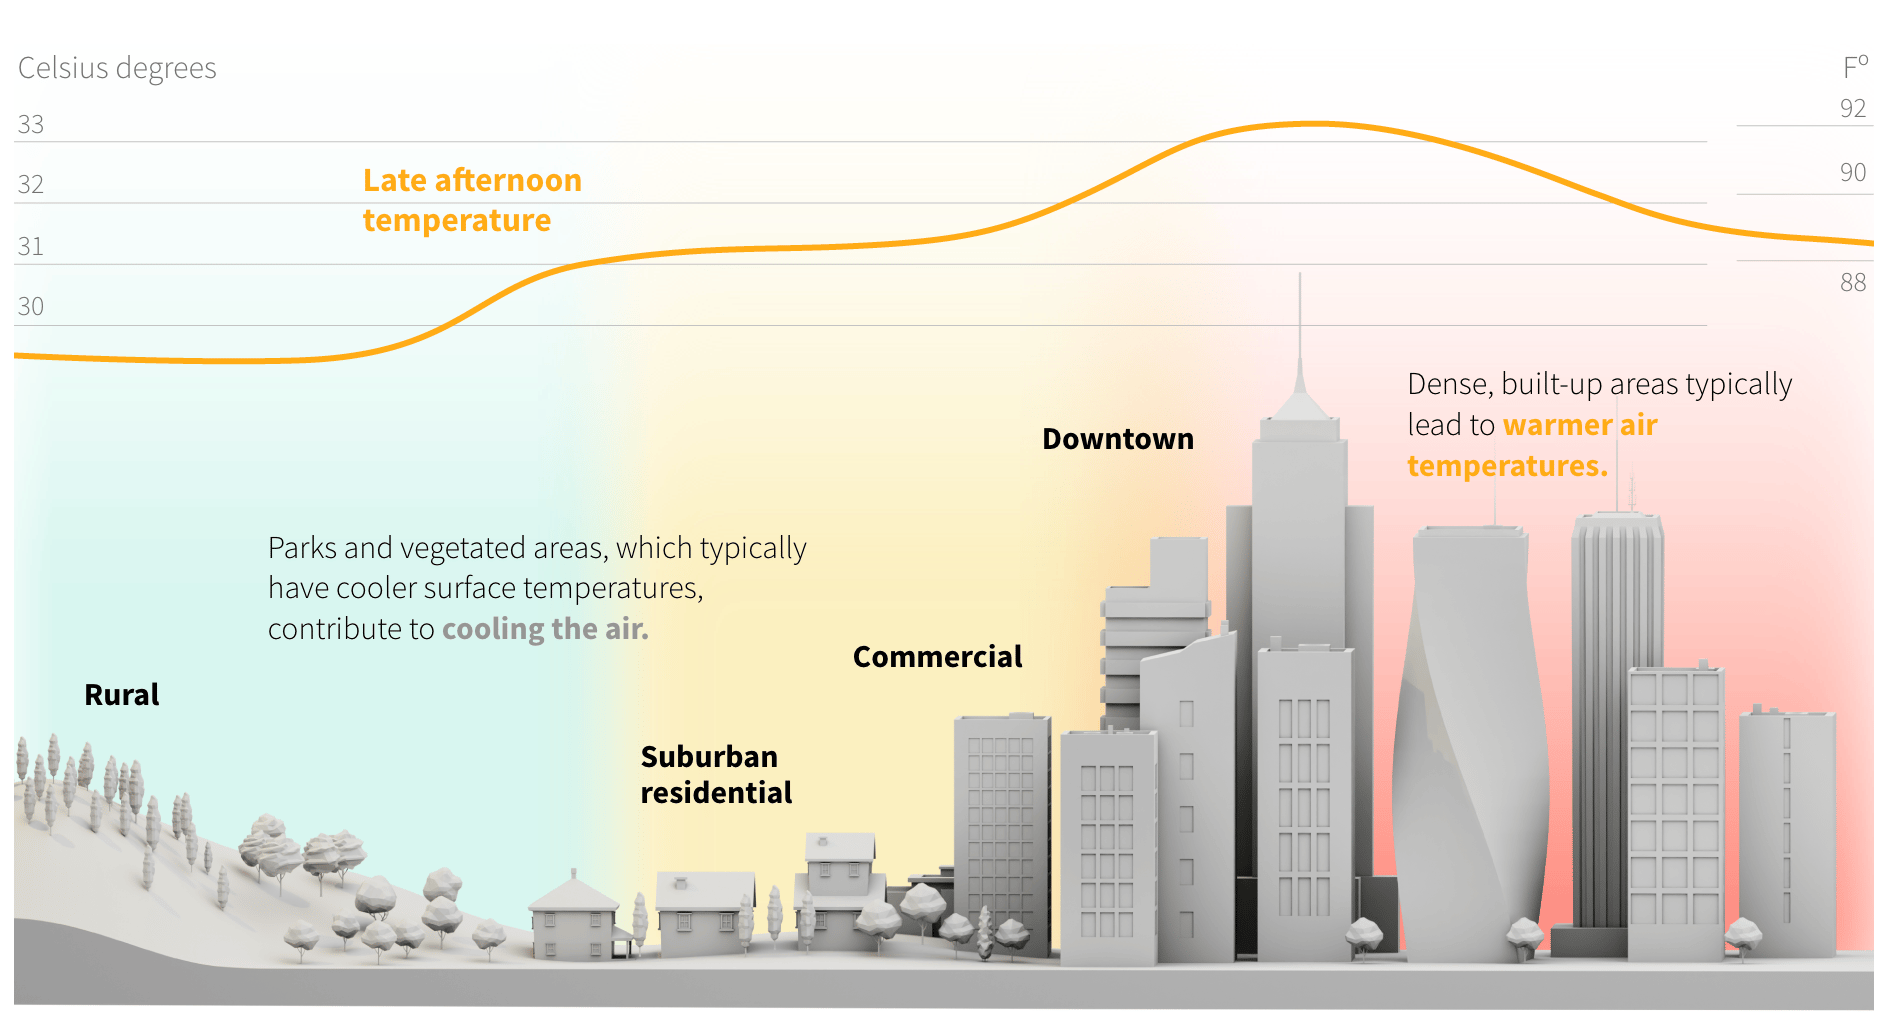
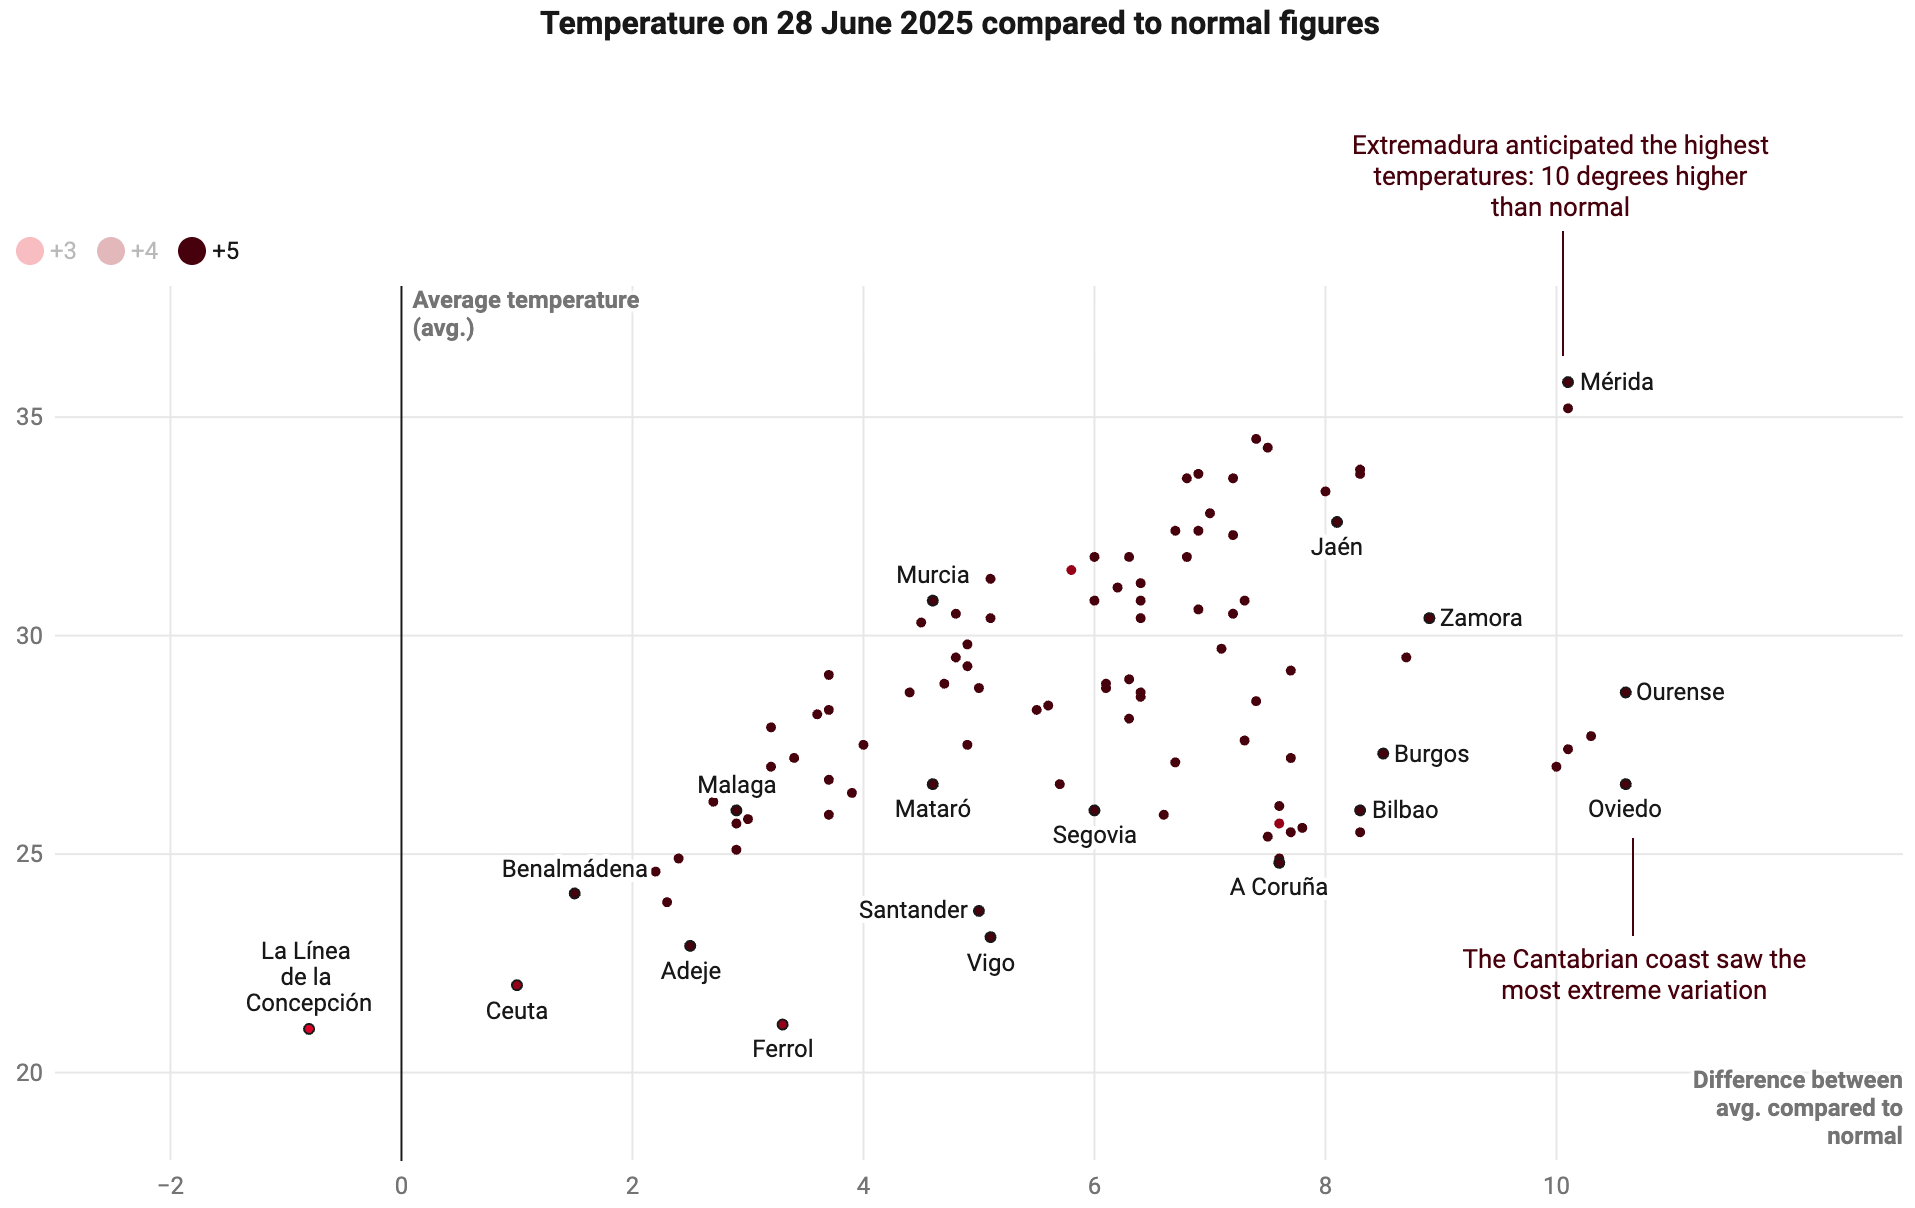
It wouldn't be a summer edition without a mention of extreme weather. This time, we have a map and two charts, looking at high temperatures in Europe and in rural vs. urban areas:
![Die Zeit: <a href="https://www.zeit.de/wissen/2025-07/hitze-europa-hoechsttemperaturen-vergleich-daten?freebie=0136142c"><strong>Hier ist die Hitze am extremsten</strong></a> [<em>Here's where the heat is most extreme</em>], July 2](https://datawrapper.de/cdn-cgi/image/quality=85,width=1499,f=auto,fit=cover/https://kirby.datawrapper.de/media/pages/blog/data-vis-dispatch-july-15-2025/47970ac37b-1752577975/cleanshot-2025-07-15-at-13.12.08@2x.png)
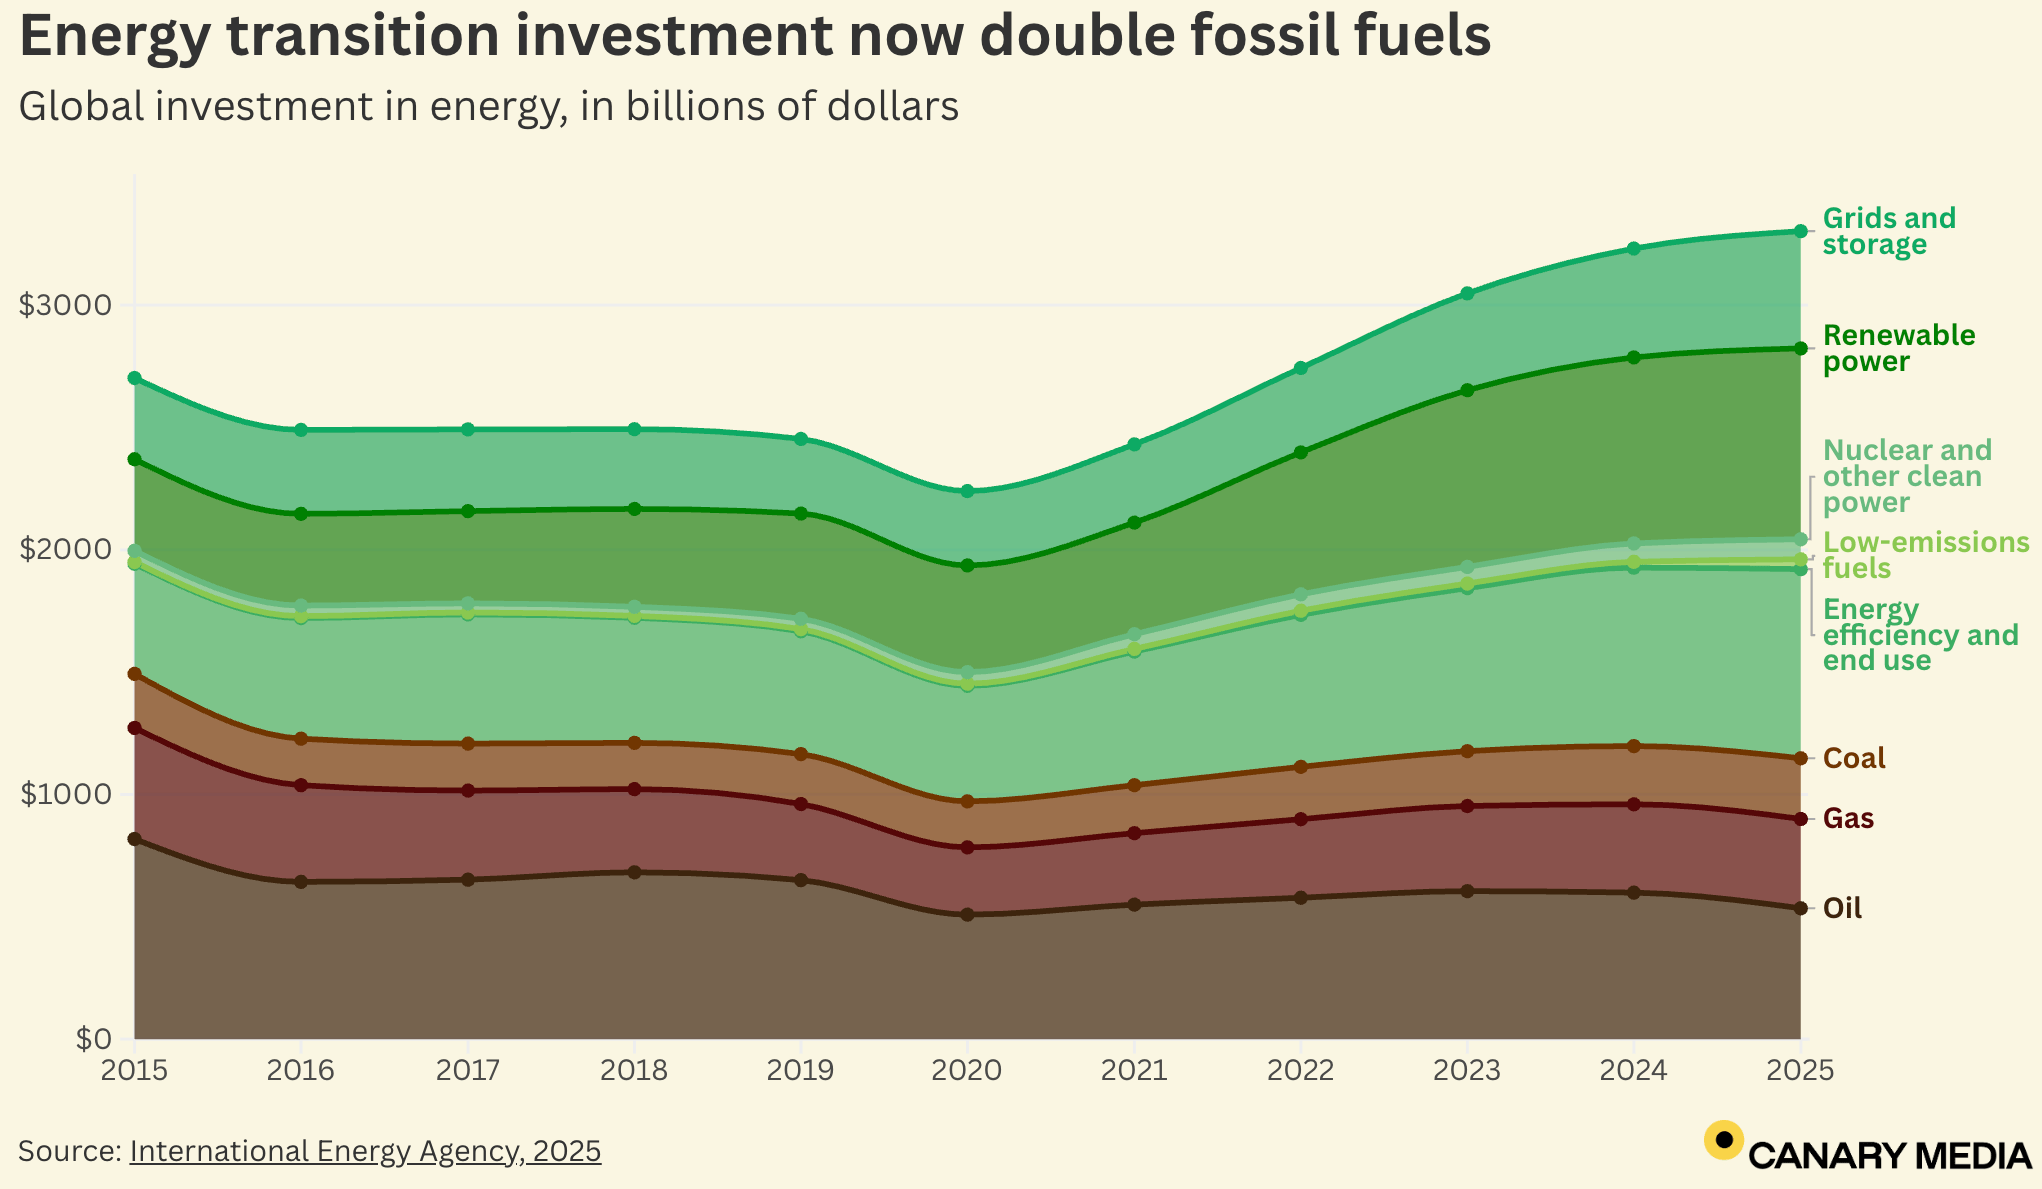
On the upside, global investments in energy transition keep going up:
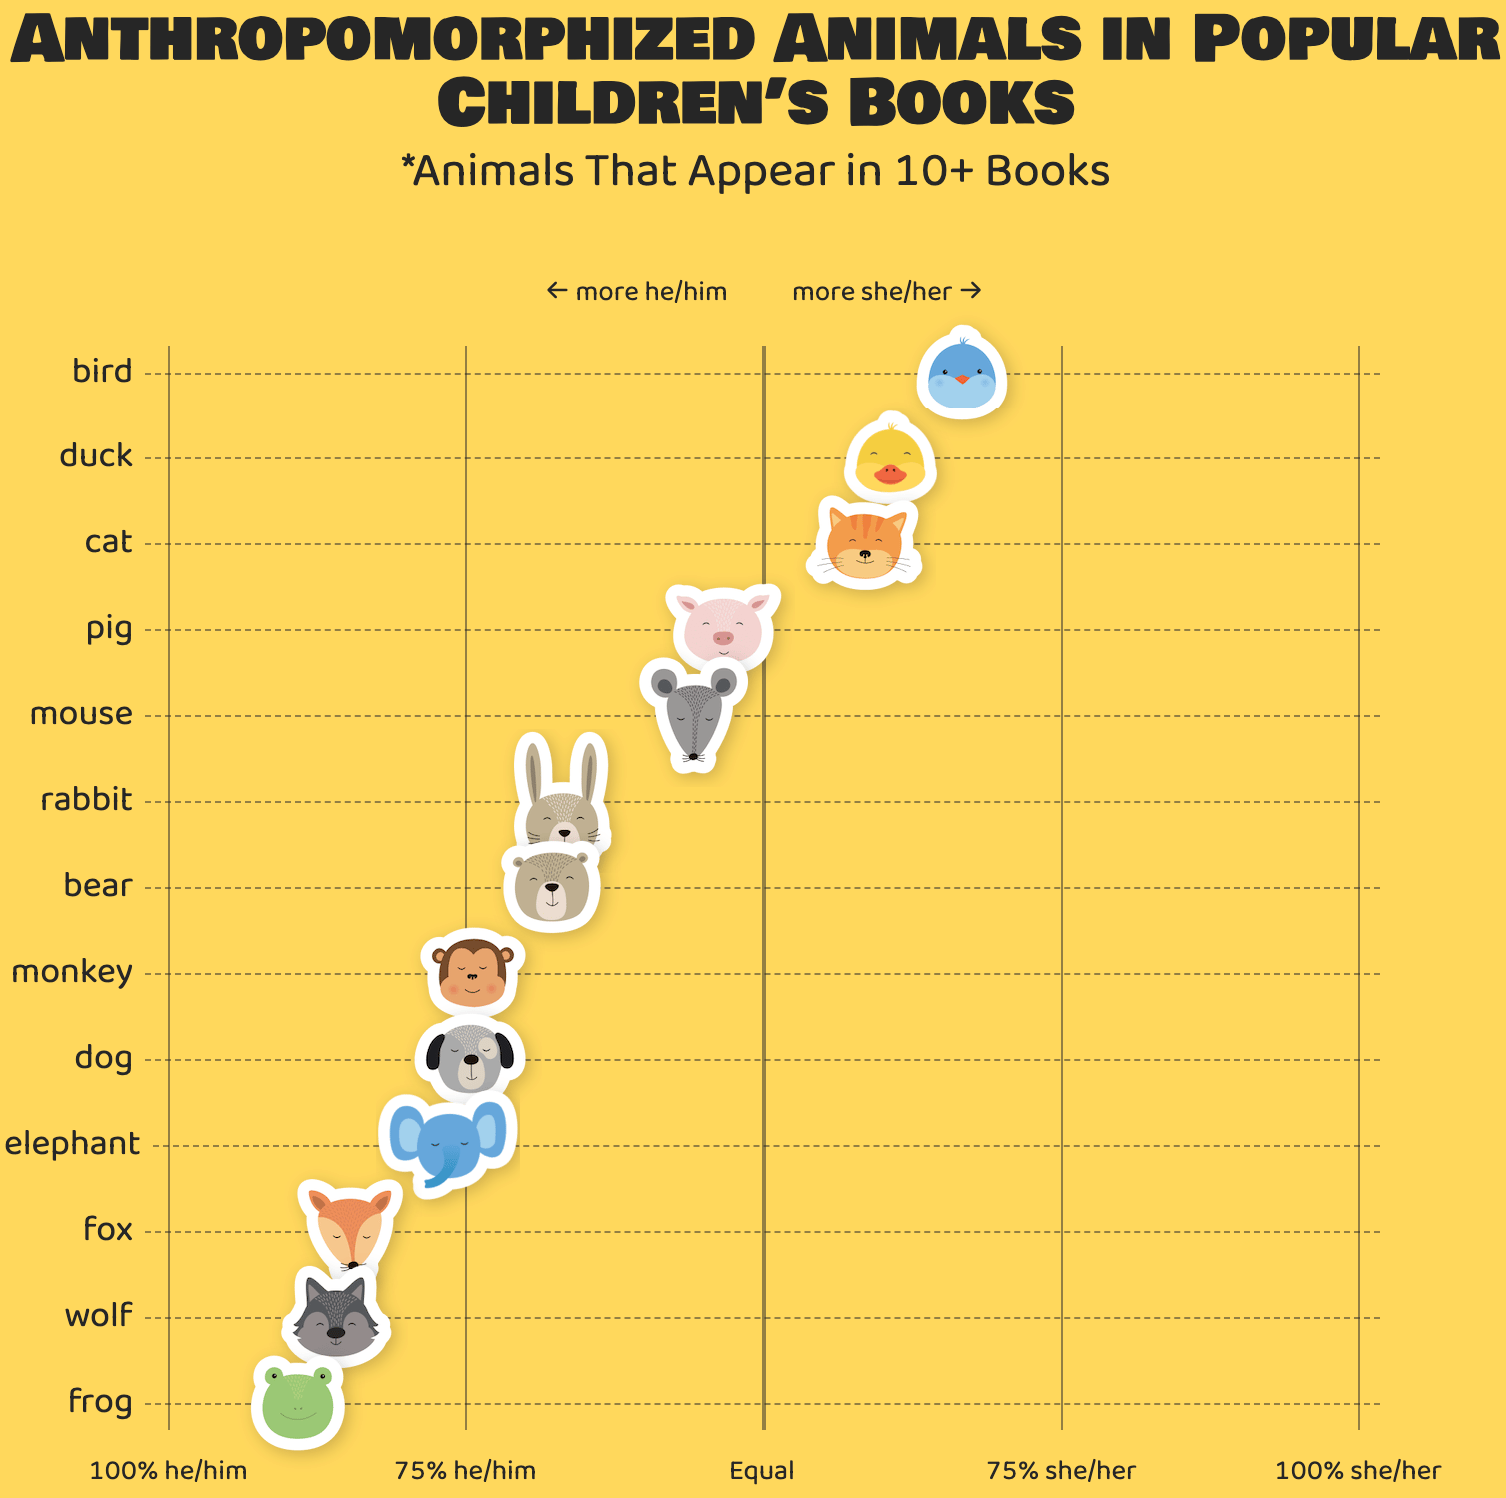
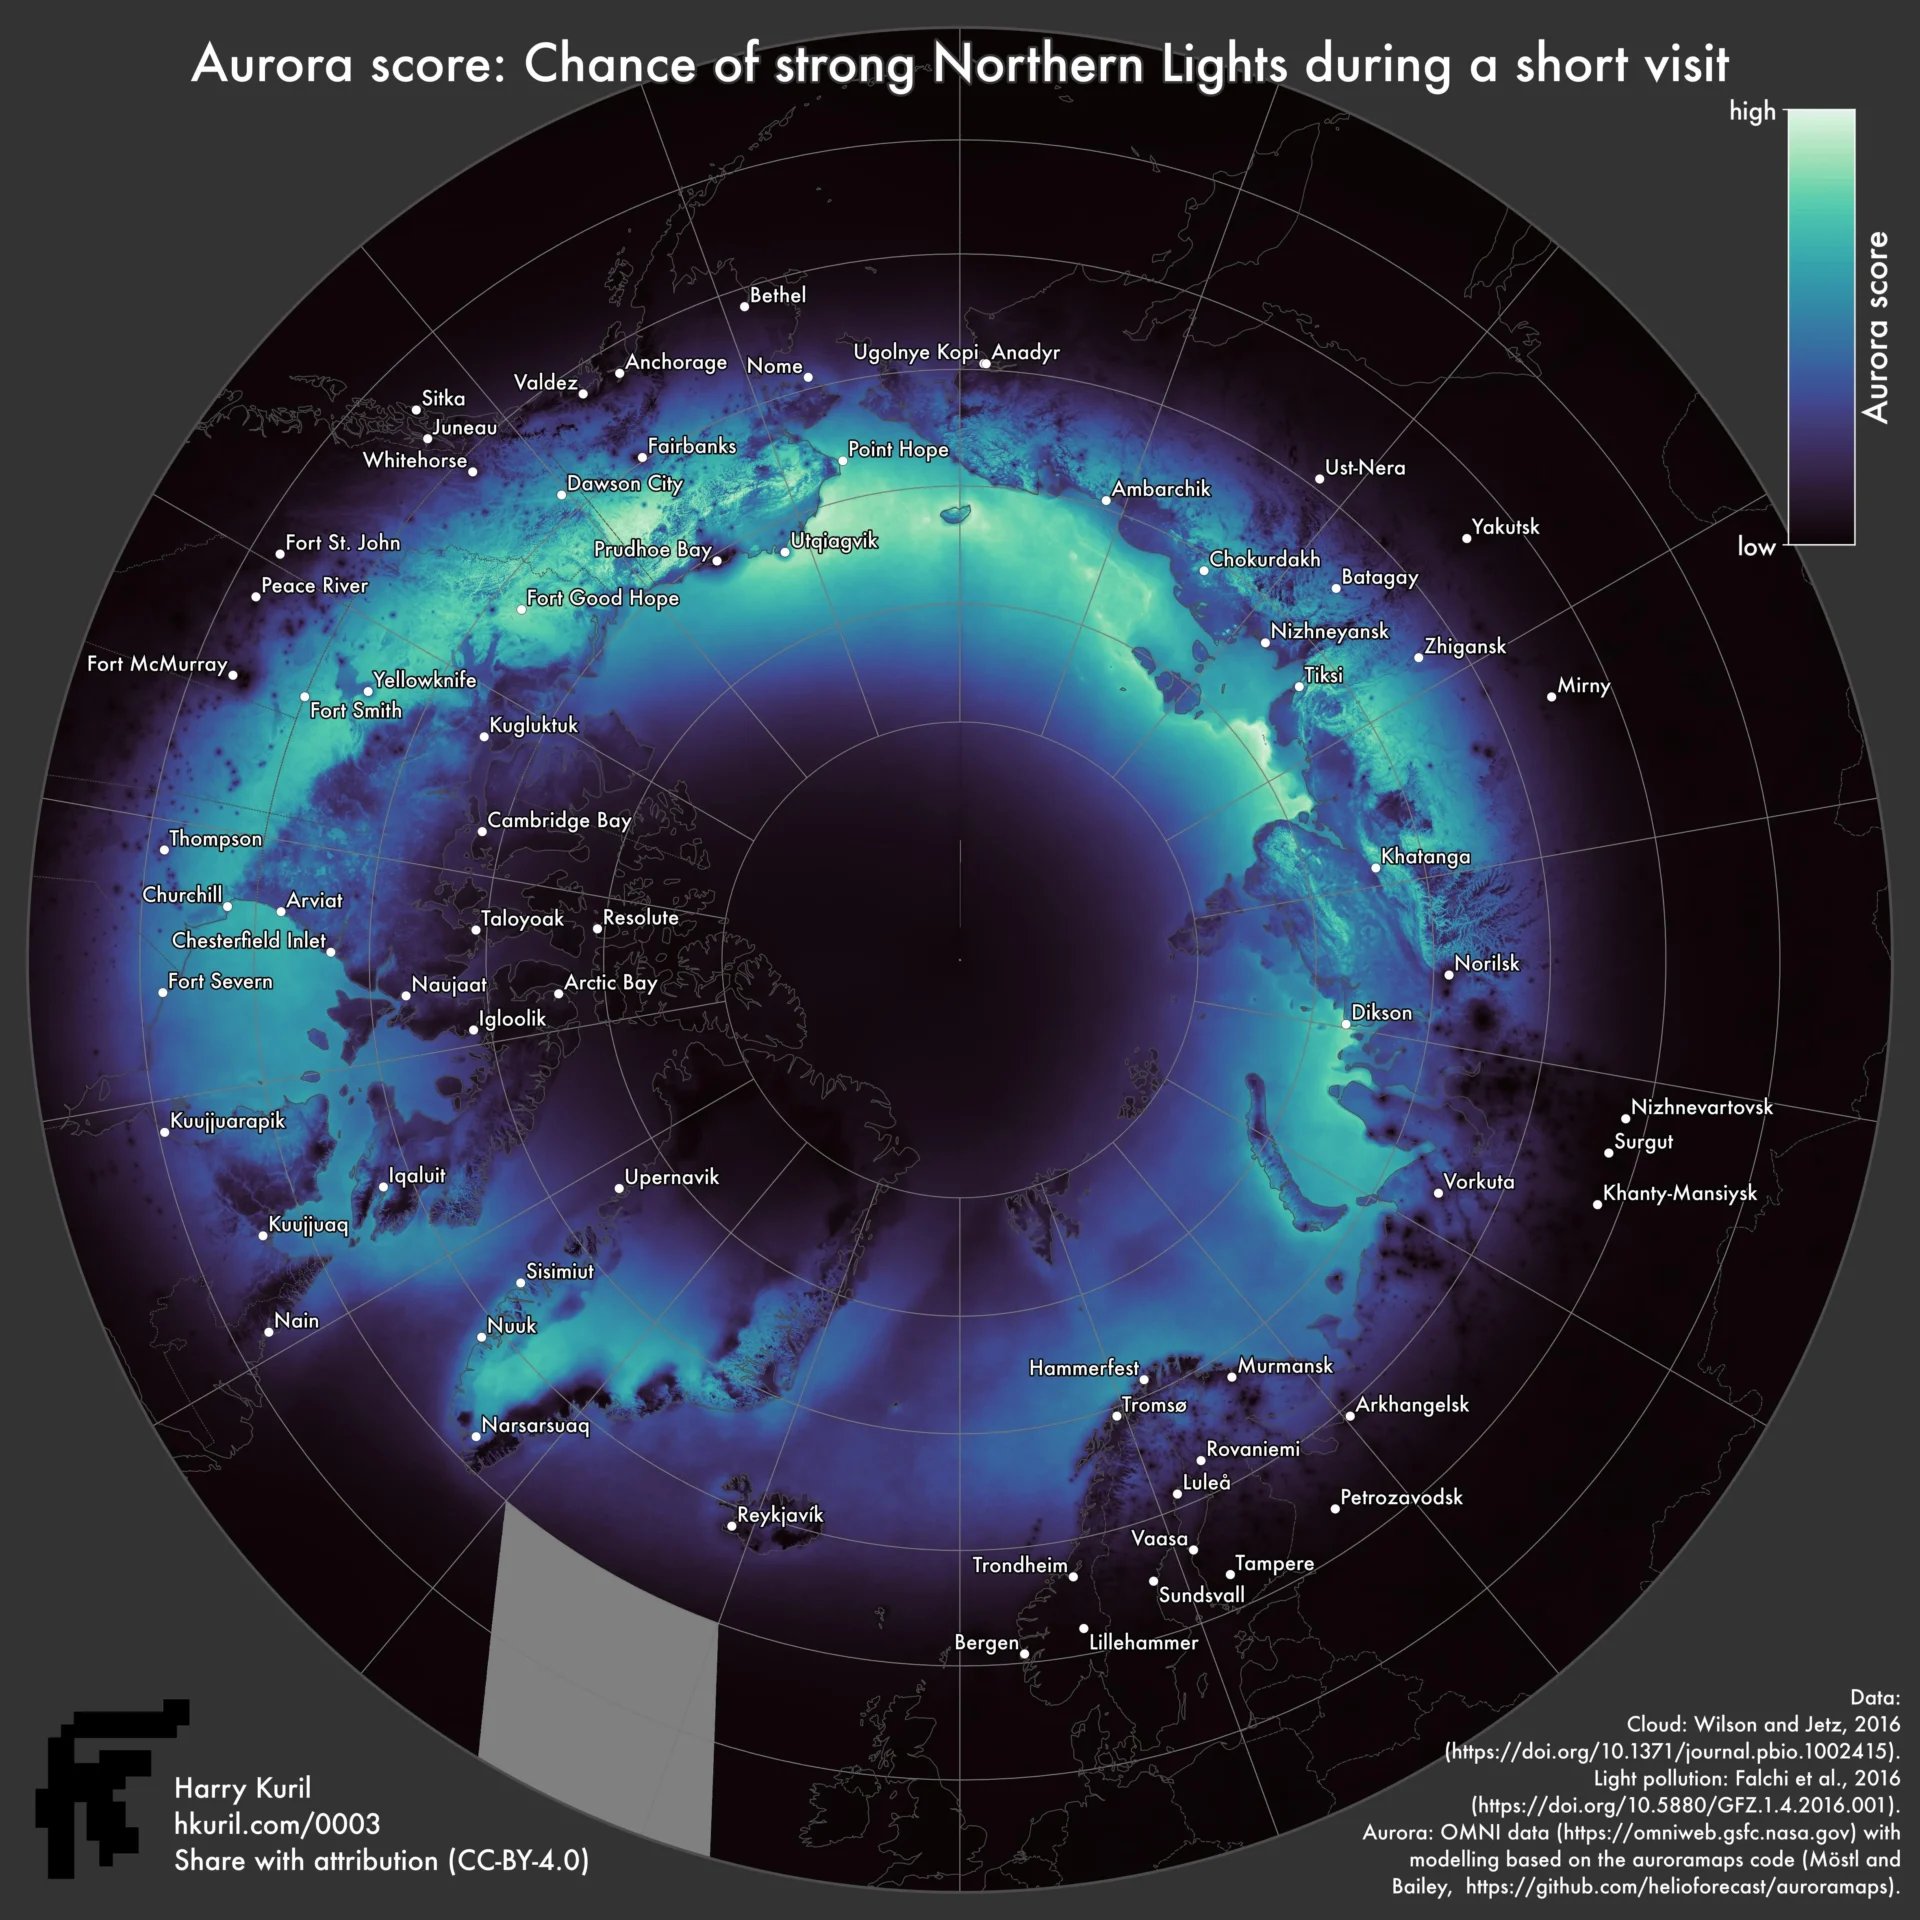
Other notable visualizations of the week covered animals in children's stories, chances of seeing the Northern Lights, pop culture, and more.
![La Nacion: <a href="https://www.lanacion.com.ar/sociedad/la-hora-pico-ya-no-existe-los-numeros-que-muestran-porque-la-panamericana-se-convirtio-en-un-nid07072025/"><strong>La hora pico ya no existe</strong></a><strong> </strong>[<em>Rush hour no longer exists</em>], July 7](https://datawrapper.de/cdn-cgi/image/quality=85,width=1558,f=auto,fit=cover/https://kirby.datawrapper.de/media/pages/blog/data-vis-dispatch-july-15-2025/4ba8c753a3-1752584473/cleanshot-2025-07-15-at-15.00.50@2x.png)
![Diario Sur: <a href="https://www.diariosur.es/culturas/agenda-musical-malaga-mujeres-20250711004227-nt.html"><strong>La agenda musical de Málaga: ¿dónde están las mujeres?</strong></a><strong> </strong>[<em>Malaga's music agenda: where are the women?</em>], July 13](https://datawrapper.de/cdn-cgi/image/quality=85,width=1182,f=auto,fit=cover/https://kirby.datawrapper.de/media/pages/blog/data-vis-dispatch-july-15-2025/b6d752bfb7-1752581979/cleanshot-2025-07-15-at-14.18.08@2x.png)
![Der Spiegel: <a href="https://www.spiegel.de/kultur/tv/sandra-maischberger-markus-lanz-und-caren-miosga-talkshows-in-der-datenanalyse-a-b7e46530-d826-4424-95c5-6c2f220595b1"><strong>Talkshow-König Karl, Berlins Balzac und der ewige TV-Schattenkanzlerkandidat</strong></a><strong> </strong>[<em>Talk show king Karl, Berlin's Balzac and the eternal TV shadow chancellor candidate</em>], July 12](https://datawrapper.de/cdn-cgi/image/quality=85,width=1258,f=auto,fit=cover/https://kirby.datawrapper.de/media/pages/blog/data-vis-dispatch-july-15-2025/eb51376068-1752582547/cleanshot-2025-07-15-at-14.27.43@2x.png)
![Der Spiegel: <a href="https://www.spiegel.de/wirtschaft/soziales/lebensqualitaet-in-diesen-metropolen-lebt-es-sich-am-besten-a-49ee5bc6-0be3-4f29-b00c-8db3ae1727be"><strong>In diesen Metropolen lebt es sich am besten</strong></a> [<em>These cities are the best places to live</em>], July 7](https://datawrapper.de/cdn-cgi/image/quality=85,width=1260,f=auto,fit=cover/https://kirby.datawrapper.de/media/pages/blog/data-vis-dispatch-july-15-2025/b8d8a71c68-1752582646/cleanshot-2025-07-15-at-14.29.30@2x.png)
![La Nacion: <a href="https://www.lanacion.com.ar/politica/las-cinco-vueltas-al-mundo-de-javier-milei-nid12072025/"><strong>Destinos favoritos y comitiva</strong></a><strong> </strong>[<em>Favorite destinations and entourage</em>], July 12](https://datawrapper.de/cdn-cgi/image/quality=85,width=2510,f=auto,fit=cover/https://kirby.datawrapper.de/media/pages/blog/data-vis-dispatch-july-15-2025/6082746440-1752583863/cleanshot-2025-07-15-at-14.49.48@2x.png)
What else we found interesting
Help us make this dispatch better! We’d love to hear which newsletters, blogs, or social media accounts we need to follow to learn about interesting projects, especially from less-covered parts of the world (Asia, South America, Africa). Write us at hello@datawrapper.de or leave a comment below. Want the Dispatch in your inbox every Tuesday? Sign up for our Blog Update newsletter!


