Data Vis Dispatch, January 27: Trump, snow, and ICE

Welcome back to the 229th edition of Data Vis Dispatch! Every week, we’ll be publishing a collection of the best small and large data visualizations we find, especially from news organizations — to celebrate data journalism, data visualization, simple charts, elaborate maps, and their creators.
Recurring topics this week include President Trump, snowstorms, and another U.S. citizen killed by ICE.
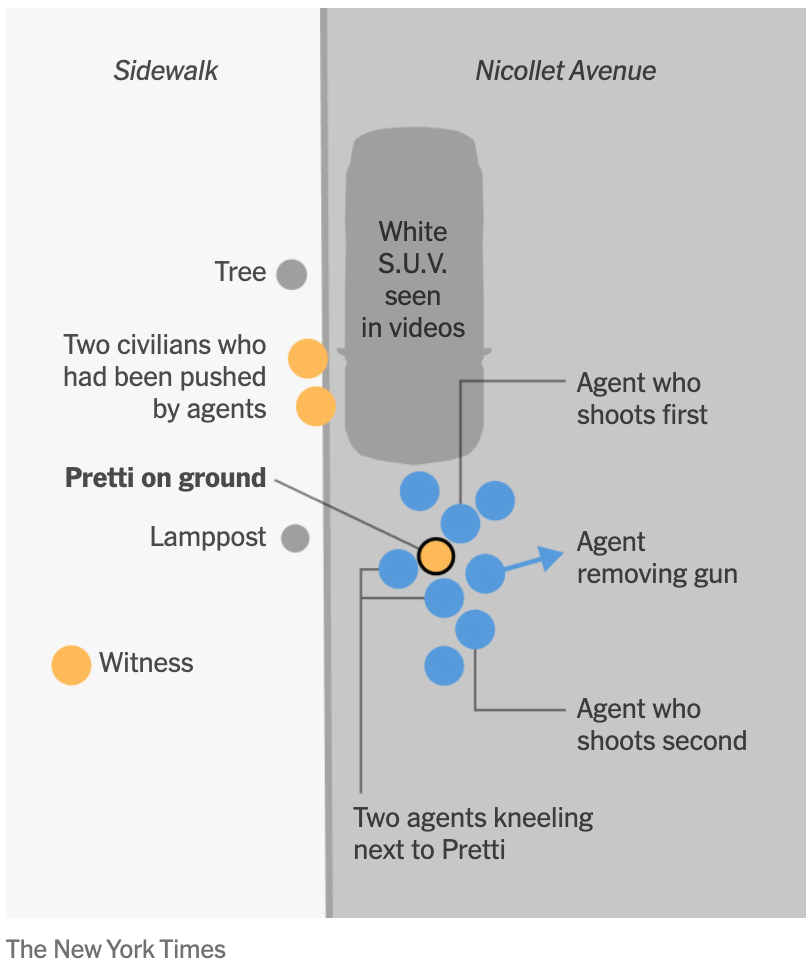
This past week, United States once again led international headlines, most notably with the killing of Alex Pretti, another U.S. citizen killed at the hands of ICE, the U. S. Immigration and Customs Enforcement.
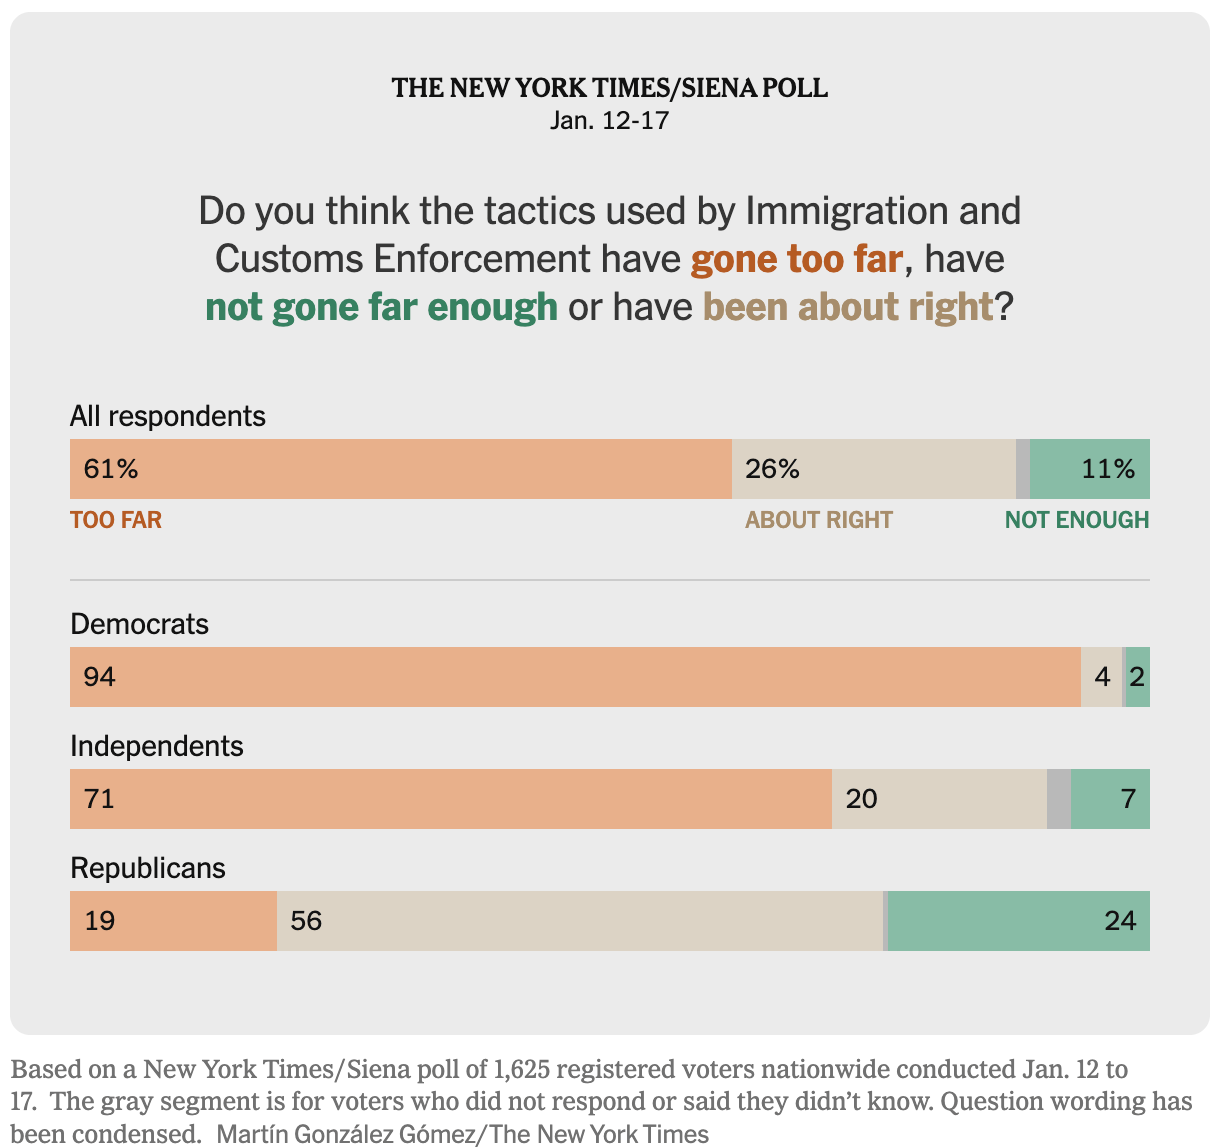
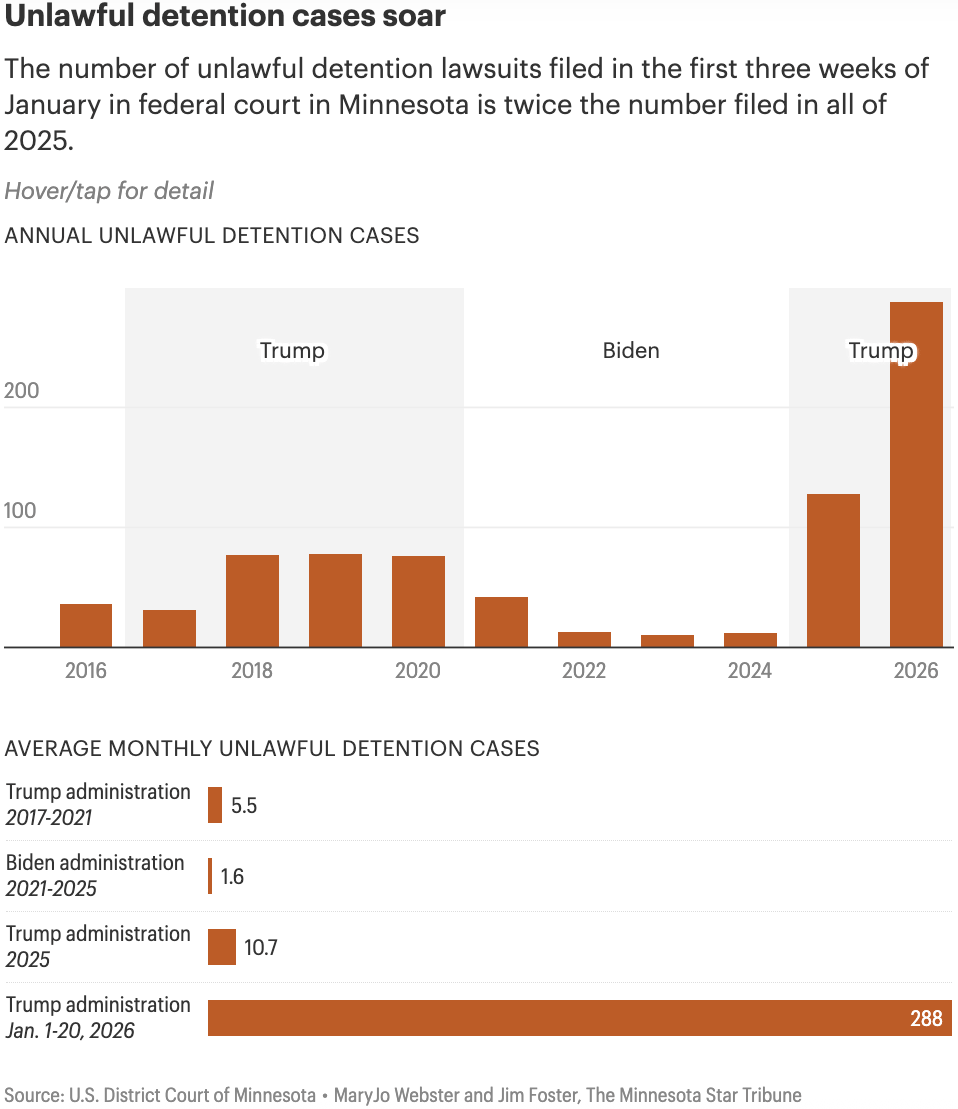
As a result, protests against ICE and disapproval of the agency have increased, along with the number of lawsuits for unlawful detention.
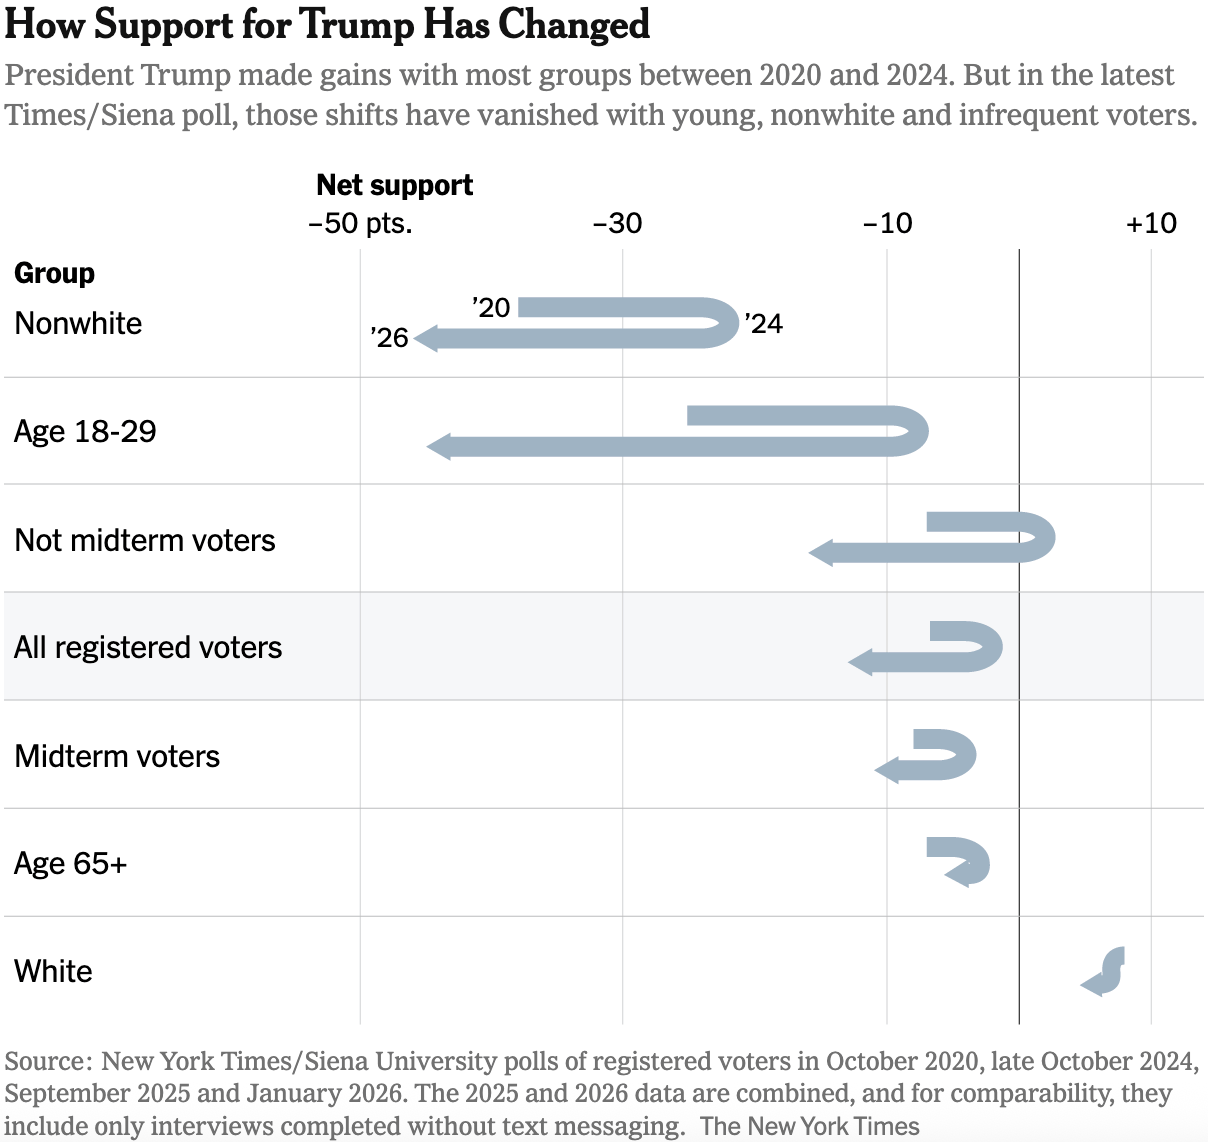
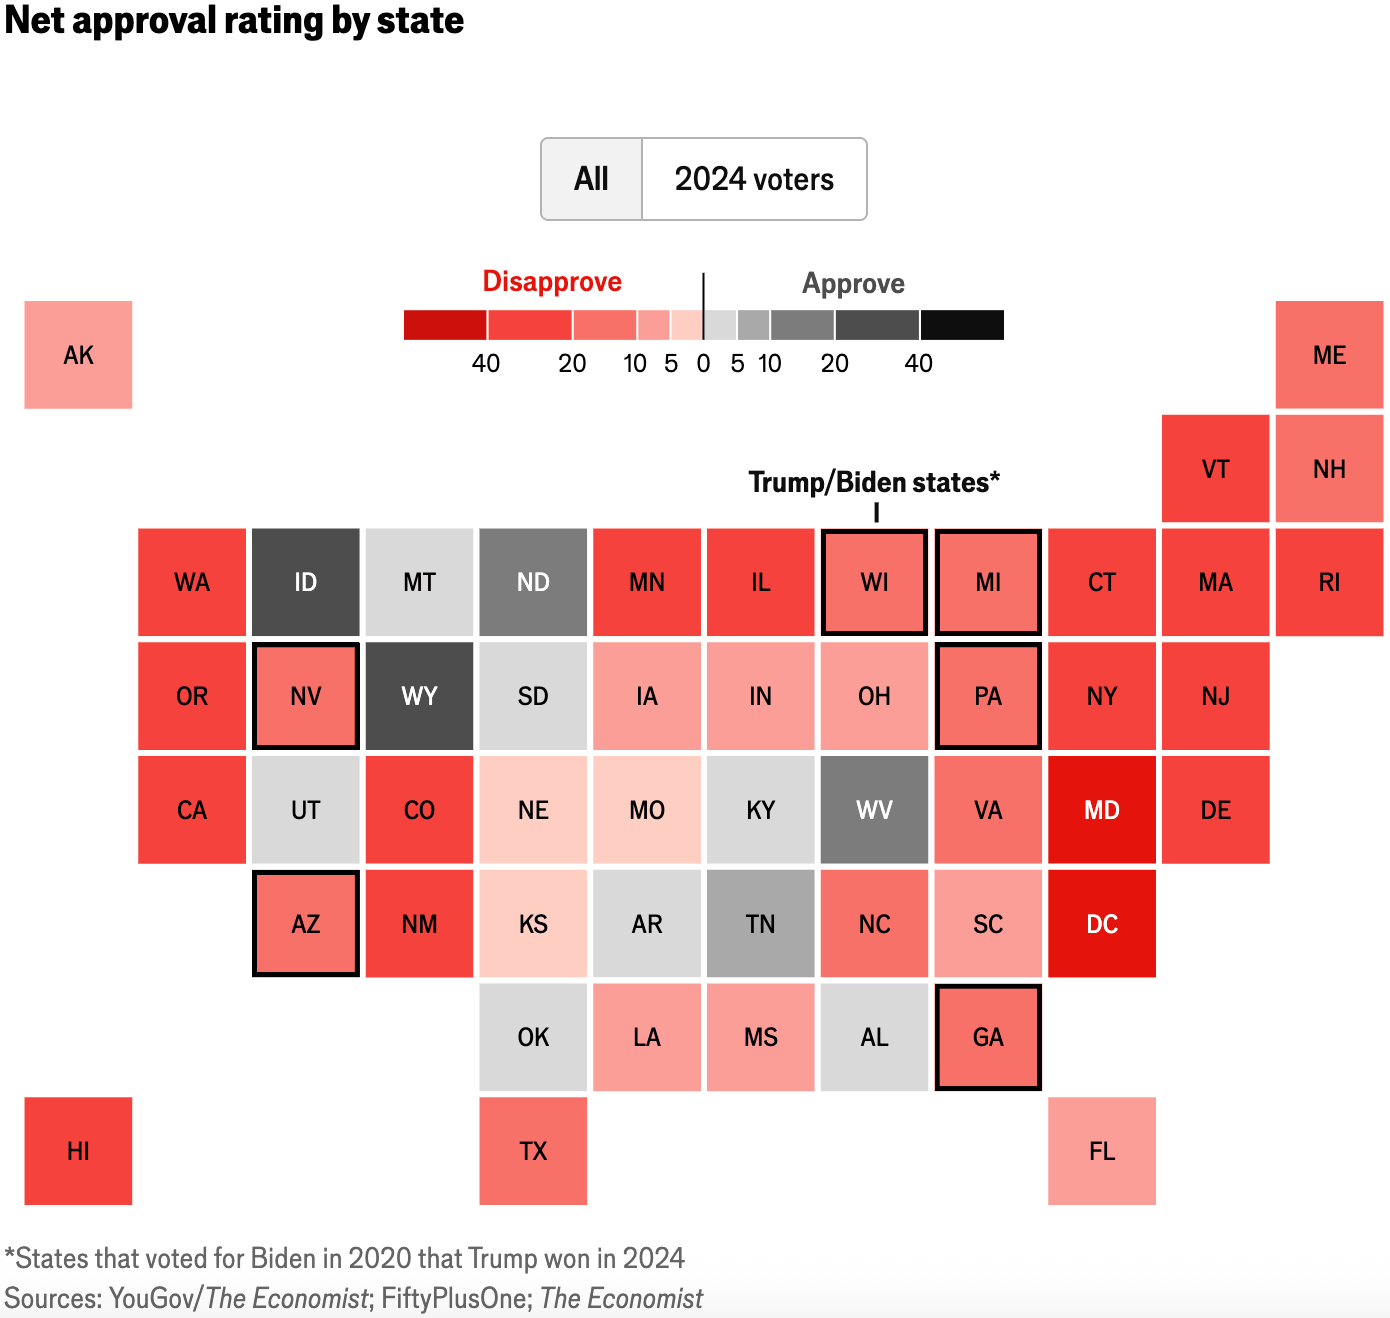
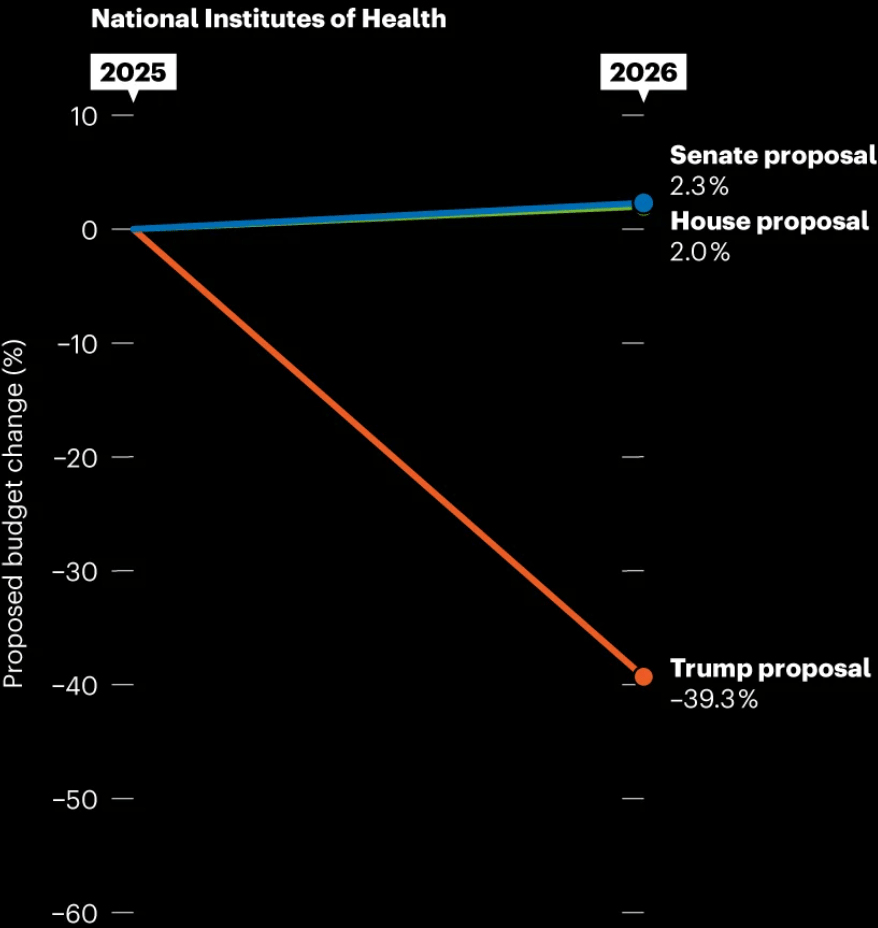
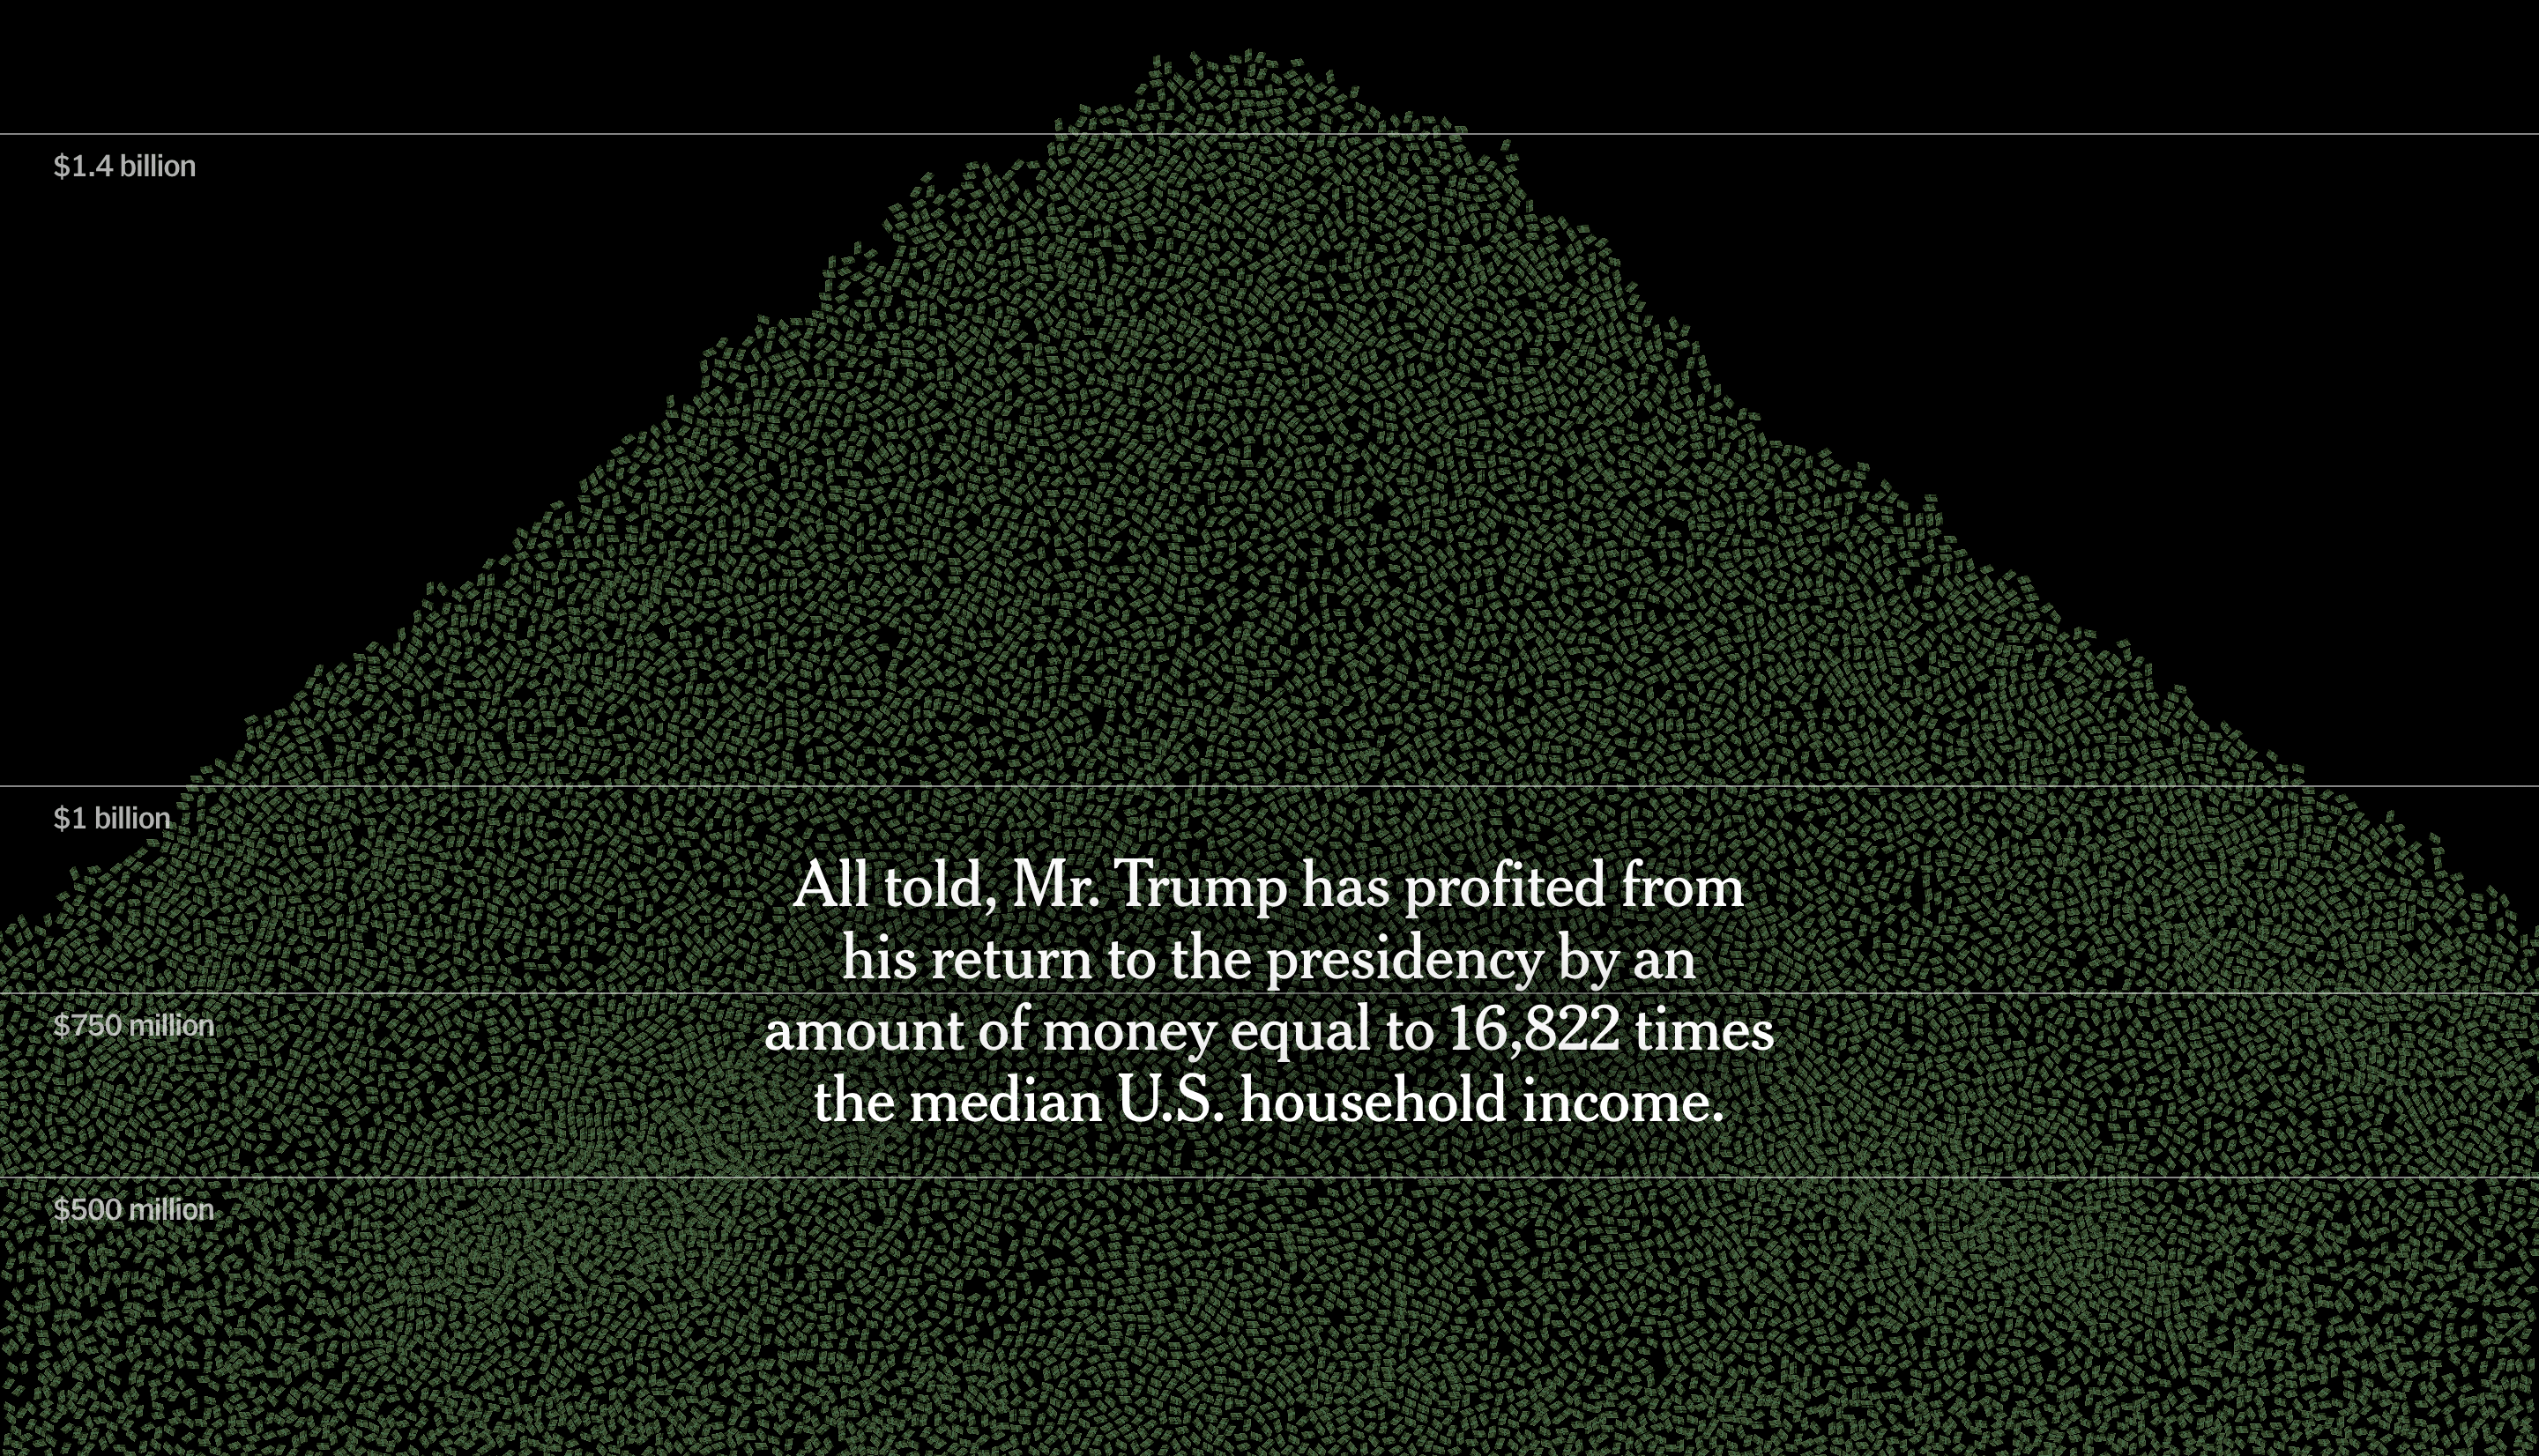
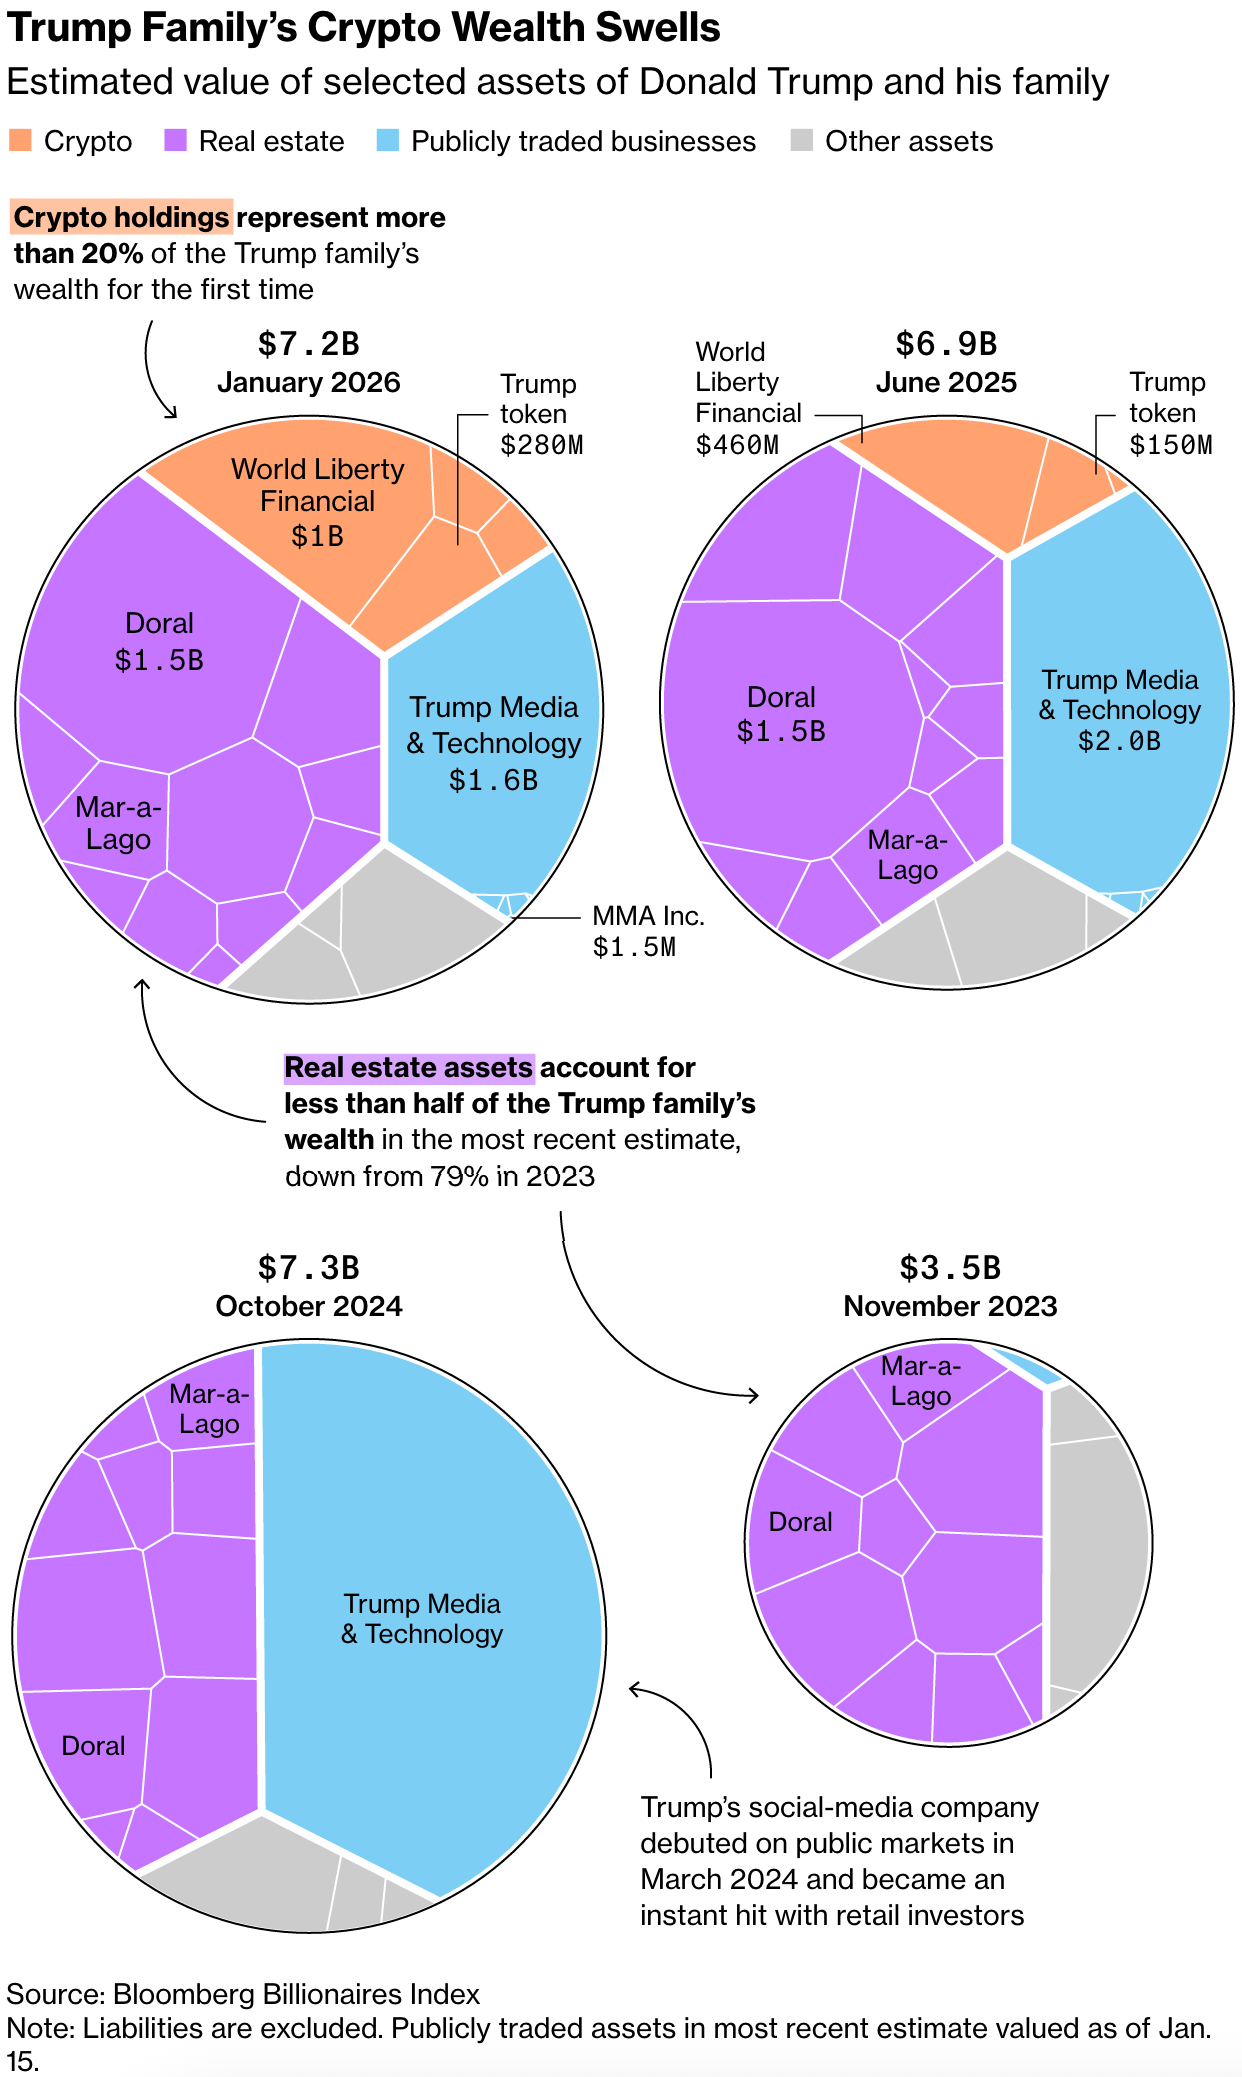
President Trump continues to lose support among voters. He also faces criticism for budget cuts in science and research, as well as for his own personal gains.
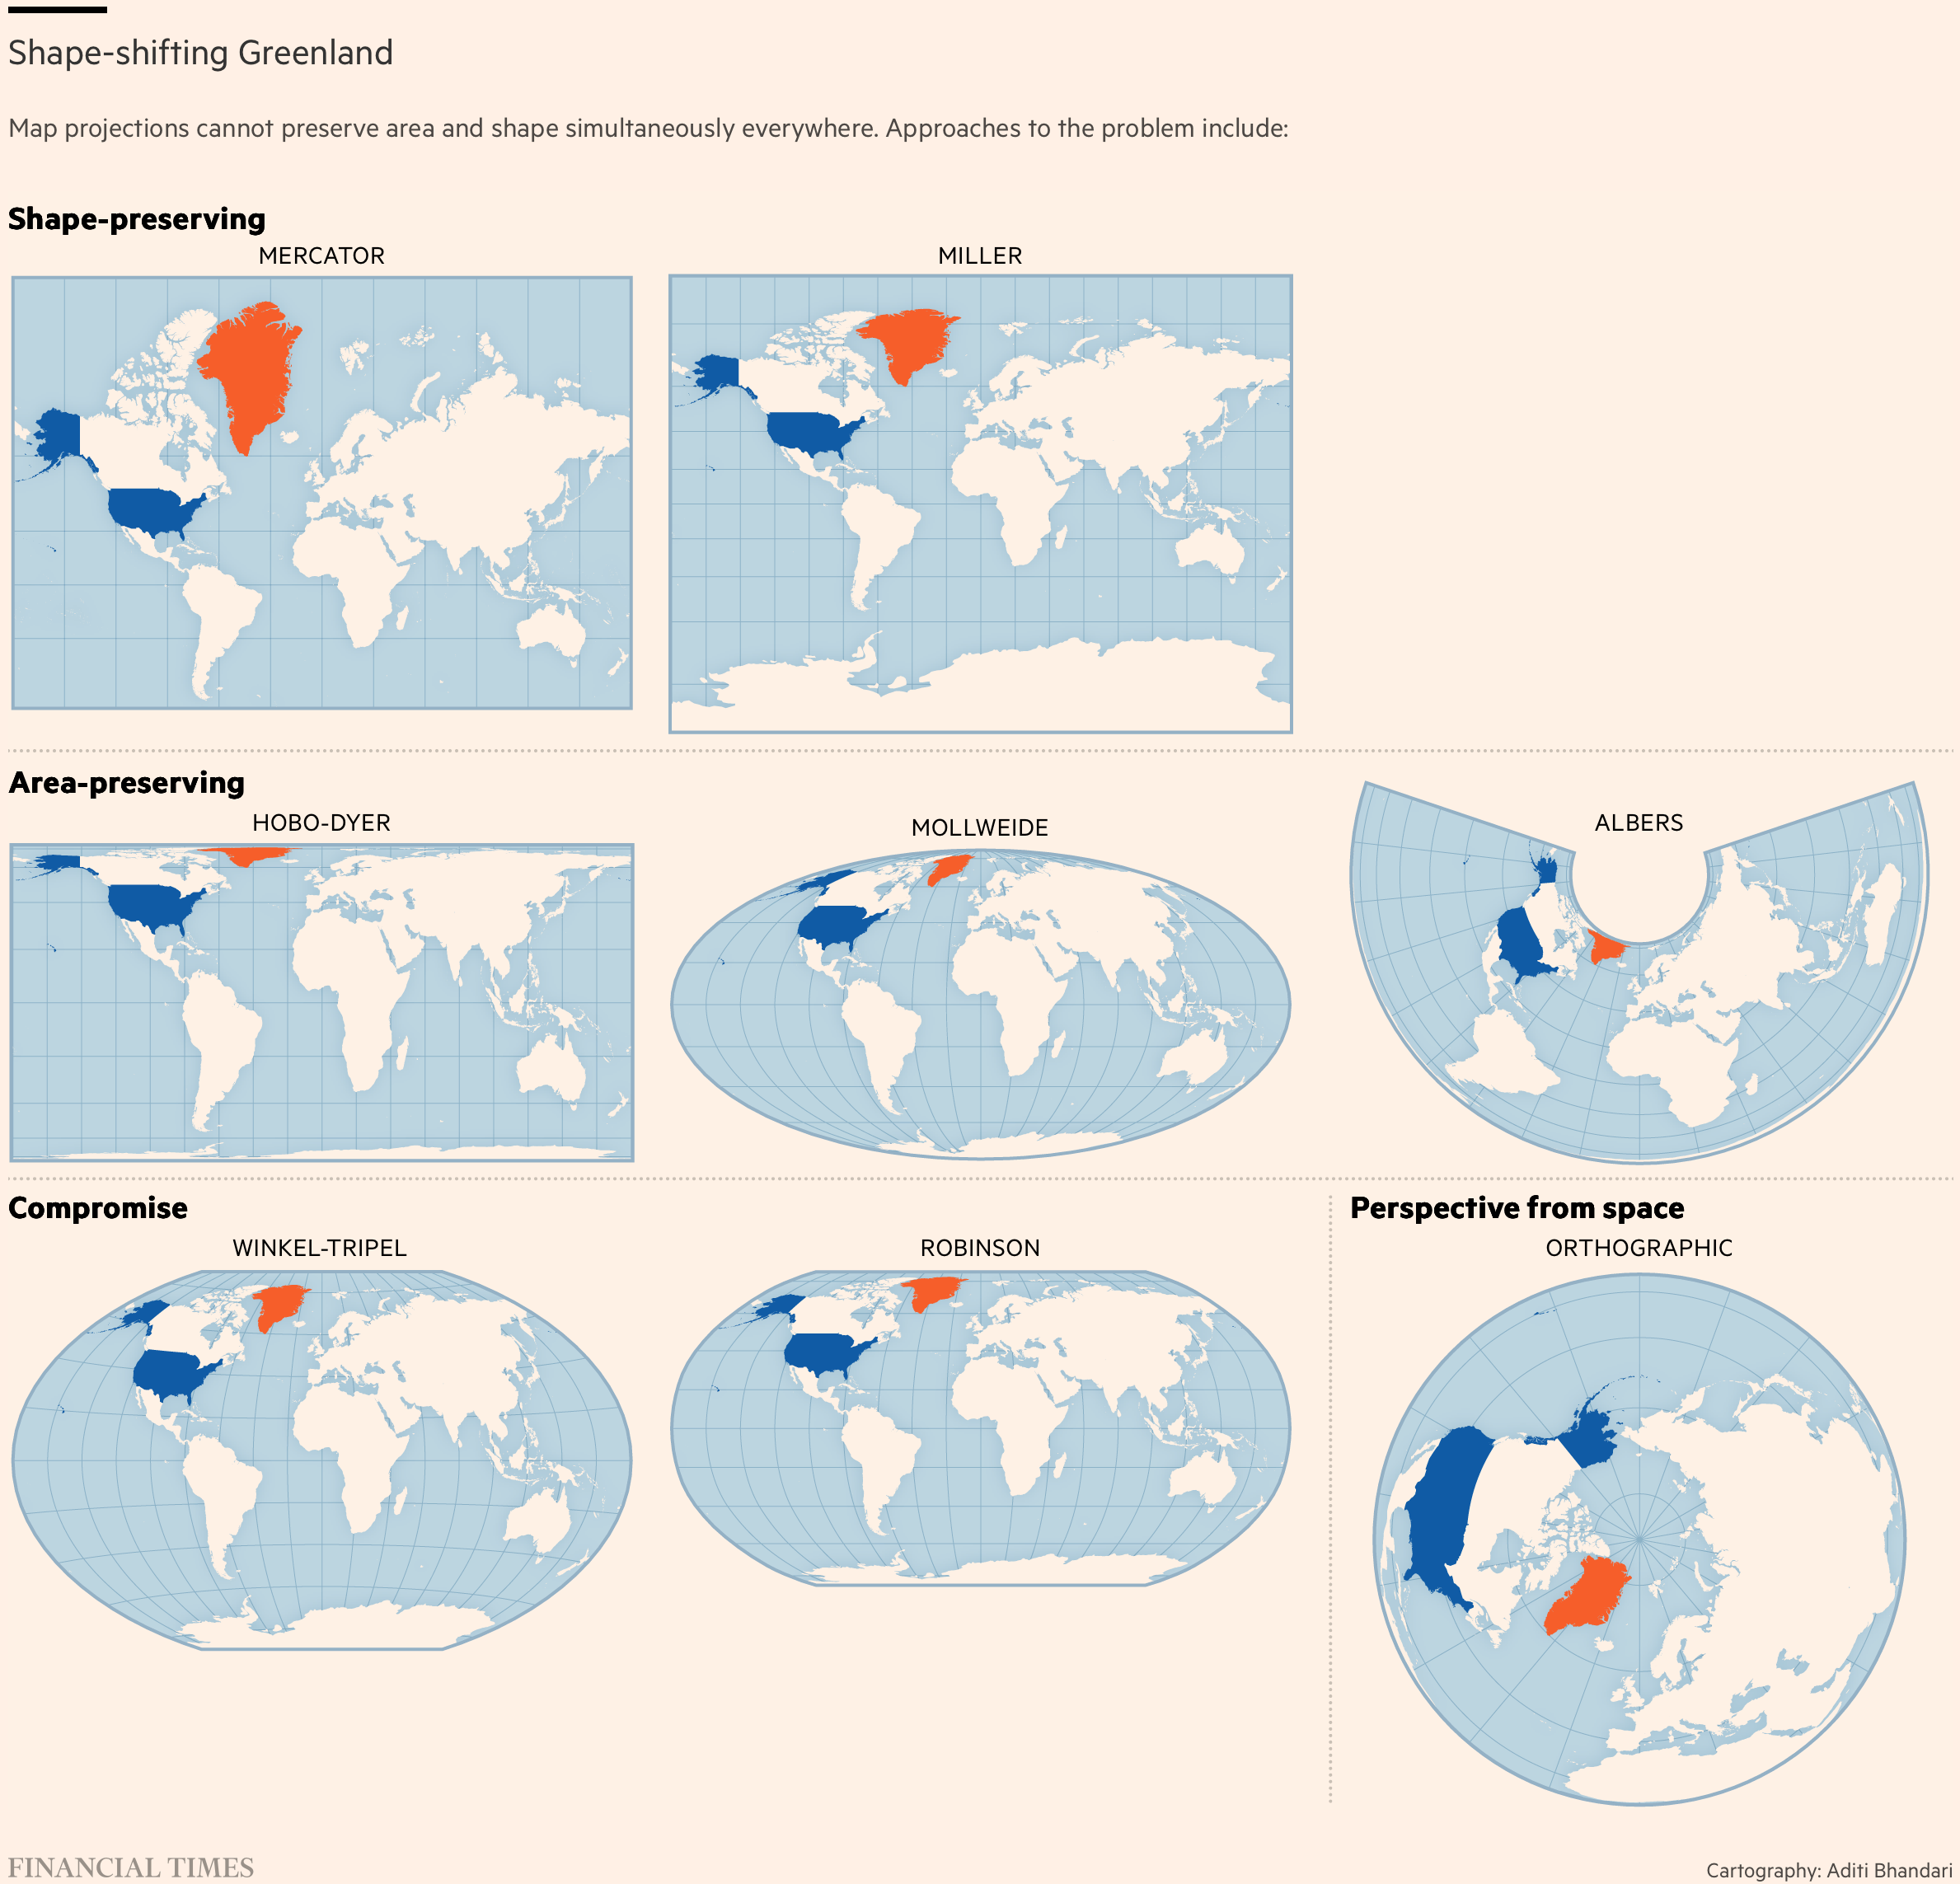
Trump's interest in Greenland also inspired a closer look at the realities and illusions of globes and maps.
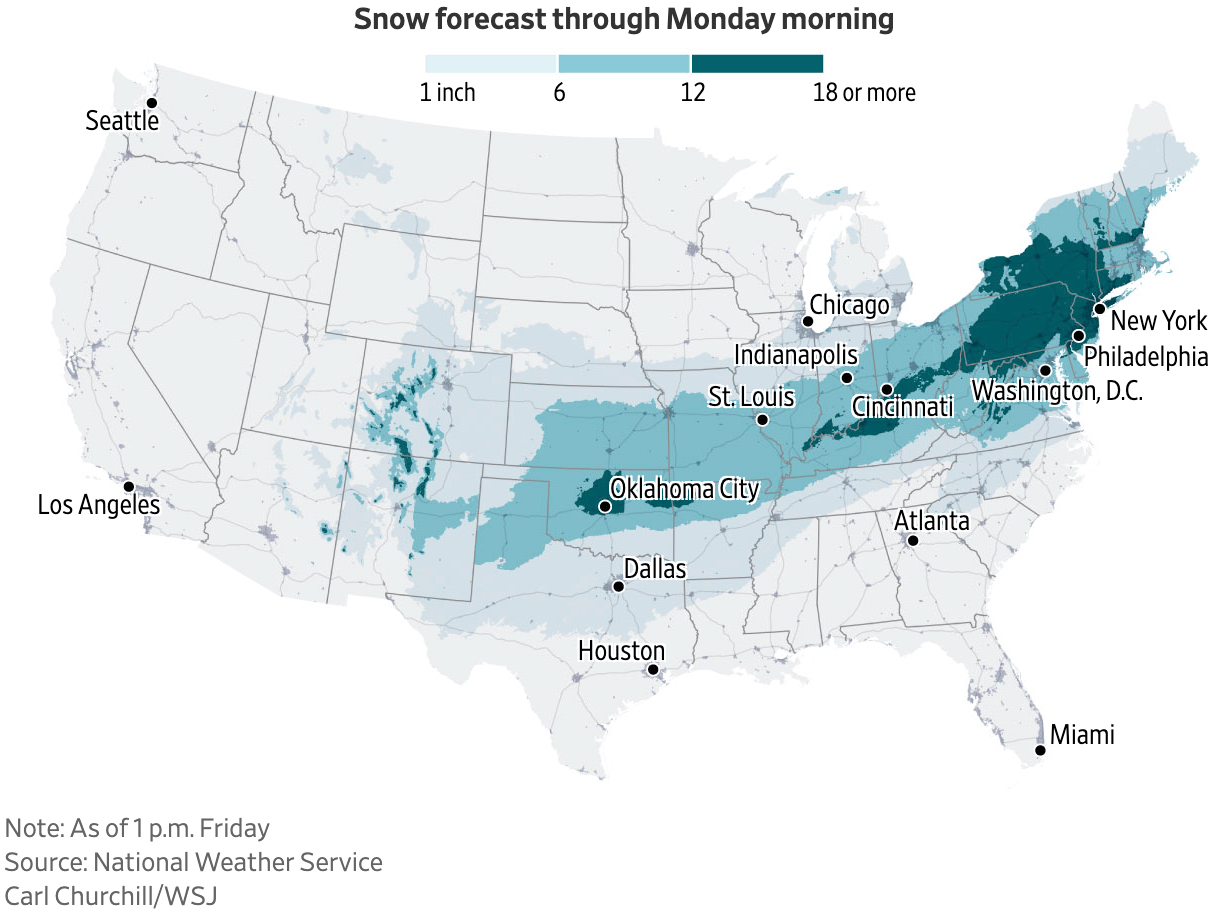
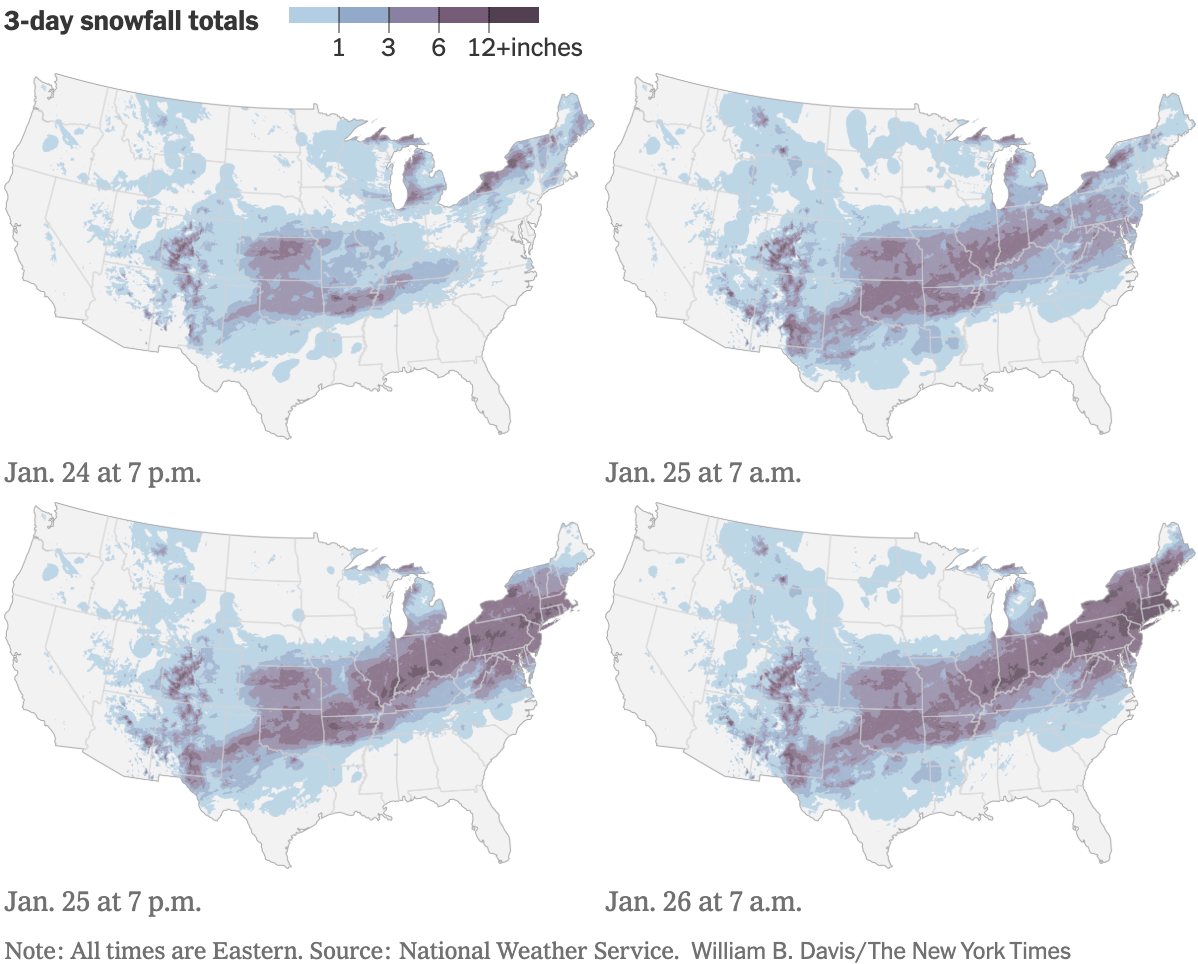
Meanwhile, the United States are also seeing heavy snowstorms.
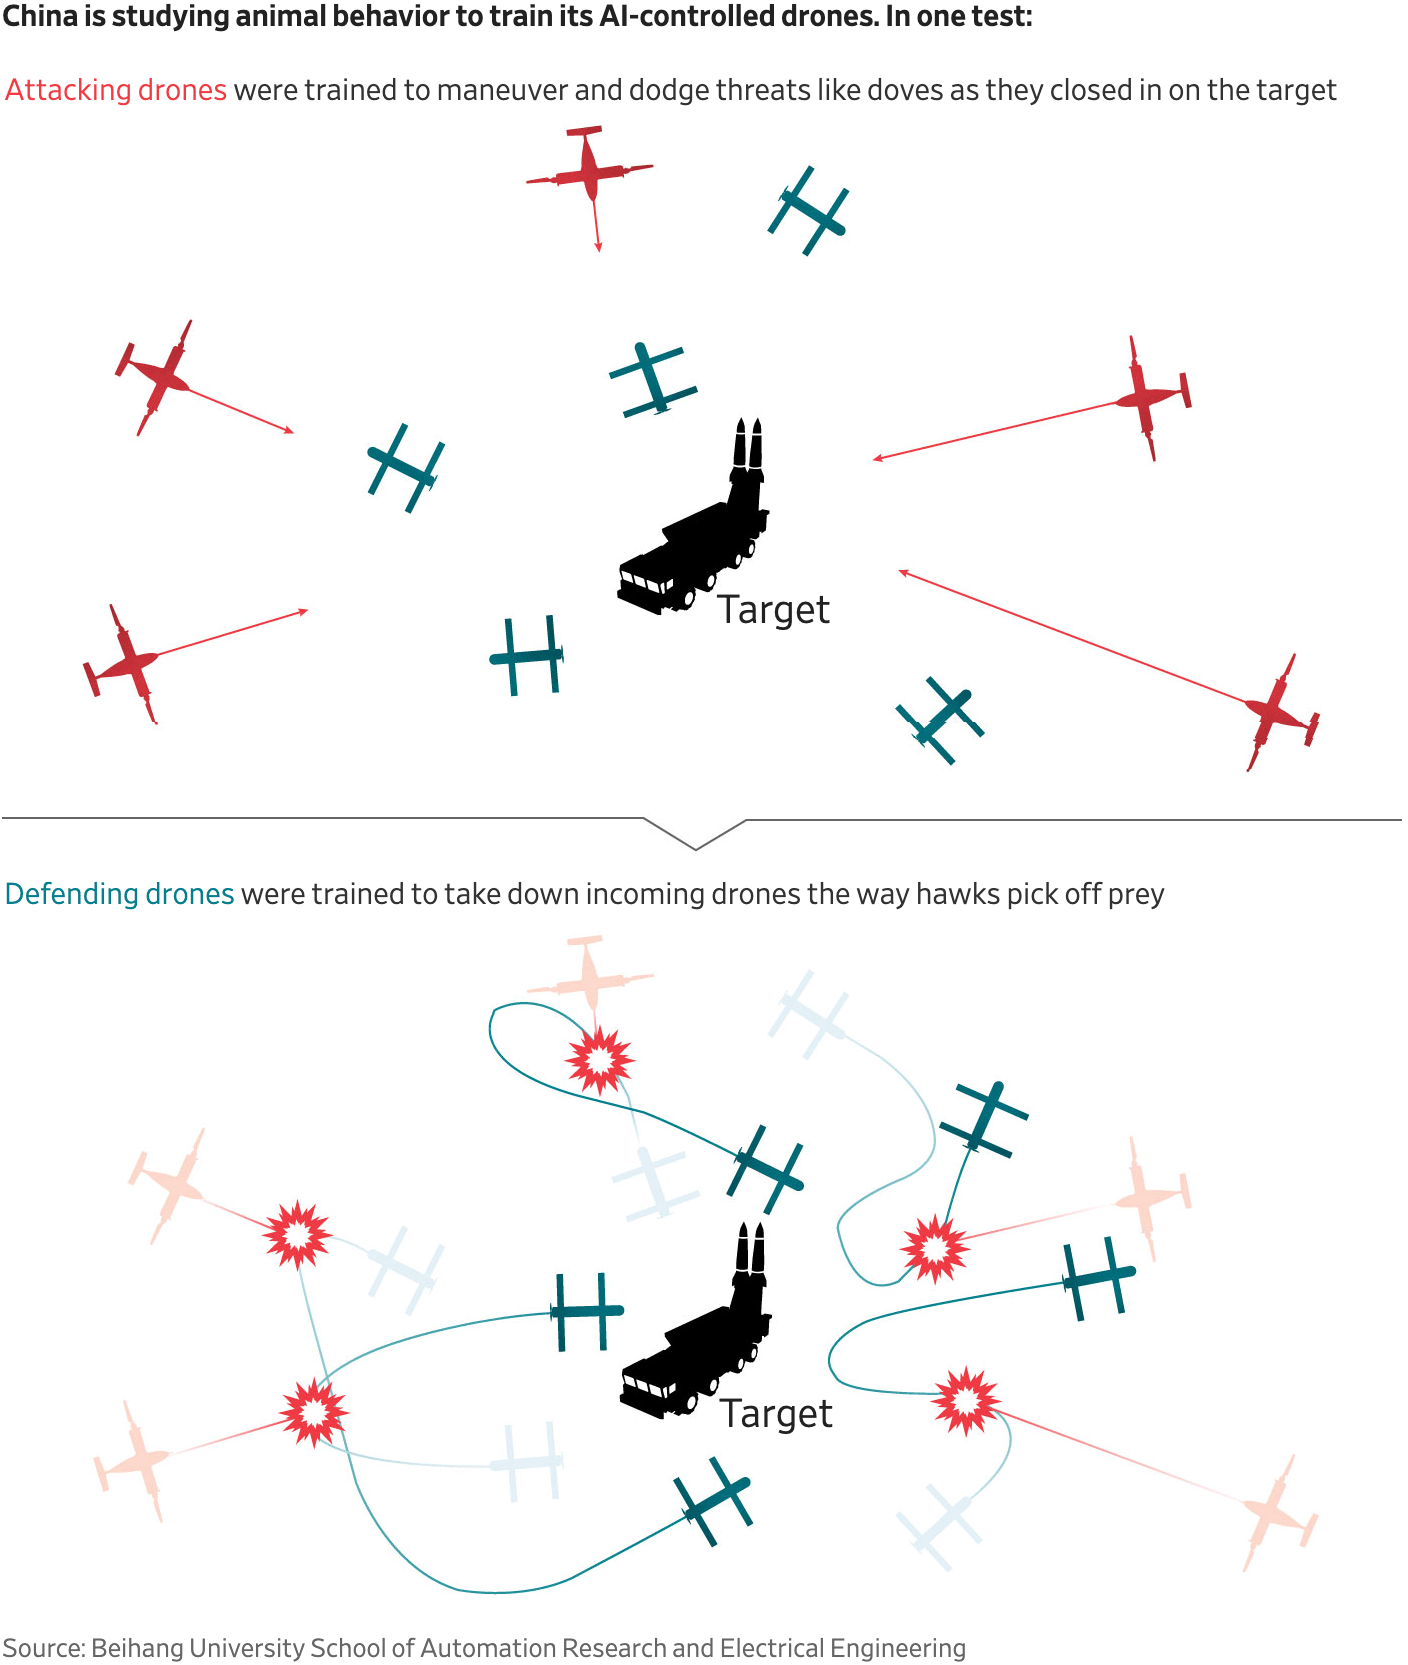
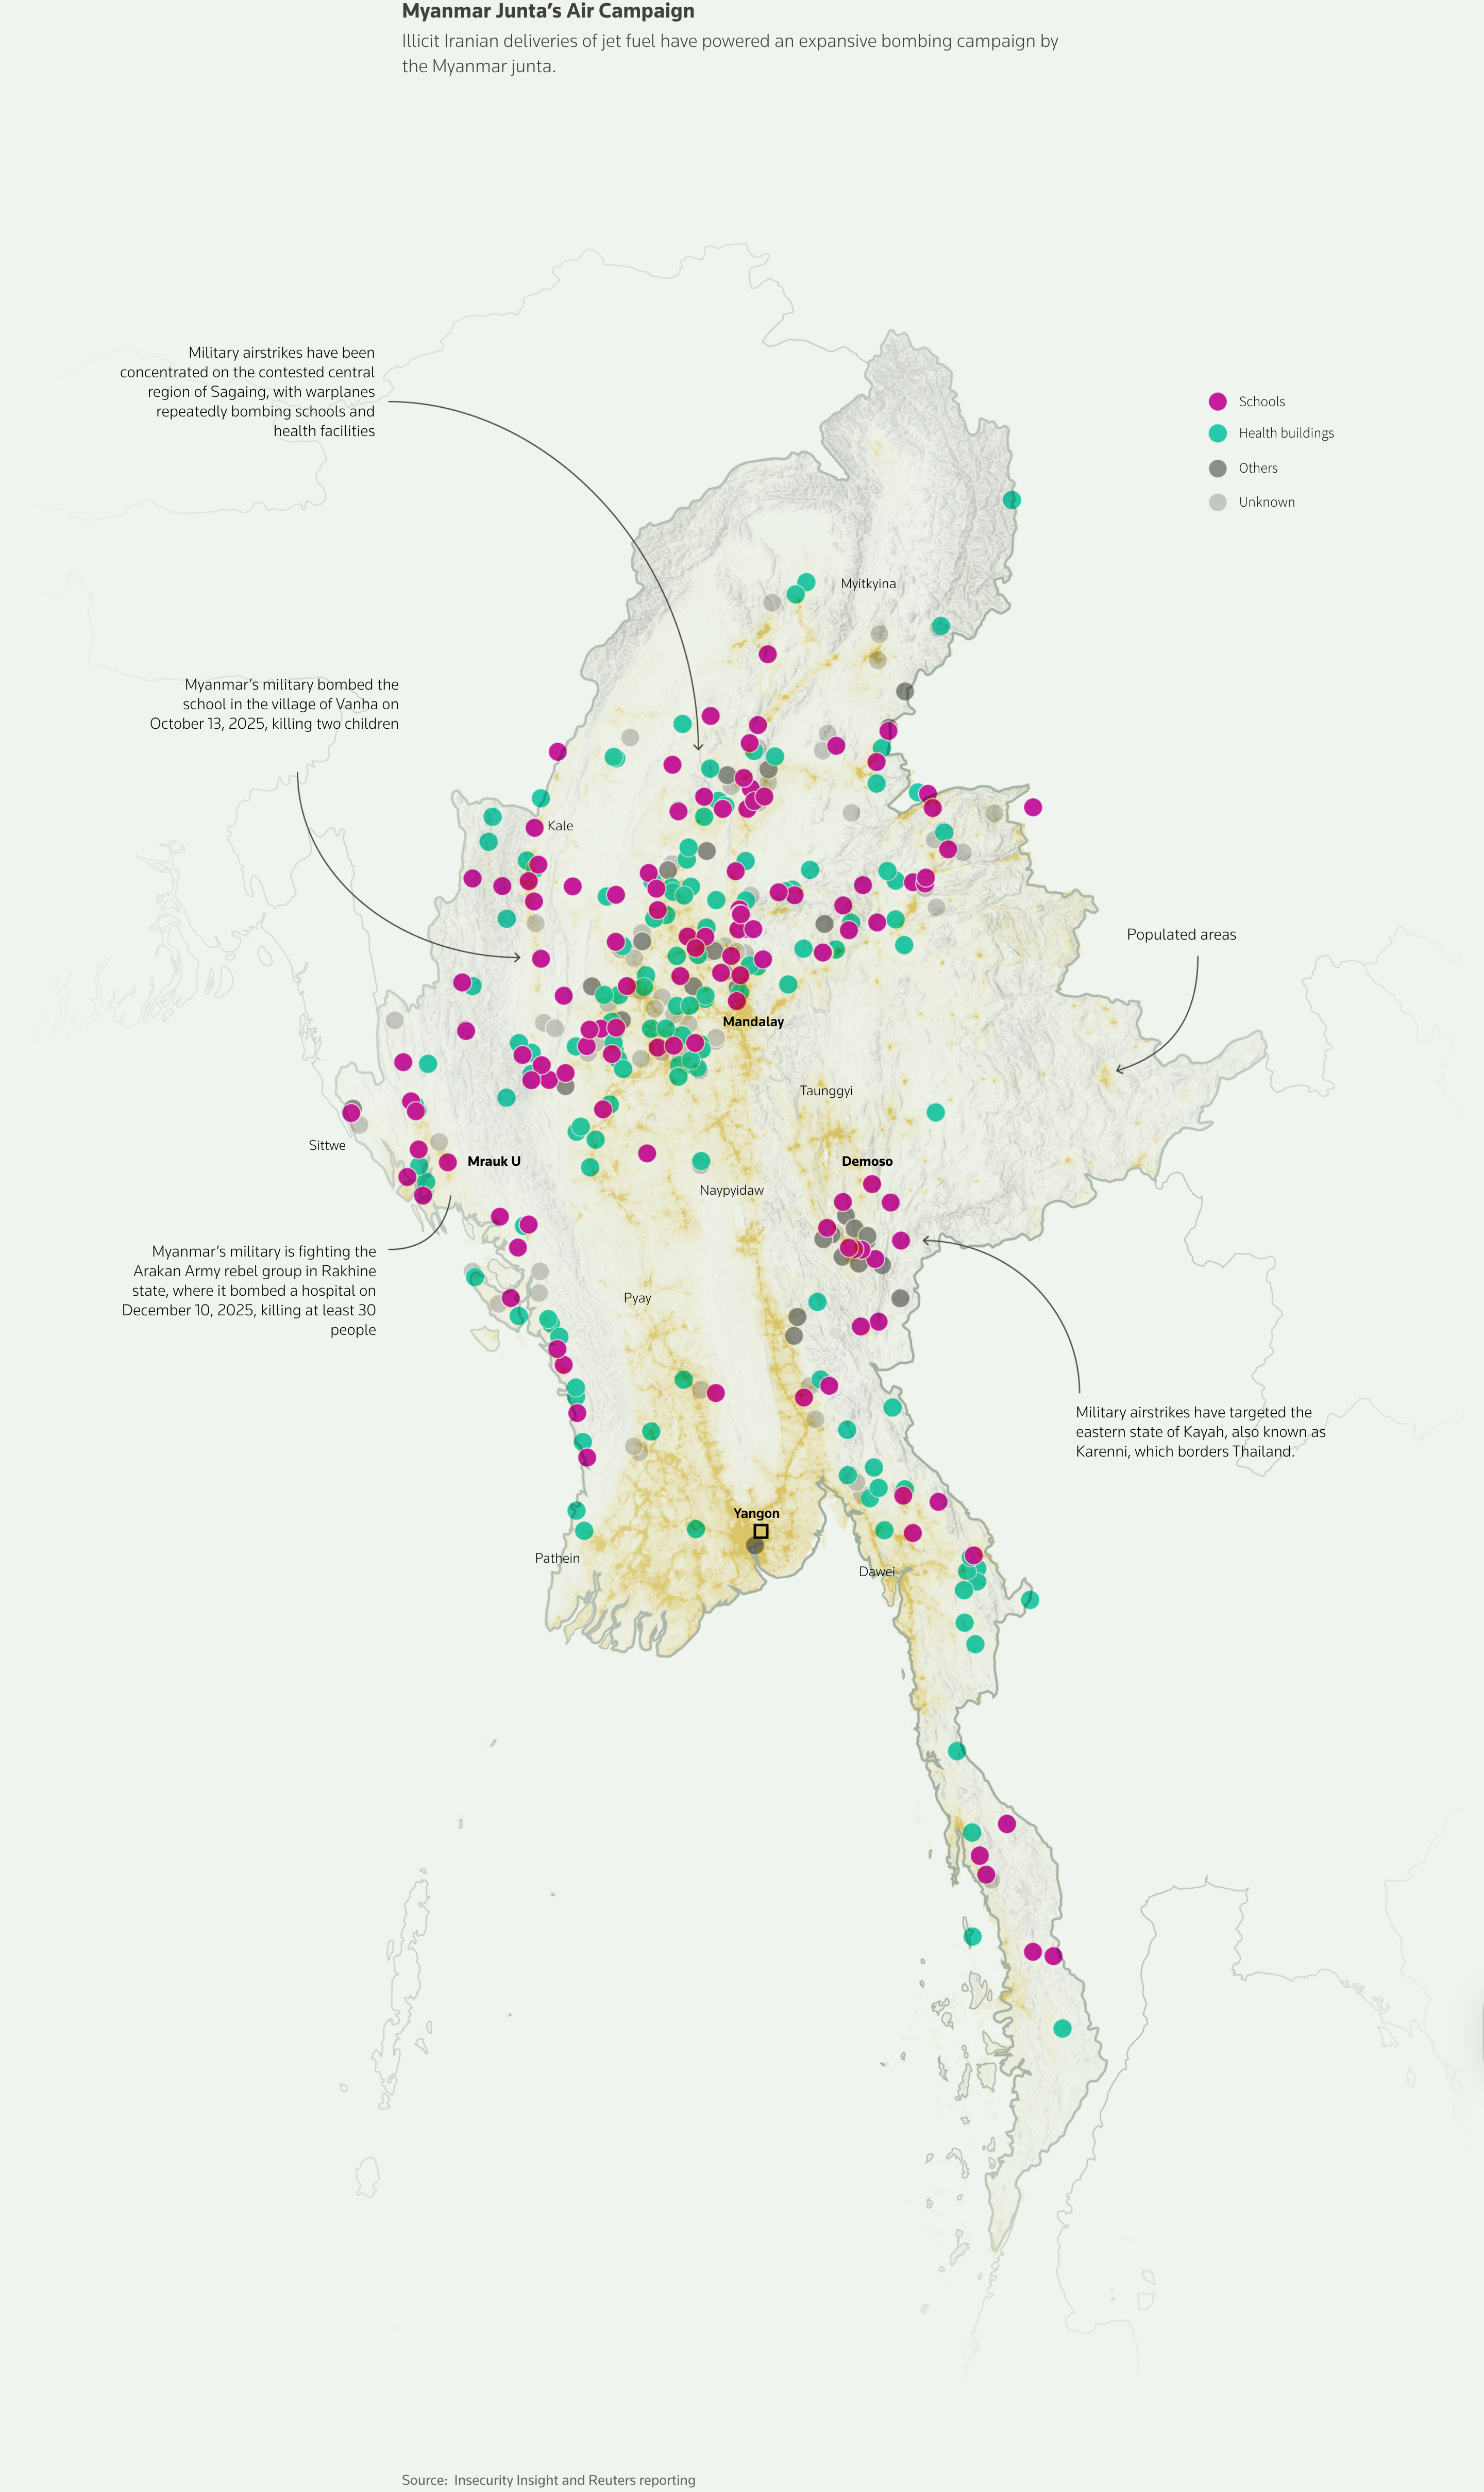
China is training drones based on animal behavior, while Iran supplies fuel to Myanmar.
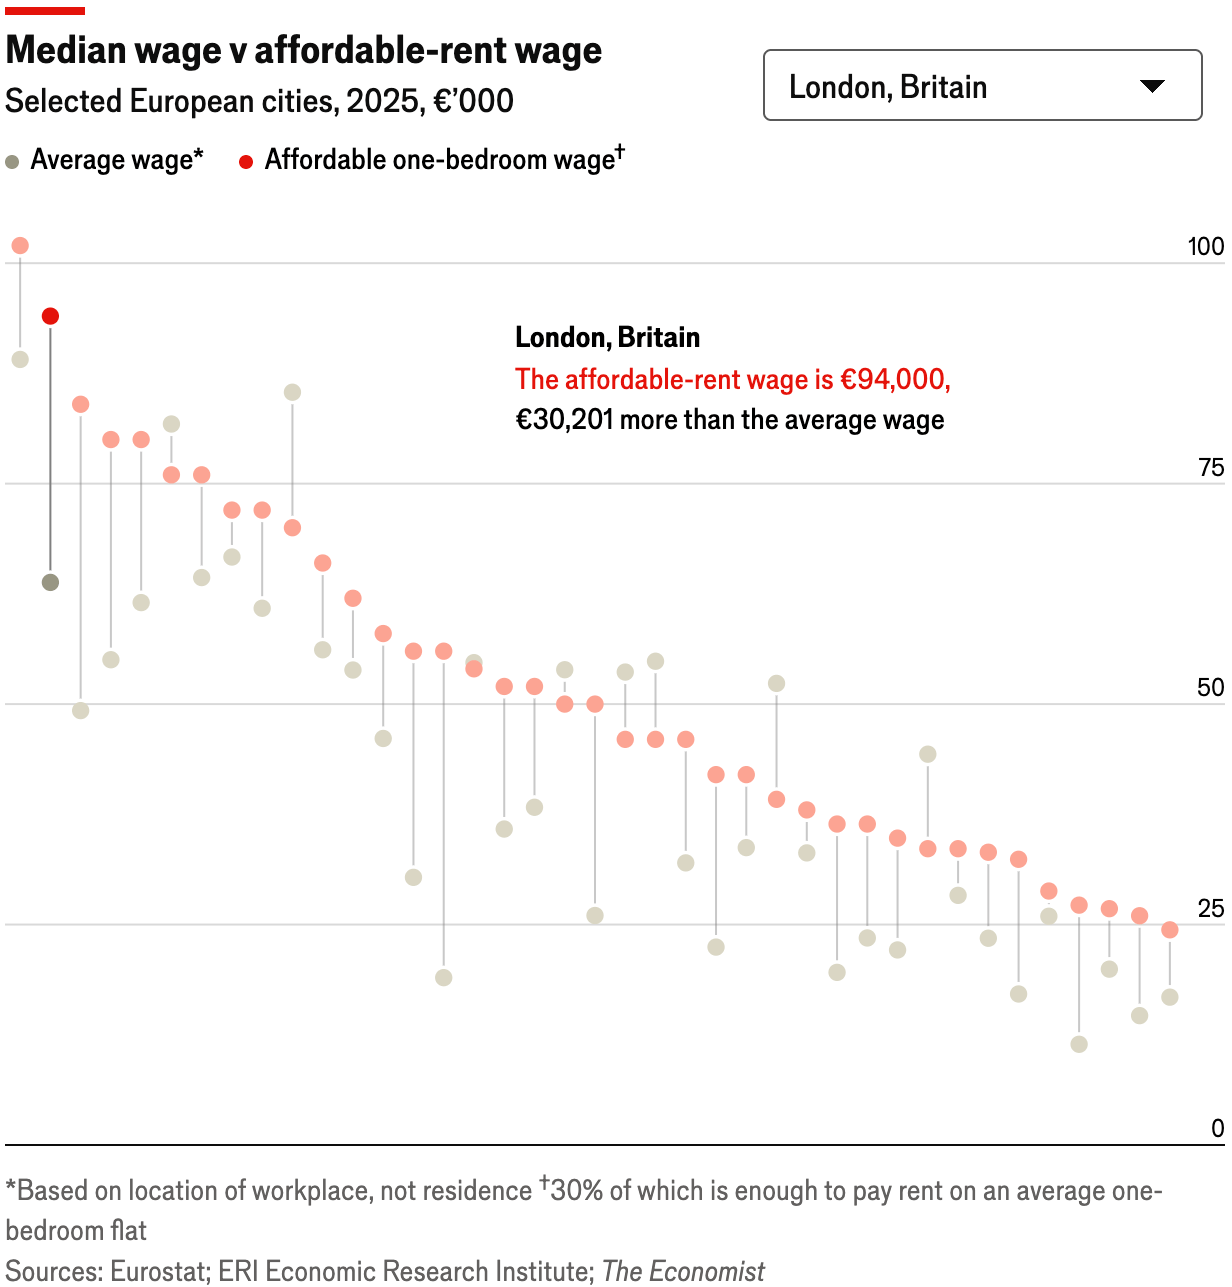
In Europe, people are moving, changing jobs, traveling to hospitals, and renting apartments.
![DIE ZEIT: <a href="https://www.zeit.de/arbeit/2026-01/berufswechsel-branche-job-kuendigung"><strong>Jobwechsel? In diesen Branchen bewegt sich was</strong></a> [Chart description: <em>Stay or go? Many professionals ask themselves this question. Those who change jobs usually do not opt for a completely new start. Around 57 percent remain in their industry</em>], January 22](https://datawrapper.de/cdn-cgi/image/quality=85,width=1452,f=auto,fit=cover/https://kirby.datawrapper.de/media/pages/blog/data-vis-dispatch-january-27-2026/7e7ea60936-1769541873/cleanshot-2026-01-27-at-20.24.05@2x.png)
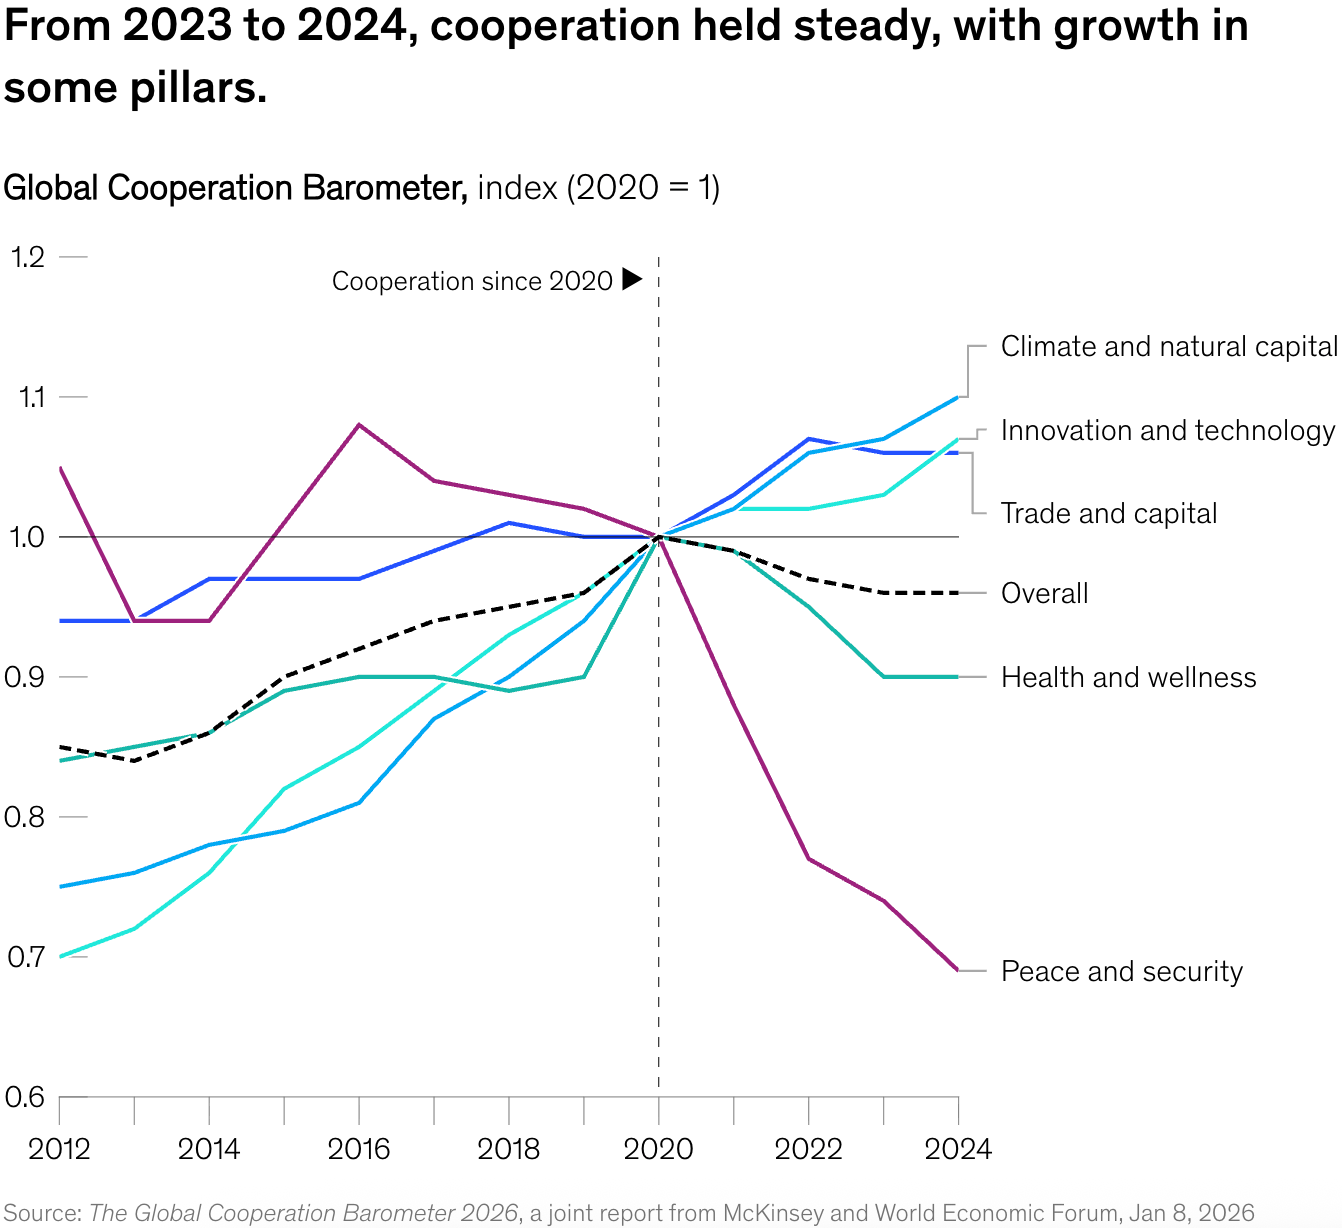
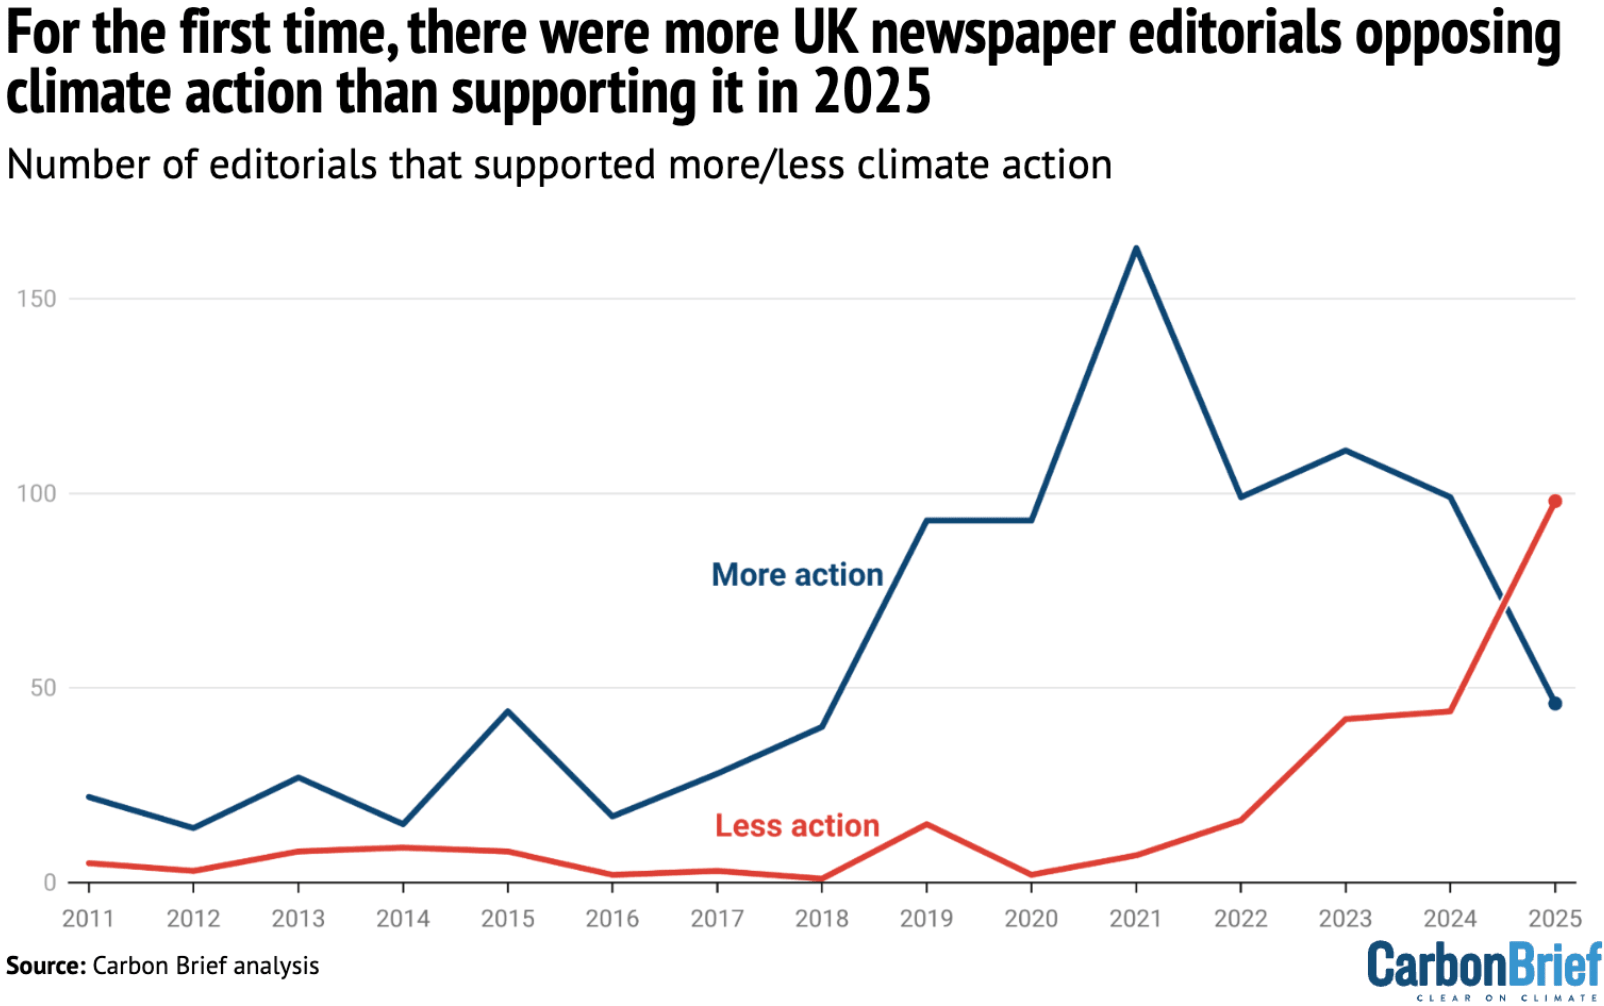
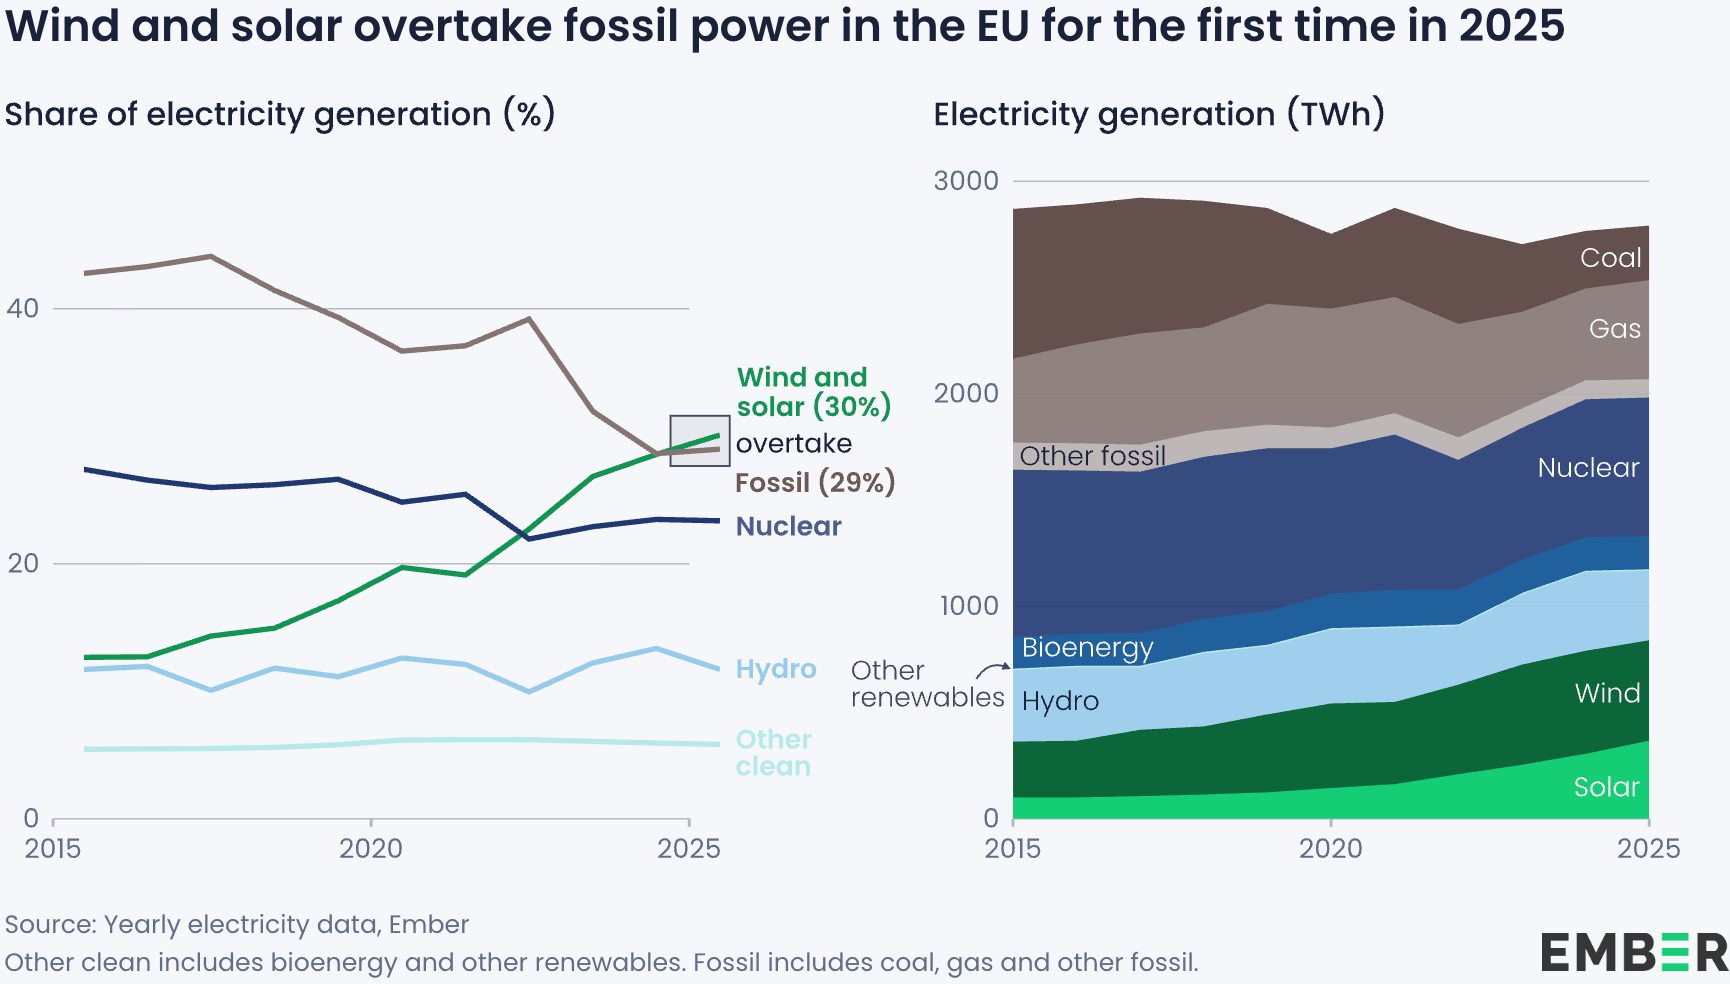
Finally, while global cooperation on peace and security has decreased, climate cooperation seems to have gone up. And even though climate action lacked support in the U.K. media last year, there"s other good news: wind and solar power overtook fossil fuels in the EU for the first time.
What else we found interesting

Applications are open for…
a working student to curate the Dispatch here at Datawrapper!🗞️
a graphics reporter (deleted data project) at The Guardian
a data storyteller at Kontinentalist
a mentor at Data Visualization Society


