Data Vis Dispatch, July 1: Tanker traffic, N.Y.C. elections, and the race for renewables

Welcome back to the 199th edition of Data Vis Dispatch! Every week, we’ll be publishing a collection of the best small and large data visualizations we find, especially from news organizations — to celebrate data journalism, data visualization, simple charts, elaborate maps, and their creators.
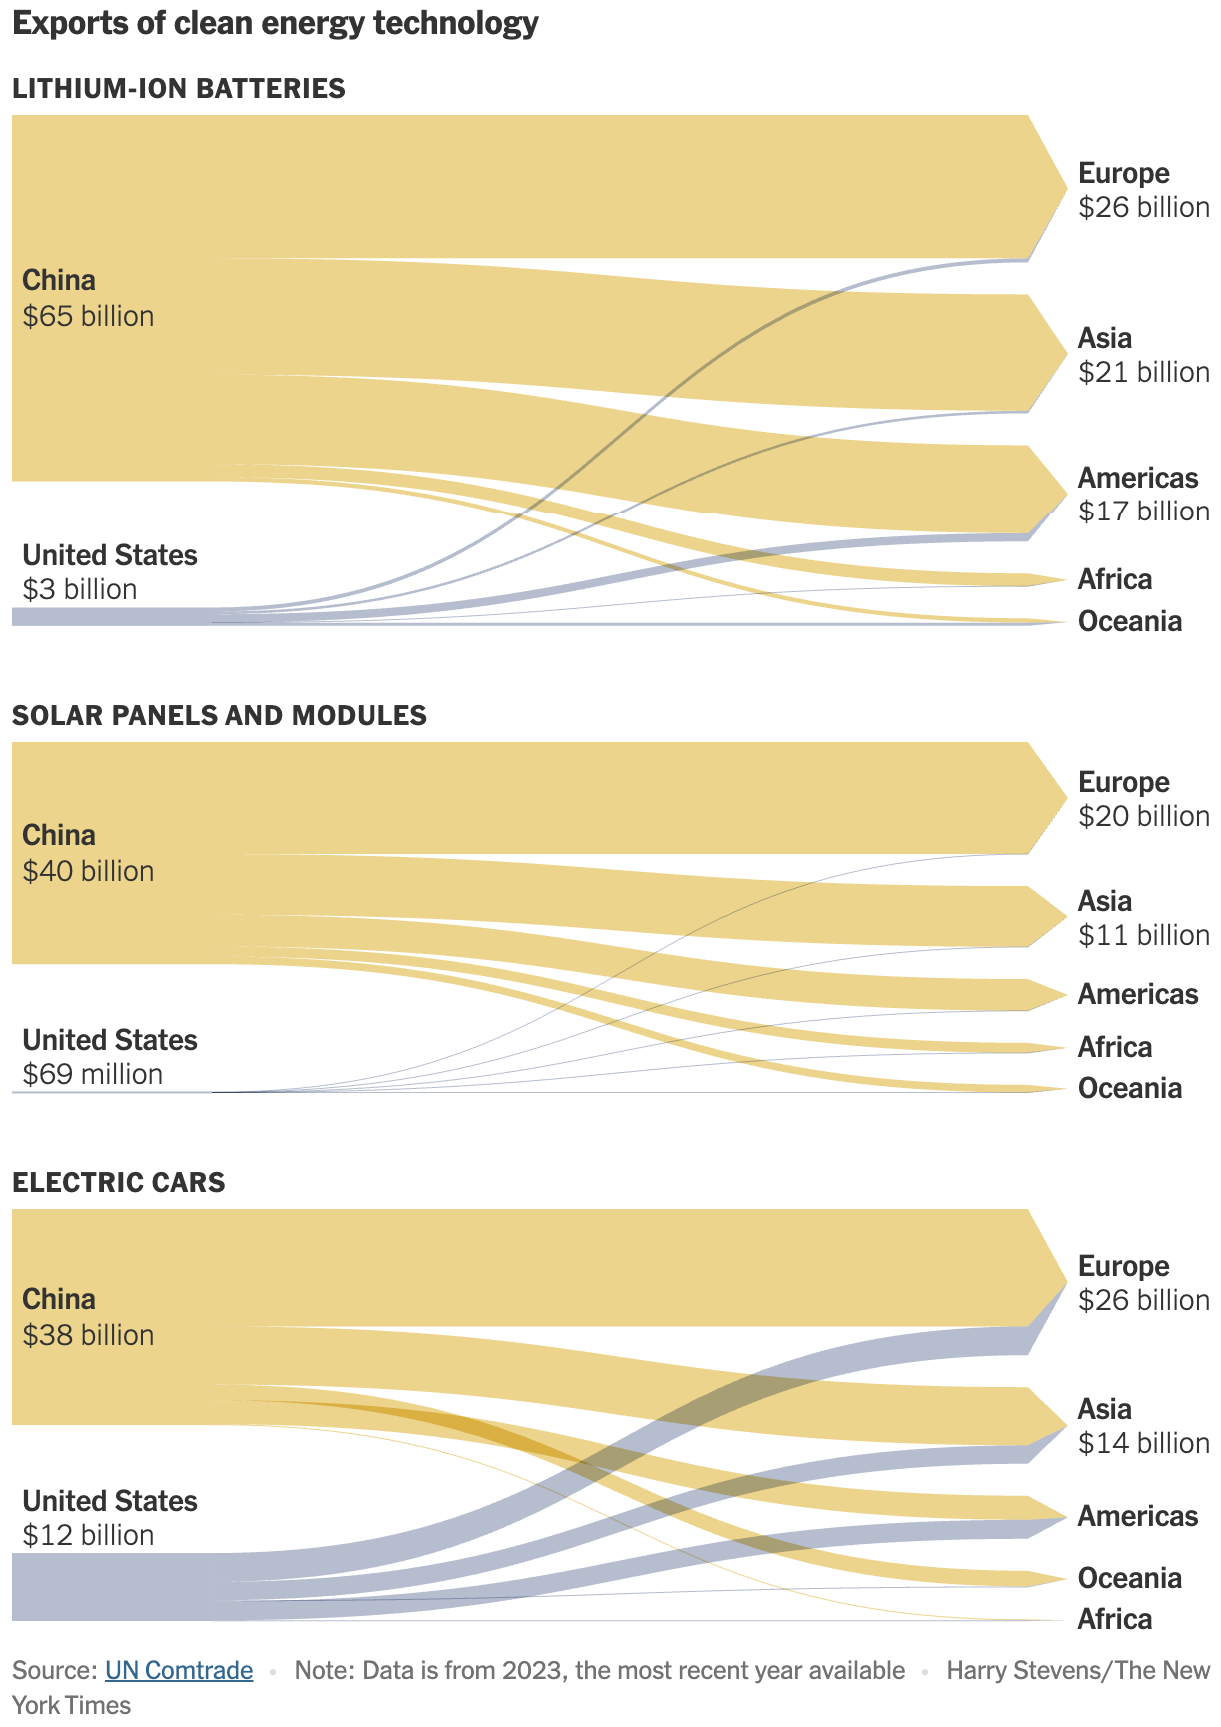
Recurring topics this week include the global role of tanker traffic, mayoral elections in New York City, and international comparisons in the race for renewable energy.
A new focus emerged in this week's reporting about the Middle East — tanker traffic around the Strait of Hormuz:
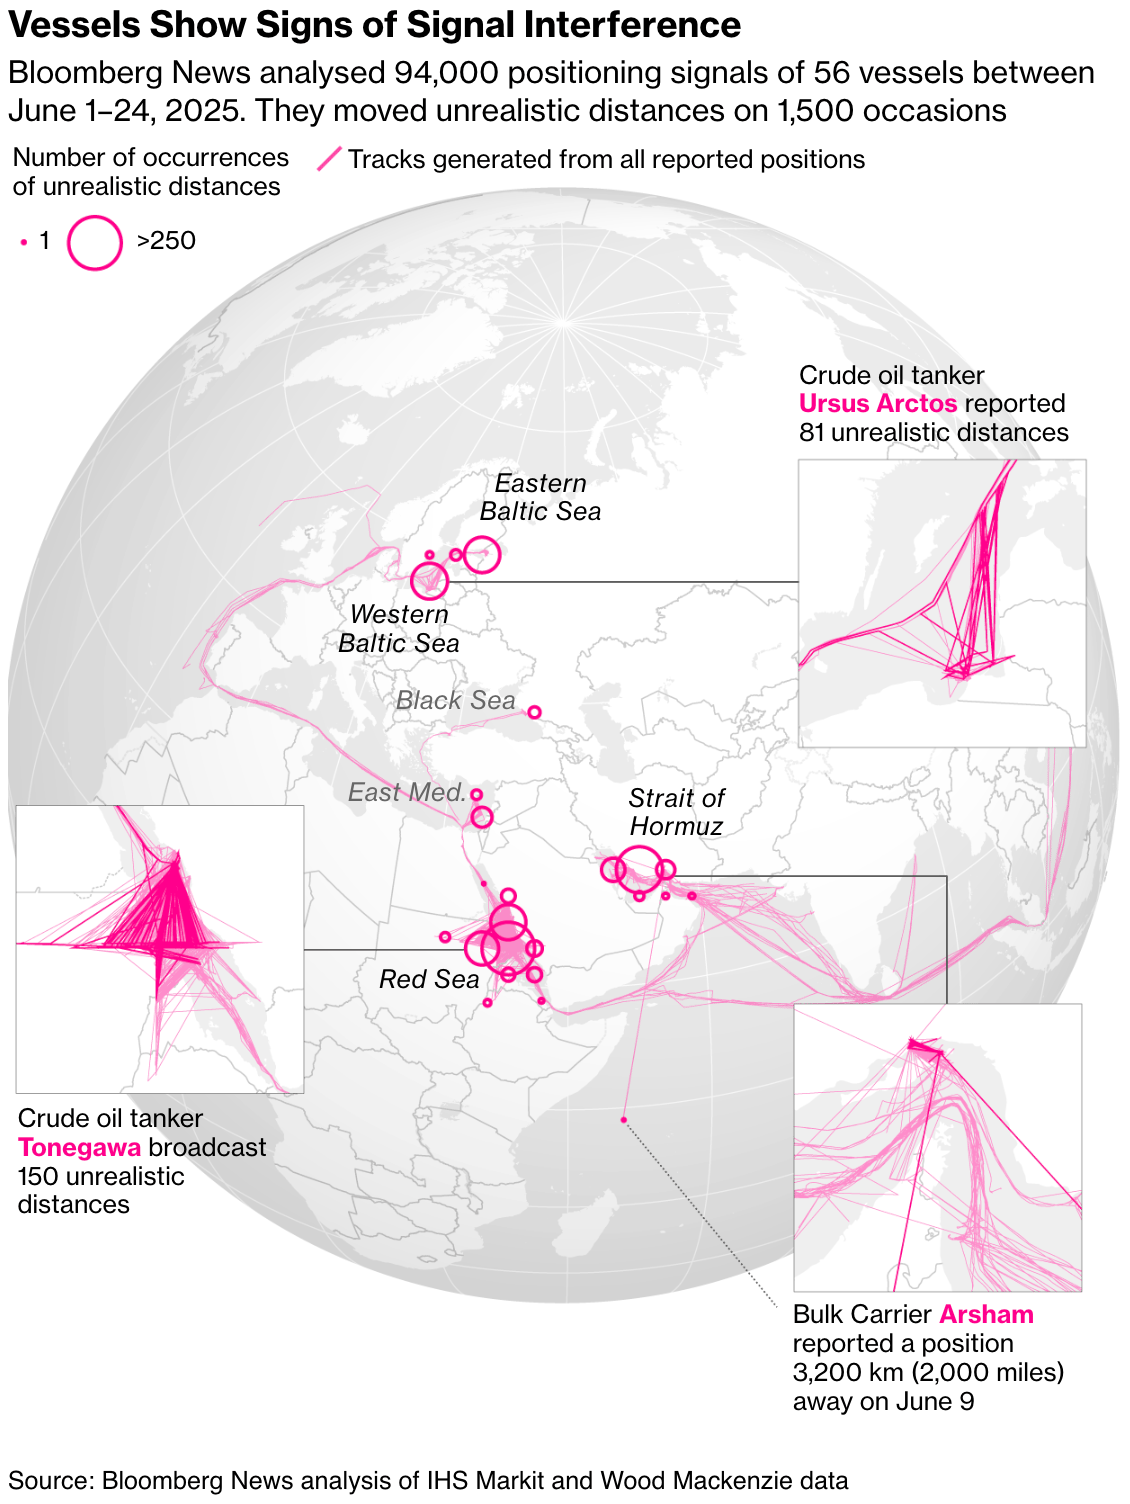
![Der Spiegel: <a href="https://www.spiegel.de/wissenschaft/iran-israel-konflikt-was-die-strasse-von-hormus-und-andere-nadeloehre-fuer-die-energiemaerkte-bedeuten-a-8c14508d-6ef5-4f88-a8e8-73184cf5246d"><strong>Wo Tanker ins Schussfeld geraten oder stecken bleiben könnten</strong></a> [<em>Where tankers could come under fire or get stuck</em>], June 26](https://datawrapper.de/cdn-cgi/image/quality=85,width=843,f=auto,fit=cover/https://kirby.datawrapper.de/media/pages/blog/data-vis-dispatch-july-1-2025/ddf5c7a38b-1751362100/cleanshot-2025-07-01-at-11.26.54@2x.png)
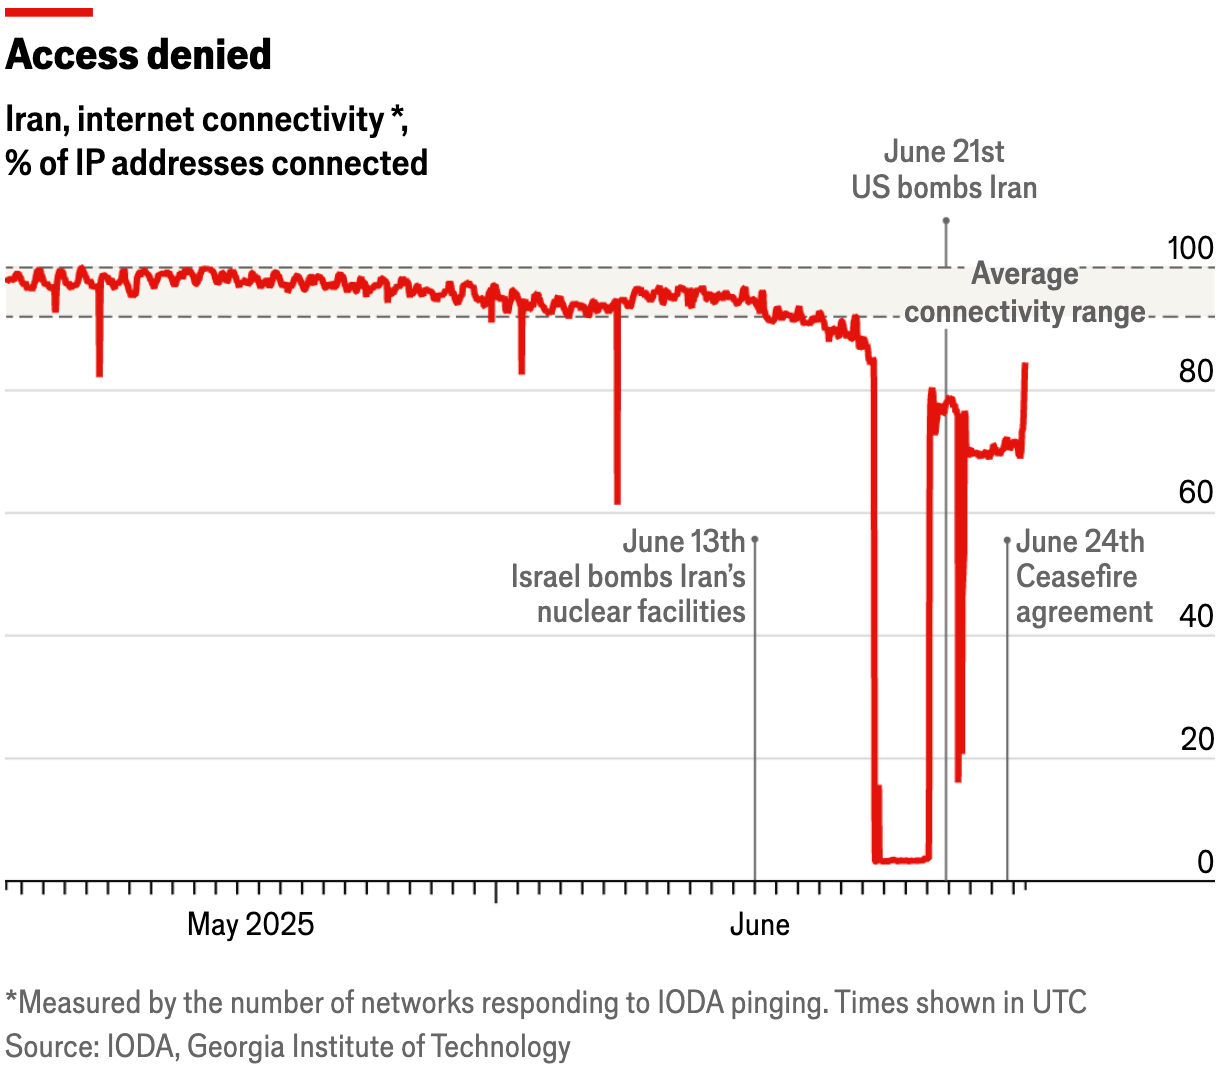
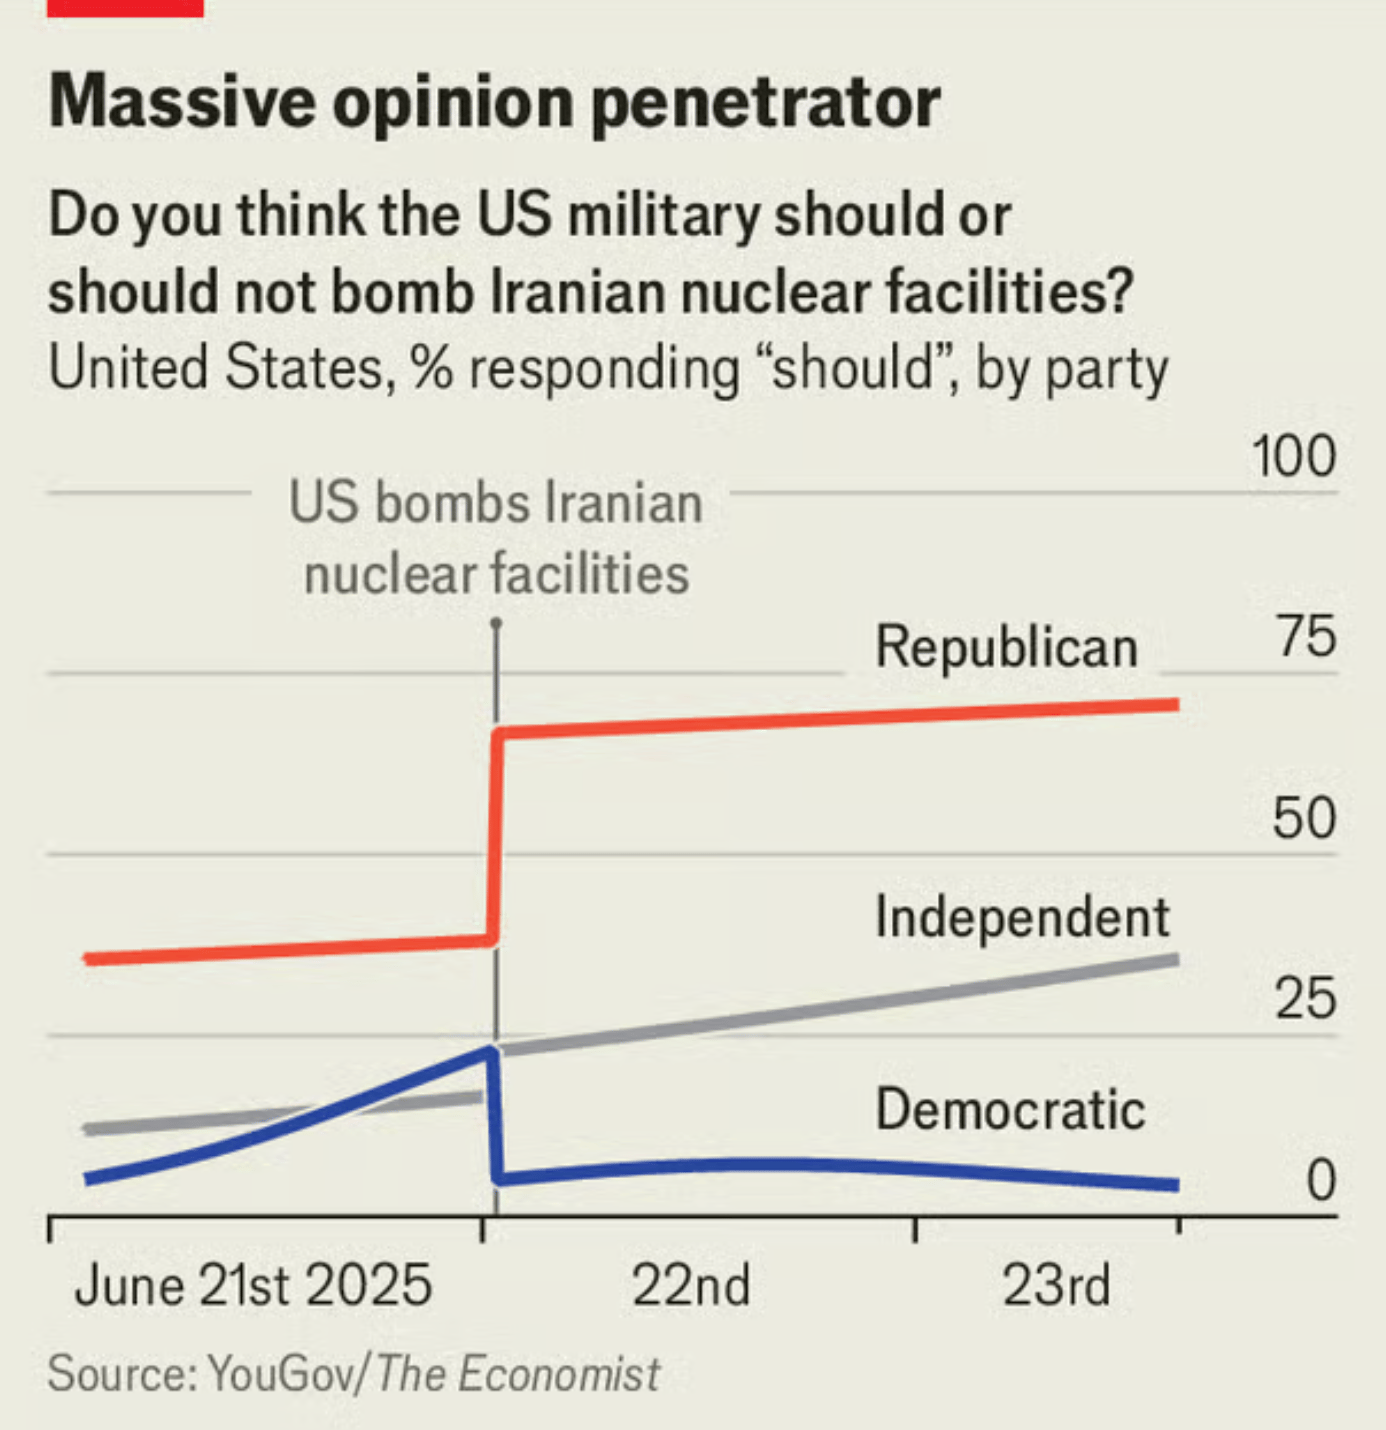
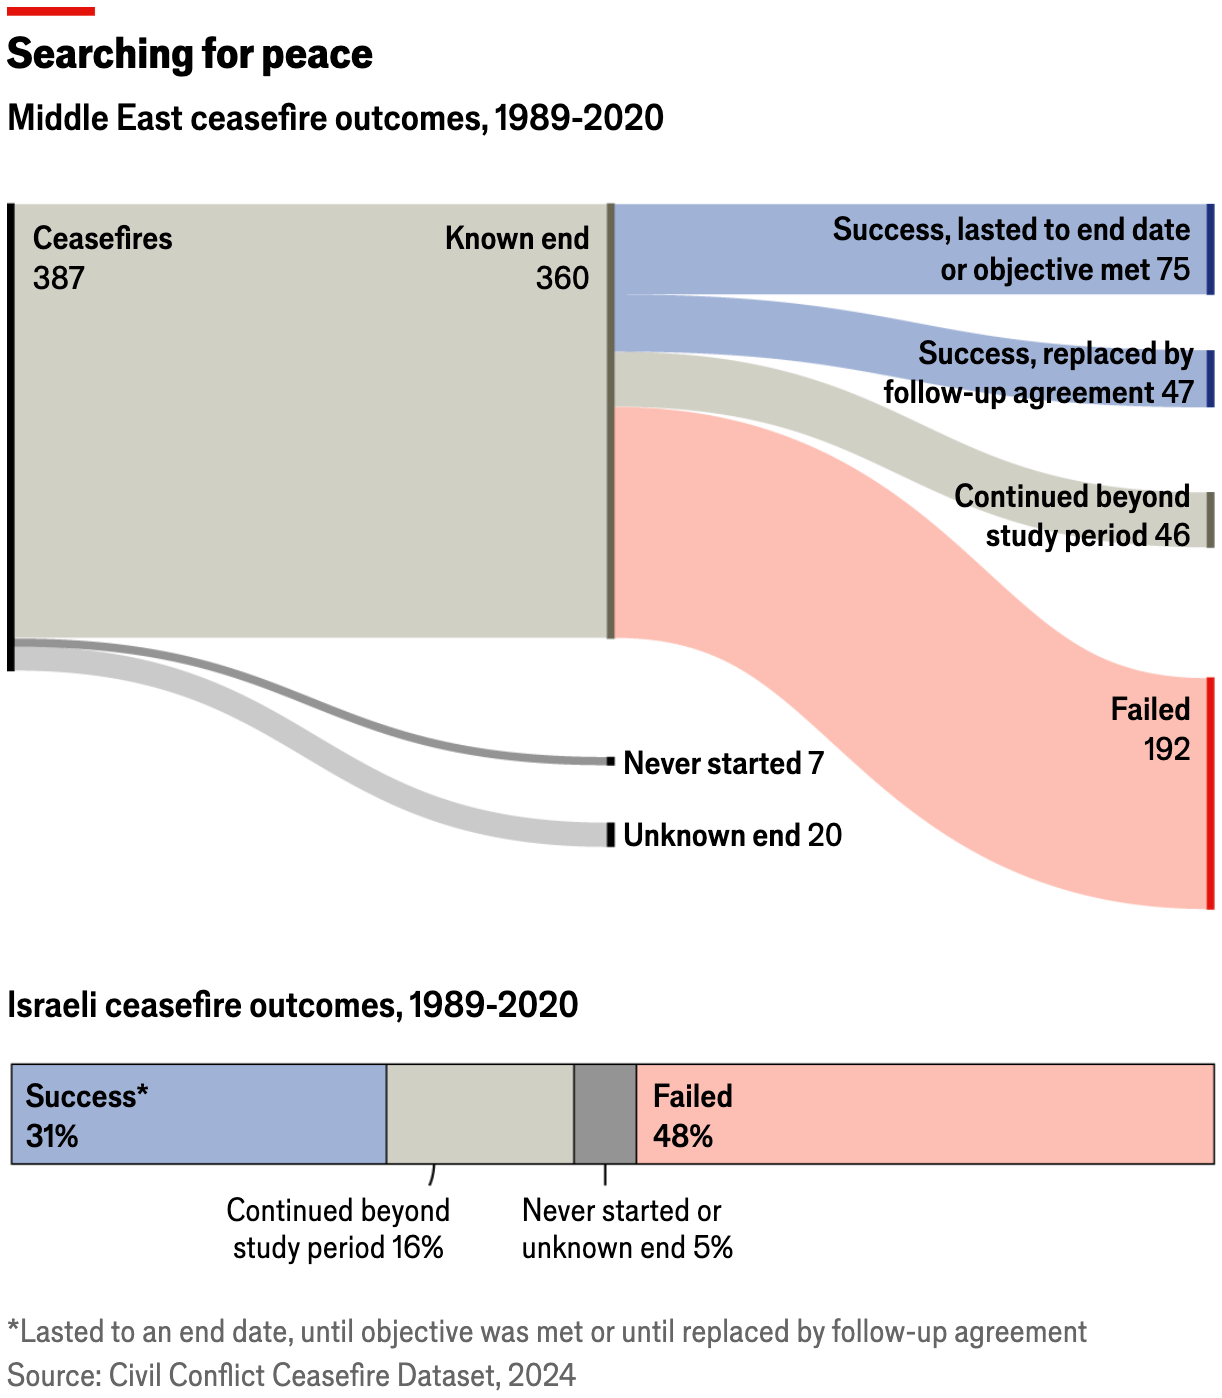
Other developments related to the bombing and subsequent ceasefire in Iran, were examined by The Economist:
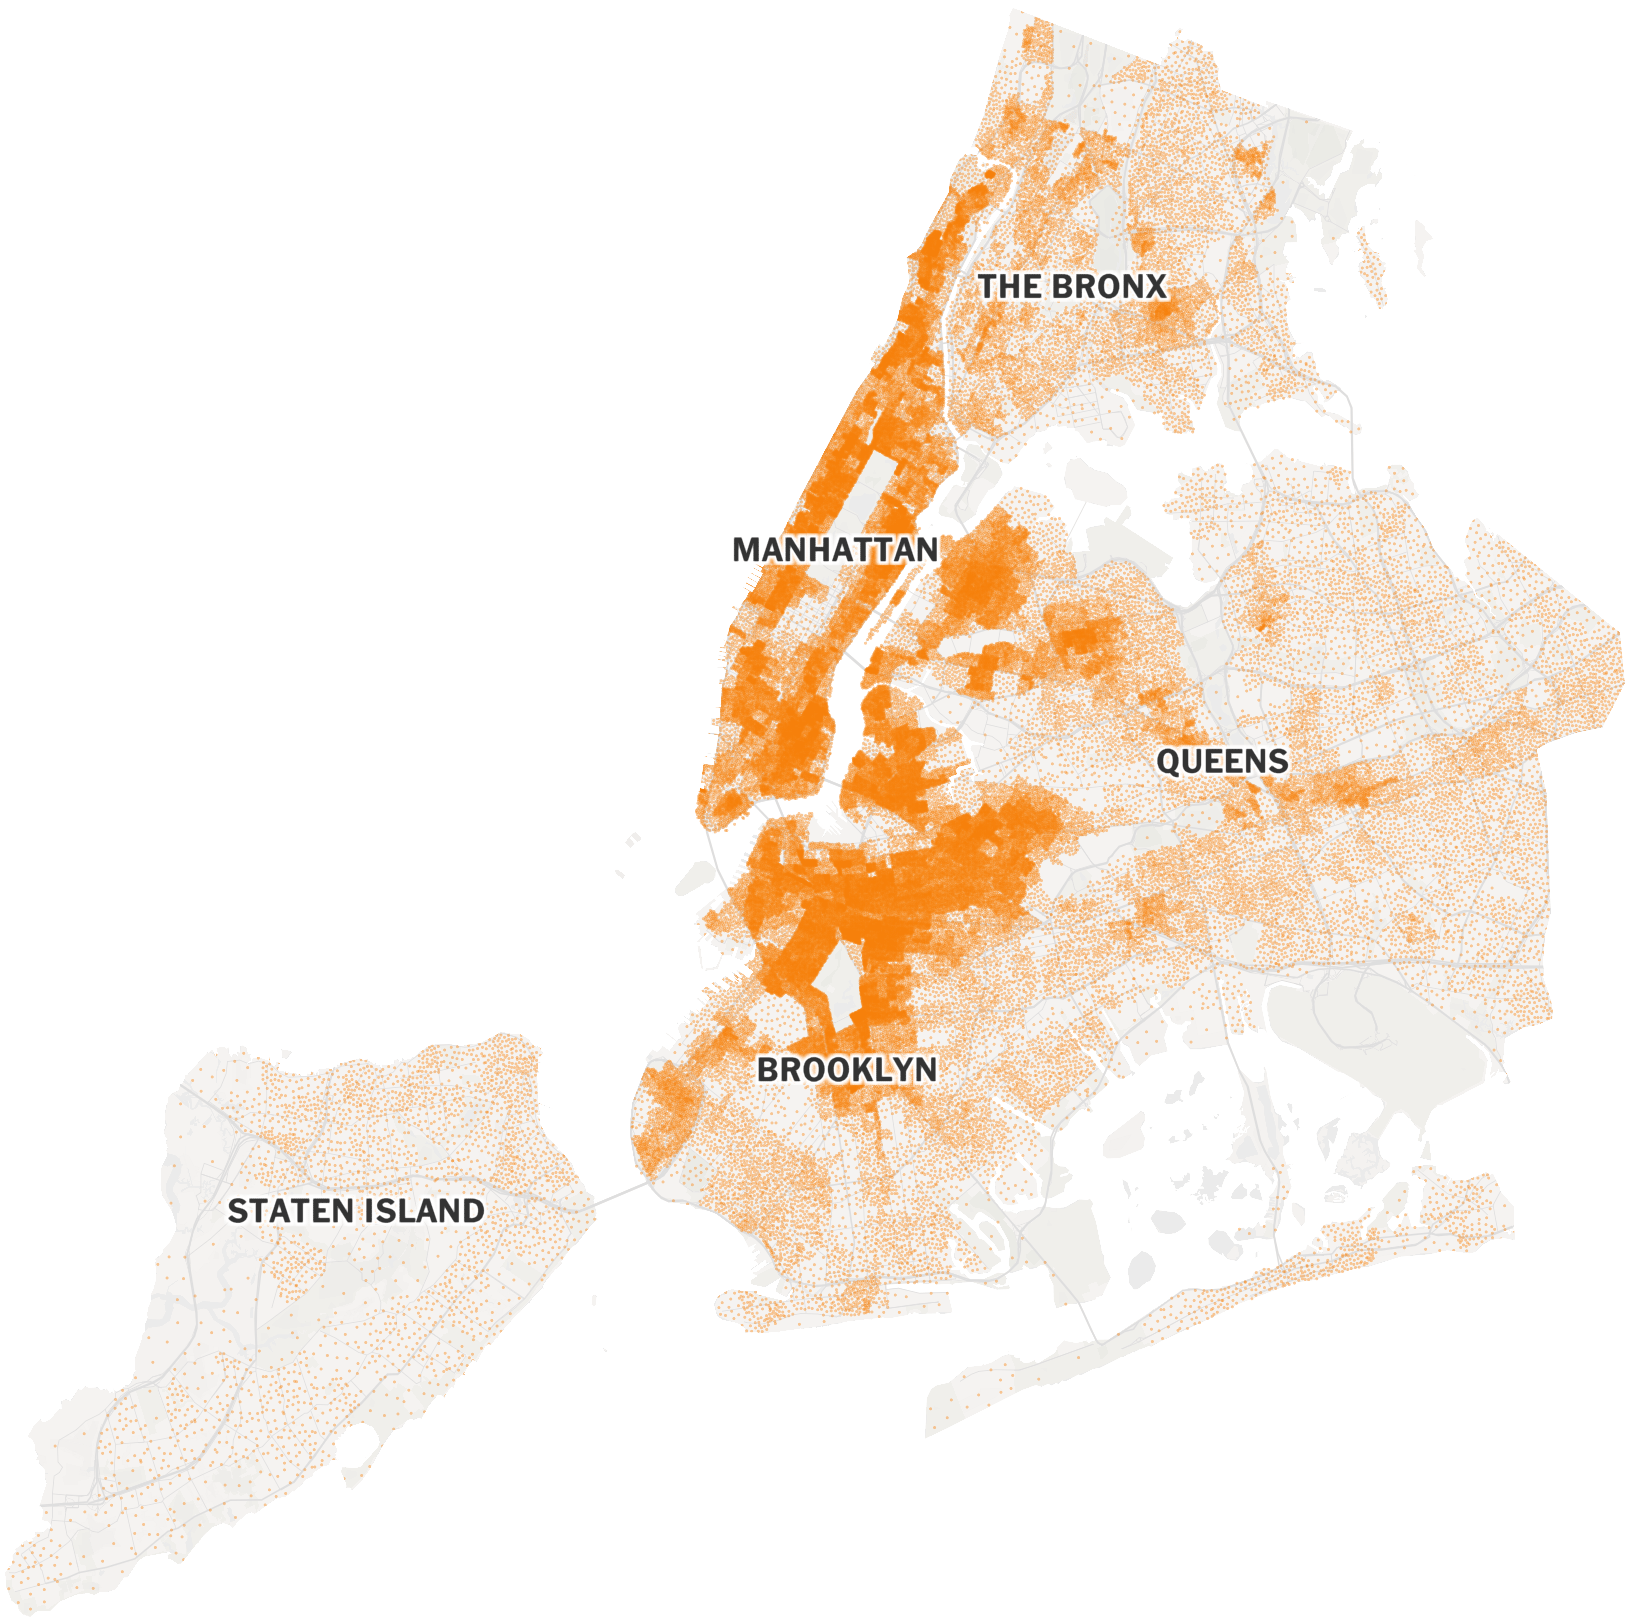
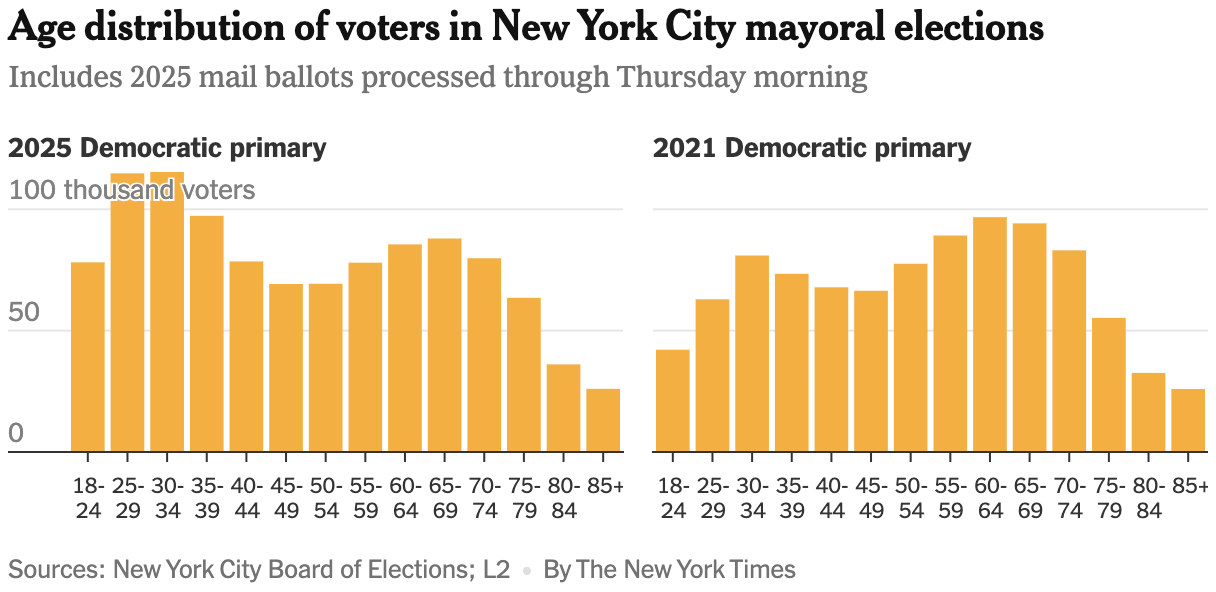
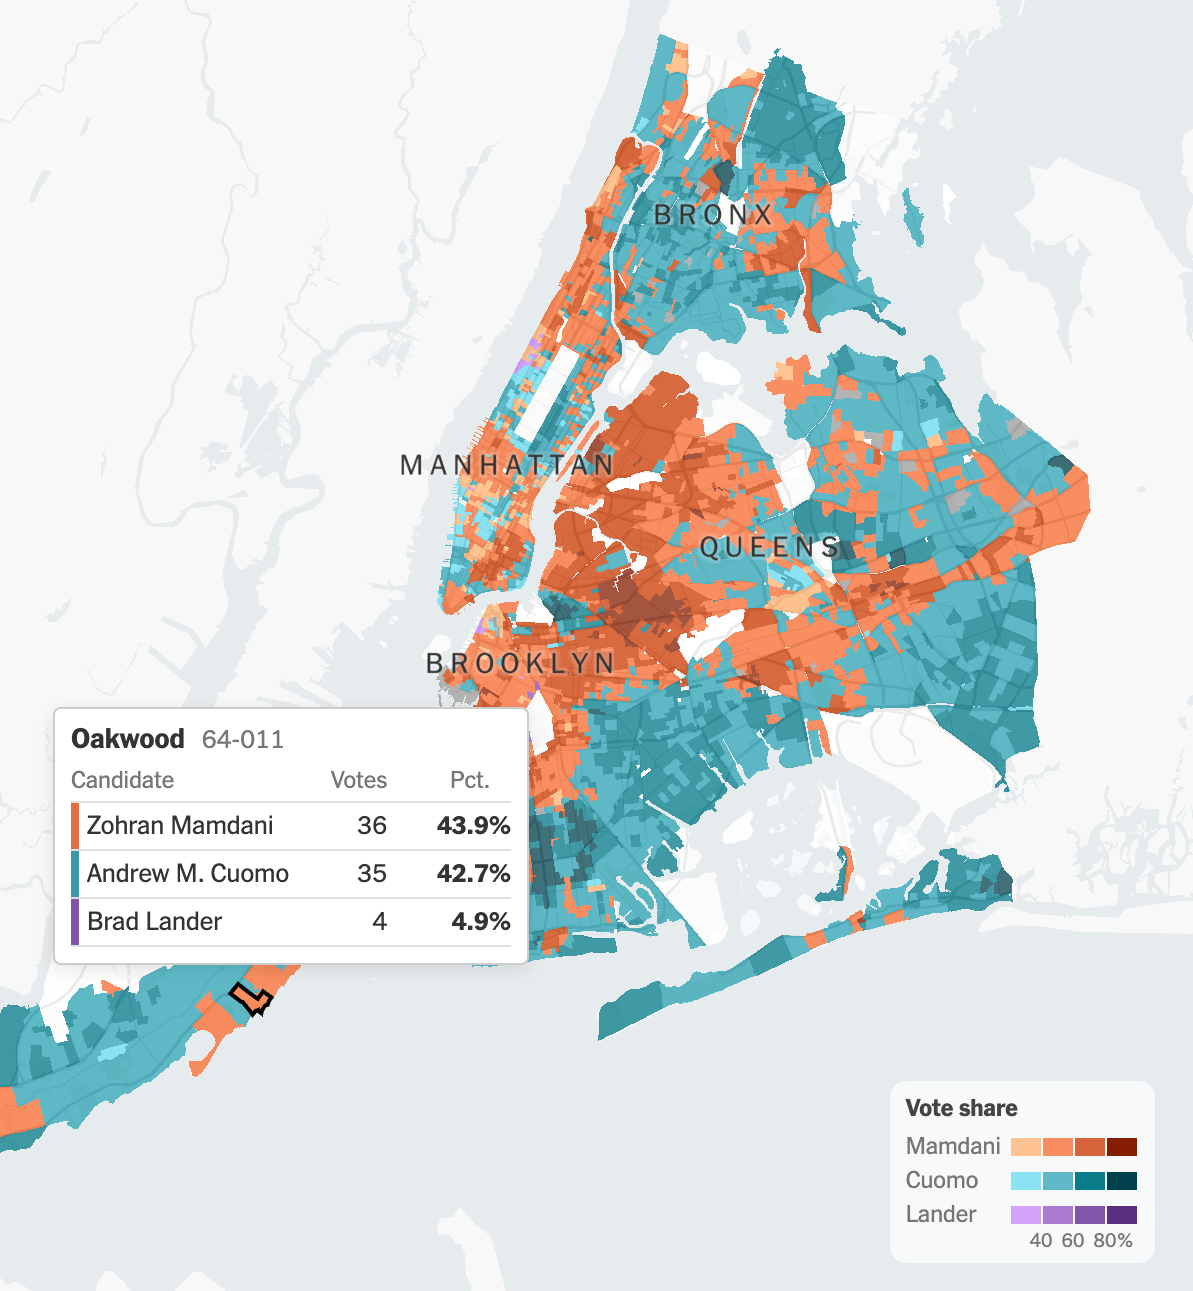
The surprising victory of Zohran Mamdani in New York City's mayoral primary was unsurprisingly well-covered by The New York Times:
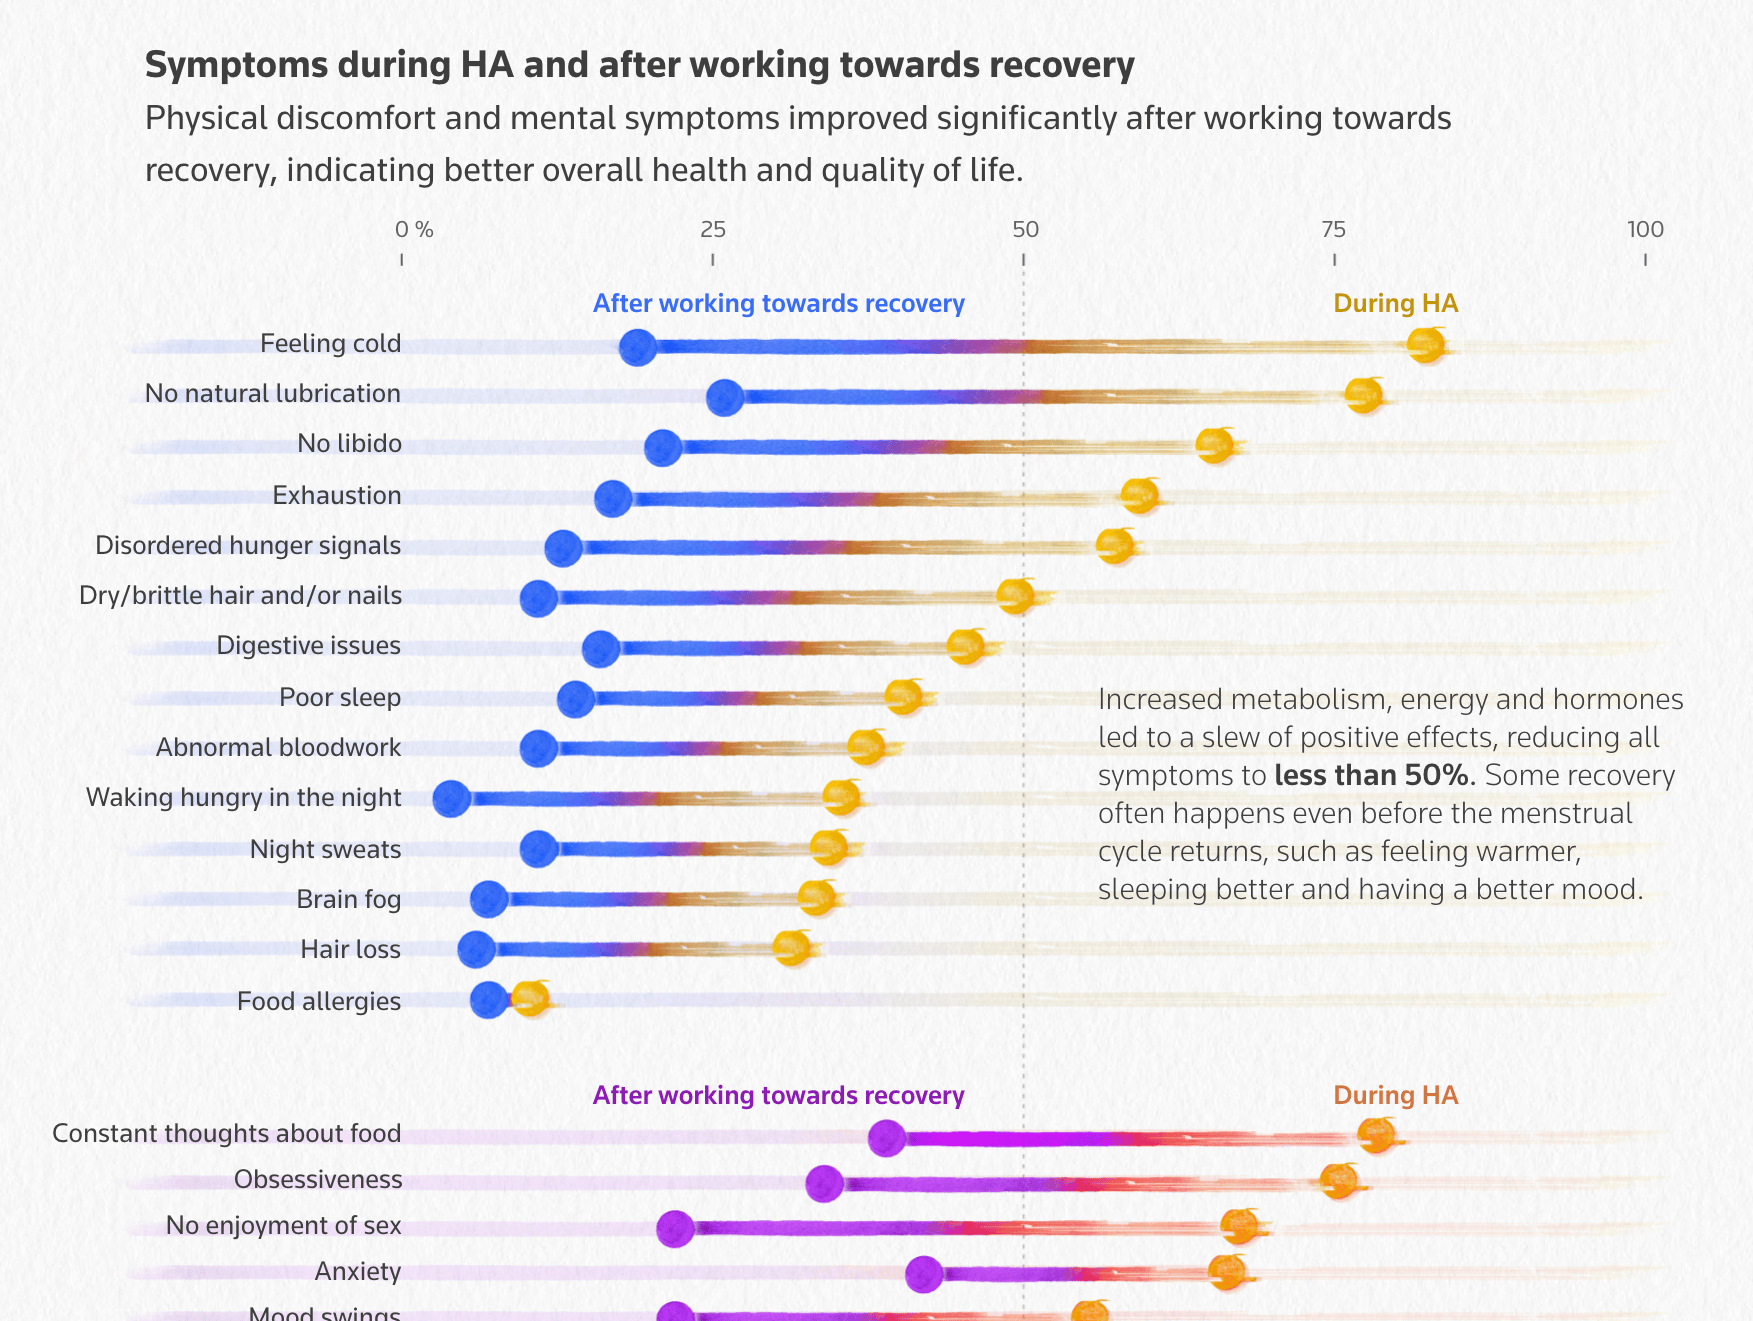
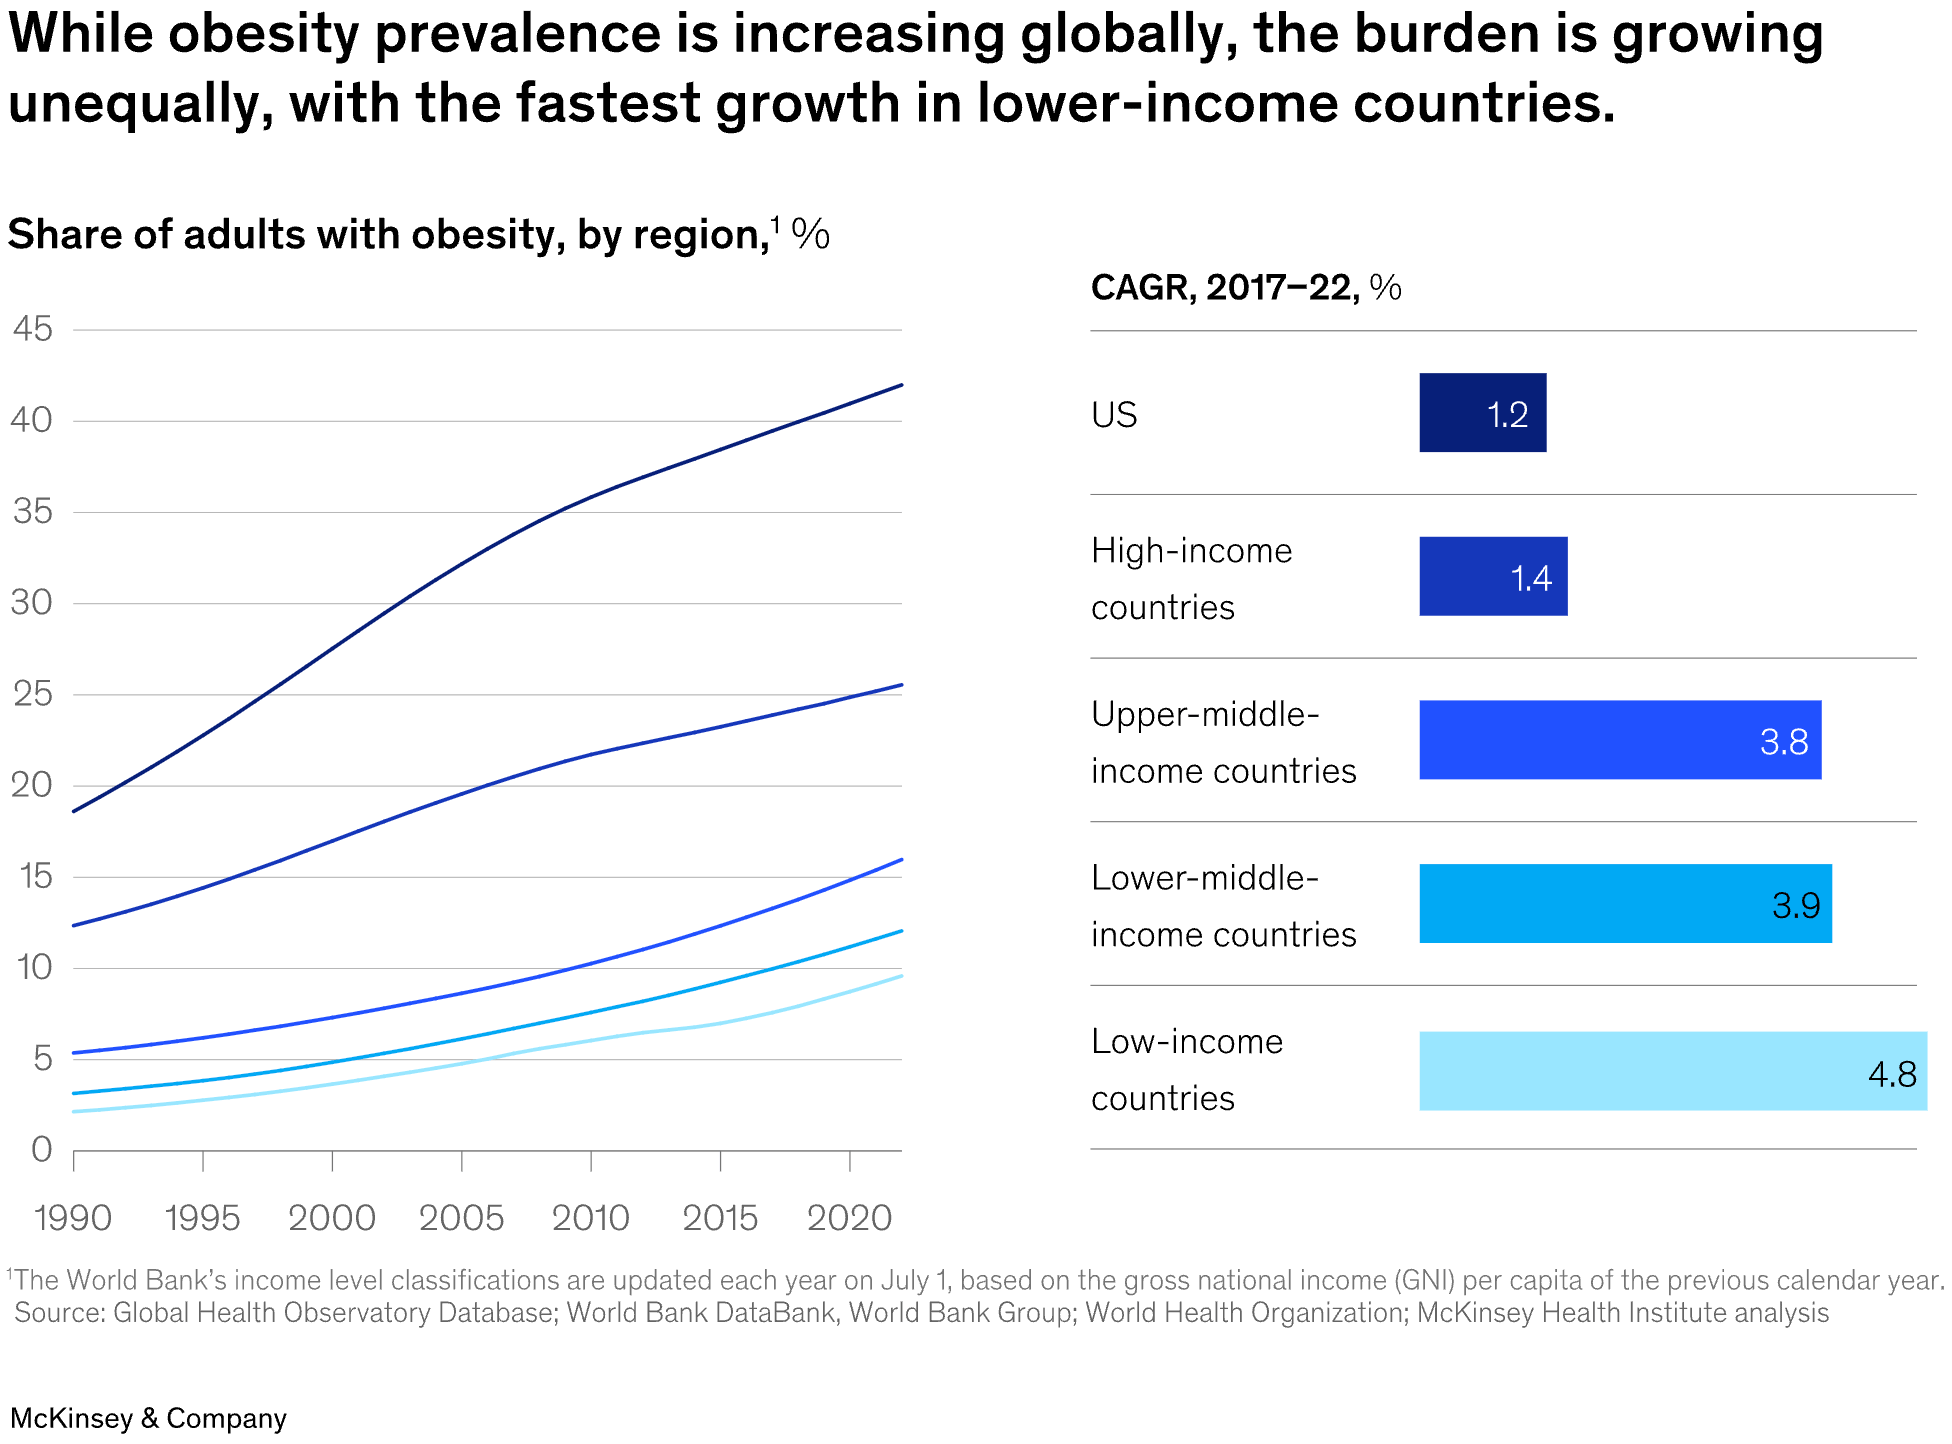
We also found two charts about health issues, a topic we wouldn't mind including more often:
This colorful selection of charts marks the end of this weeks edition, spanning tournaments, democracy, nationalities, interventionism, and sexual orientation:
![Micah McCurdy: "FIFA are also pretty reliable in the 'what if [we] made the tournament structure weird in a way that will make it challenging to viz?' […]," June 30 (<a href="https://bsky.app/profile/hockeyviz.com/post/3lstphjrk6s2a"><strong>Bluesky</strong></a>) <span class="badge">Great thread</span>](https://datawrapper.de/cdn-cgi/image/quality=85,width=1078,f=auto,fit=cover/https://kirby.datawrapper.de/media/pages/blog/data-vis-dispatch-july-1-2025/33179a5c60-1751366179/cleanshot-2025-07-01-at-12.34.18@2x.png)
![Nexo: <a href="https://www.nexojornal.com.br/grafico/2025/06/27/brasil-populacao-estrangeira-censo-2022-venezuela"><strong>Venezuelanos são o maior grupo de estrangeiros no Brasil</strong></a> [<em>Venezuelans are the largest group of foreigners in Brazil</em>], June 27](https://datawrapper.de/cdn-cgi/image/quality=85,width=1194,f=auto,fit=cover/https://kirby.datawrapper.de/media/pages/blog/data-vis-dispatch-july-1-2025/a7b9ae3866-1751369718/cleanshot-2025-07-01-at-13.34.57@2x.png)
![El Orden Mundial: <a href="https://elordenmundial.com/mapas-y-graficos/intervencionismo-estados-unidos-america-latina/"><strong>El intervencionismo de Estados Unidos en América Latina</strong></a><strong> </strong>[<em>US interventionism in Latin America</em>], June 25](https://datawrapper.de/cdn-cgi/image/quality=85,width=1300,f=auto,fit=cover/https://kirby.datawrapper.de/media/pages/blog/data-vis-dispatch-july-1-2025/eaf36bc14e-1751368014/mapa-intervencionismo-estados-unidos-america-latina-25.png.webp)
![WeVis: <a href="https://wevis.info/thaidemocracyin2025/"><strong>9 ทศวรรษ อภิวัฒน์สยาม : ประชาธิปไตยไทยวันนี้ อยู่จุดไหนในโลก?</strong></a> [<em>9 Decades of the Siamese Revolution: Where is Thai Democracy Today in the World?</em>], June 24](https://datawrapper.de/cdn-cgi/image/quality=85,width=1494,f=auto,fit=cover/https://kirby.datawrapper.de/media/pages/blog/data-vis-dispatch-july-1-2025/b5c80749ce-1751367909/cleanshot-2025-07-01-at-13.03.59@2x.png)
![Beyond Words Studio: "[…] In the UK, a growing number of people of all ages are identifying as lesbian, gay or bisexual […]," June 27 (<a href="https://www.linkedin.com/posts/beyond-words-studio_with-pride-month-coming-to-a-close-we-wanted-activity-7344316590512848896-51MP?utm_source=share&utm_medium=member_desktop&rcm=ACoAADg6TZkBloZMKNiBJ3SZtJ0Jvy2mEqnIVmA"><strong>LinkedIn</strong></a>)](https://datawrapper.de/cdn-cgi/image/quality=85,width=1032,f=auto,fit=cover/https://kirby.datawrapper.de/media/pages/blog/data-vis-dispatch-july-1-2025/1e7f49f081-1751368115/cleanshot-2025-07-01-at-13.07.12@2x.png)
What else we found interesting


Applications are open for…
A data journalist at Correctiv
A design principal at Clever Franke
A graphics/multimedia editor at The New York Times
Help us make this dispatch better! We’d love to hear which newsletters, blogs, or social media accounts we need to follow to learn about interesting projects, especially from less-covered parts of the world (Asia, South America, Africa). Write us at hello@datawrapper.de or leave a comment below. Want the Dispatch in your inbox every Tuesday? Sign up for our Blog Update newsletter!