Easy Comparison: Dot-Plots
Datawrapper adds new visualization type

David Kokkelink
Dot plots are an amazing way to quickly compare different values in one line. Check out the chart below: It provides a fast overview of the age structure of selected countries:
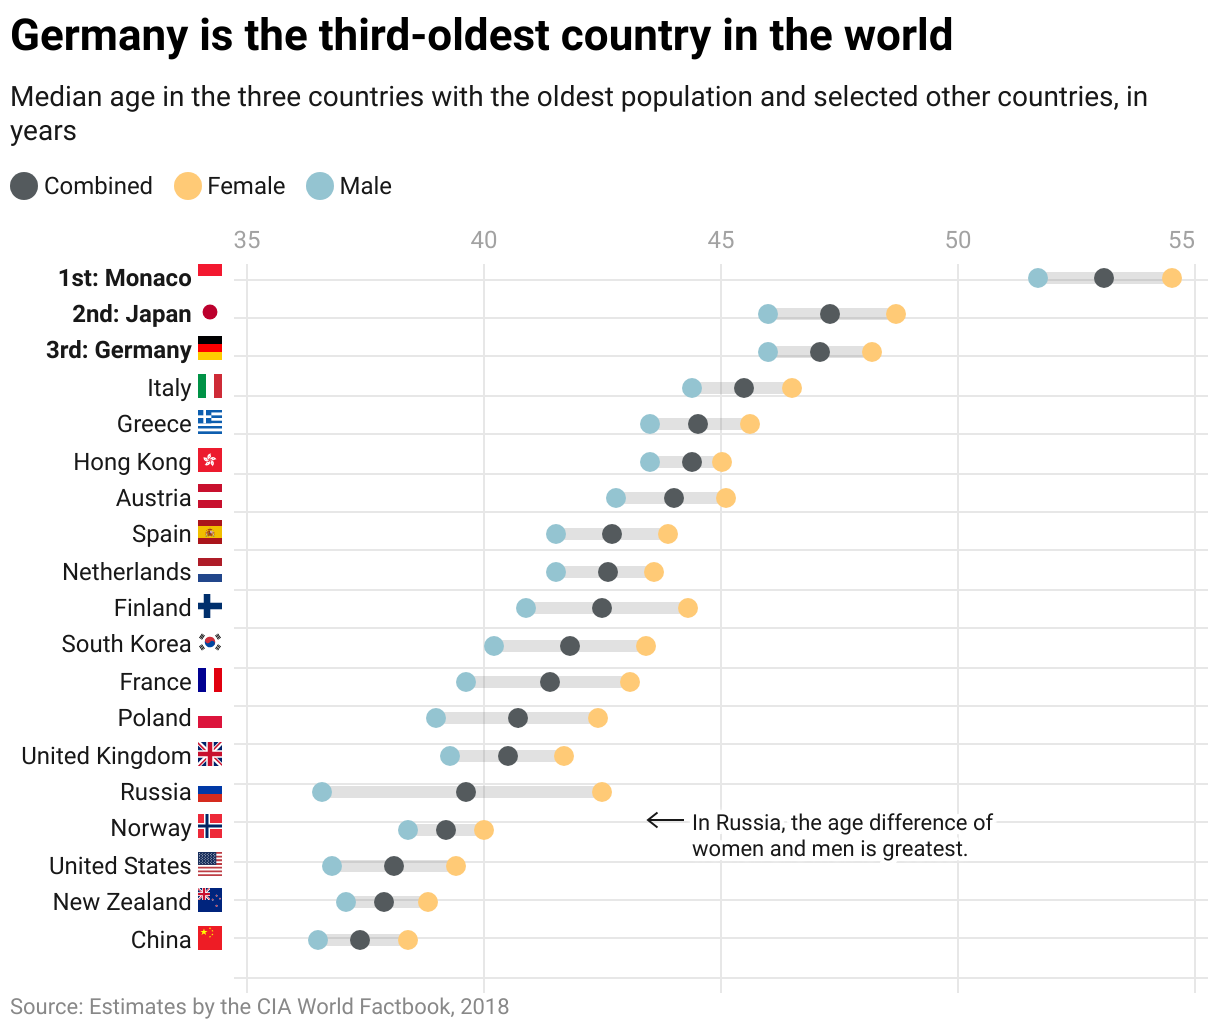
Doing this with bar charts would be nearly impossible. That’s why Datawrapper now offers dot plots: They’re a great way to show ranges, or multiple values for one element, in a quick and information-dense chart.
The link below leads to a tutorial we published in our Datawrapper Academy providing a quick overview of what’s possible now. Check it out, and you’ll be able to create your first dot plot in minutes:


