Updated: Line Charts
Datawrapper releases an entirely new line chart module, letting you tell entire stories using new features

David Kokkelink
Line charts are key for any charting tool. Datawrapper now has an all-new line chart with major enhancements.

Starting today you can tell full stories in just one chart.
Key enhancements:
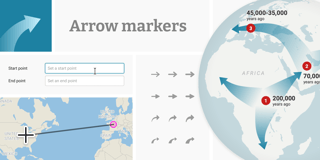
- Customize line widths, strokes and axis labels
- Freely position text and range annotations
- Improved responsiveness on smartphones
Create your first line chart with all the new options now. To find out more about what’s new, check out our post in Datawrapper Academy.