Tables & heatmaps
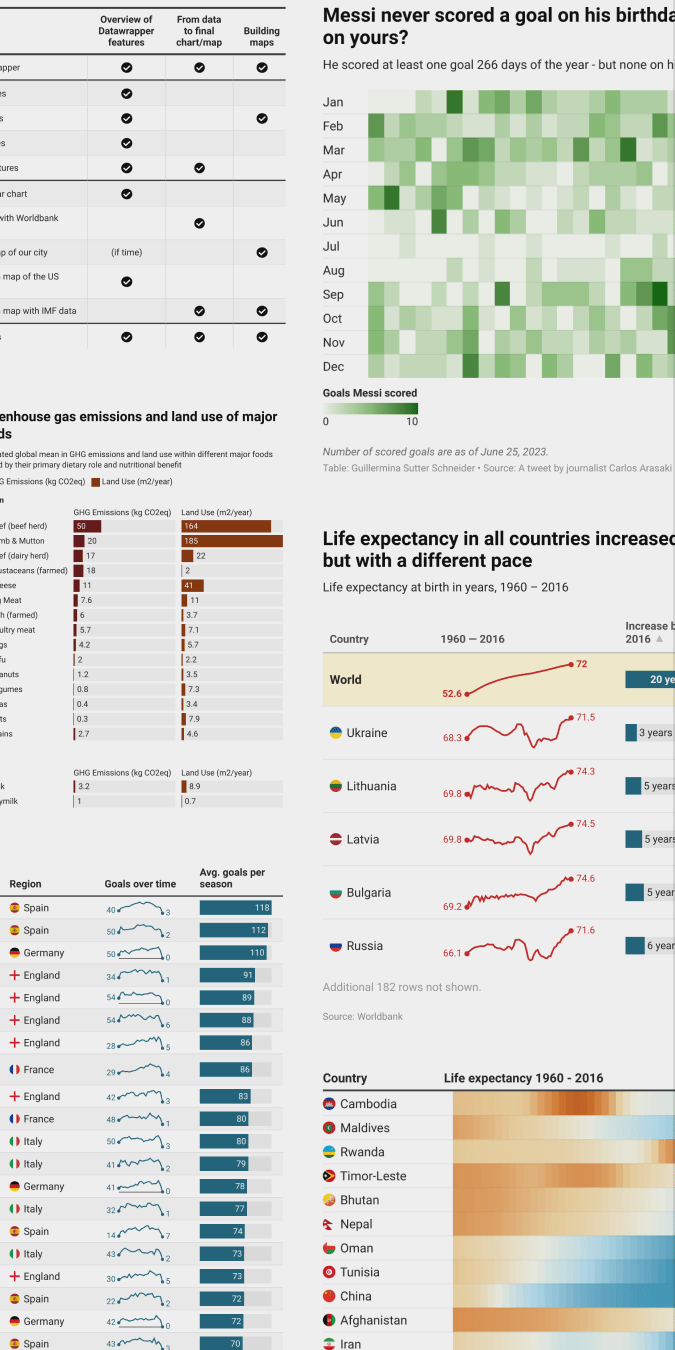
Depending on your data, a table might be the best way to show it. There’s a reason we still call tables a “visualization type,” though: In Datawrapper, you can add conditional formatting, mini-charts, heatmaps, flag icons, images, a search bar, and much more to your tables. Here’s how.
Getting started
Join our webinars
 Register for free
Datawrapper tables: Deep dive
Wednesday, November 11, at 6pm CET / 12pm EDT, 1h
Are you already familiar with Datawrapper and interested in exploring its advanced features for creating tables? This webinar is for you! Join us to dive deeper into the world of Datawrapper tables.
Join your host Guillermina and discover:
– How to customize Datawrapper tables to your needs
– How to make values jump out visually with heatmaps
– How to add tiny column and line charts to your tables
– Resources to keep learning more
Styling
Double-row headers
How to create a double-row-headerColumn widths
How to control column widths in tablesDisabling sorting
How to disable sorting for certain columnsAdding bar, column, and line charts
How to add bar charts, column charts & line charts to tablesFlag icons
How to insert flag iconsMarkdown
How to format your text with MarkdownColoring by categories
How to color tables by categories (conditional formatting)Sorting order
How to customize the sort order of tables