Live-updating visualizations
Elections, stock prices, energy, weather events, revenue, unemployment numbers: for lots of topics, you’ll want a chart or map that always shows the latest data. Here’s how to create live-updating visualizations in Datawrapper.
Getting started
Overview
Live-updates with Datawrapper: An overviewLive-updating options
Options for live-updating visualizationsLive-updating choropleth map
How to create a live-updating choropleth mapLive-updating symbol map
How to create a live-updating symbol mapLive-updating chart or table
How to create a live-updating chart or tableWith JSON data
How to create a live-updating visualization with JSON dataLive-updating table with mini-charts
How to create a live-updating table with mini-columns, sparklines and heatmapsChart with live-updating metadata
How to create a chart with live-updating metadata
Connecting to Google Sheets
Connecting to Google Sheets
How to connect your choropleth map to Google SheetsConnecting your chart or table
How to connect your chart or table to Google SheetsAutomatic updates
How to set up automatic updates on a Google SheetLive-updating visualizations
How to create live-updating visualizations using Google Sheets
API
Join our webinars
 Register for free
Datawrapper tables: Deep dive
Wednesday, November 11, at 6pm CET / 12pm EDT, 1h
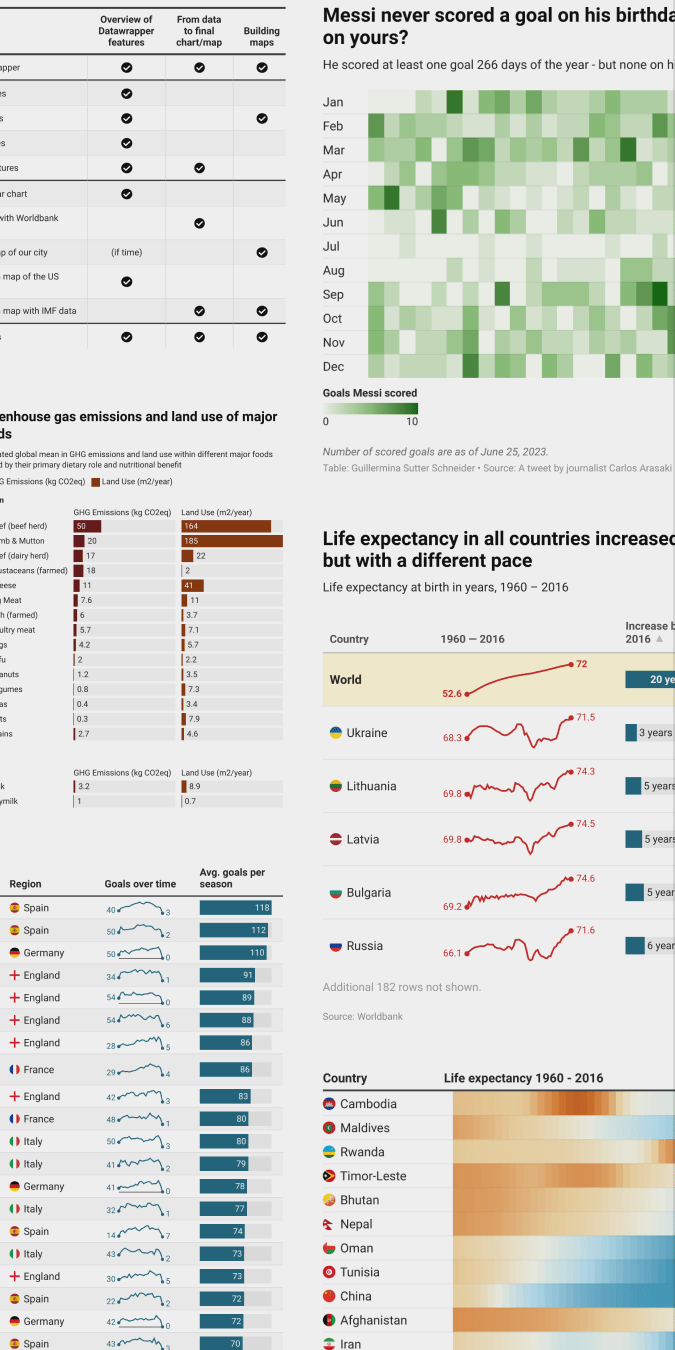
Are you already familiar with Datawrapper and interested in exploring its advanced features for creating tables? This webinar is for you! Join us to dive deeper into the world of Datawrapper tables.
Join your host Guillermina and discover:
– How to customize Datawrapper tables to your needs
– How to make values jump out visually with heatmaps
– How to add tiny column and line charts to your tables
– Resources to keep learning more