How to create a table
- Free
- Pro
- Business
- Enterprise
Tables, despite their seemingly simple nature, can be one of the most effective data visualization tools in your toolbox. Their ability to host a different "data type" – words, specific numbers, images, sparklines, or bar charts – in each cell makes them surprisingly versatile.
This guide will show you how to create and customize a table with Datawrapper. We'll use the following example of life expectancy by country from 1960 to 2024:

Let's start.
Preparing your data
Formatting your data
Our tables require at minimum one column or one row of any data type (number, text, or date).
That's it! Of course, it's likely that you will have more than one column or row of data. You can also choose whether or not to use the first row as a header once you're further in the process.
Here's a small snippet of the data we used. The full dataset has one column for every year from 1960 to 2024:
| Country | 1960 | 1961 | 1962 | … | 2024 | Increase between 1960 and 2024 | Continent |
| :zw: Zimbabwe | 53.5 | 54.0 | 54.5 | … | 63.1 | 9.6 | Africa |
| :zm: Zambia | 50.6 | 51.0 | 51.3 | … | 66.5 | 15.9 | Africa |
| :za: South Africa | 52.6 | 53.1 | 53.6 | … | 66.3 | 13.7 | Africa |
| :ye: Yemen | 33.5 | 34.1 | 33.7 | … | 69.4 | 36.0 | Asia |
| :ws: Samoa | 55.2 | 55.7 | 56.3 | … | 71.8 | 16.7 | Oceania |
You'll notice the codes between colons in the first column, like ":zw:" for Zimbabwe. Datawrapper can turn them into flags (more on that in the Customize columns panel below).
Uploading your data
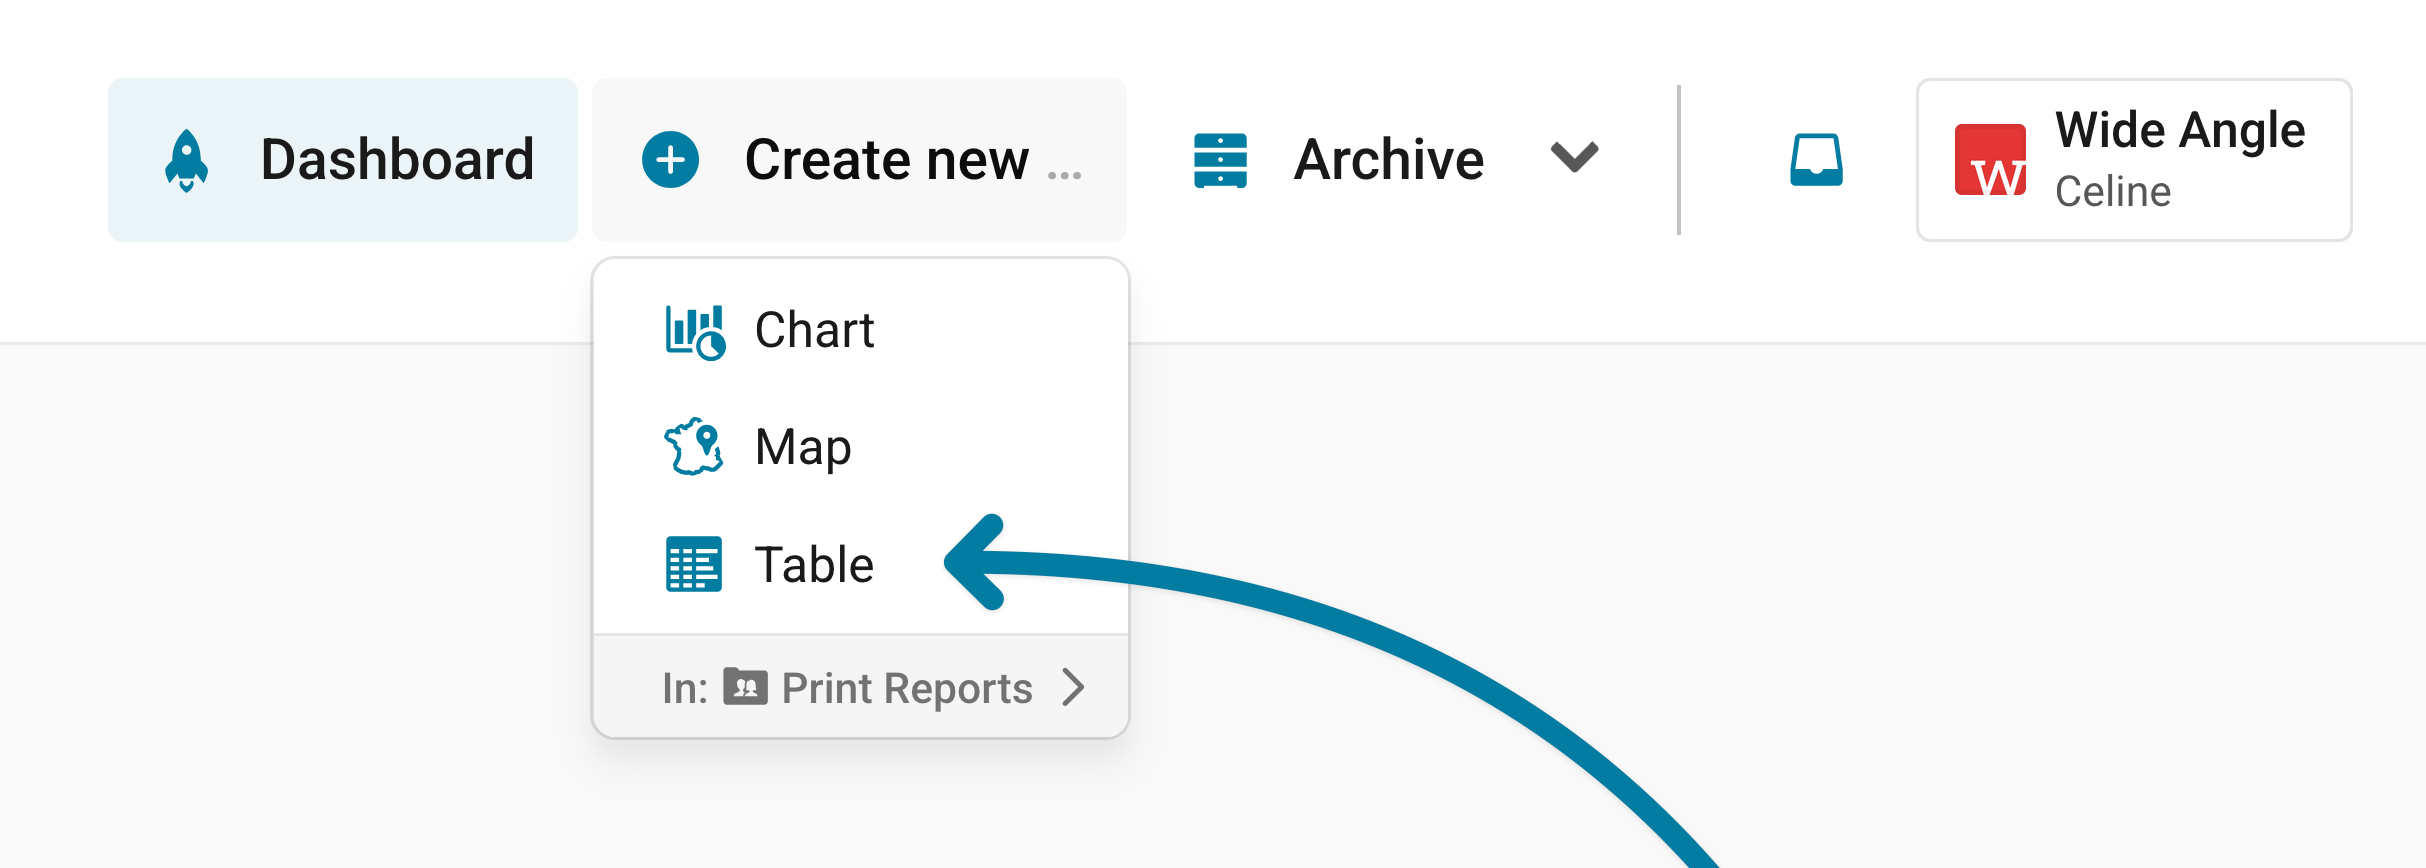
Once you have prepared your data, create a new chart in Datawrapper. You can do so by going to our homepage and clicking on Start creating. You can then click on Create new... in the upper right, and select Table.
In step 1: Upload, you can copy & paste your dataset, upload it as a .csv or Excel file, or connect to a Google Sheet. It looks like this:
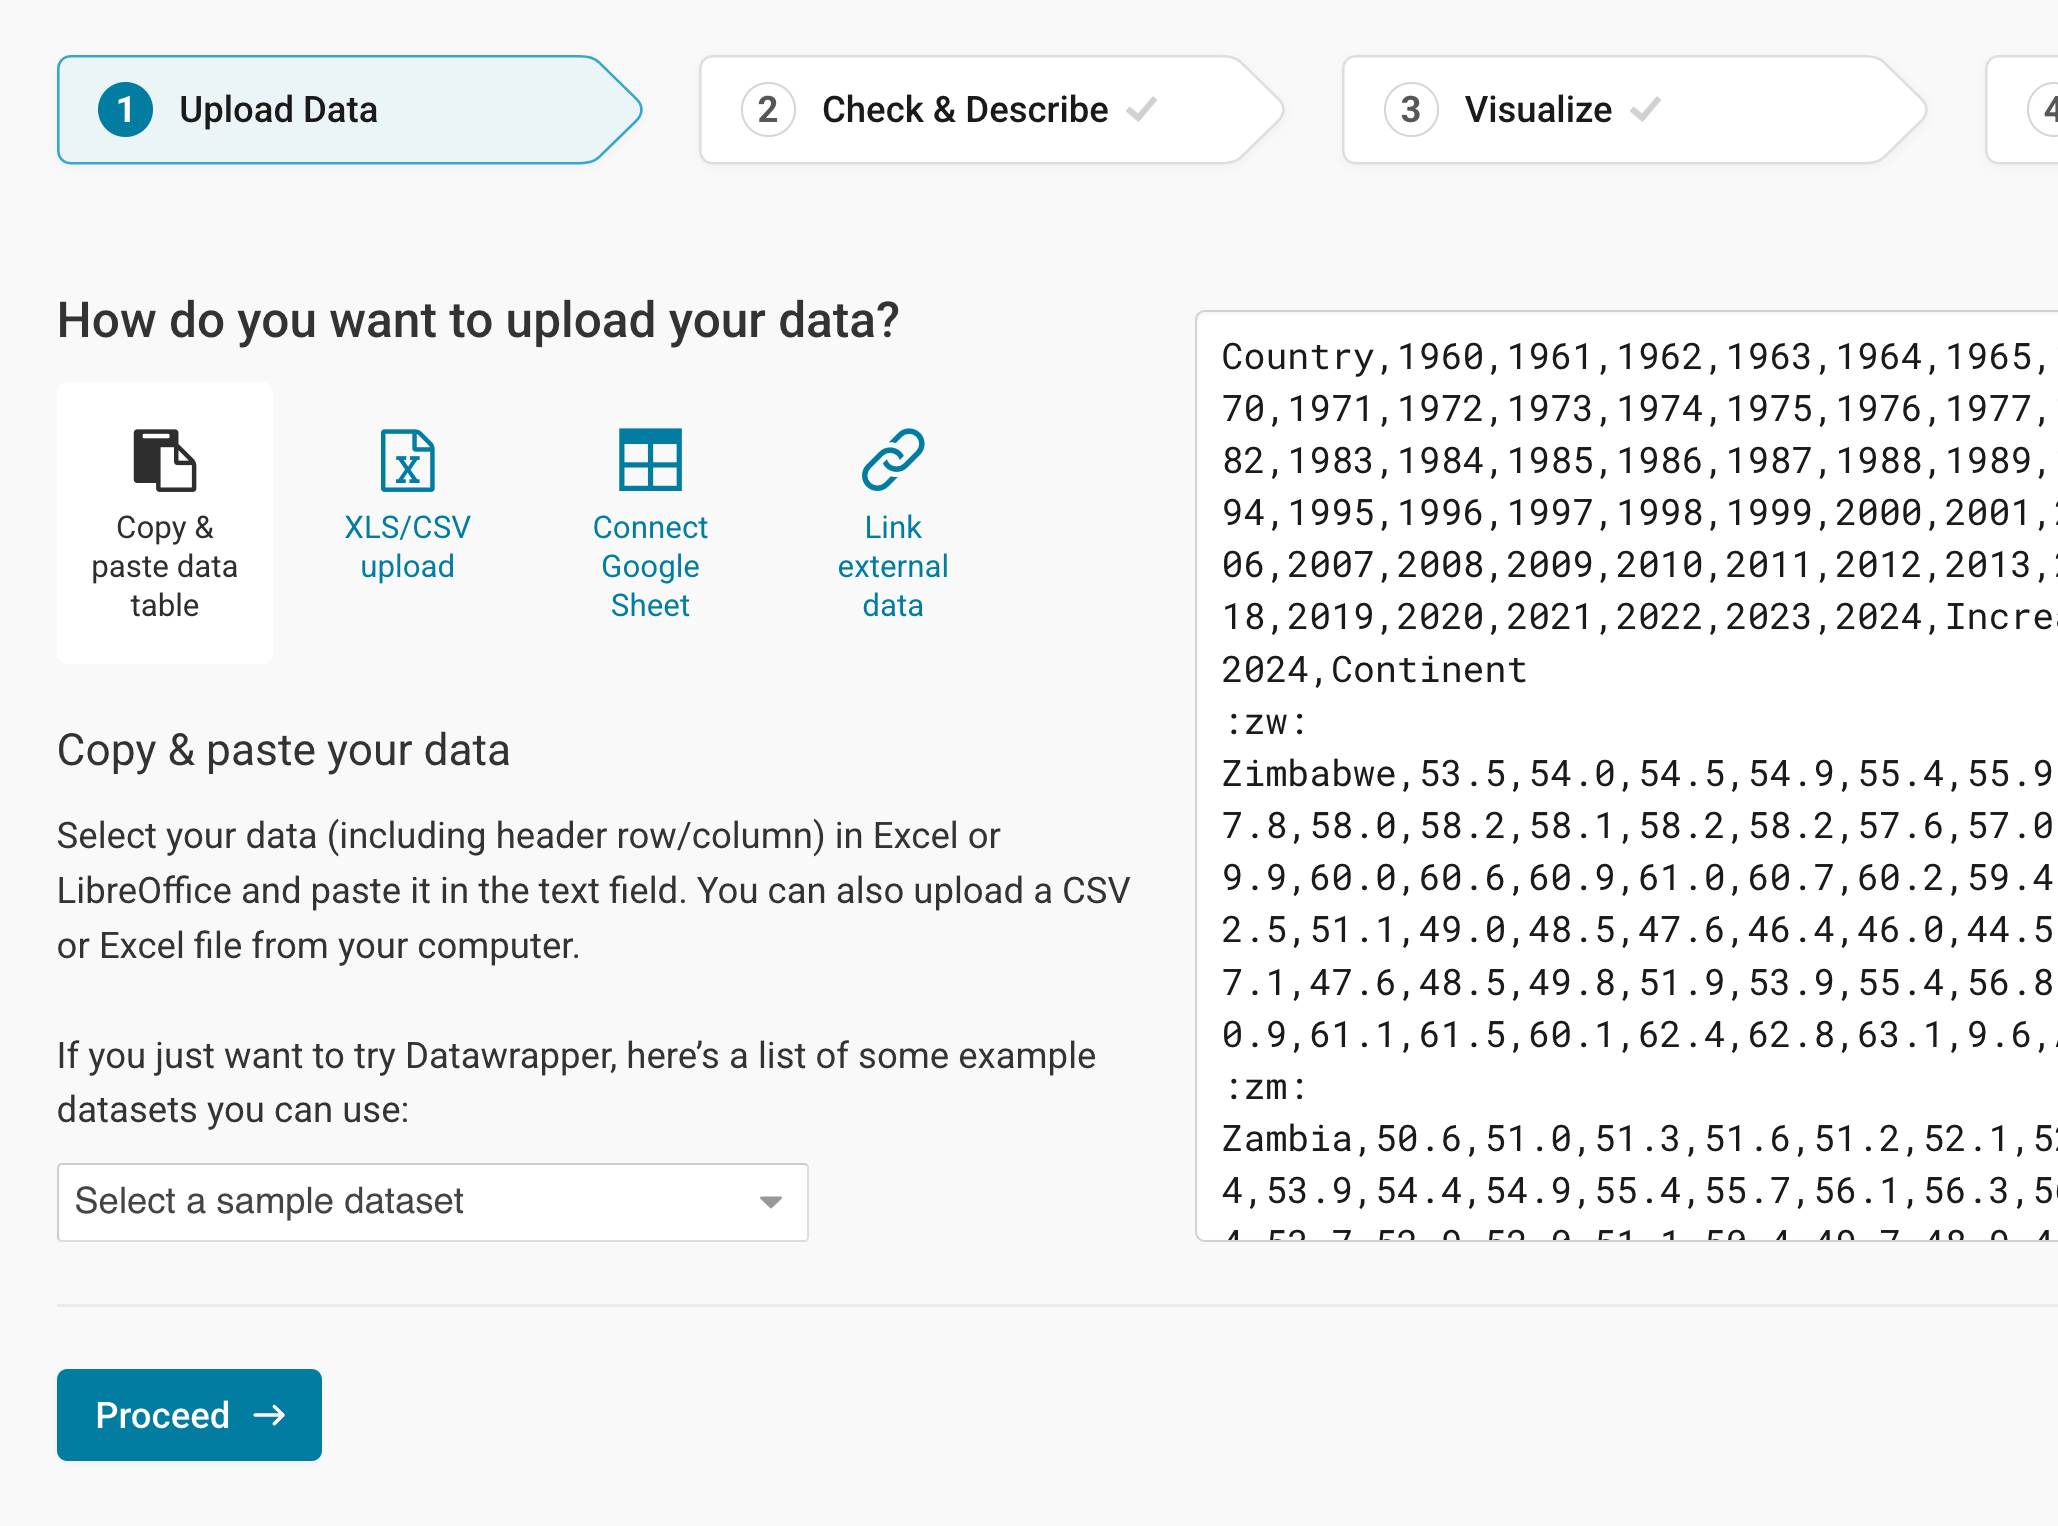
Click on Proceed to go to step 2: Check & Describe.
Checking data and units
In step 2: Check & Describe, Datawrapper automatically identifies your data columns as either a number, text, or date column. Learn more about what column formats Datawrapper recognizes.
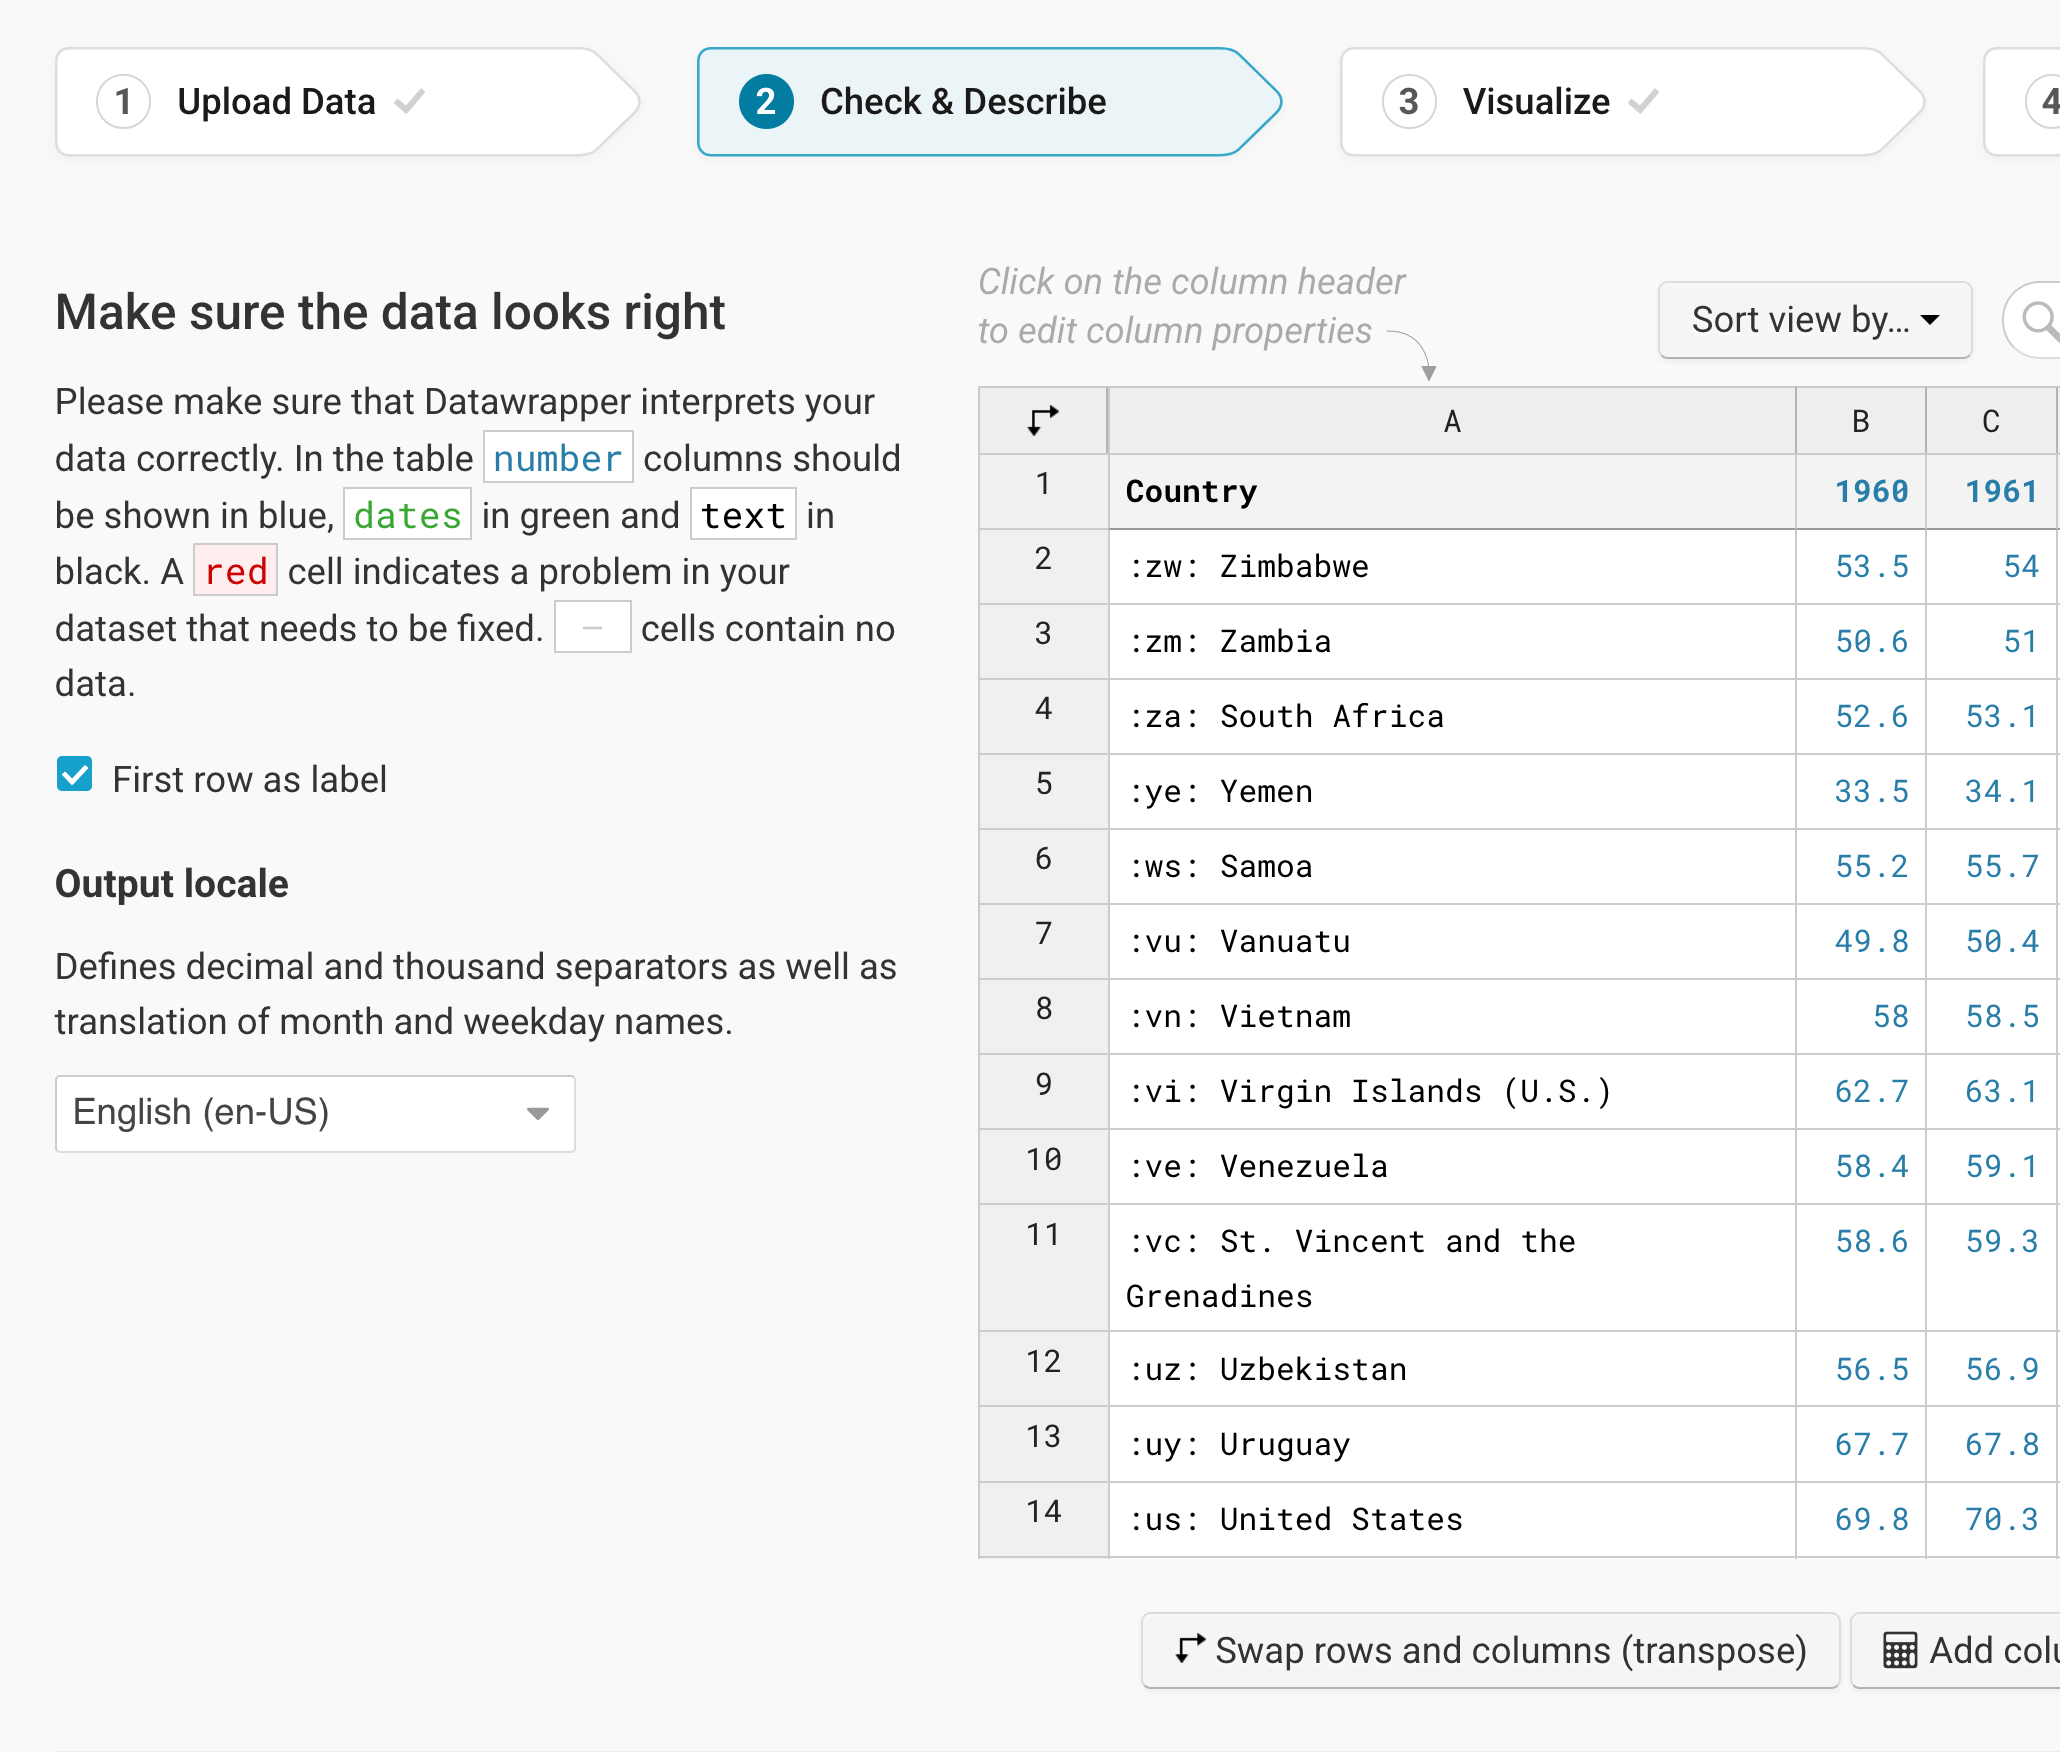
To add a unit (like km/h, kg, inch, $, etc.) to your numbers, click on a column header and then add the unit of your choice to the Prepend/append options on the left. Learn more about adding units to numbers.
If everything looks good, click on Proceed at the bottom left to go to step 3: Visualize.
Choosing a table
In step 3: Visualize, you will see a table, without a title, description, or customized colors. You will also see lots of options to refine your table – that's because you're in the Refine tab:
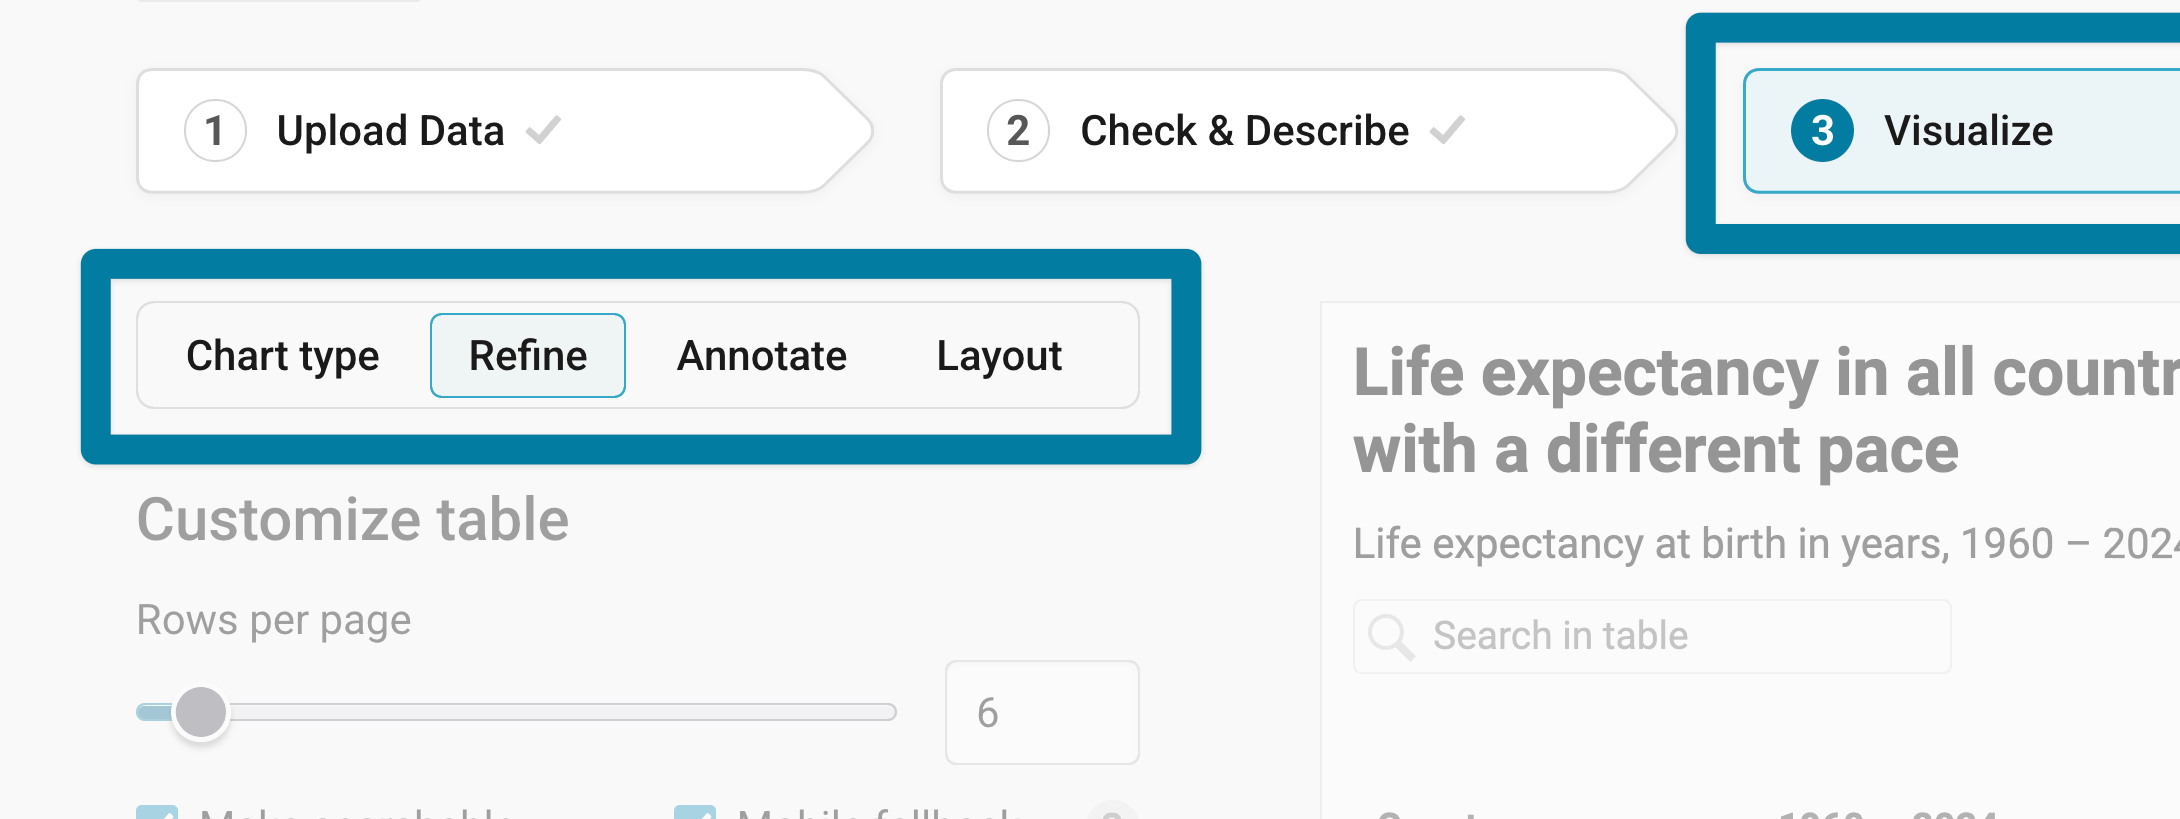
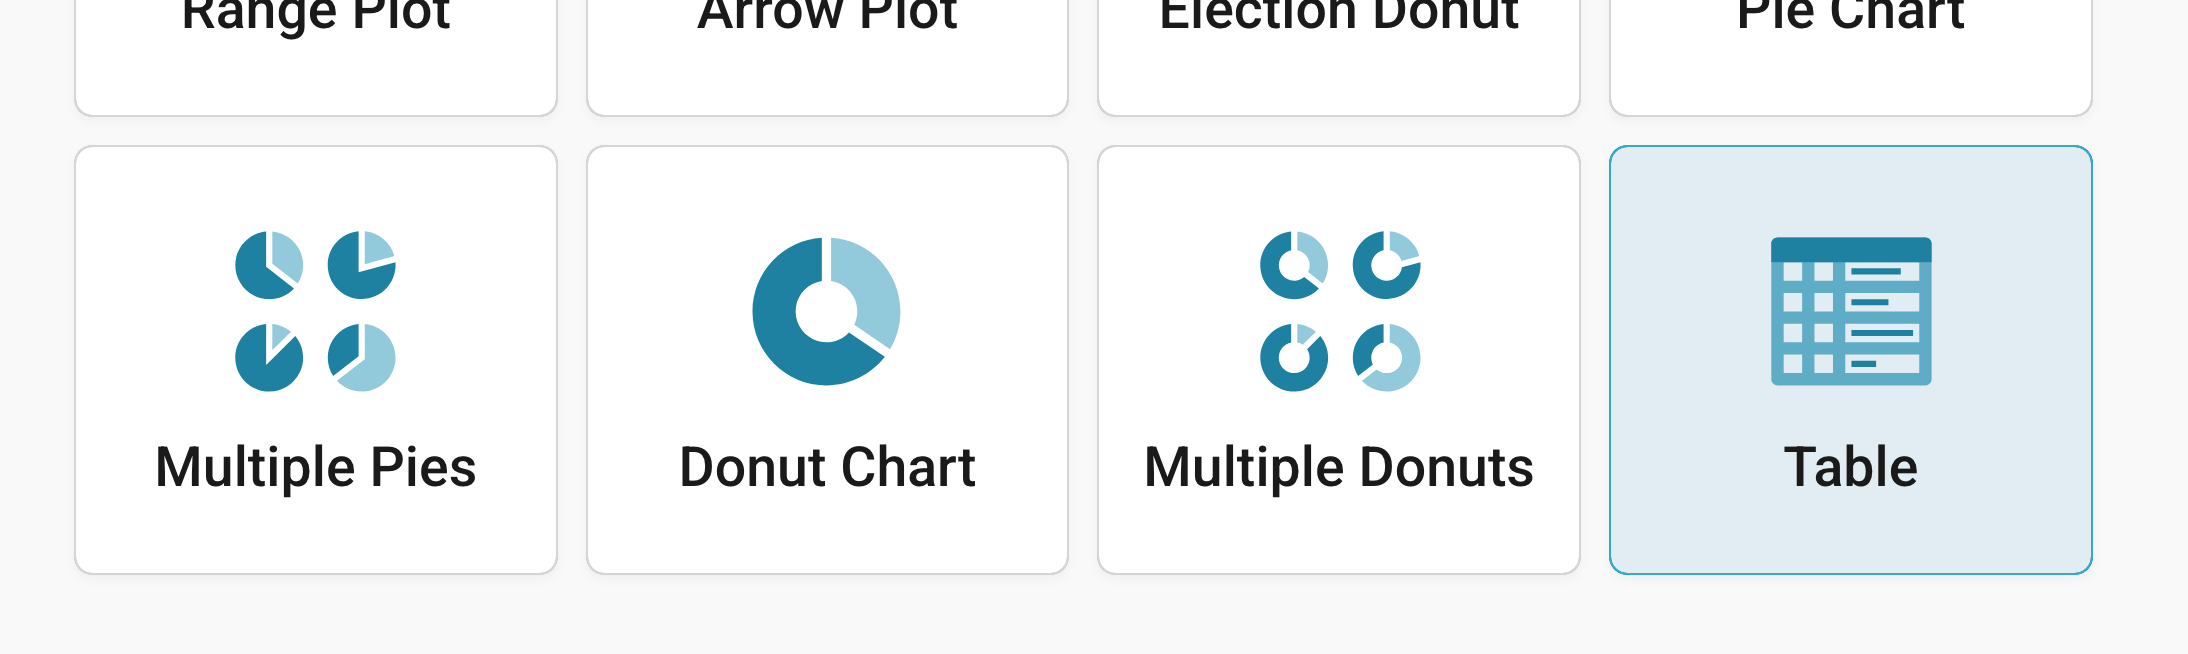
Datawrapper skipped the Chart type tab because you already told it that you want to create a table (and not a bar chart or line chart, etc.). That said, you can choose another visualization type if you go back to Chart type. And if you're working on another visualization type and notice that a table would be a better fit, after all, you can also choose Table in the Chart type tab:
Resizing
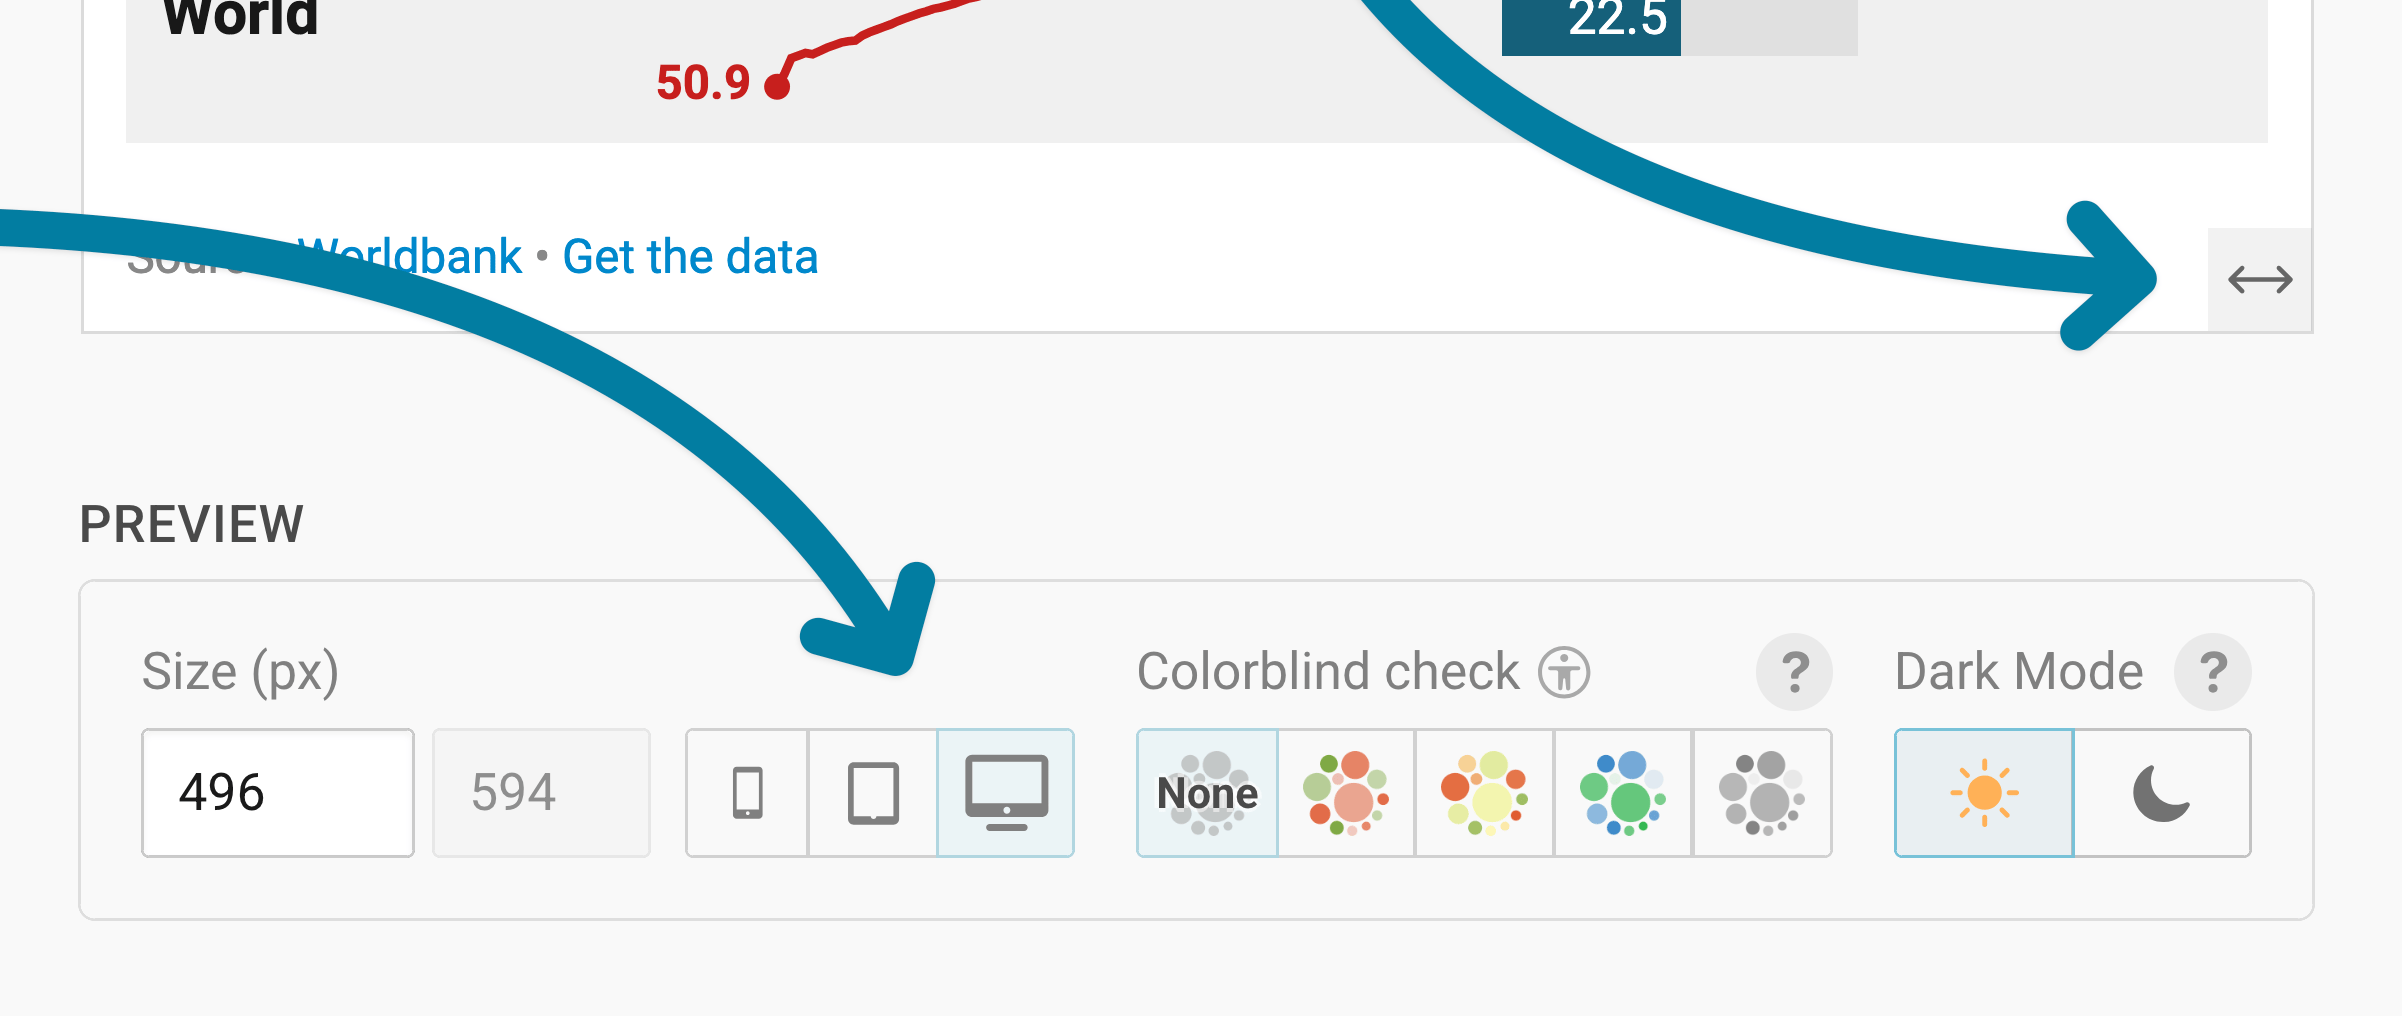
In any tab of step 3: Visualize, you can click, hold, and drag the arrow in the lower right corner or enter values in the box below the chart (Size) to see the table at a different width. Their height depends on how many rows you show, so changing it by hand isn't possible. Learn more about changing the width and height of your visualizations in this article.
We recommend checking what your table looks like on different screen sizes multiple times while designing it, by clicking on the little icons (mobile, tablet, and computer) below the chart.
Refining your table
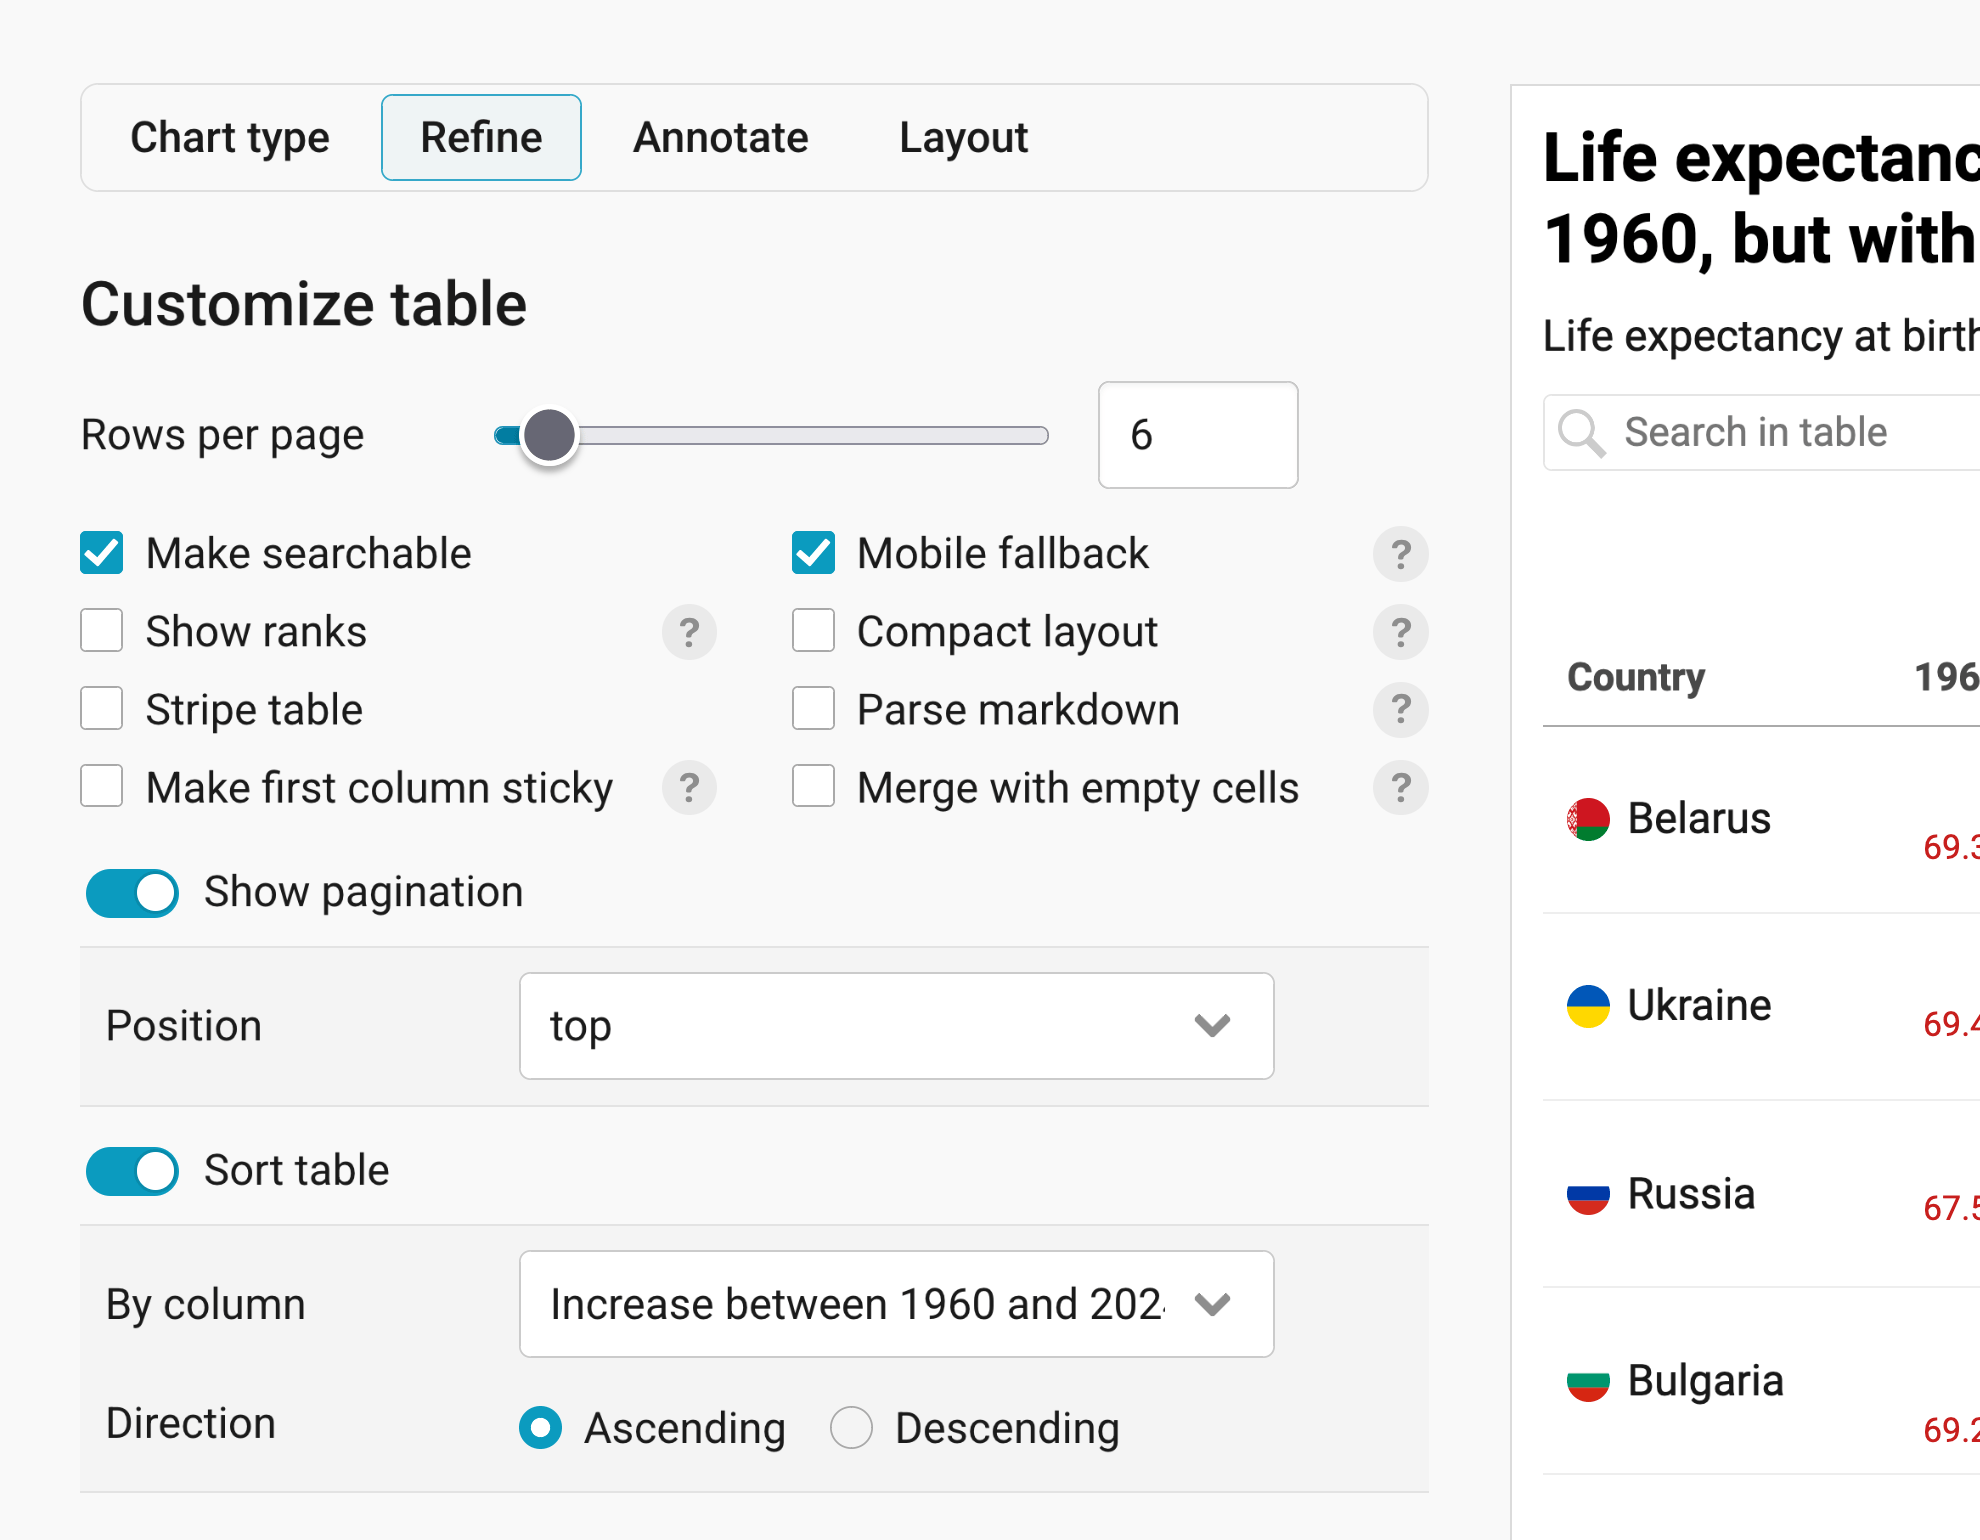
Let's continue with the Refine tab. Here, we see five panels: Customize table, Customize columns, Customize rows, Customize header, and Heatmap. The first one, Customize table, has settings that affect your whole table:
Showing more or fewer rows
Rows per page decides how many rows readers see at once (the default is 20 rows). Consider using fewer rows when the table is in the middle of an article so that readers don't have to scroll past dozens of rows. A longer table may work better at the bottom of an article.
Once your table has more than one page, readers will see the hint Show [number of remaining rows] more at the bottom of your table:

If you'd rather have pages that readers can flip through, turn on Show pagination (it's the first toggle after the check boxes). Pagination shows readers which page they're on, with arrows to go forward or backward, like this:
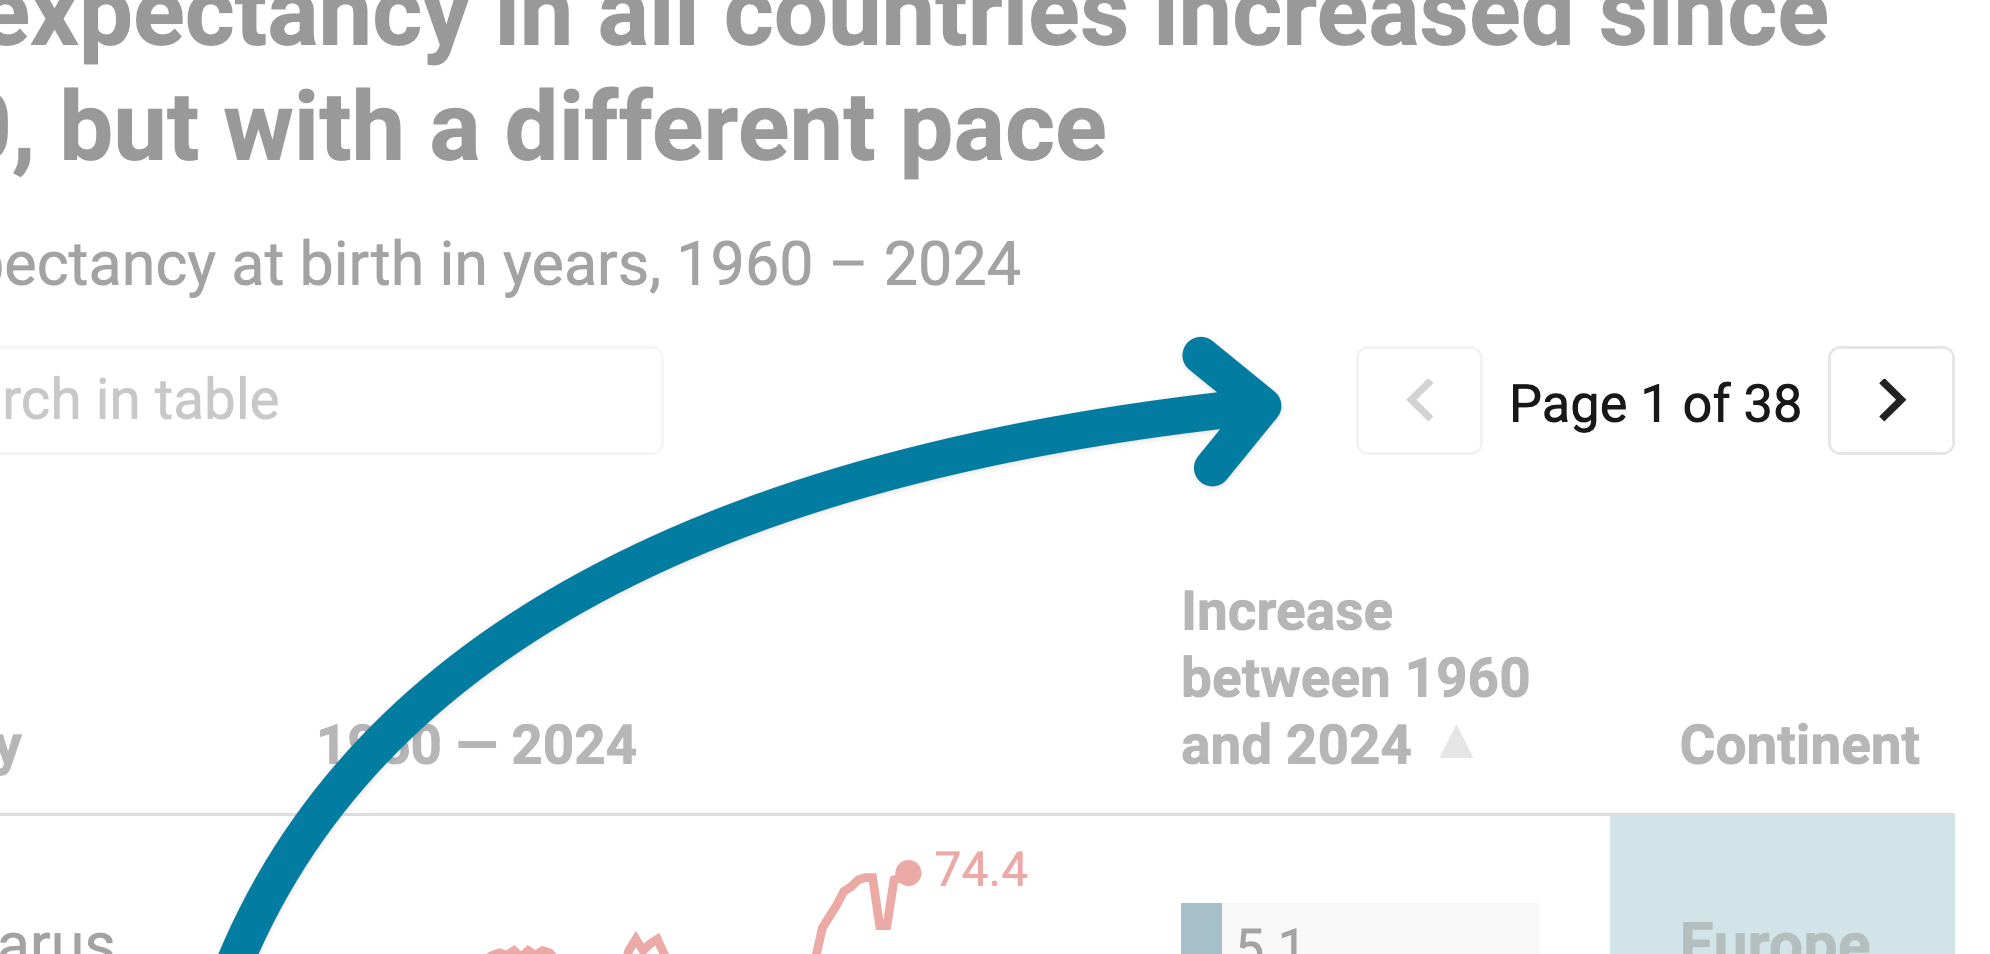
You can decide if that pagination should be above (top) or below (bottom) the table, or both (top and bottom). If your table only has one page, this option is grayed out.
Adding search
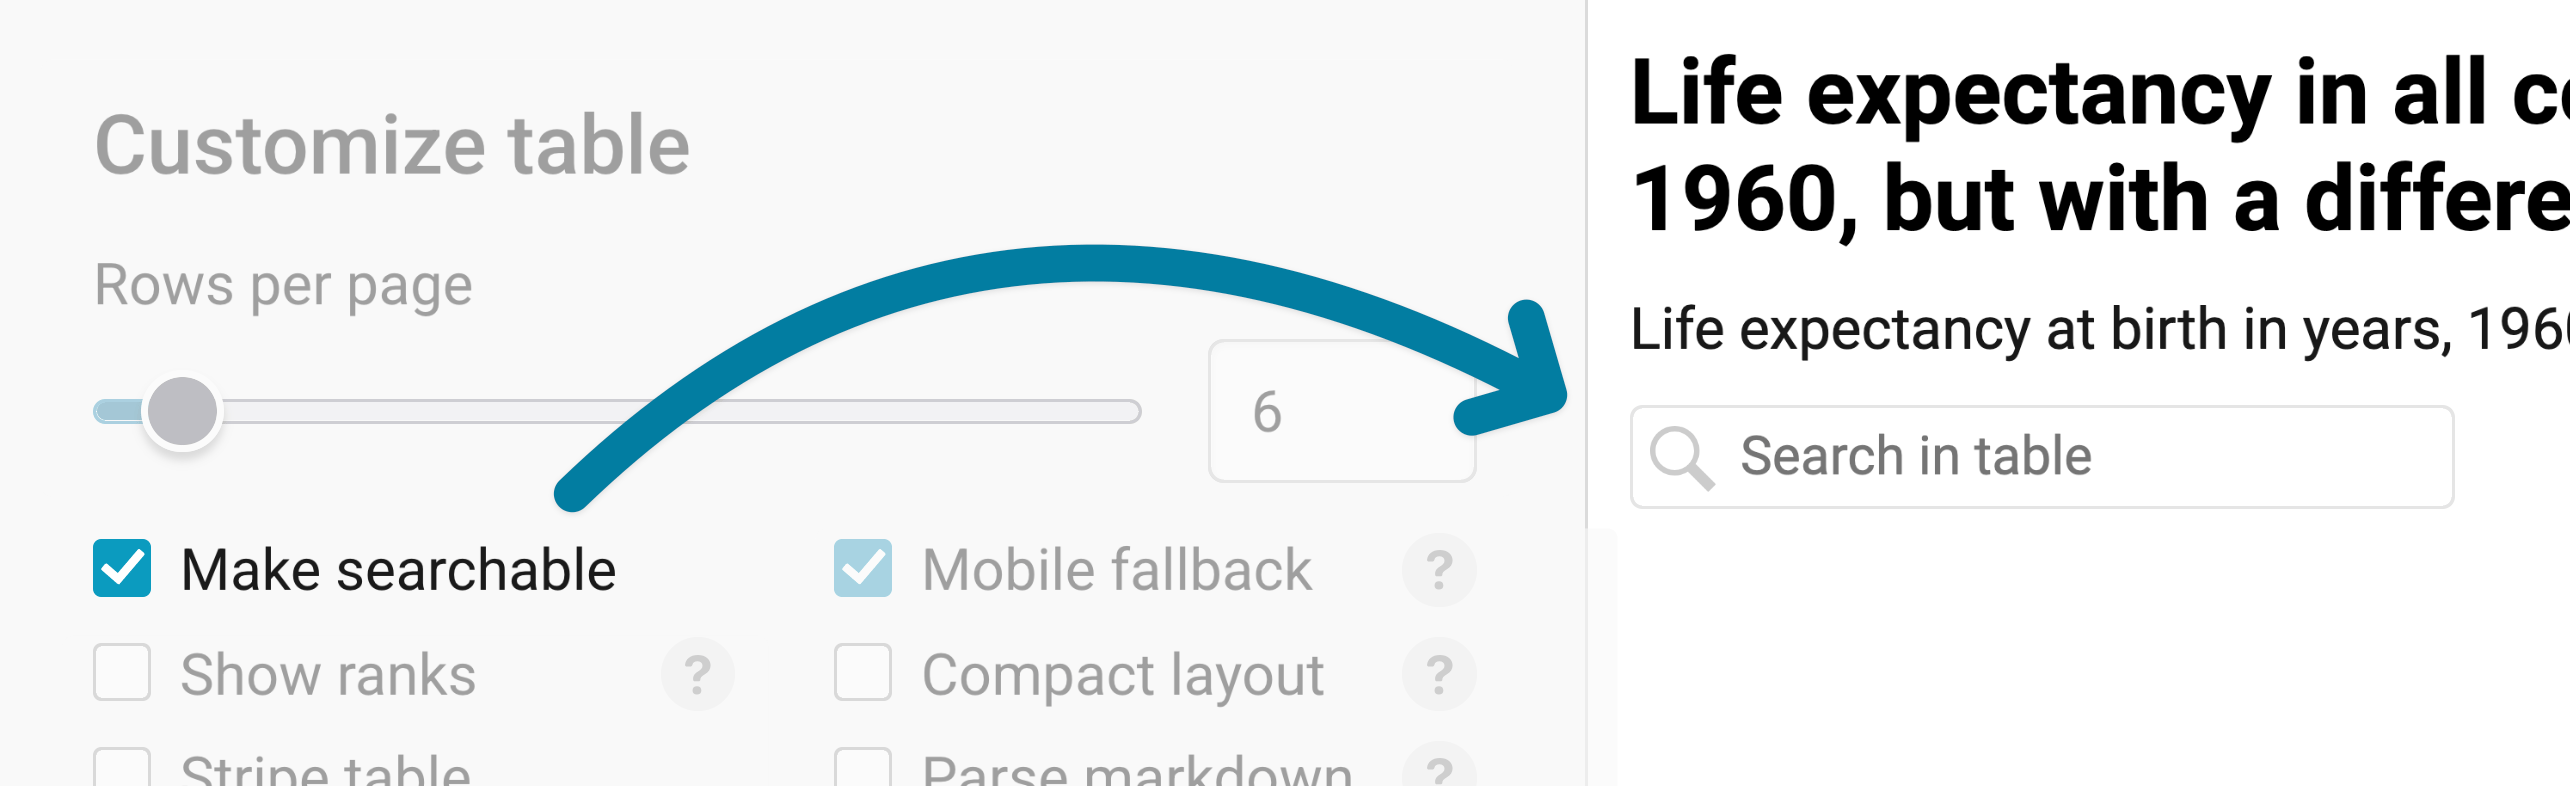
Make searchable adds a search bar to your table, so readers can look for specific information. That's especially useful if your table has more than one page. Note that the search entry must be an exact match, or it won't return anything.
Tip: You can preset a search term by adding the ?search=foo parameter to the URL in the embed code, like so: datawrapper.dwcdn.net/p91uJ/3/?search=Berlin
Styling your table
You will find more options under Refine > Customize table that help readers parse your table successfully:
- Stripe table: makes every other row light gray. That makes it easier to see what's in the same row, especially if your table is wide and readers have to scan from left to right.
- Compact layout: gives your rows less height and less white space. That's a good option if you show a lot of rows.
- Make first column sticky: keeps the first column in place while readers scroll sideways through a wide table, so they always know which row they're looking at.
- Show ranks: adds a column on the left that numbers your rows, starting with 1. The ranks don't move, even if readers sort the table in a different way.
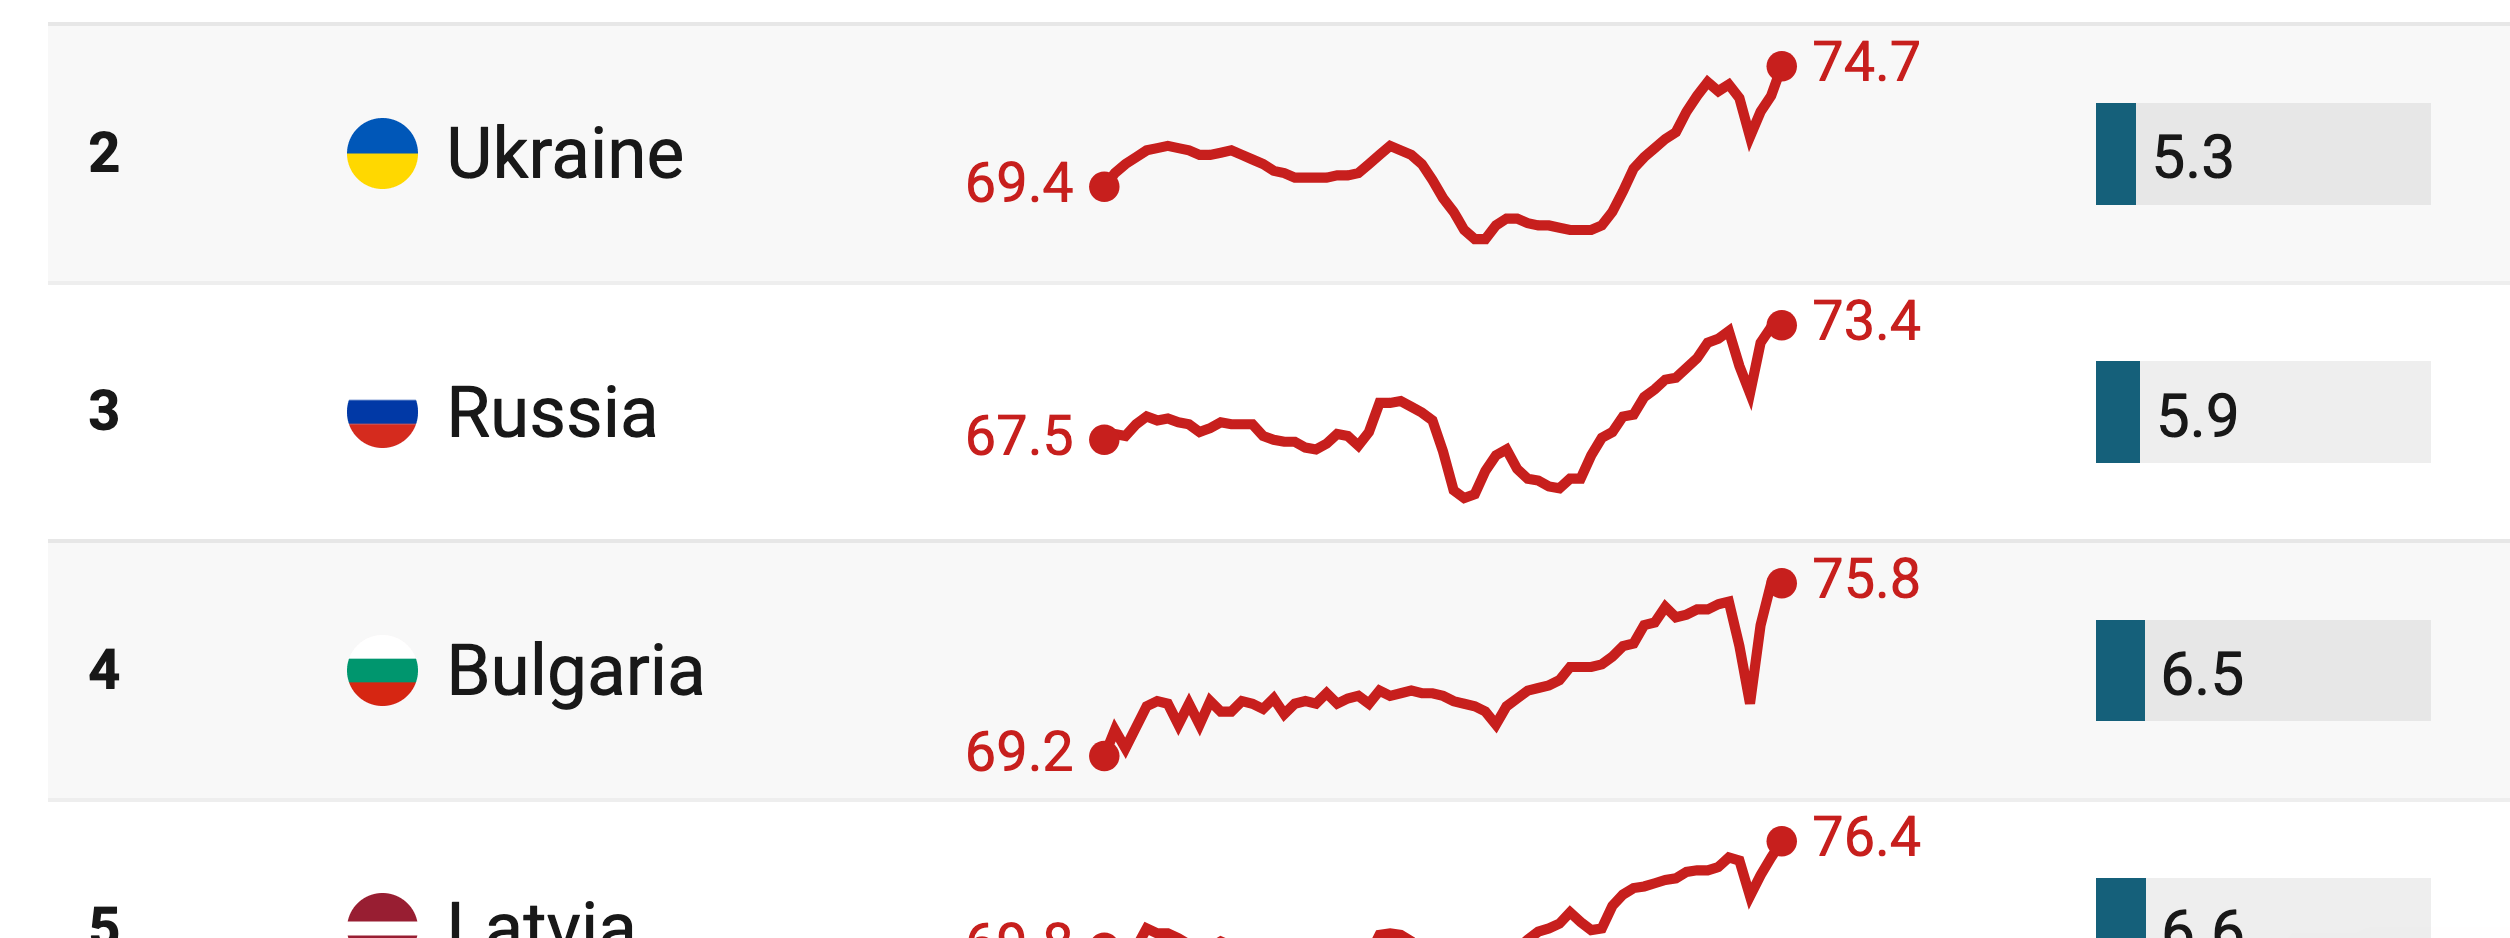
Here you can see the striped table, compact layout, and ranks applied:
Sorting
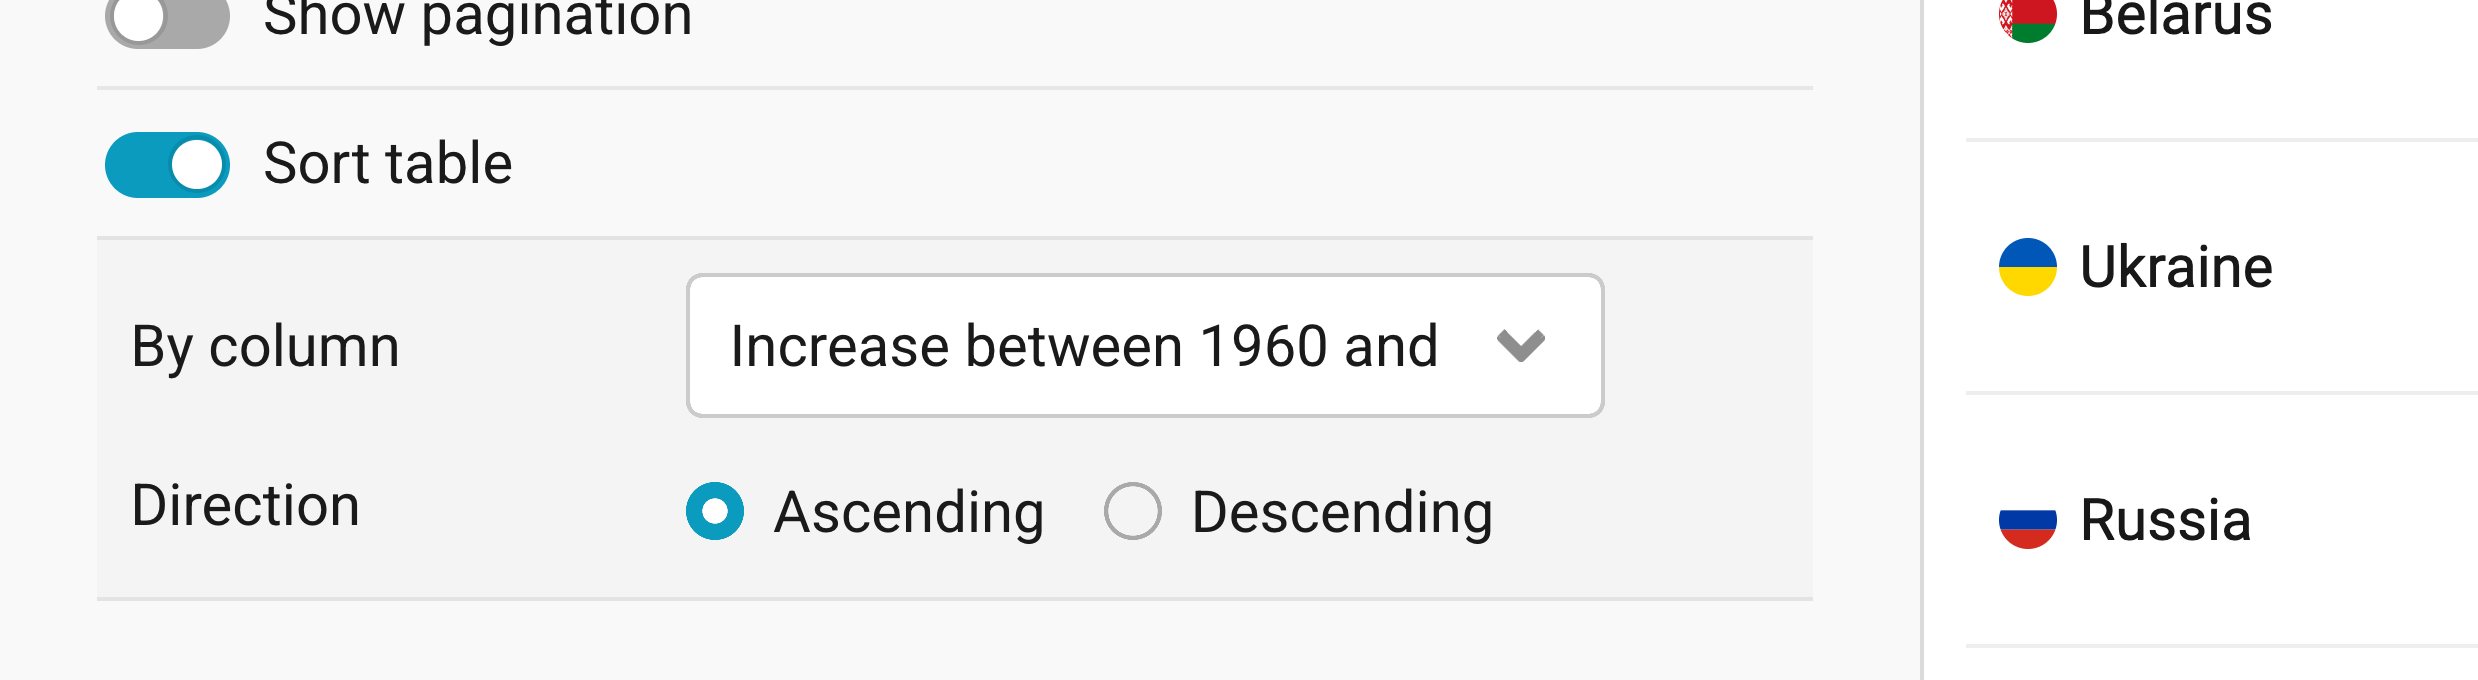
With Sort table, you set the order in which your rows appear when readers first see the table. Choose a column under By column and decide on a Direction: Ascending or Descending. Depending on the column you choose, Datawrapper sorts your rows by number or alphabetically. If you leave Sort table turned off (which is the default), your rows appear in the order of your dataset.
Readers can also sort your table themselves, by clicking on a column header. You can turn that off for single columns with Make sortable (see below). Learn more about customizing the sort order, or learn more about disabling sorting for certain columns.
Making your table work on mobile
Mobile fallback switches your table to a layout where each row becomes a card, on screens narrower than 450px. That way, readers on their phones don't have to scroll sideways:
You can also decide to hide some columns on mobile, with Show on in the Customize columns panel (see below).
Adding images, links, and merged cells

Parse markdown shows markdown formatting in your table, if you wrote markdown in your data. That way, you can add images, links, bold or italic text, and more to your cells. Learn more about formatting your text with markdown.
Merge with empty cells combines a text cell and the empty cells to its right into one big cell. If you want to center the text in your merged cells, add ~~~ around it (like ~~~ header ~~~). Learn more about creating a double-row header.
Customizing columns
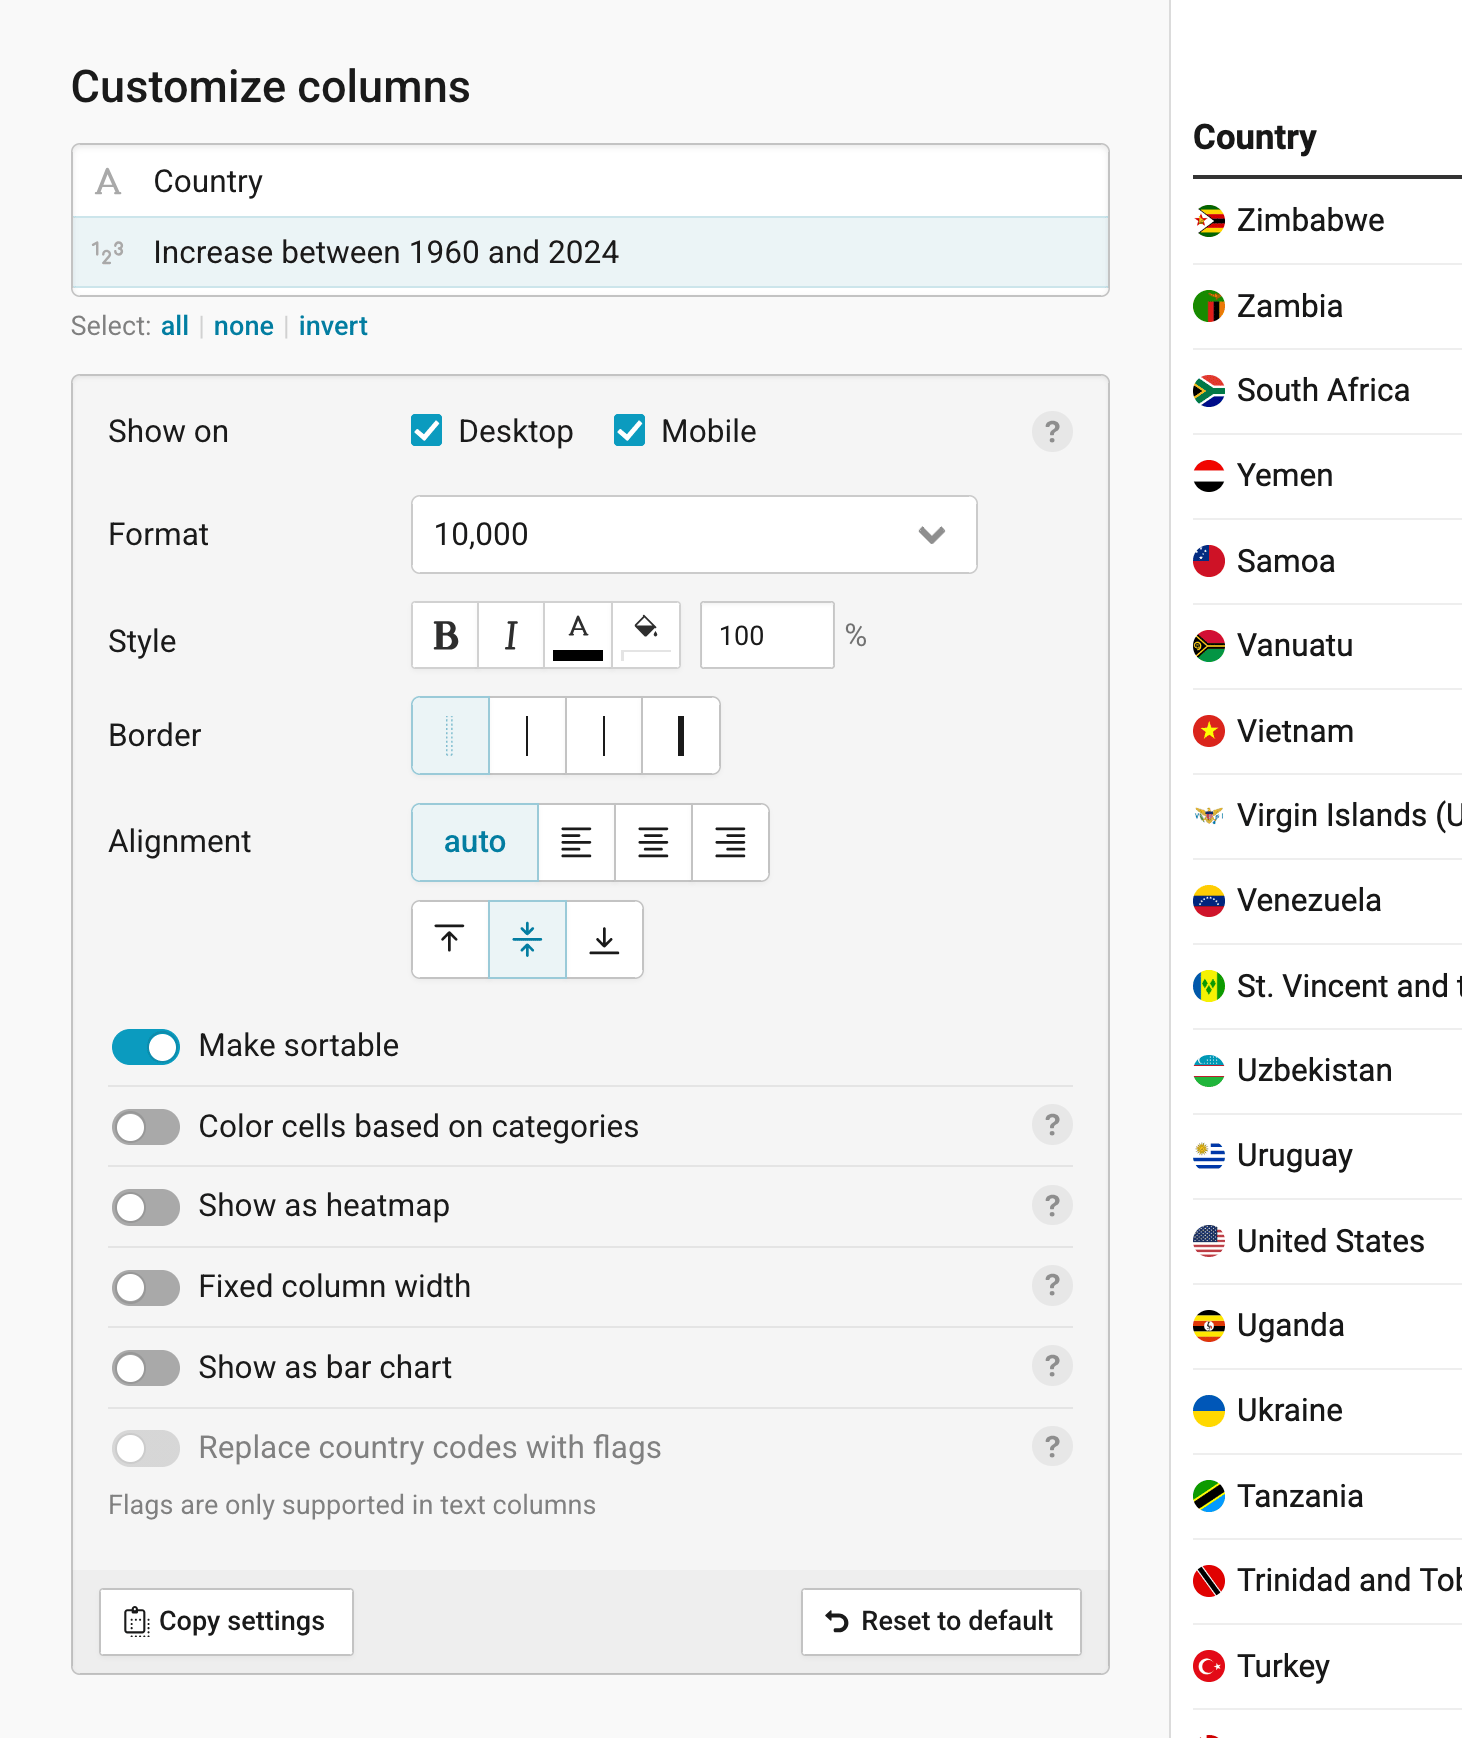
Each column in your table can be customized differently, giving you a lot of flexibility with your table design. In the Customize columns panel (in step 2: Check & Describe > Refine), a symbol on the left shows the data type of each column: text or numbers. Click on a column name to customize it. To change several columns at once, select multiple ones with Shift/Ctrl, and use all, none, or invert below the list. The settings will then open below:
- Show on: lets you decide whether the column appears on Desktop, on Mobile, on both (the default), or nowhere. A hidden column gets a crossed-out eye next to its name in the list. Consider showing fewer columns on mobile, since there's less space on the screen.
- Format: only appears for number columns. Choose how your numbers should look, for example as percentages or with a specific number of decimal places. Learn more about number formats.
- Style: makes the text in the column bold or italic, and changes the text color, the background color, and the font size.
- Border: adds a thin, medium, or thick line to the left of the column, for example to separate groups of columns. The default (and first option) for a cleaner look is to show no border at all.
- Alignment: aligns the column content to the left, center, or right, and to the top, middle, or bottom of the cell. With auto (the default), text is aligned to the left and numbers to the right.
- Make sortable: lets readers sort the table by this column, by clicking on its header (on by default).
- Show as heatmap: does exactly this. Learn more about this in its dedicated section below.
We'll look at the other options in greater detail below.
All these settings can be copied and applied to another column. With Copy settings, you can give other columns the same settings, and Reset to default undoes all your changes for the selected columns.
Coloring cells by category
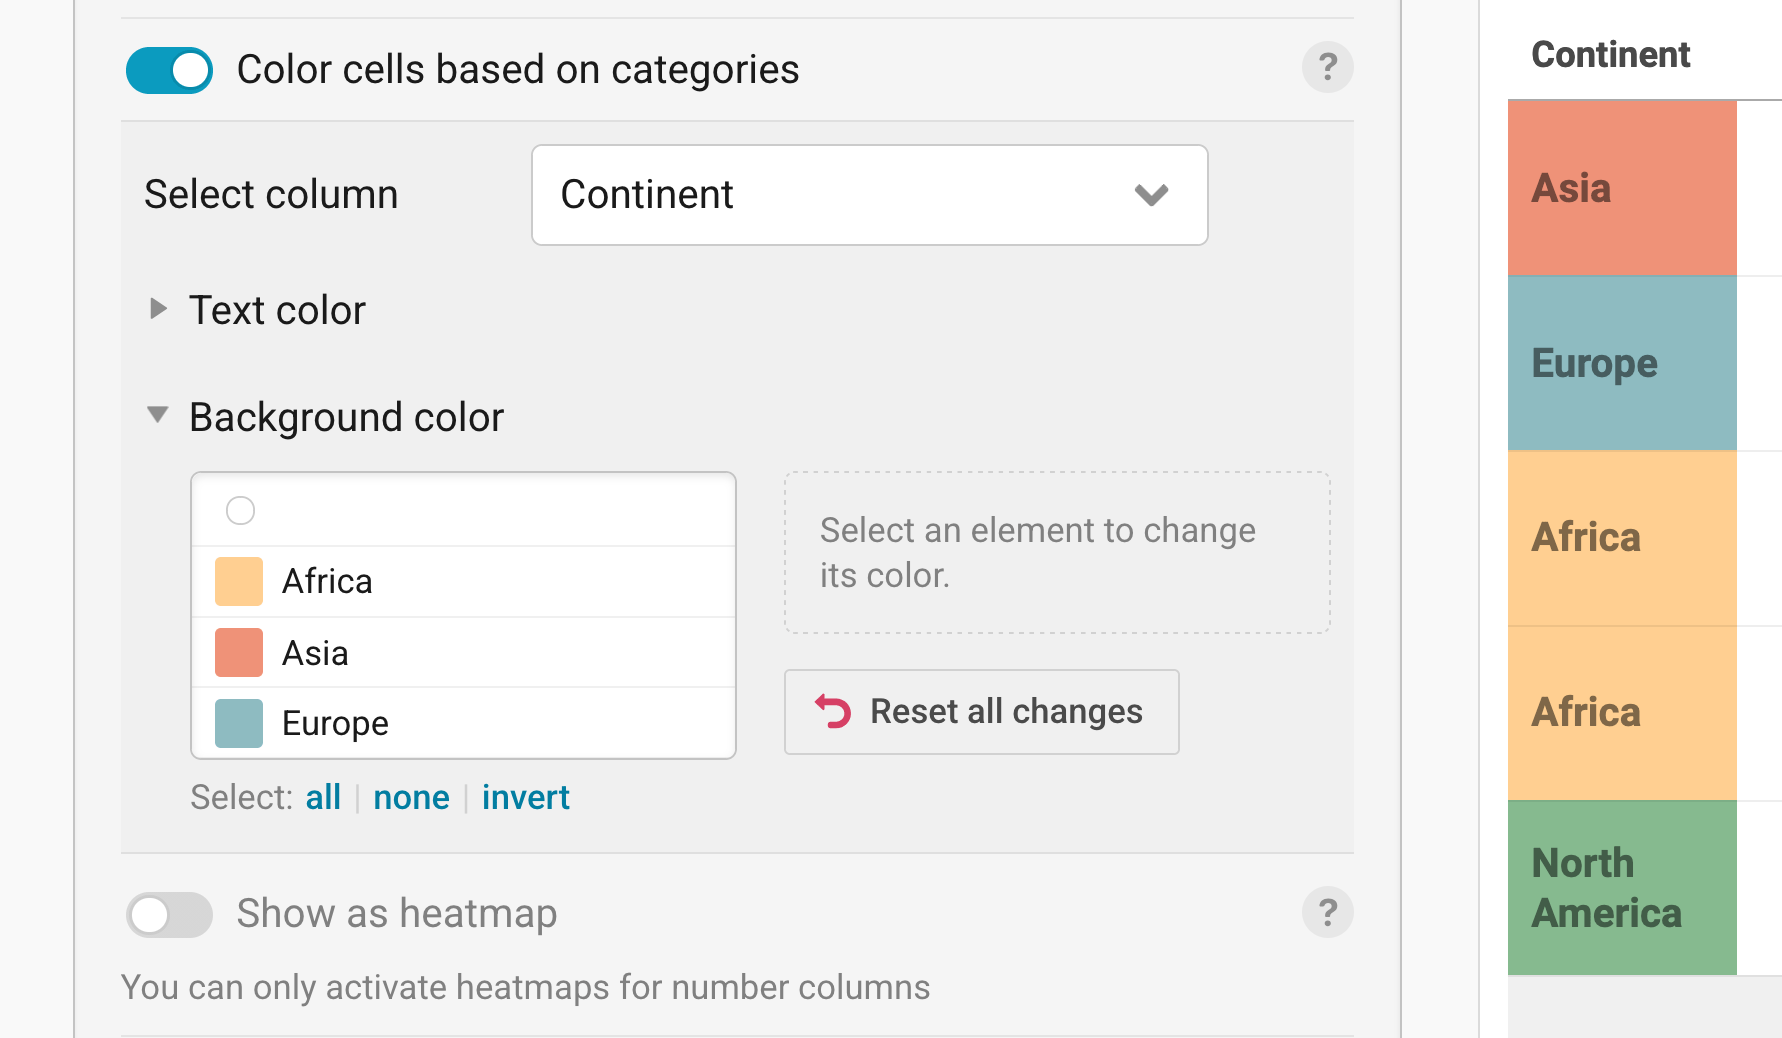
Color cells based on categories colors the text or the background of the cells in your selected column, based on the categories in the same or another column (Select column). For example, you could color the cells with state names in the color of the party that won the election in these states. Open Text color or Background color to pick the colors. Learn more about color-coding tables. For the table above, we chose to color-code the continent.
Controlling column widths
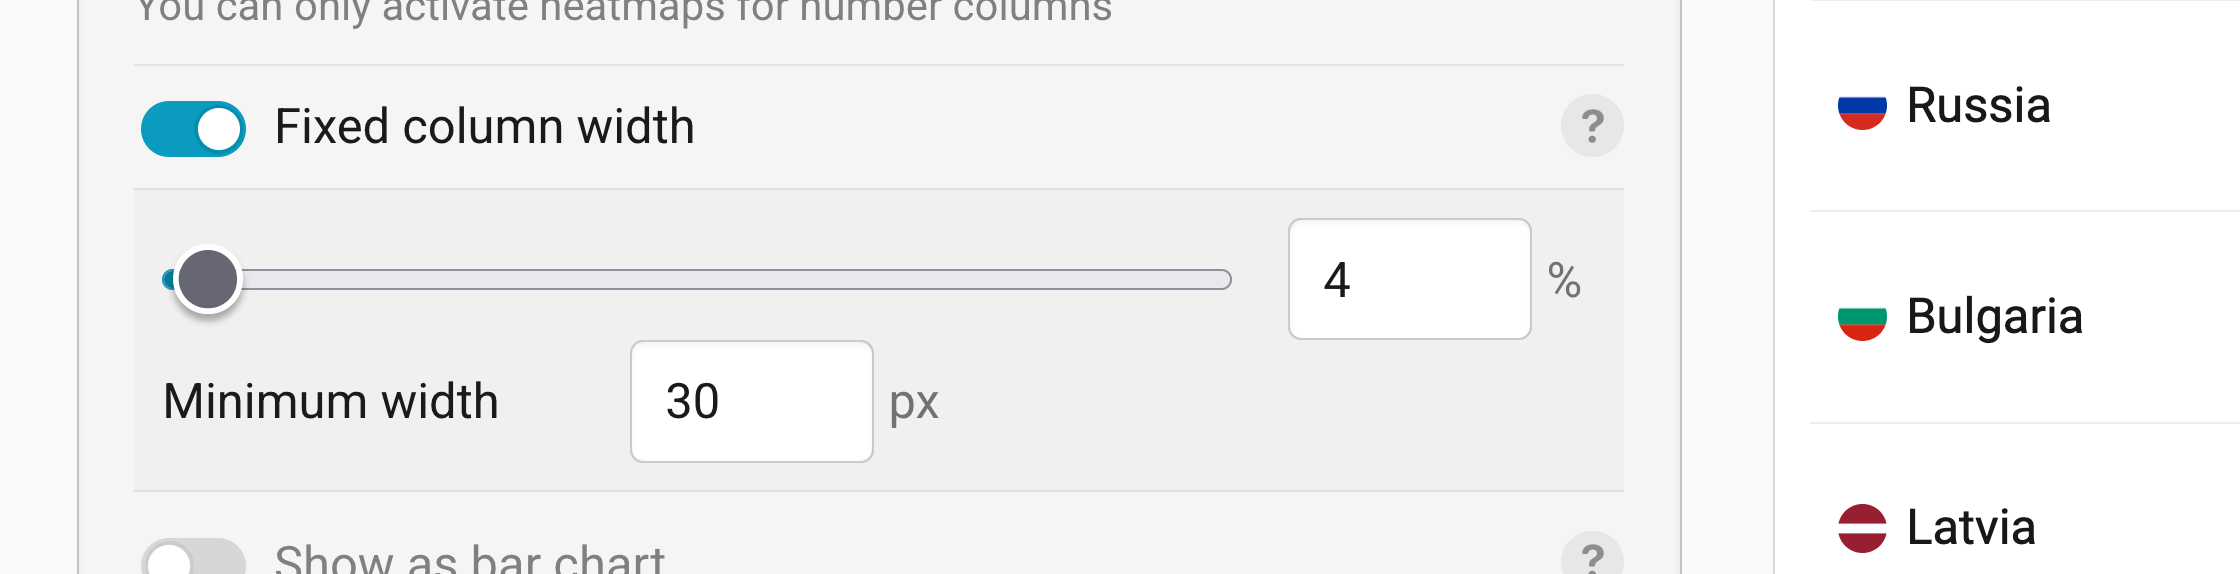
By default, each column is as wide as the longest word or number in it. Fixed column width lets you set the width of a column yourself, as a share of the whole table width, plus a Minimum width in pixels. Longer words will then wrap to the next line. It is especially useful when you have tiny charts in your table. Learn more about controlling column widths.
Showing numbers as bar charts
Show as bar chart turns a number column into bar charts, which makes it easier to compare the values. You can only turn number columns into bar charts.

- Style: shows Normal bars (the default) or Slim ones.
- Range: sets the min and max value of the bars. By default, it's based on the lowest and highest number in the column.
- Bar color: lets you choose one color for positive and another one for negative values (neg.).
- Color bars based on categories: colors the bars based on the categories in another column, for example the continent of each country.
- Hide background color: removes the light background behind the bars.
Adding line and column charts
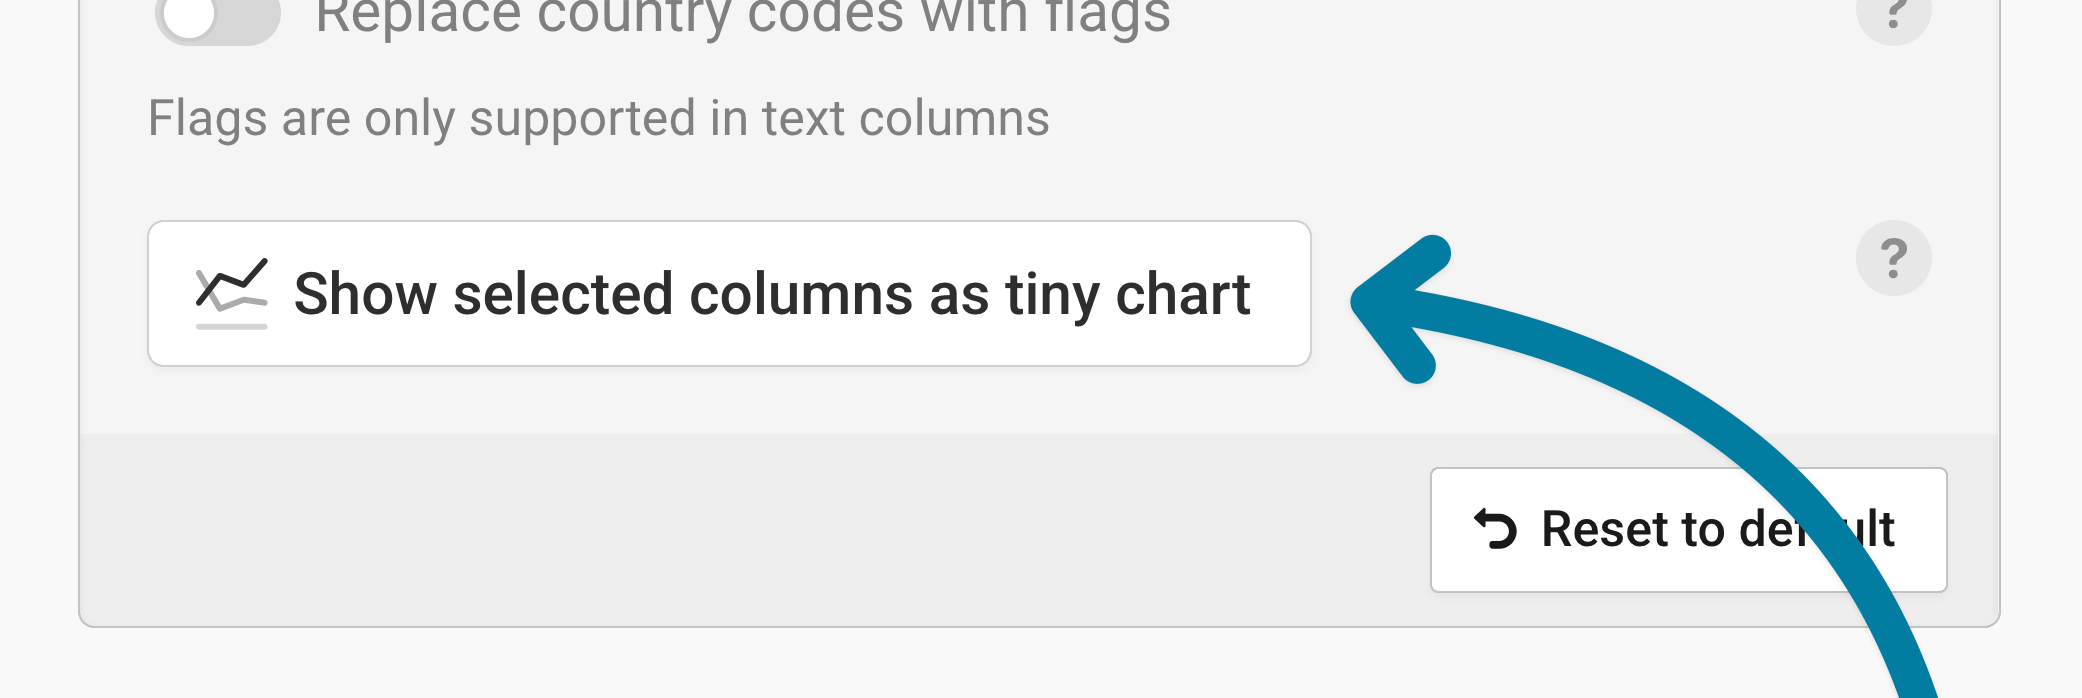
Tiny charts (also called sparklines) show how a number develops over time, right in your table. To create one, select at least two number columns in the Customize columns panel, for example all the years in our data. Click on Show selected columns as tiny chart to show them as one tiny chart per row. In the list, the new column gets a chart symbol and a name that combines the first and last column, like "1960 — 2024".
In the Tiny-chart settings, you can decide what your tiny charts look like:
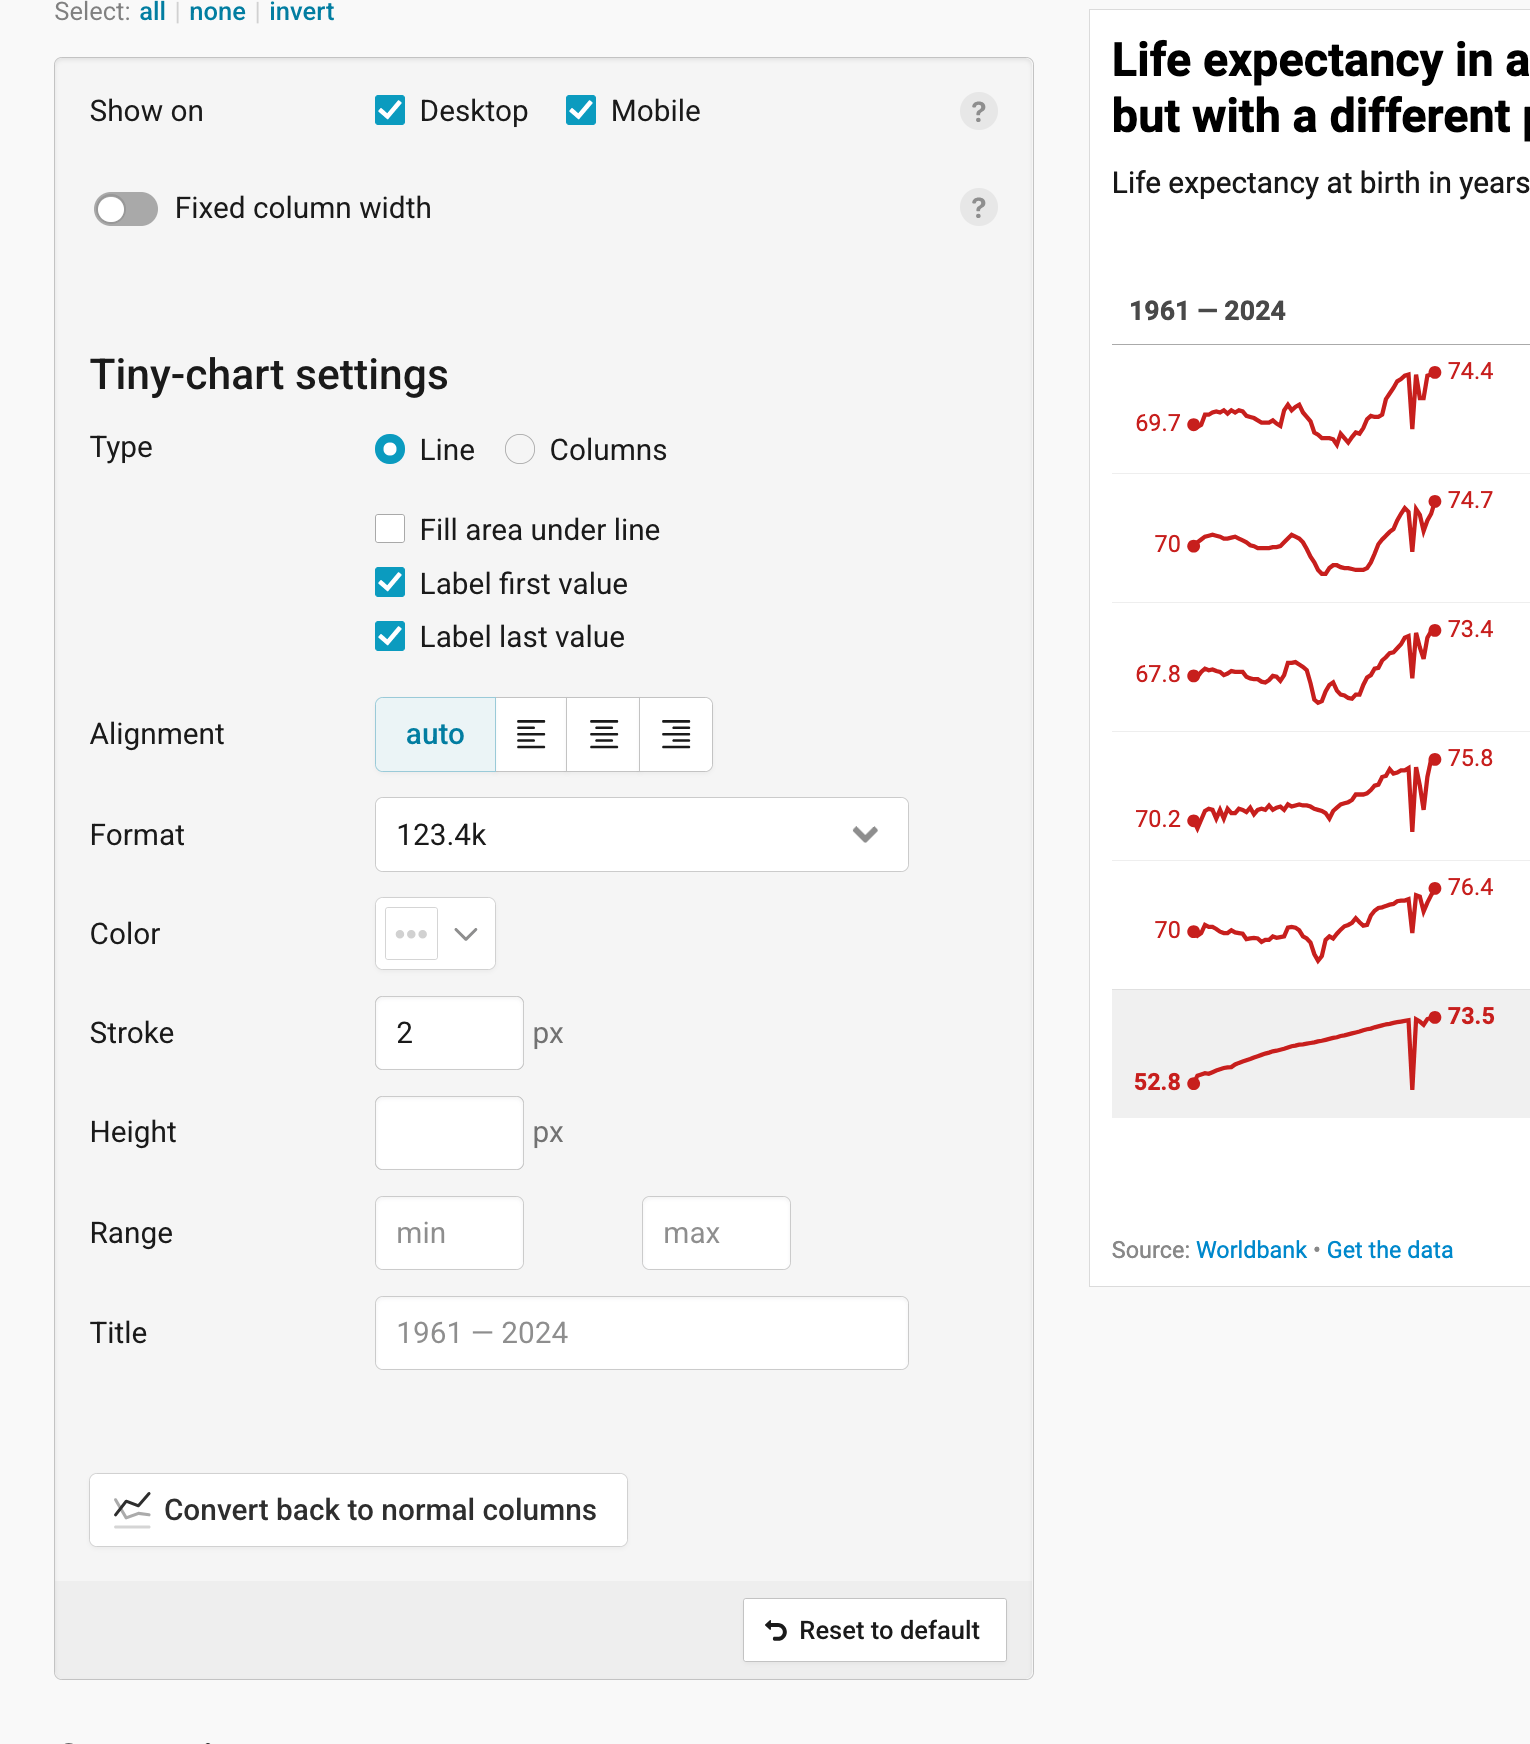
- Type: shows your values as a Line (the default) or as Columns. For lines, you can also Fill area under line, and Label first value and Label last value (both on by default).
- Alignment: aligns the tiny chart to the left, center, or right of the cell (auto by default).
- Format: decides what the labeled values look like, for example "1.3k" instead of "1,303".
- Color: lets you choose the color of the line or the columns. For columns, you can pick another color for negative values (neg.).
- Stroke: sets how thick the line is (2px by default). This option only appears for lines.
- Height: sets how tall the tiny charts are.
- Range: sets the min and max value of the tiny charts. By default, it's based on your data.
- Title: lets you change the header of the tiny chart column. By default, it combines the names of the first and last column.
To turn your tiny chart back into the original columns, click on Convert back to normal columns. Learn more about adding tiny charts to tables.
Adding flags
Replace country codes with flags turns country codes between colons, like ":zw:" for Zimbabwe, into flags. That only works in text columns. Under Format, you can choose square 1×1 flags, rectangular 4×3 flags, or round Circle flags. Learn more about adding flags to tables.
Styling rows
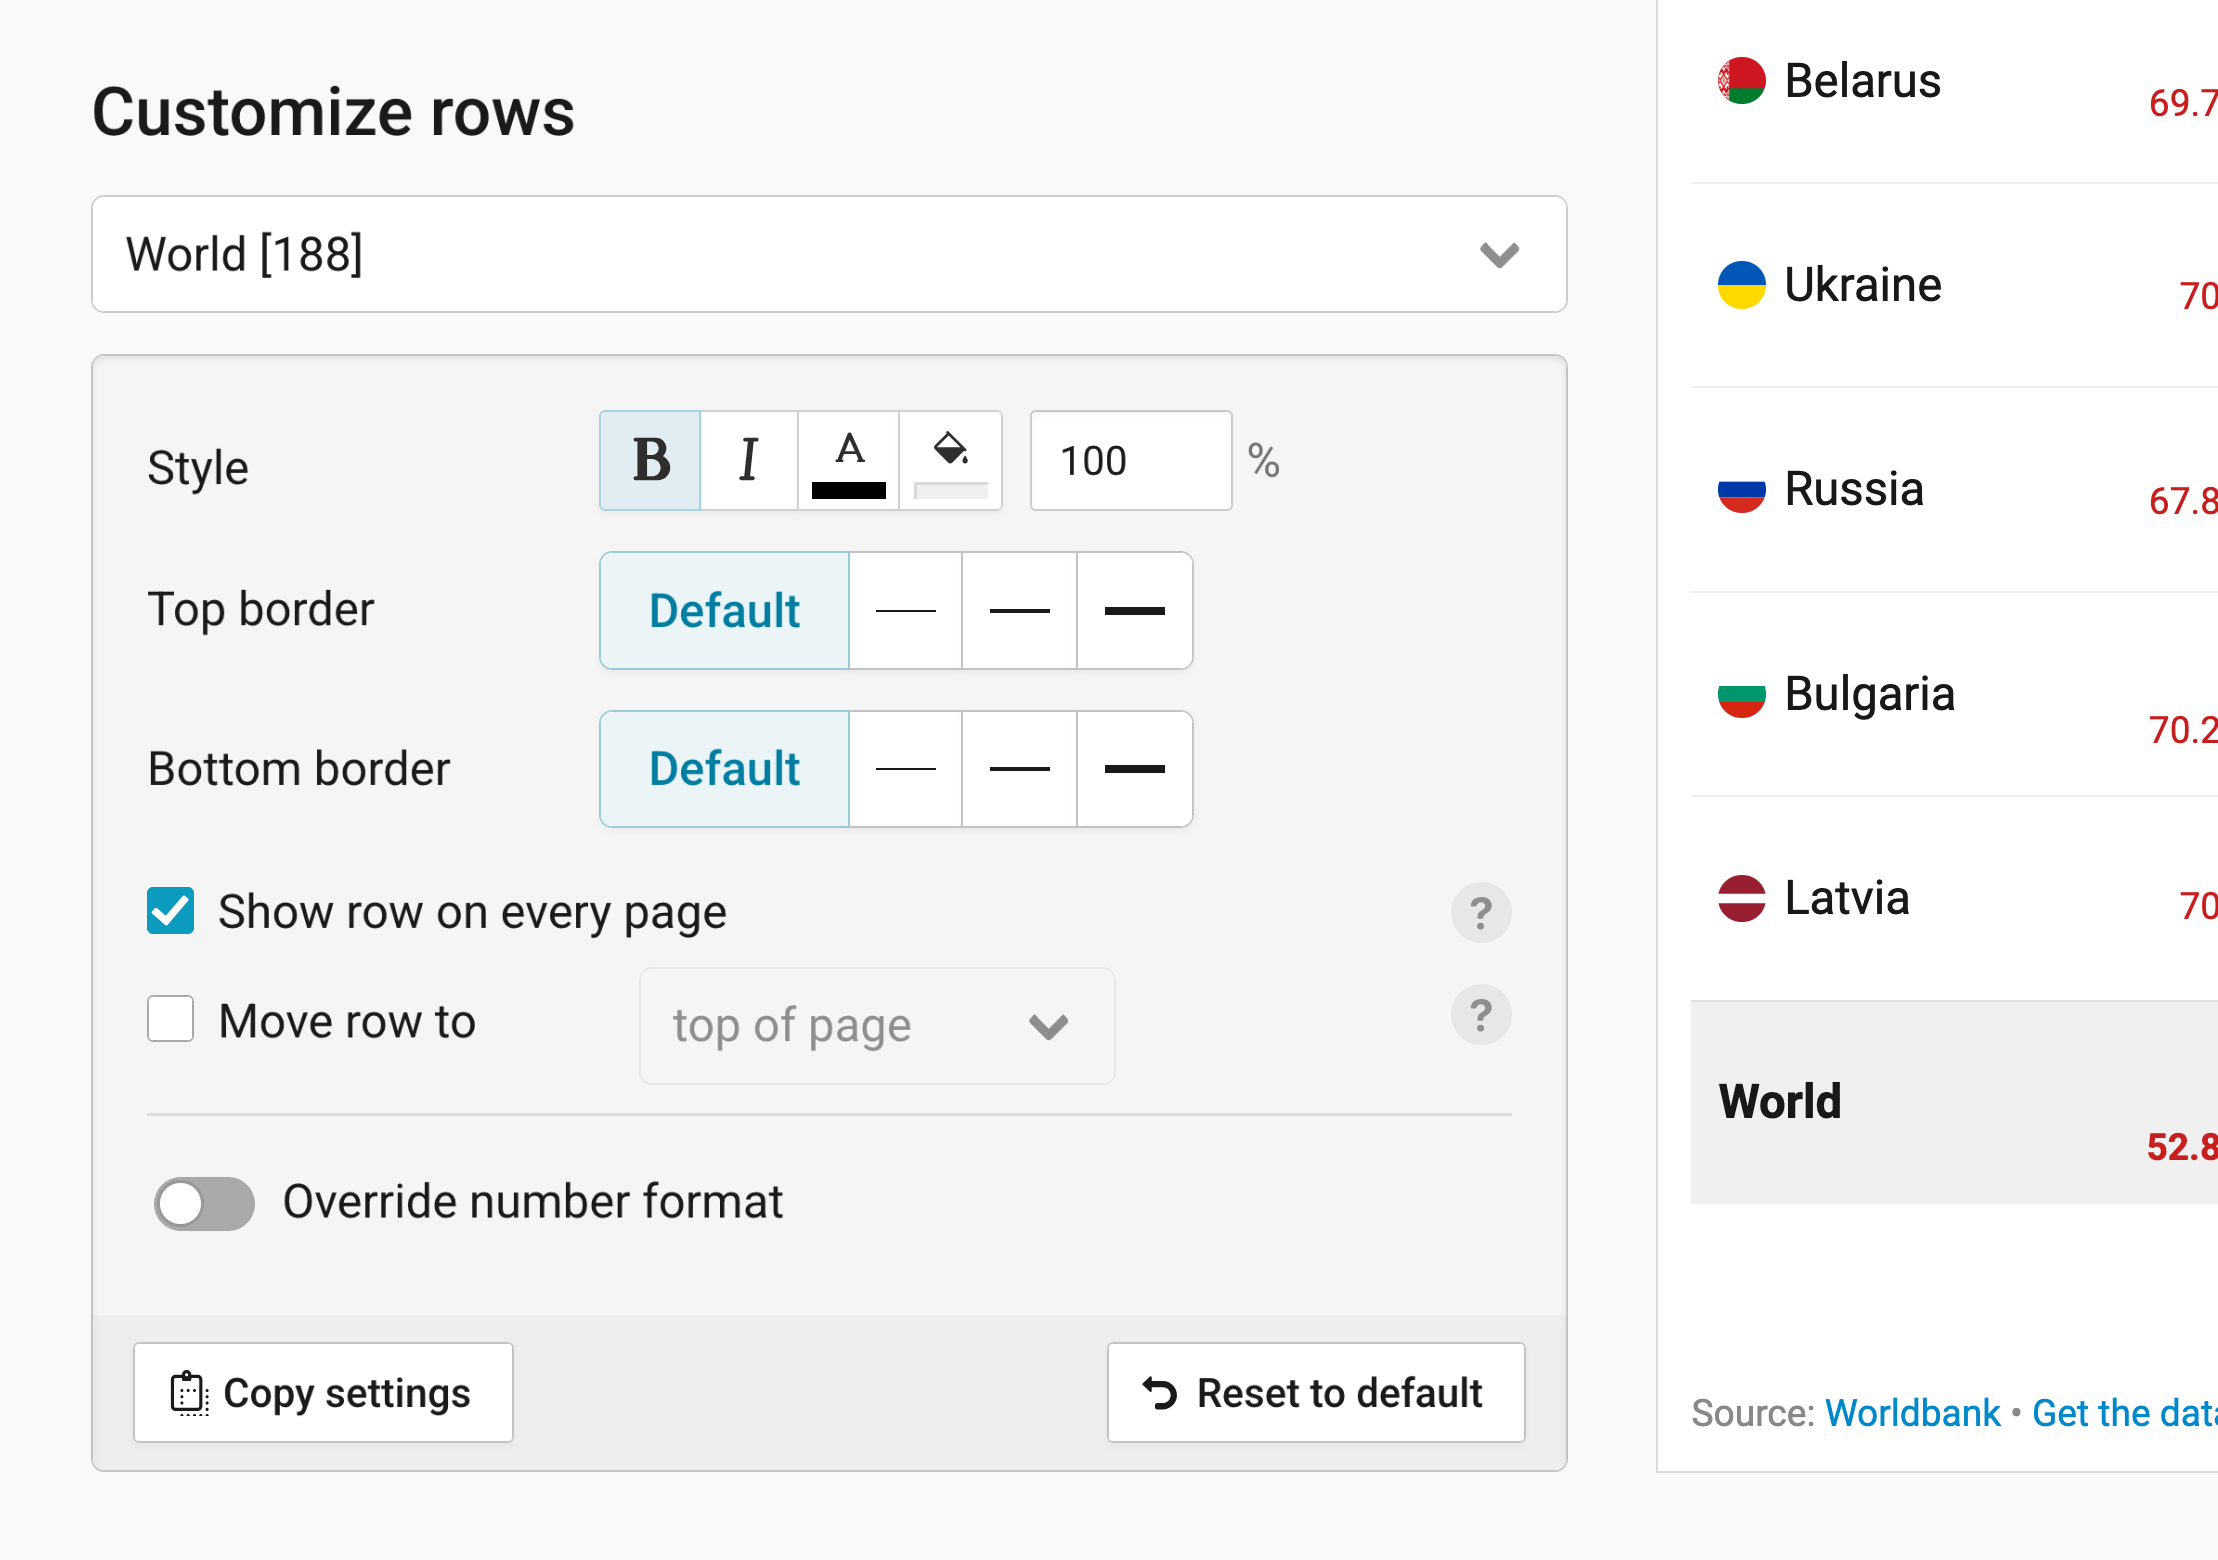
In the Customize rows panel in step 2: Check & Describe > Refine, you can style and highlight single rows to stand out. Select a row in the dropdown, then change its Style (bold, italic, text color, background color, and font size), or add a Top border and Bottom border. You can style as many rows as you like, each differently, or copy the settings of one row to others with Copy settings.
- Show row on every page does exactly that. That's useful if readers should be able to compare the values in each row on any page to that specific row.
- Move row to: moves a row to the start of table/top of each page or to its end, for example a row with totals or a row readers should compare all other rows to.
- Override number format: gives the numbers in this row a different Format than the rest of the column.
Styling the header
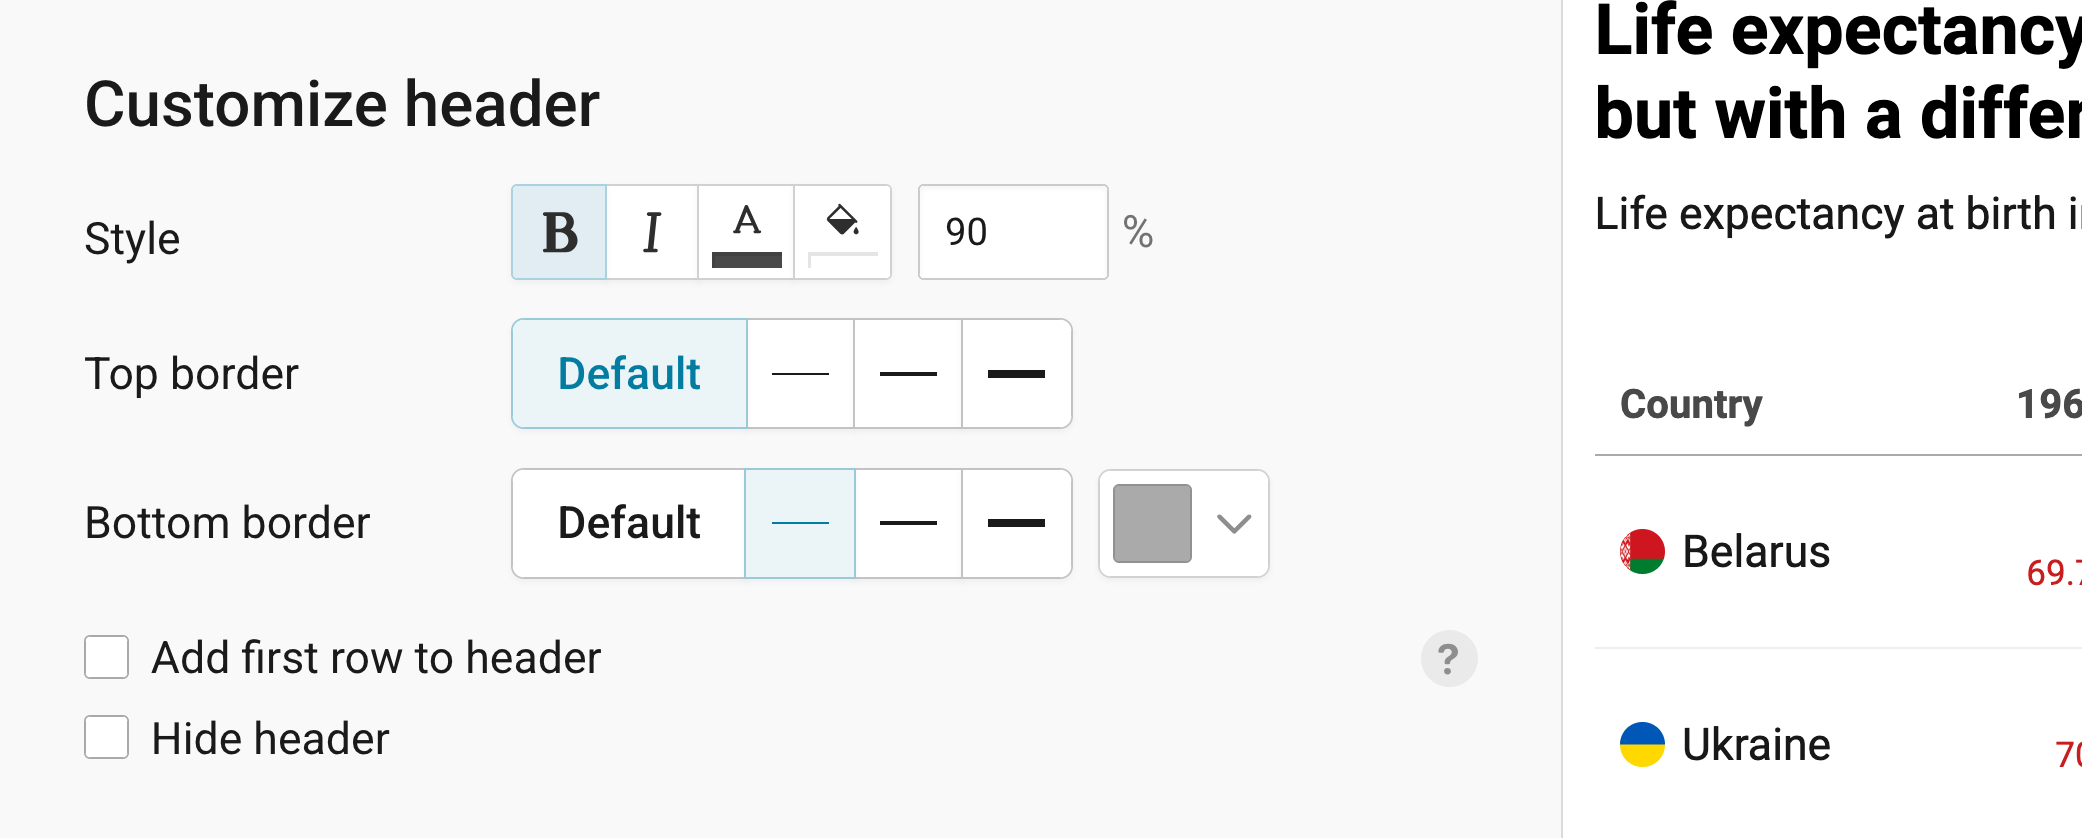
The header shows the names at the top of each column (not to be confused with the title of the table). By default, it's bold, a bit bigger than the rest of the table (110%), and has a line below it. In the Customize header panel, you can change its Style, and its Top border and Bottom border, including the color of the bottom border.
- Add first row to header: creates a header with two rows. Make sure to add useful information in the first row below the header (in step 1 or step 2) before turning on this feature. Learn more about creating a double-row header.
- Hide header: hides the header completely.
Creating a heatmap
In a heatmap, each cell gets a color based on the number in it. Click on Activate heatmap in the Heatmap panel to turn all number columns into a heatmap. If you only want some of them to be a heatmap, turn off Show as heatmap for the others in the Customize columns panel.
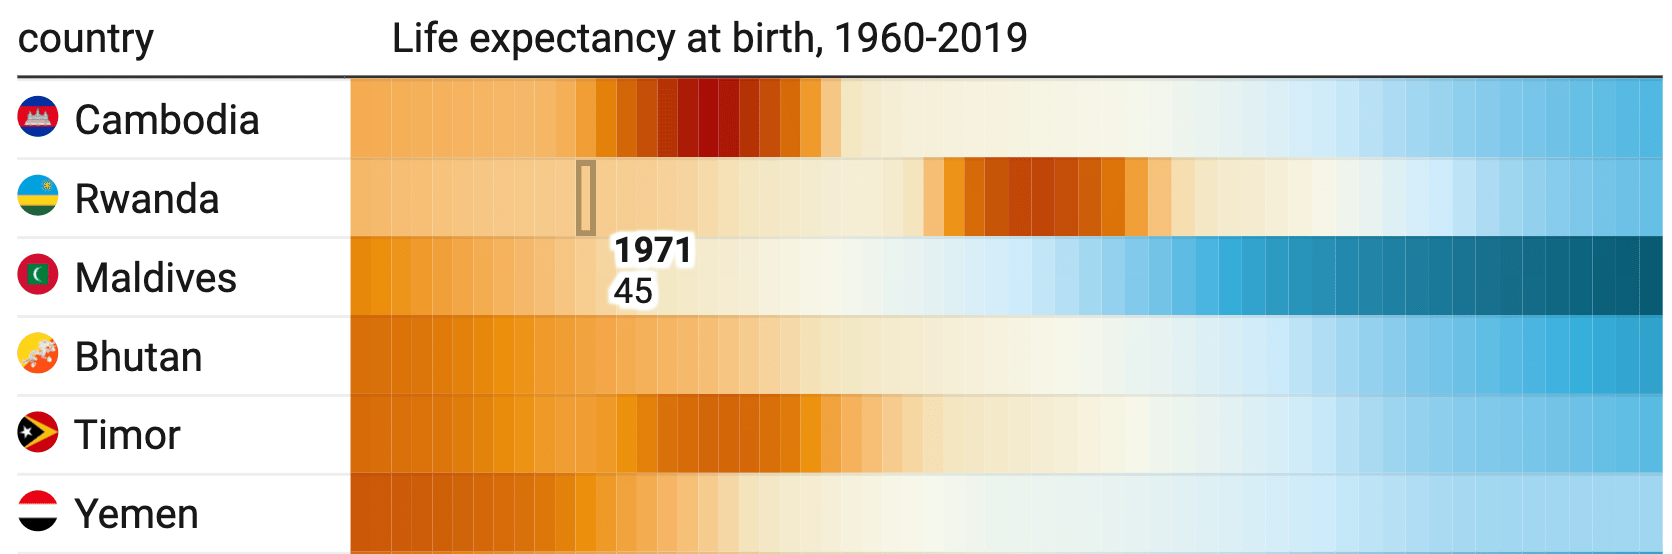
Once your heatmap is activated, you get these options:
- Select palette: lets you choose the colors of your heatmap. Click on the pen symbol next to the palette to change its colors.
- Type: shows the colors as a Continuous gradient (the default) or in Steps.
- Interpolation: decides how the colors get distributed across your values (Linear by default).
- Custom range: sets the Min, Center, and Max value of your color gradient. By default, they're based on the lowest and highest number in your heatmap columns.
- Hide values in heatmap columns: shows only the colors, without the numbers. With Show values in tooltips instead, readers can still see the numbers when they hover over a cell.
- Show color legend: explains what the colors mean. Datawrapper recommends adding one whenever your table uses colors. You can decide on its Position, Size, Labels, Format, and Legend title, and reverse the order of its colors with Reverse legend item order.
To turn the heatmap off again, click on Deactivate heatmap. Learn more about creating heatmaps.
Adding a title and source
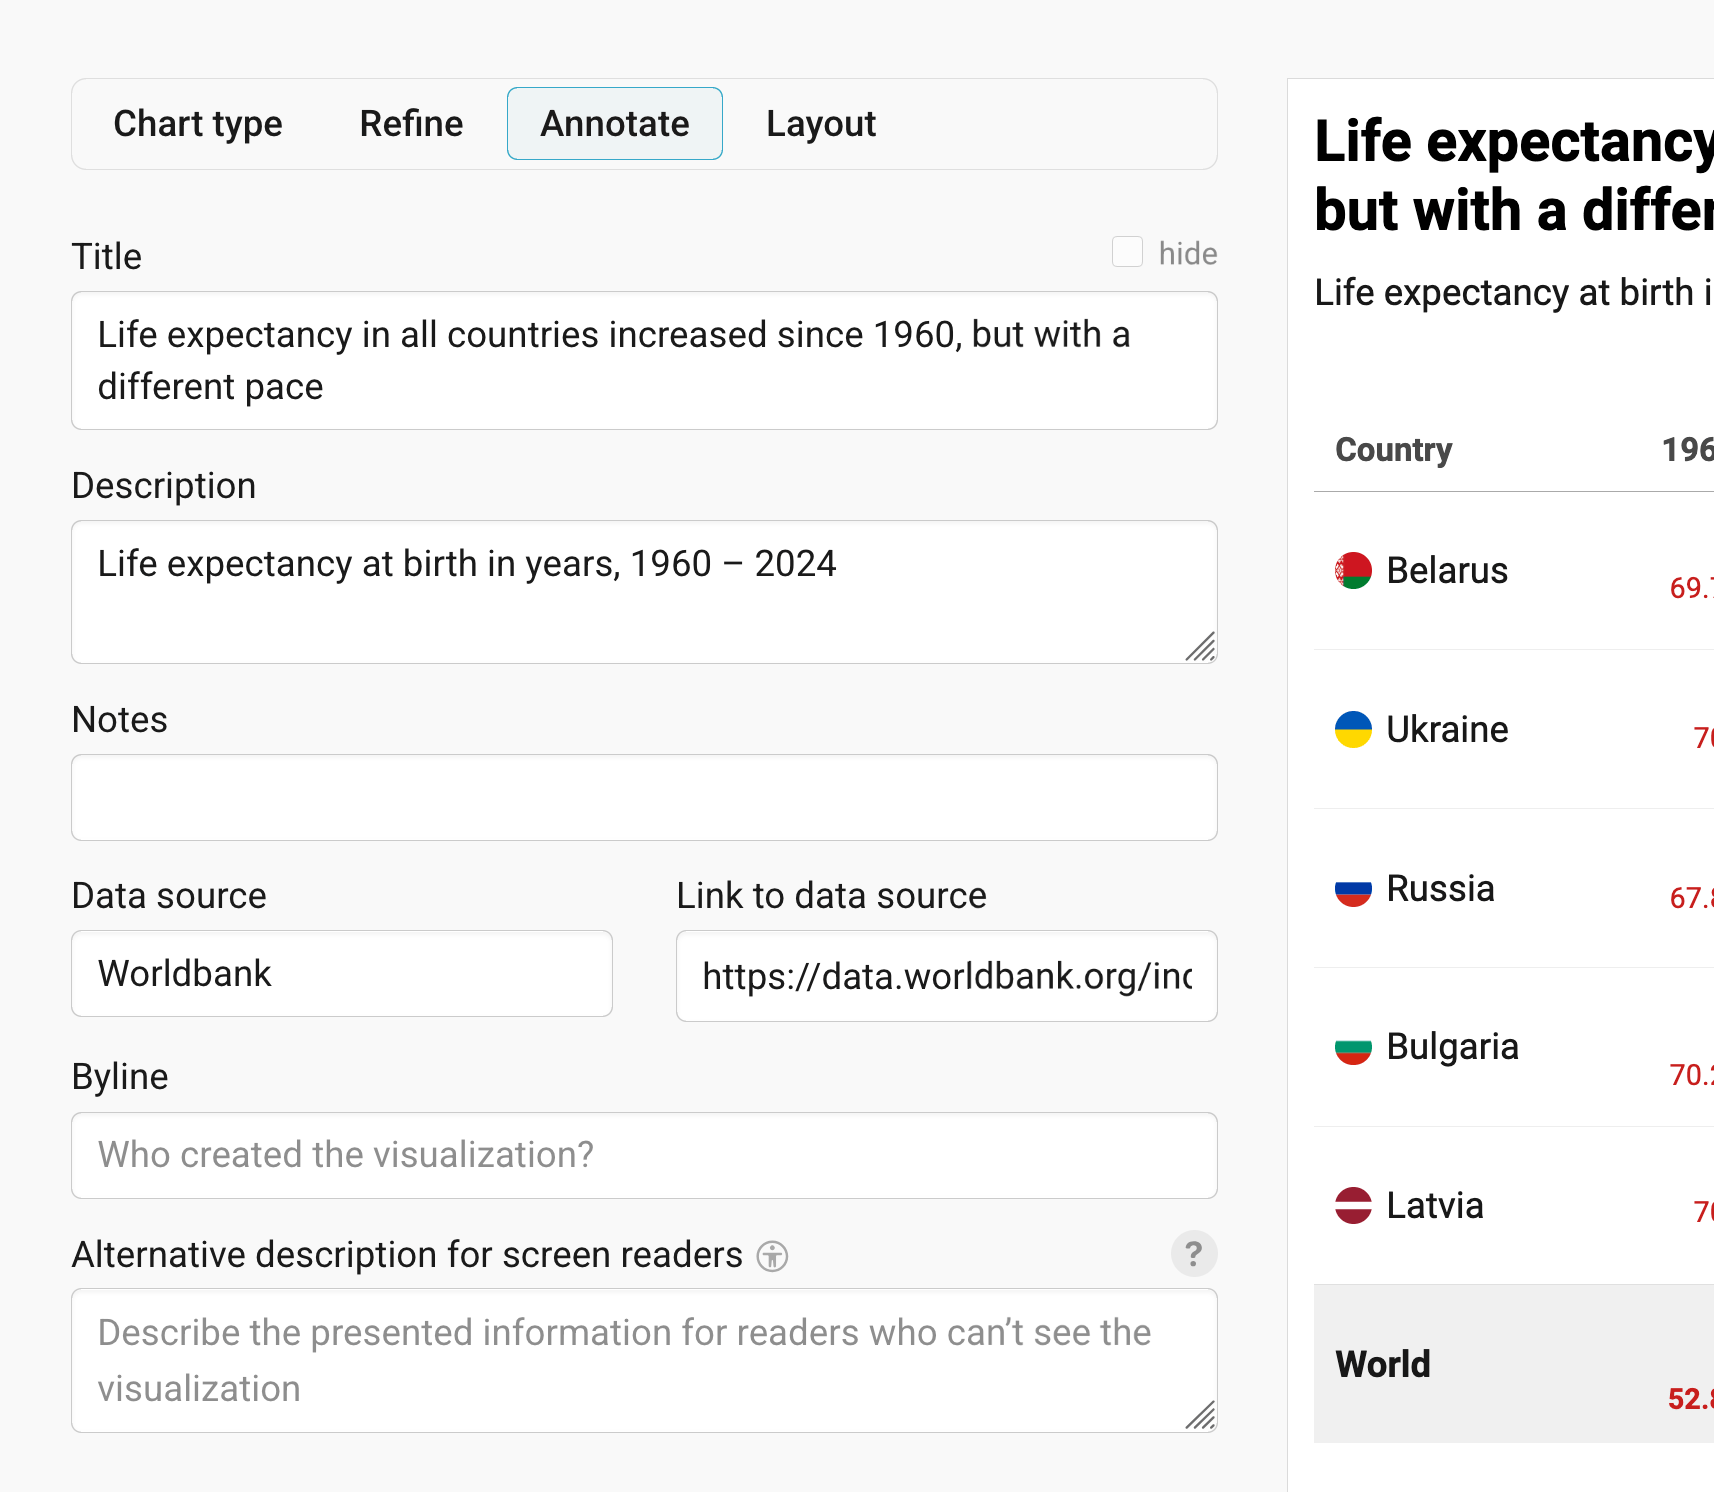
In step 2: Check & Describe > Annotate, you're asked to give your visualization a title, description, notes, source, byline, and an alternative description for screen readers. You can find a detailed explanation of all these Annotate options here.
Publishing your table
In the Layout tab, you can select an output locale, change the design theme and footer options, and enable social sharing. Find a detailed explanation of all the Layout options here.
In step 4: Publish & Embed, you can first publish your table and then decide how it gets to your readers. We recommend pasting the embed code into your website or CMS, but you can also share the table's URL. Learn more about both options here. To use your table somewhere else, download it as a PNG (on any plan) or as an SVG or PDF (on paid plans). See what each plan includes on our pricing page.
And that's it! You've successfully created and customized a table.