A new design and name for our documentation


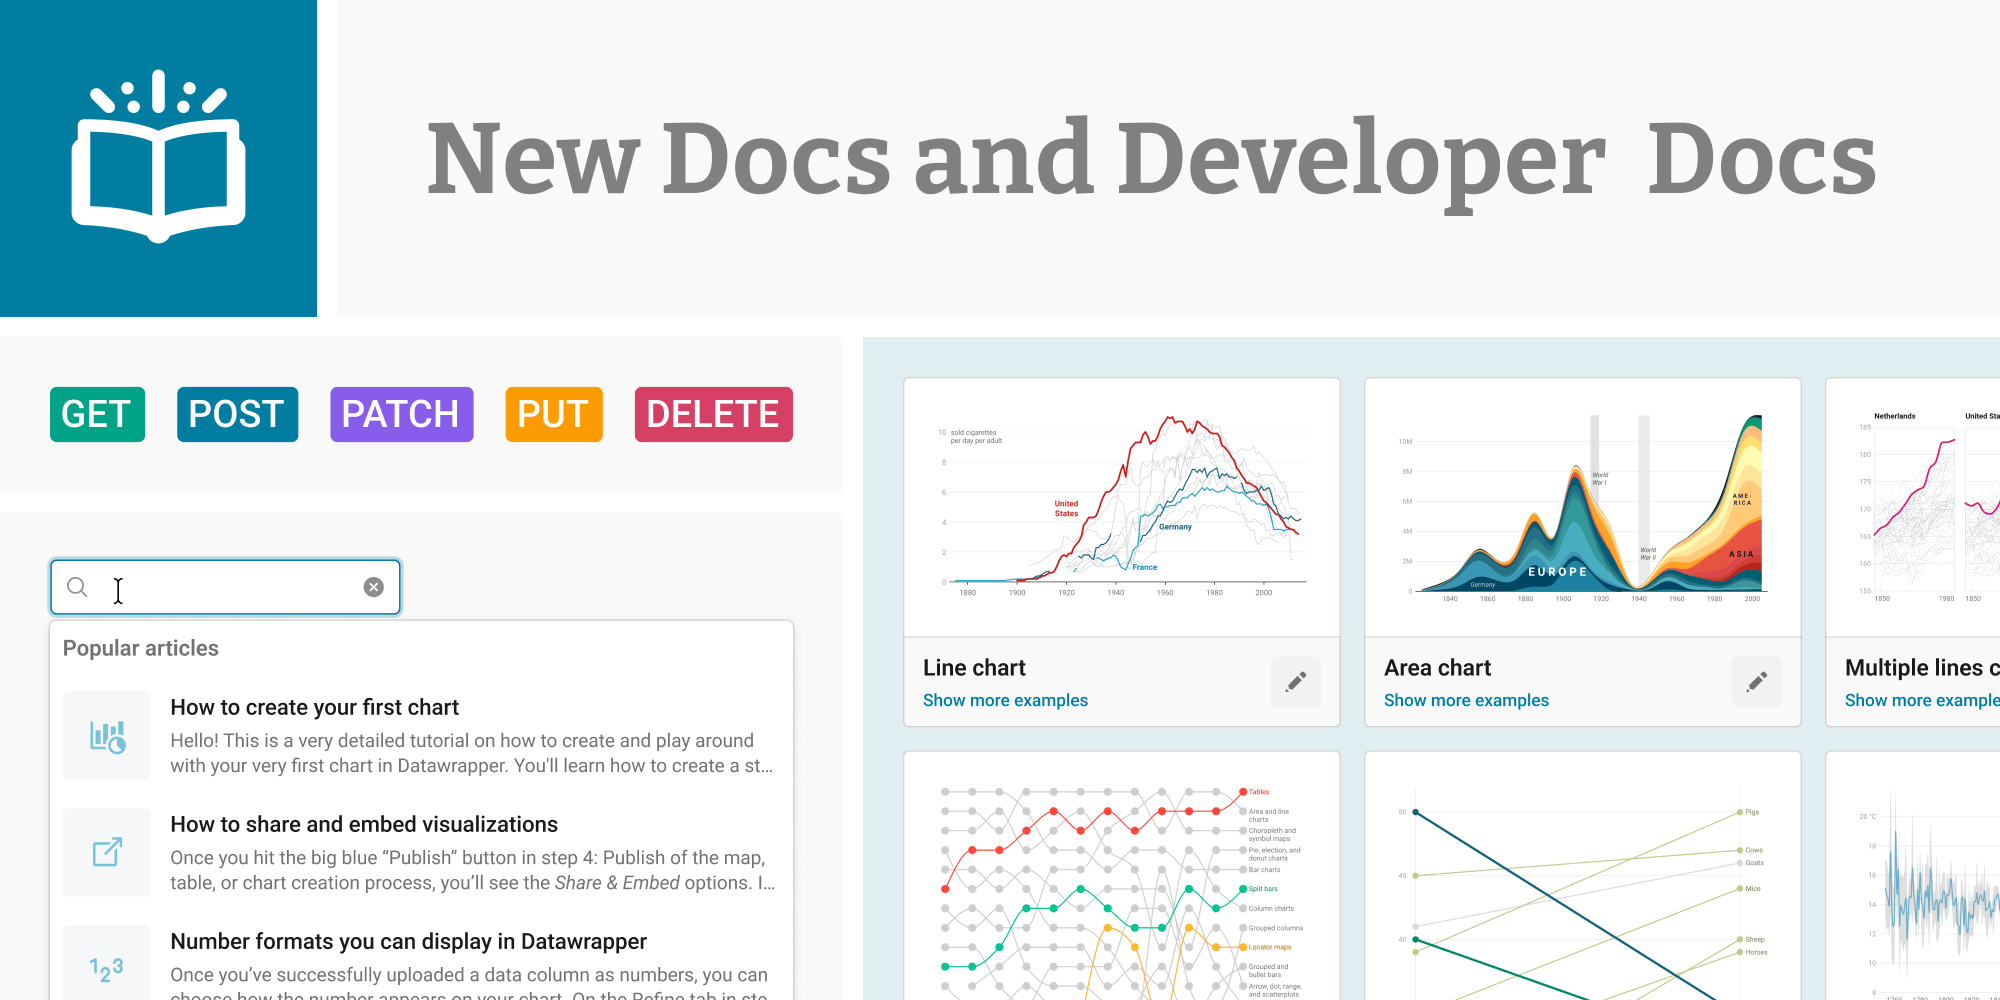
Documentation (the “user manual” where you can learn how to use Datawrapper) has always been an important part of Datawrapper. Today, we’re happy to announce that we’ve changed the design and structure of both our Docs and Developer Docs to make it easier for you to find the information you need – and we’ve given it a new name.
Here’s what’s new.
The “Academy” becomes the “Docs”
For more than ten years, our documentation was called “Academy” (here’s a snapshot from 2016, and here’s one from last month). We’ve now renamed it to the Datawrapper Docs. It’s a more fitting name: “Academy” sounds like you’ll be attending courses, which we never offered. “Docs” is short for “documentation,” and that’s exactly what our user manual is.
The name may be different, but the content you know is all still there. You’ll find 200+ articles covering everything from “How to create a line chart” to “How to set up SSO for my team”.
Find what you’re looking for, faster
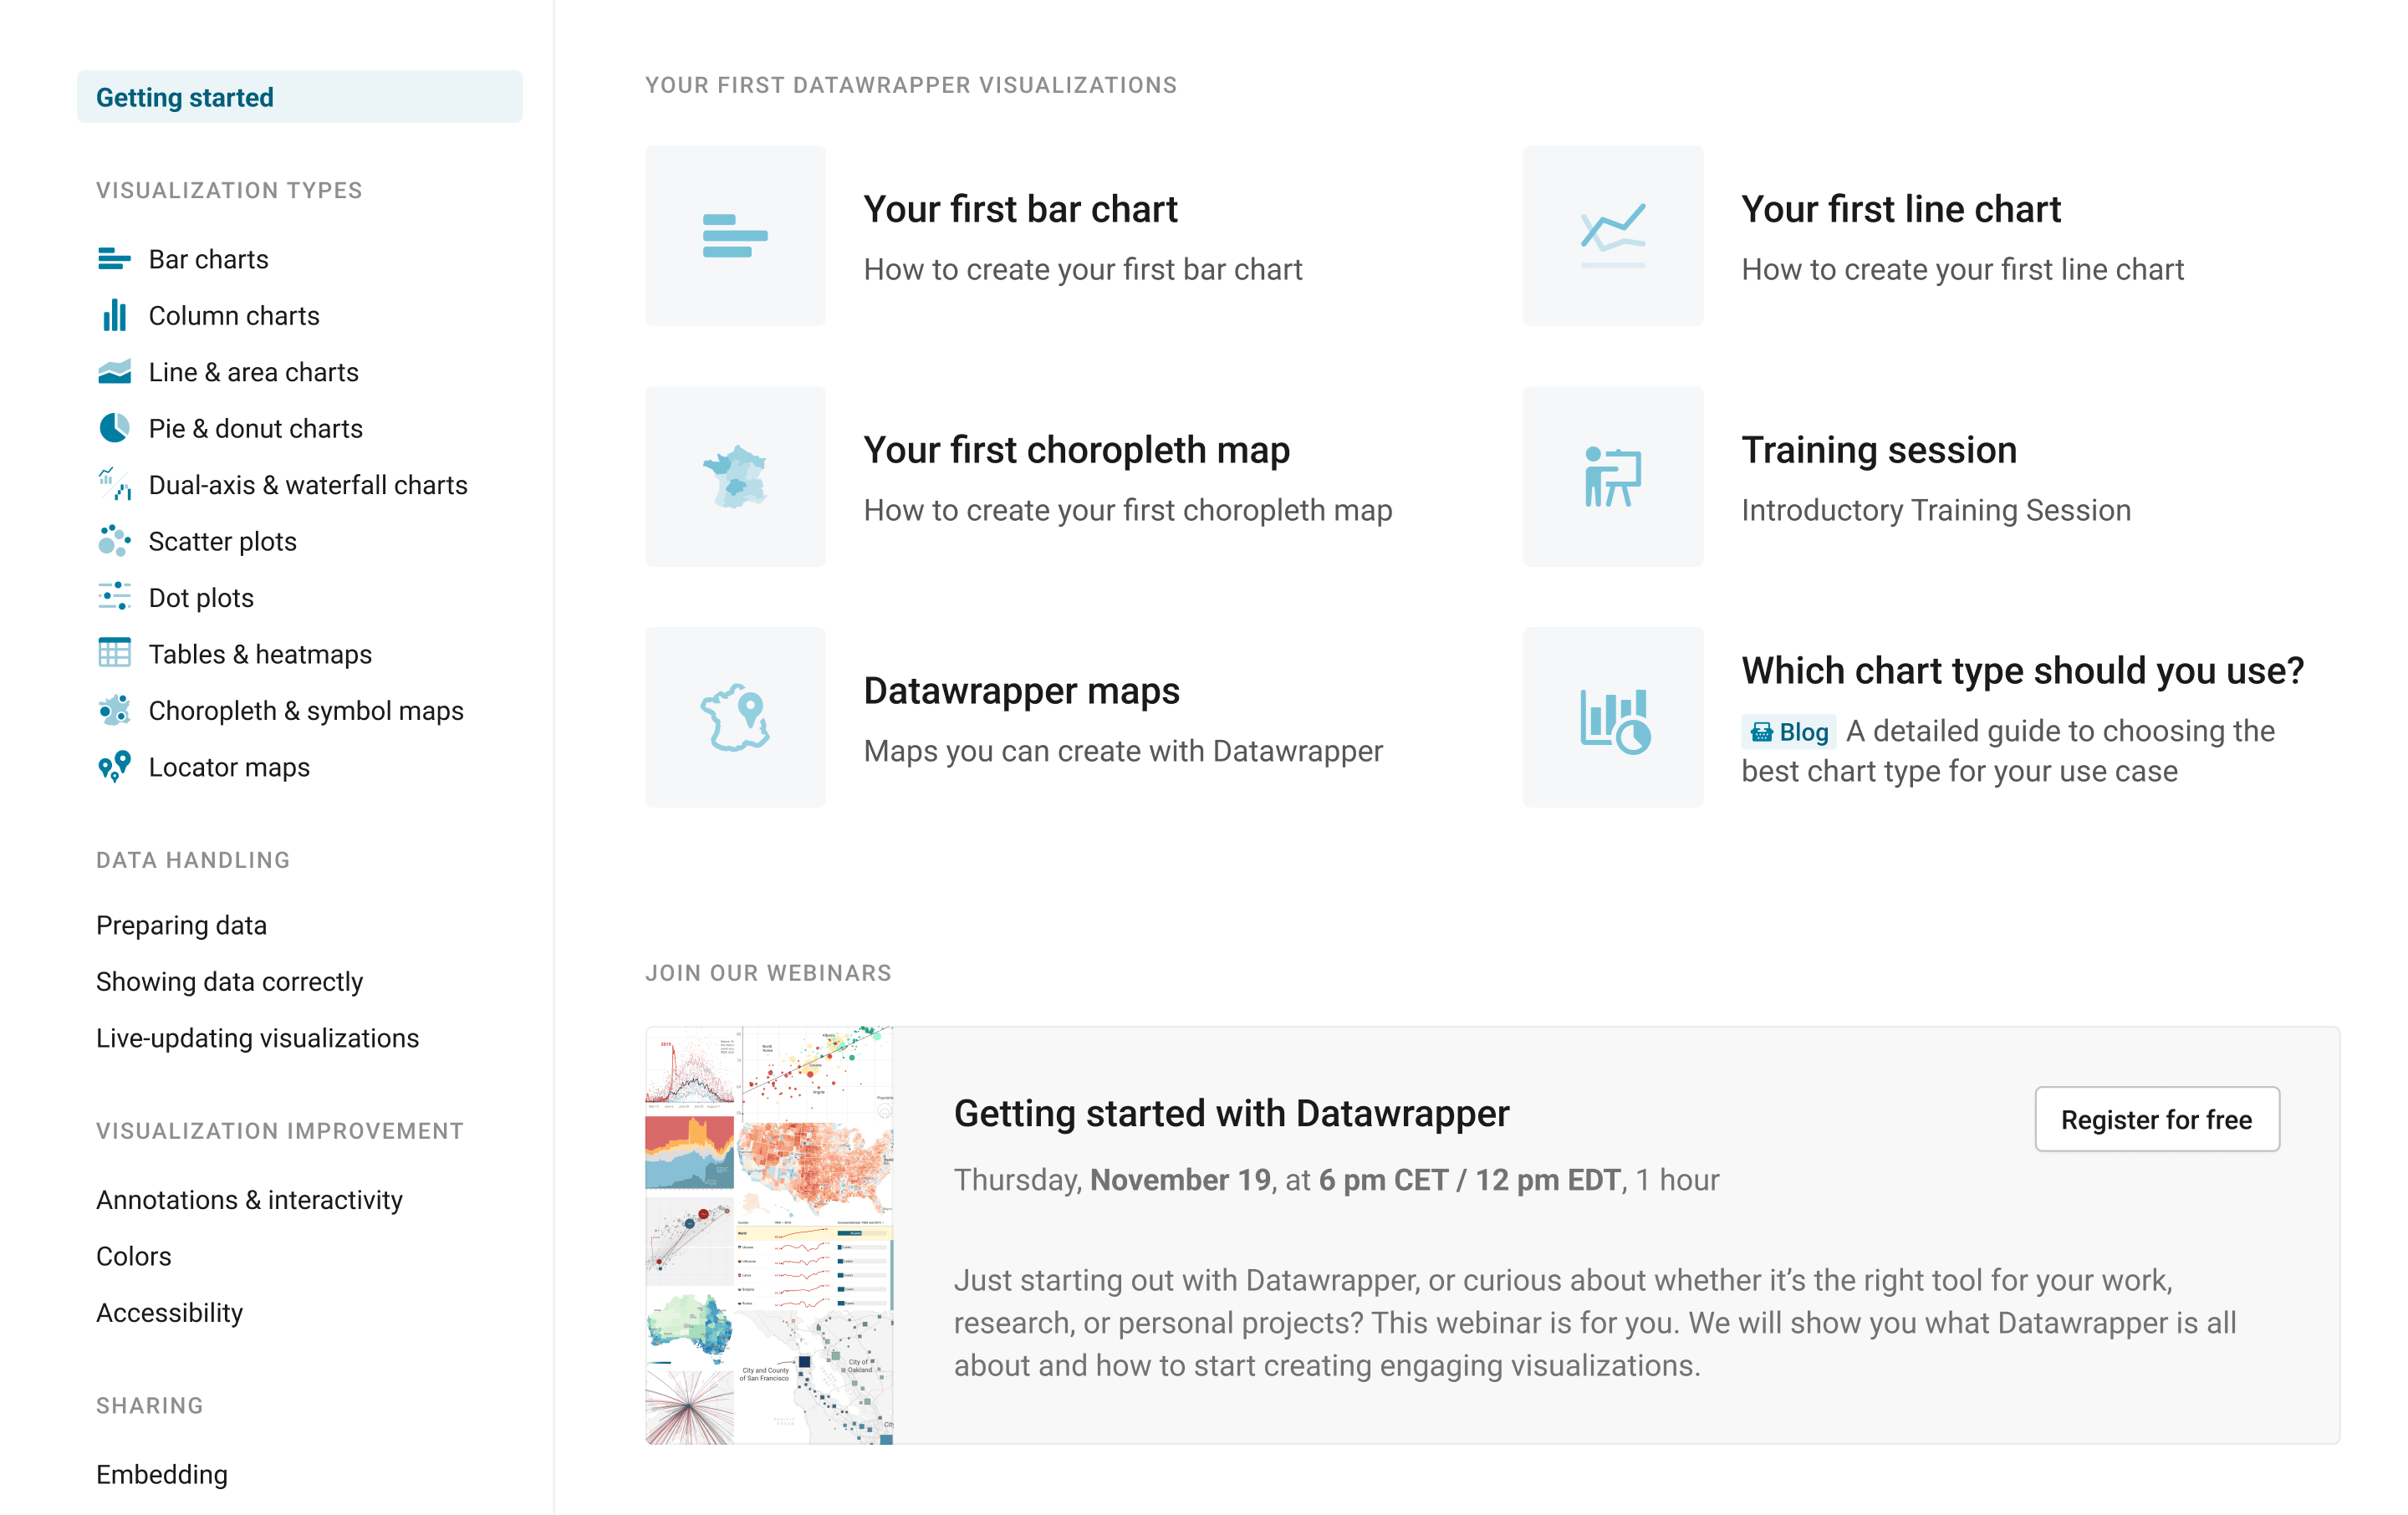
Our new Docs make it easier than ever to find information. Our articles now live in new categories that show you what to expect and better portray what Datawrapper is about. For example, we added a whole new section called “Visualization improvement” with categories for Annotations & interactivity, Colors, and Accessibility.
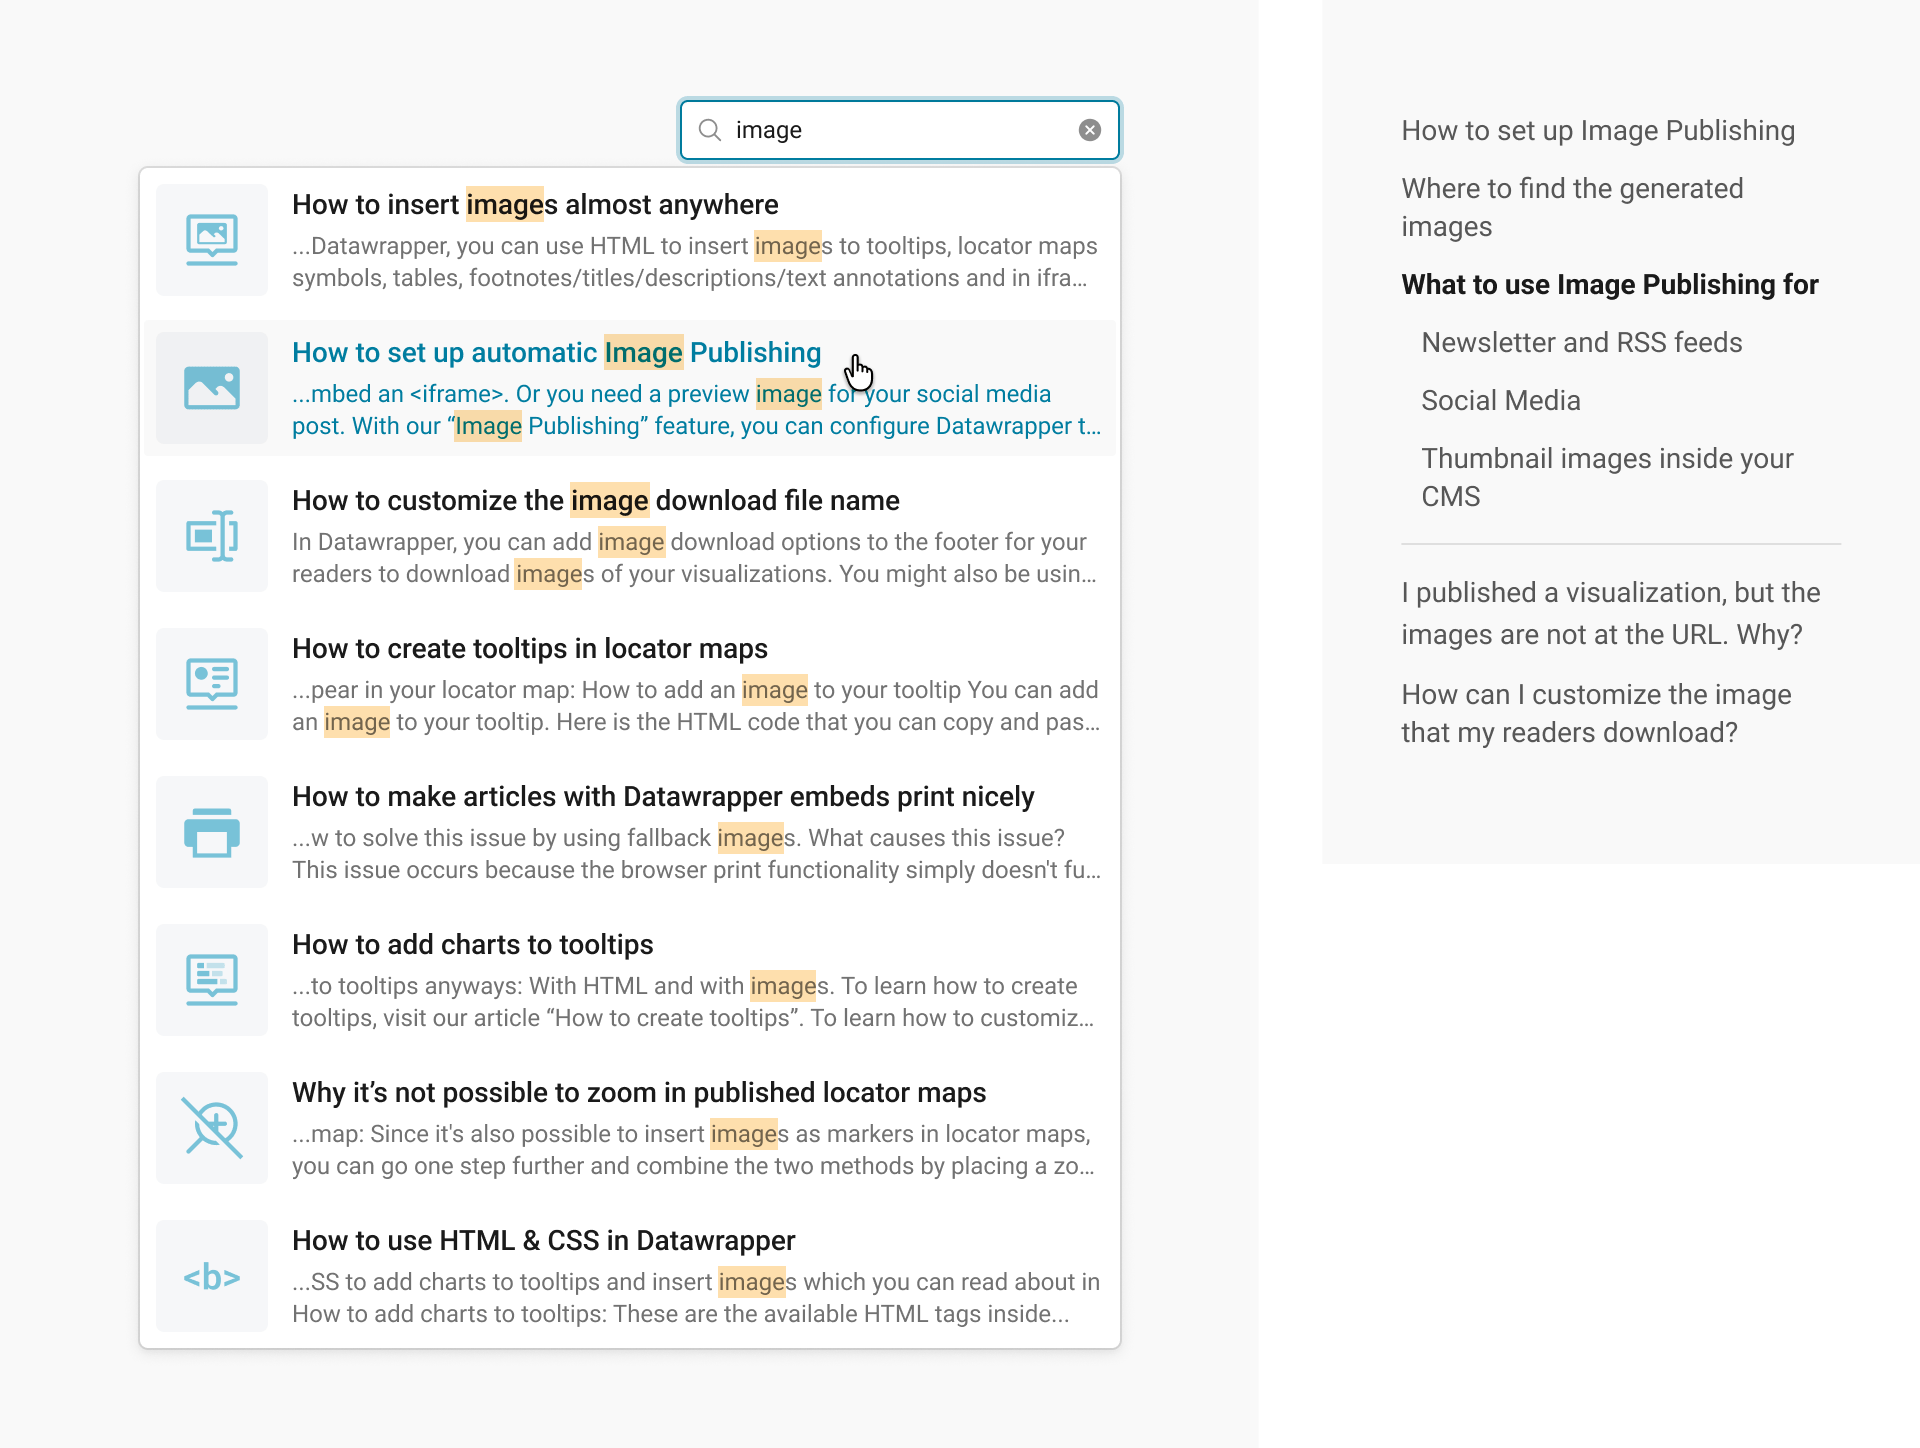
For even faster navigation, we’ve also upgraded our search. You’ll now get a more detailed view of which articles mention your search term, even if it’s further down in the text.
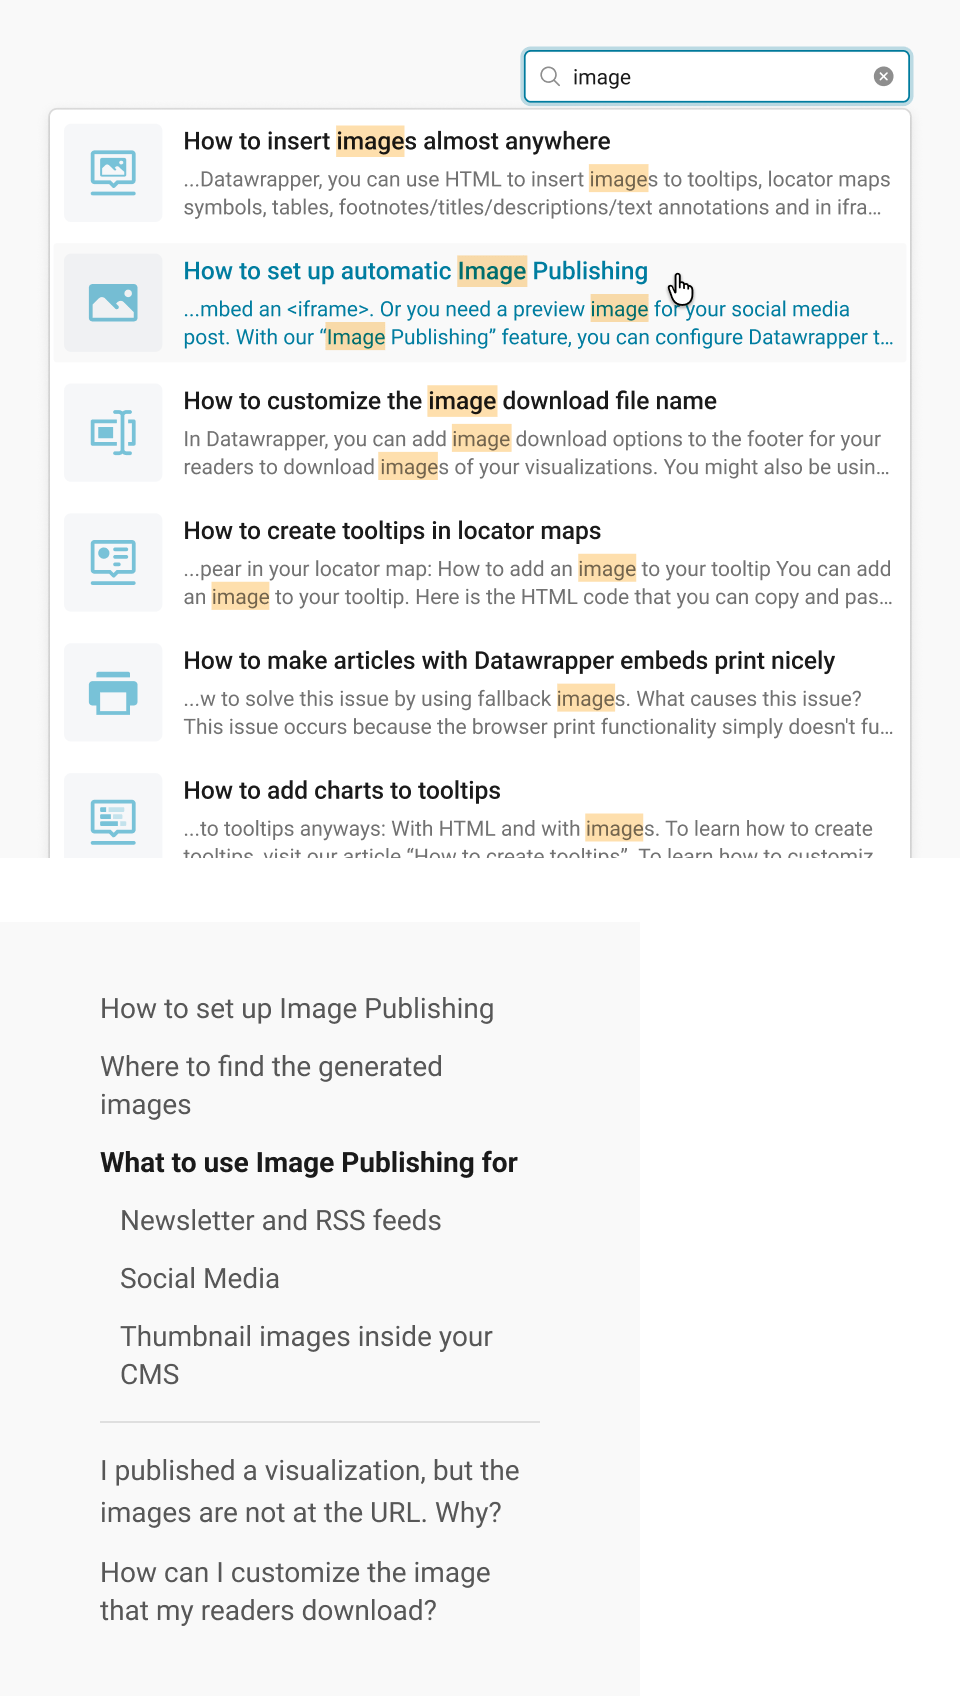
Once you’ve opened an article, you’ll benefit from our new always-visible table of contents, which lets you quickly jump to the part that’s relevant to you. It makes long articles easy to navigate, which allowed us to combine articles – for example, “How to create a line chart” now covers creating and customizing a line chart in one place. The frequently asked questions we added to the bottom of many articles also show up in the table of contents.
Get a better overview of all content about a topic
Our documentation is just one of many places where you can learn about Datawrapper and data visualizations: we also offer webinars, publish data vis guides, Weekly Charts, video tutorials, and more. Because the two questions “How can I improve my visualization?” and “How can I do this in Datawrapper?” are so closely related, our new category pages show you all relevant content about each topic, including webinars, blog posts, and articles from our Developer Docs:
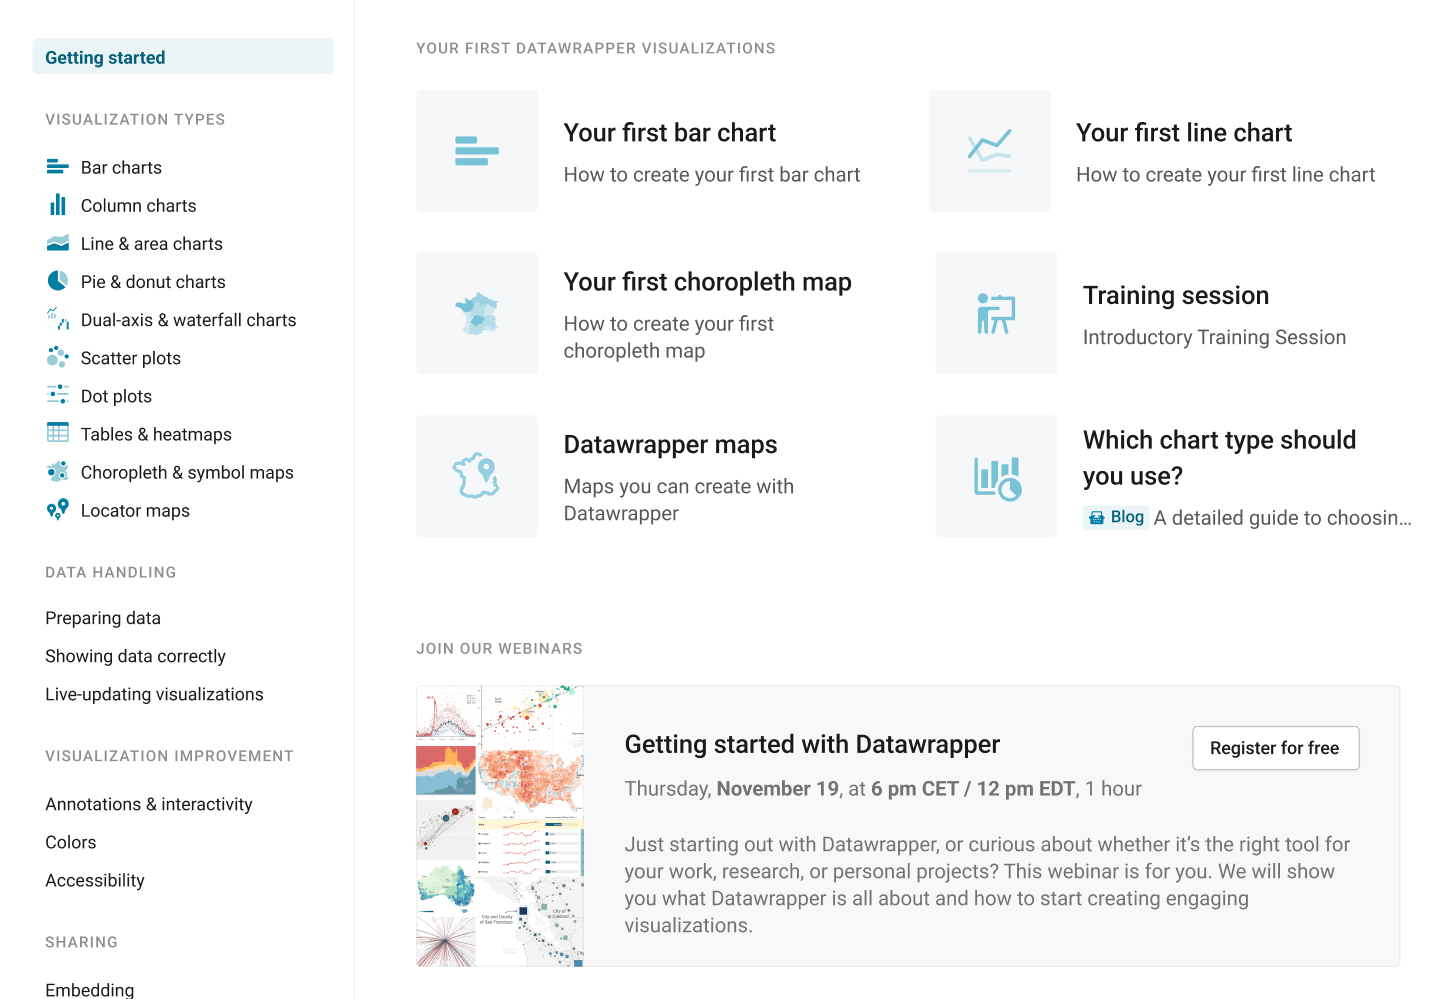
We also shortened our Docs titles on the category pages to make them easier to skim (for example, “Dark mode” instead of “How to enable Dark mode in embedded visualizations”).
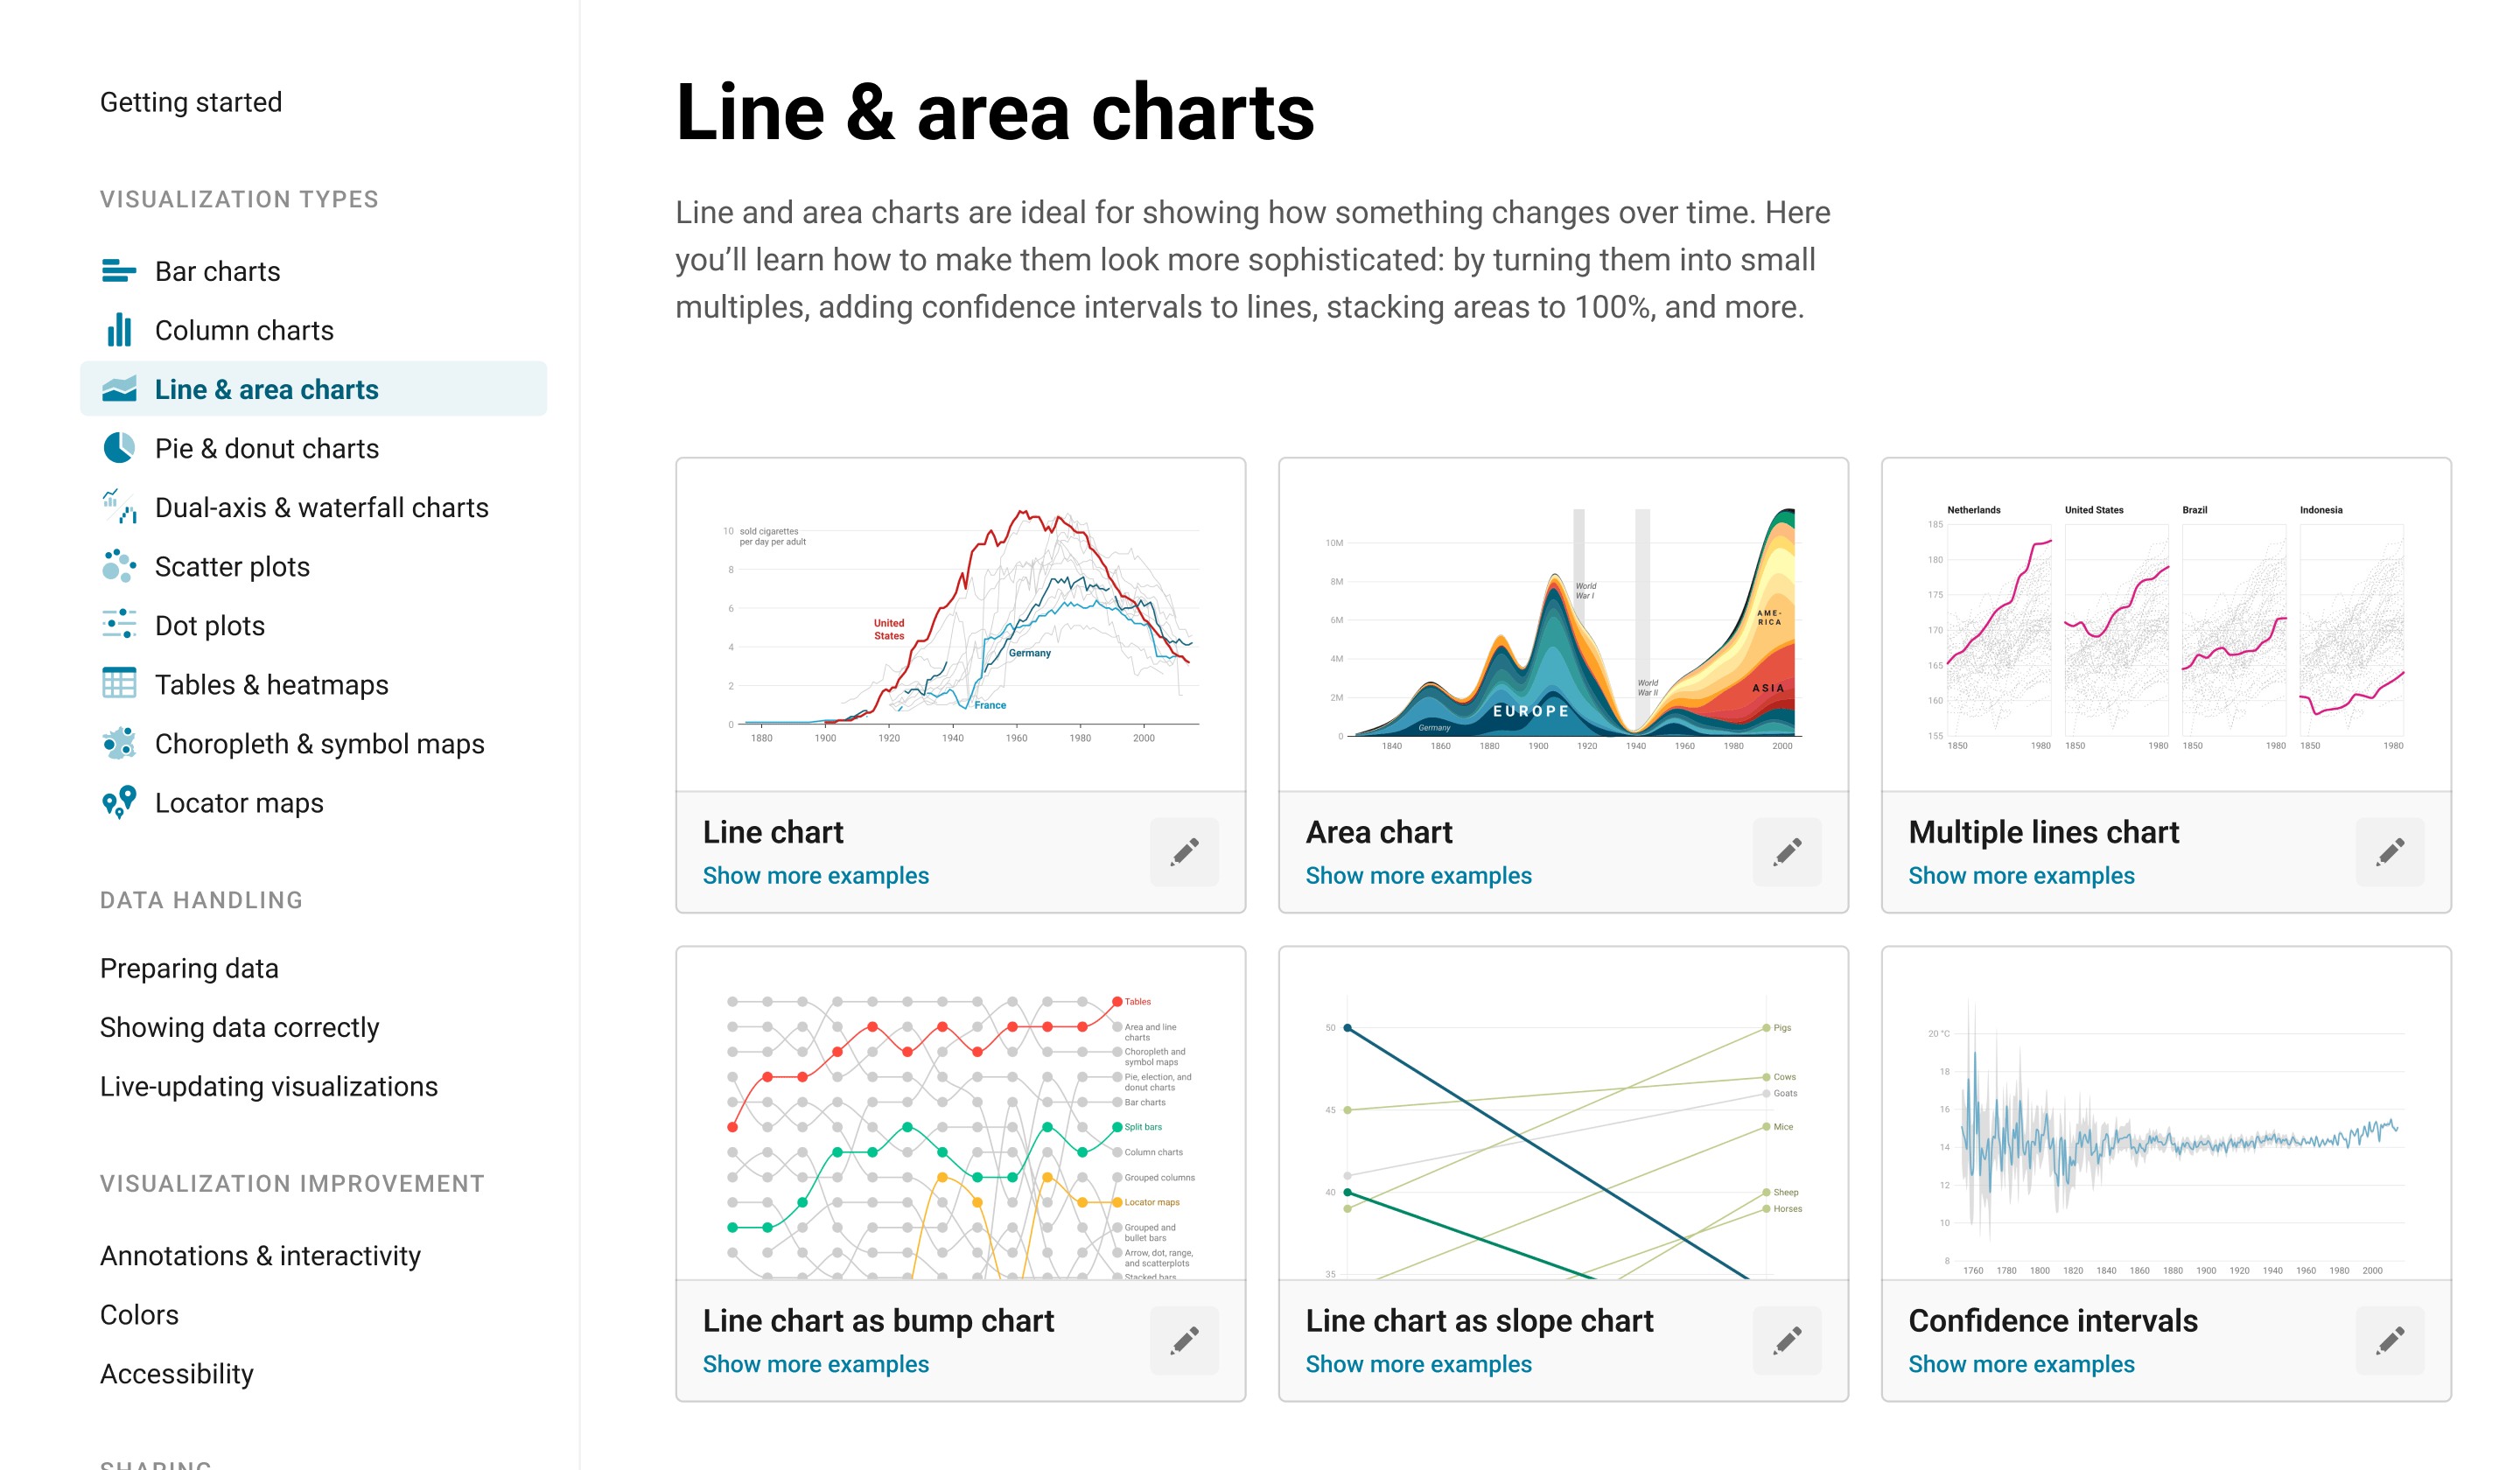
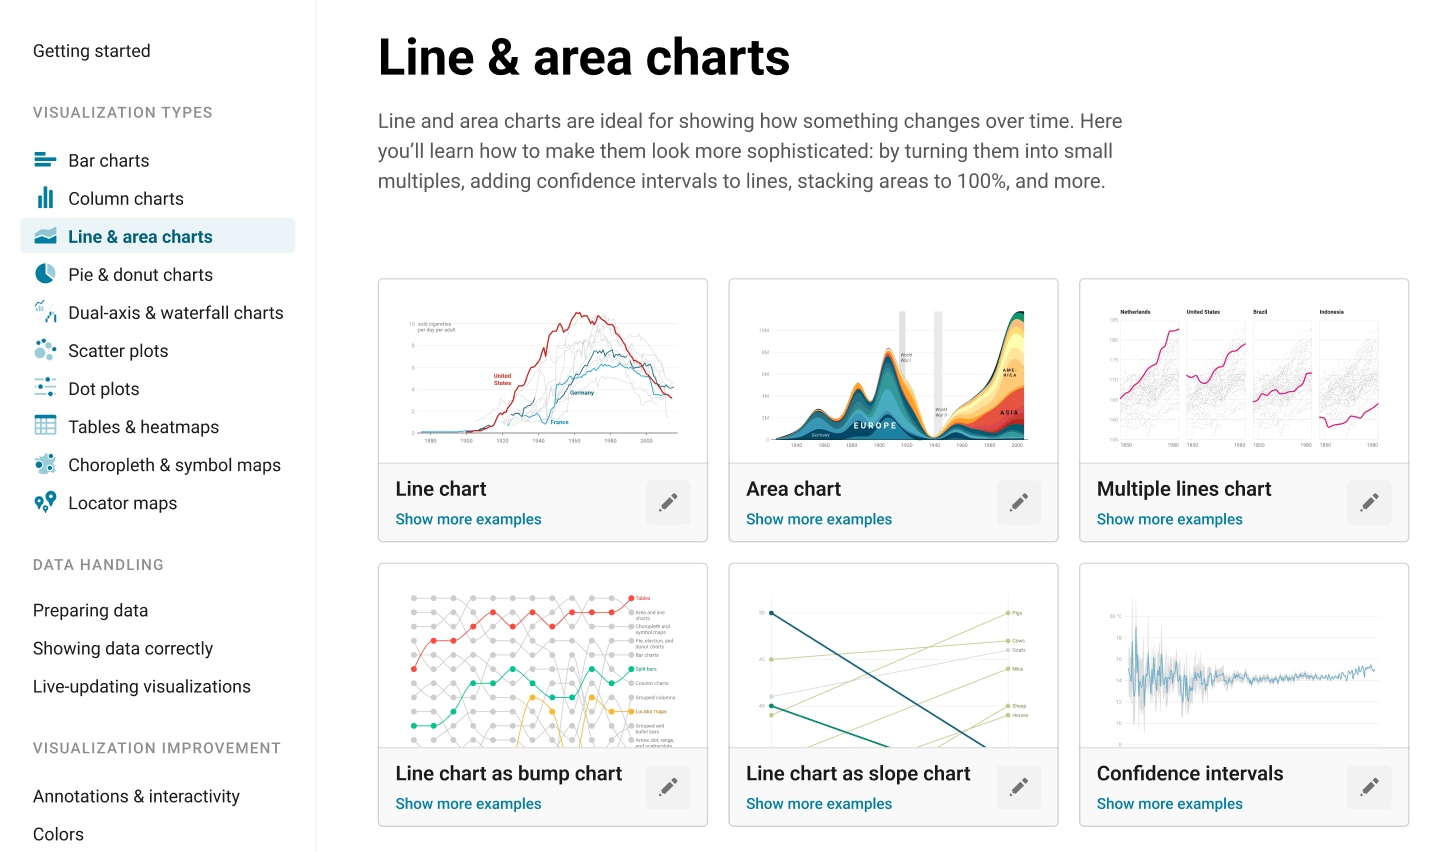
And our new sample visualizations at the top of each vis type-specific category page (example) give you an overview of what’s possible with each visualization type, while enabling you to see how: Click on the little pen icon ✎ , and you’re taken right into the app where you can retrace the settings it took to create the visualization and make changes yourself, without the need to sign in or create an account.
The Developer Docs benefit, too
It’s not just the Docs that profit from this redesign. Our Developer Docs have also been upgraded with the new look and feel. Faster search, better article layout, improved navigation – they’re all there. By aligning the design and feature set of both the Docs and the Developer Docs, we’ve made sure that any improvement we make to one will benefit the other.
Please take a look around our new Docs and Developer Docs, and let us know what you think. We’re always happy to hear from you: support@datawrapper.de


