How to create a line chart
- Free
- Pro
- Business
- Enterprise
Line charts are ideal if you want to show trends and developments over time. They're one of the most common chart types, and your readers will find them easy to read and to understand.
This article explains how to create and customize the following line chart. We explain all the settings you'll encounter on the way:

Preparing your data
Formatting your data
Before you can import the data to Datawrapper, you need to prepare it.
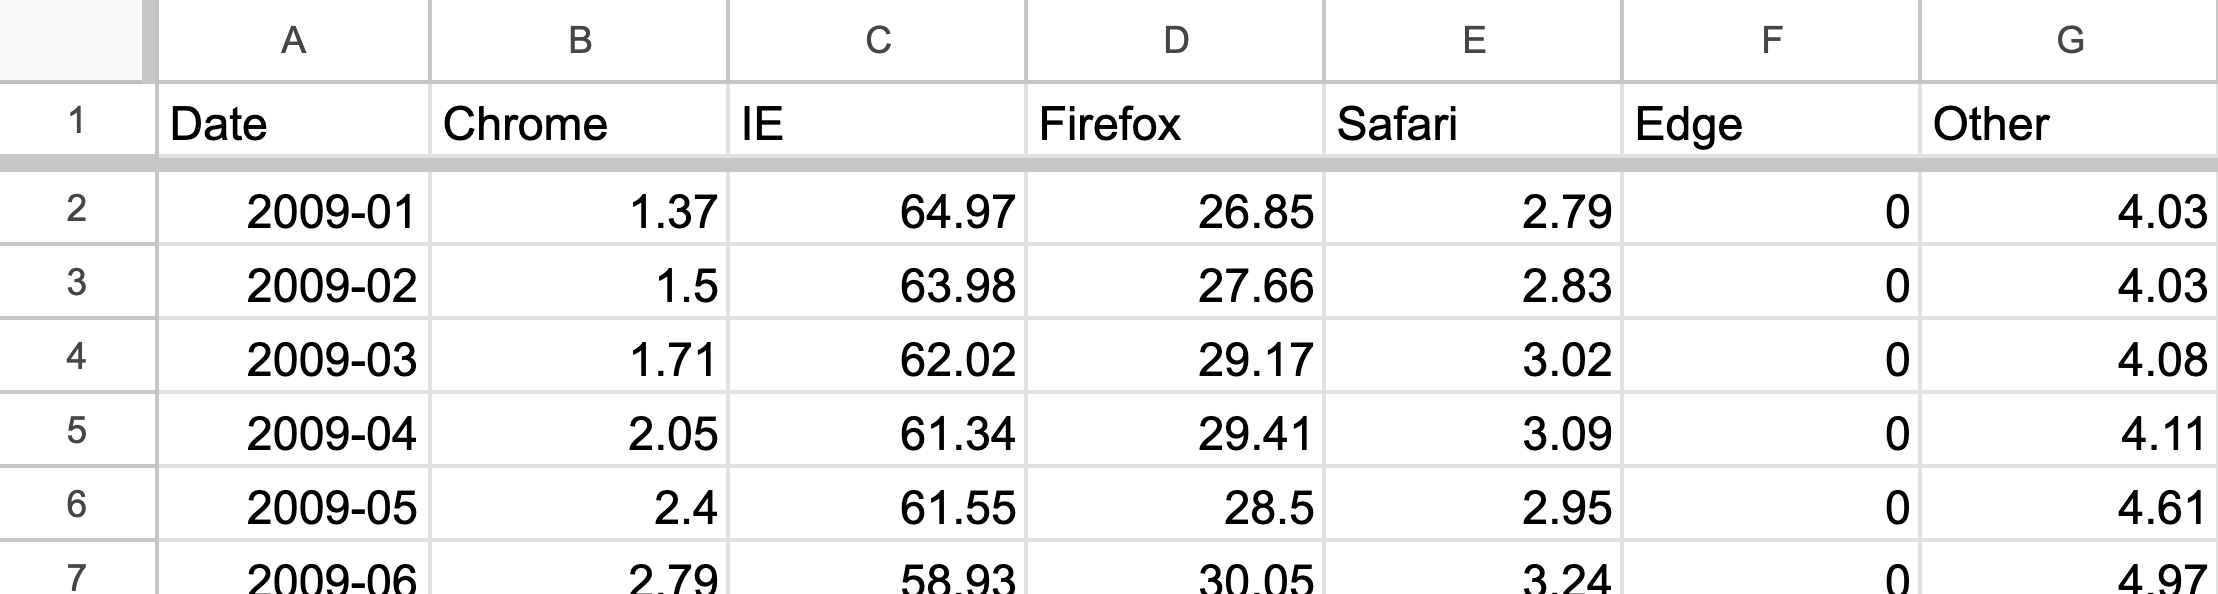
Your data set needs to have the following structure:
- One column contains the dates/times that will be plotted on your horizontal axis. You'll find an overview of date formats that Datawrapper will interpret correctly here.
- One or more column contain(s) the values for each line that will be visualized.
For more in-depth information on how to clean your dataset before importing it into Datawrapper, read this blogpost.
Uploading your data
Once you have prepared your data, create a new chart in Datawrapper. You can do so by going to our homepage and clicking on Start creating. In step 1: Upload, you can copy & paste your dataset, upload it as a .csv or Excel file, or connect to a Google Sheet.
We simply copy and paste the data into the text field:
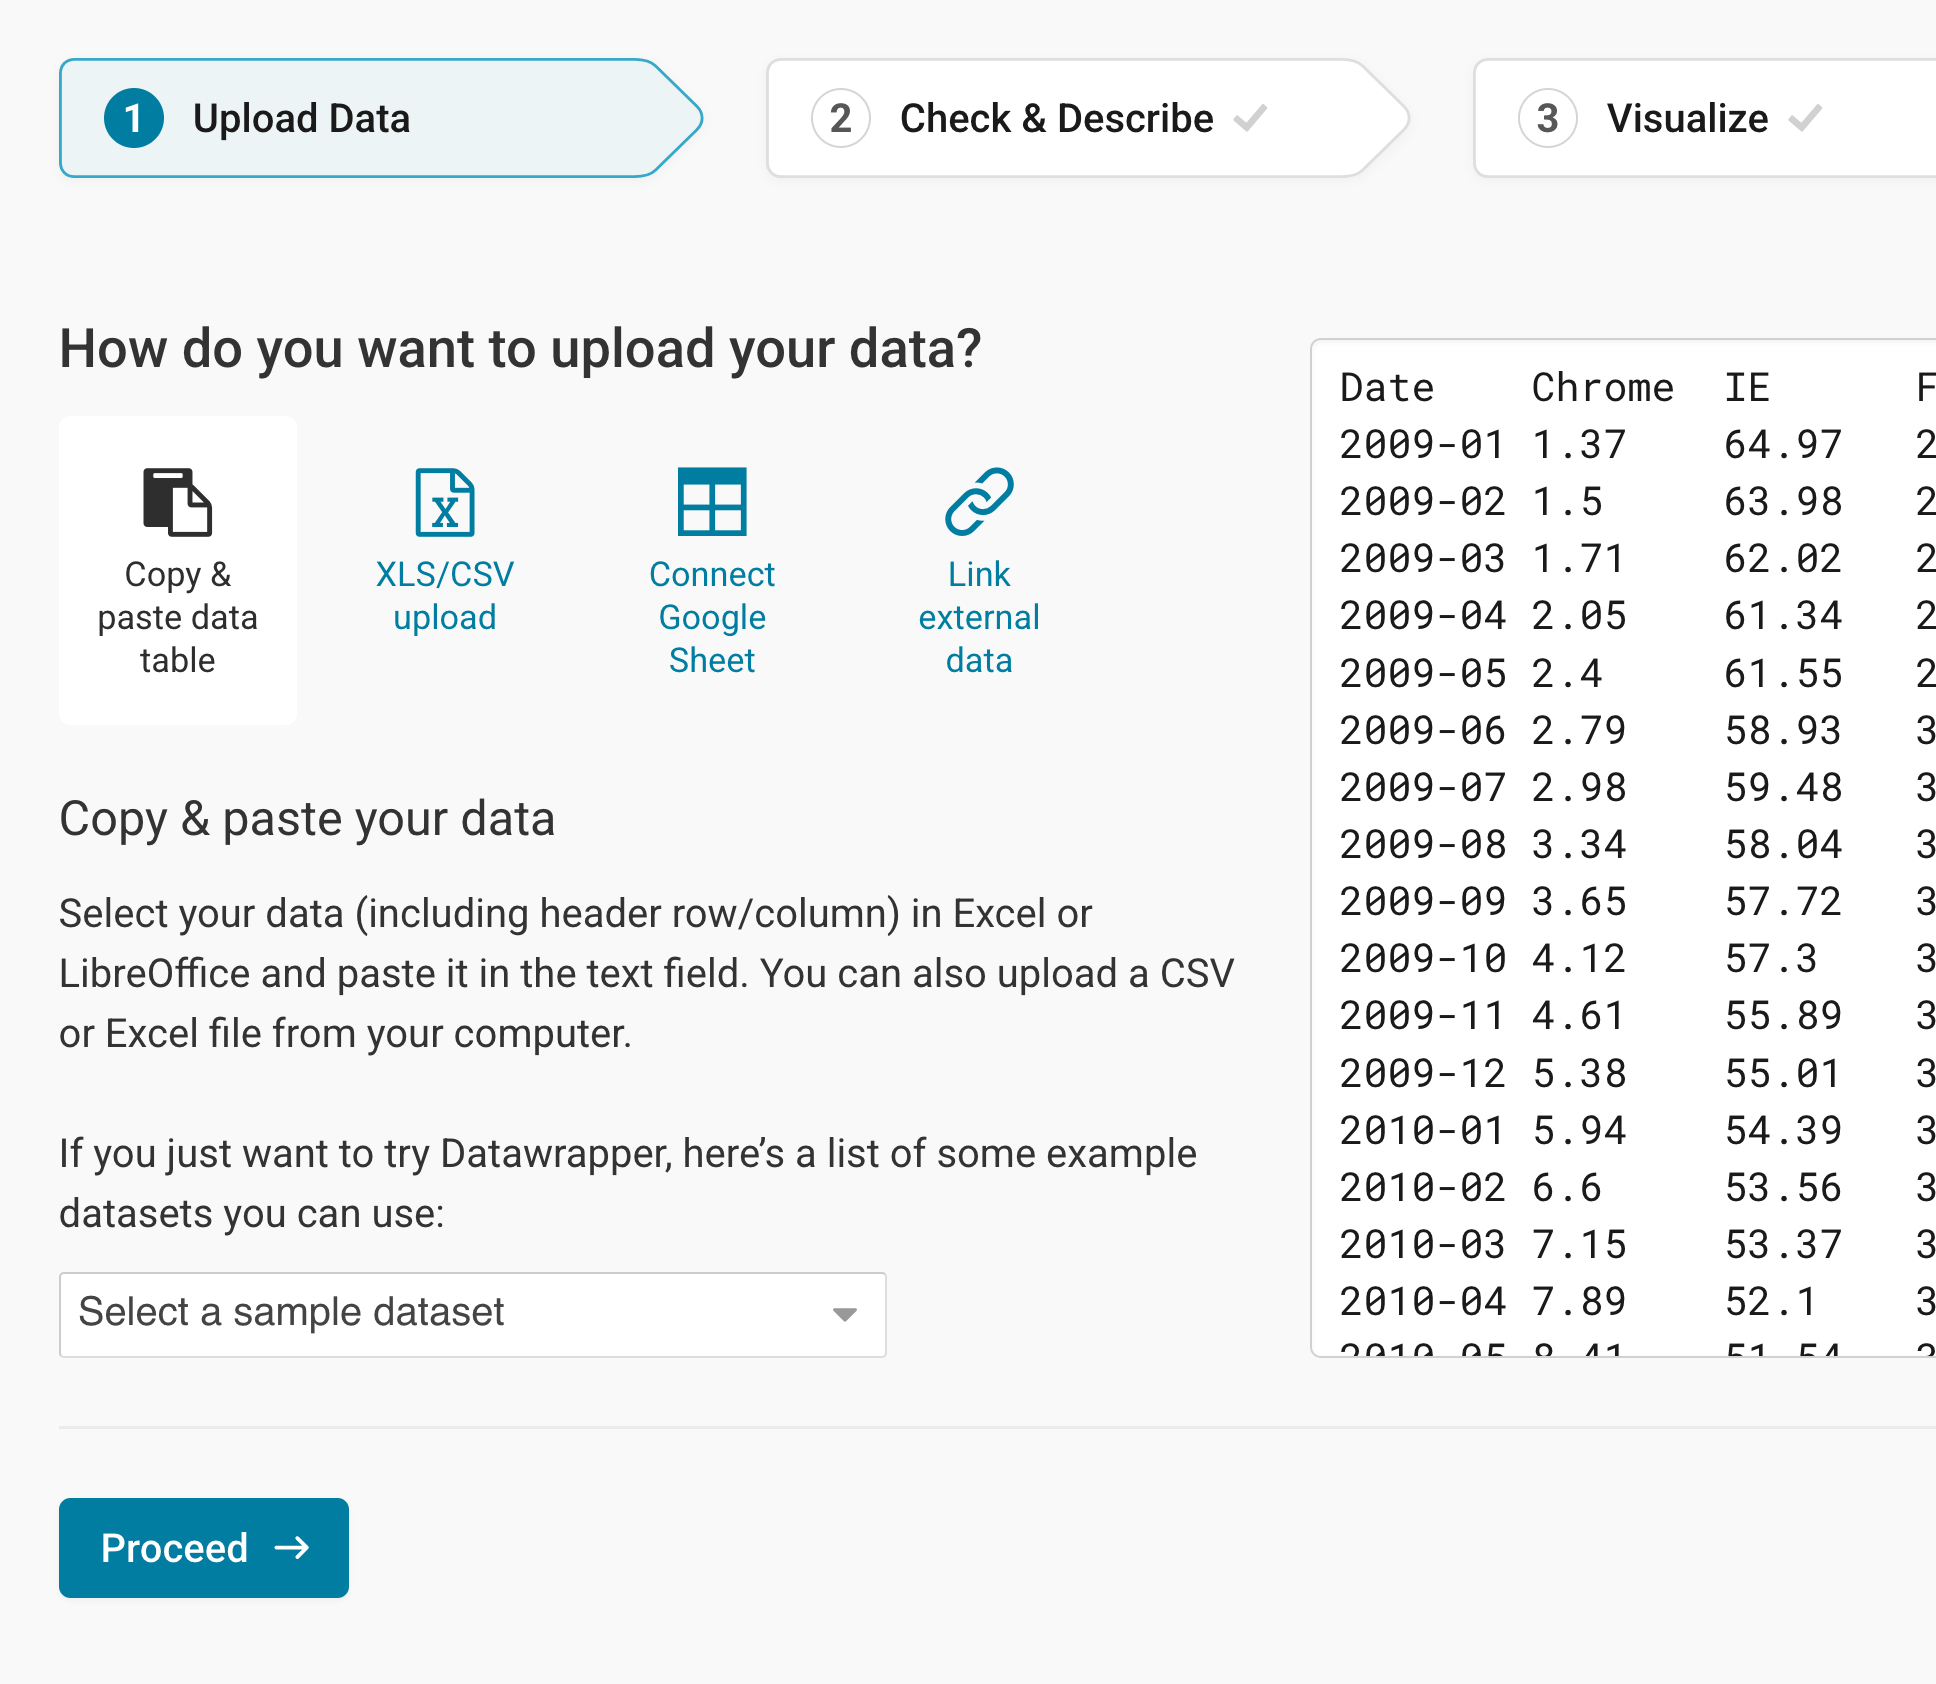
Please note: Datawrapper can handle line charts with up to 1,000 data points. After that threshold performance of many browsers slows down a bit – so try to stay below that number.
Click Proceed at the bottom left to go to the next step.
Checking data and units
In step 2: Check & Describe, you'll see that Datawrapper placed your data in a proper table and interpreted it as either dates (green), numbers (blue), or text (black):
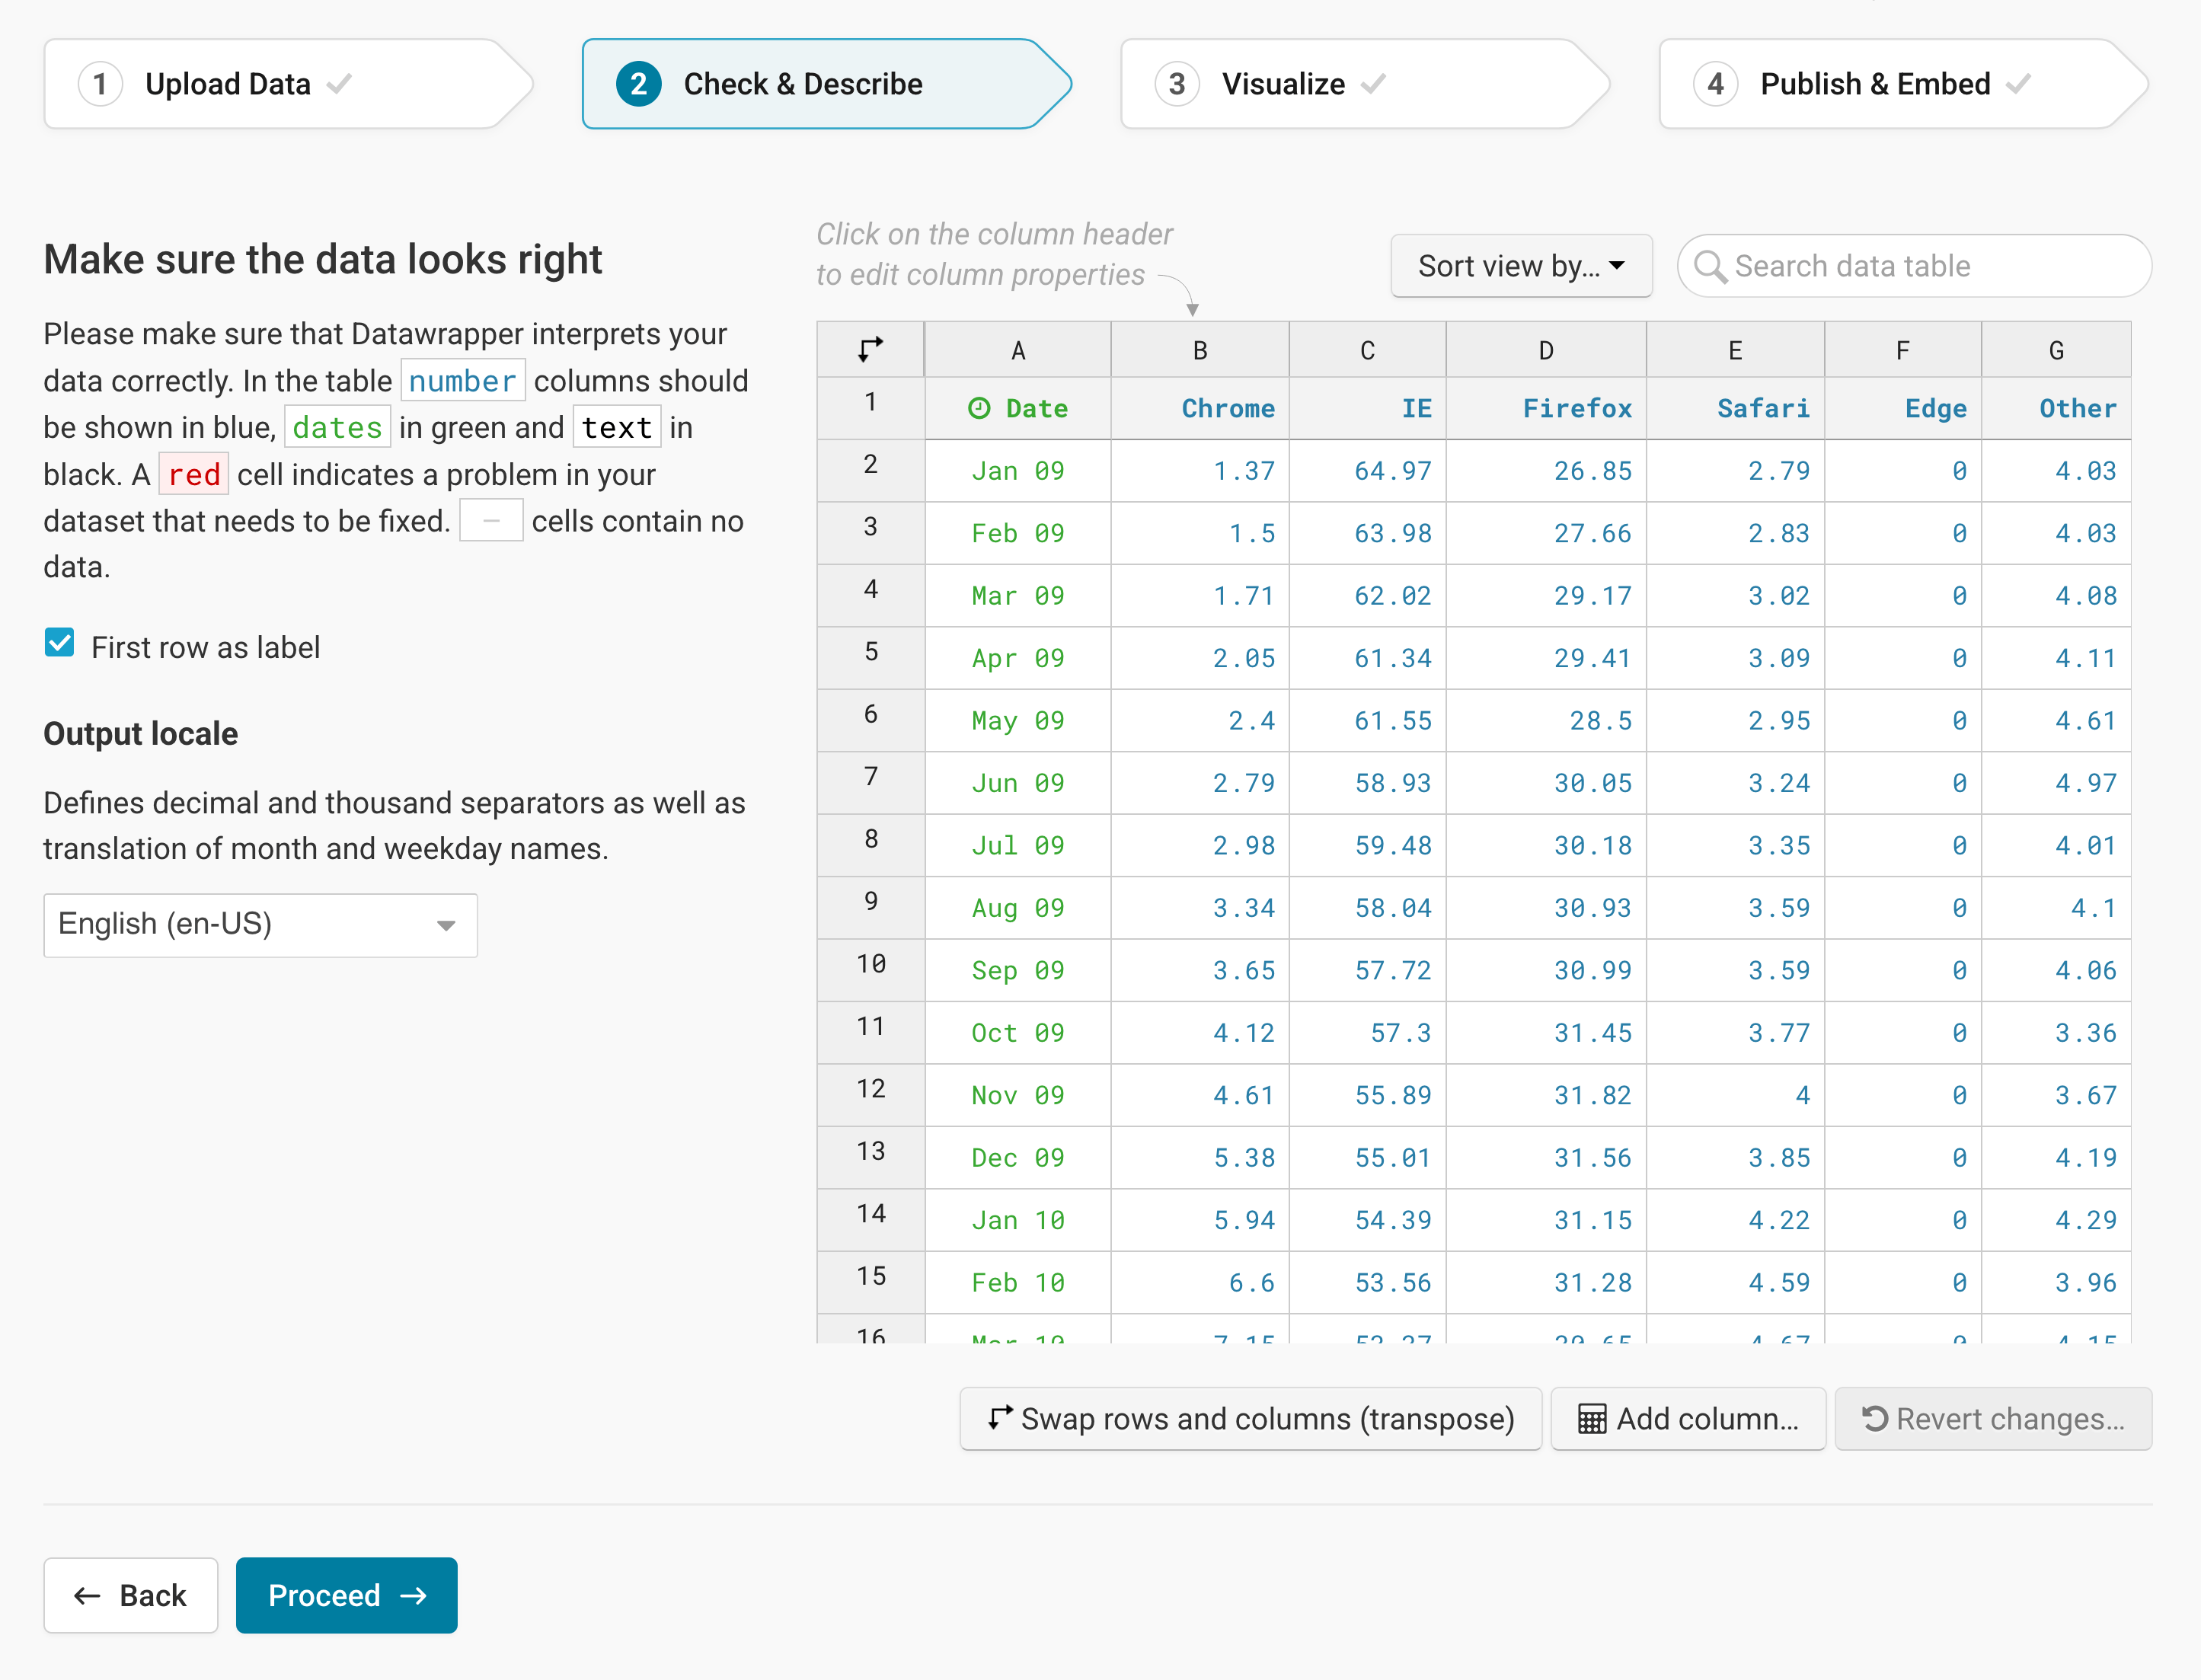
To add a unit (like km/h, kg, inch, $, etc.) to your numbers, click on a column header and then add the unit of your choice to the Prepend/append options on the left. You can learn more about adding units to numbers here.
Click on Proceed, and Datawrapper will take you to the next step: step 3: Visualize.
Choosing a line chart
Step 3: Visualize has four substeps: Chart type, Refine, Annotate, and Layout. In the first step, Chart type, you can play around which visualization type will work best for your data. To create a line chart, choose the chart type Lines (it's also selected by default):
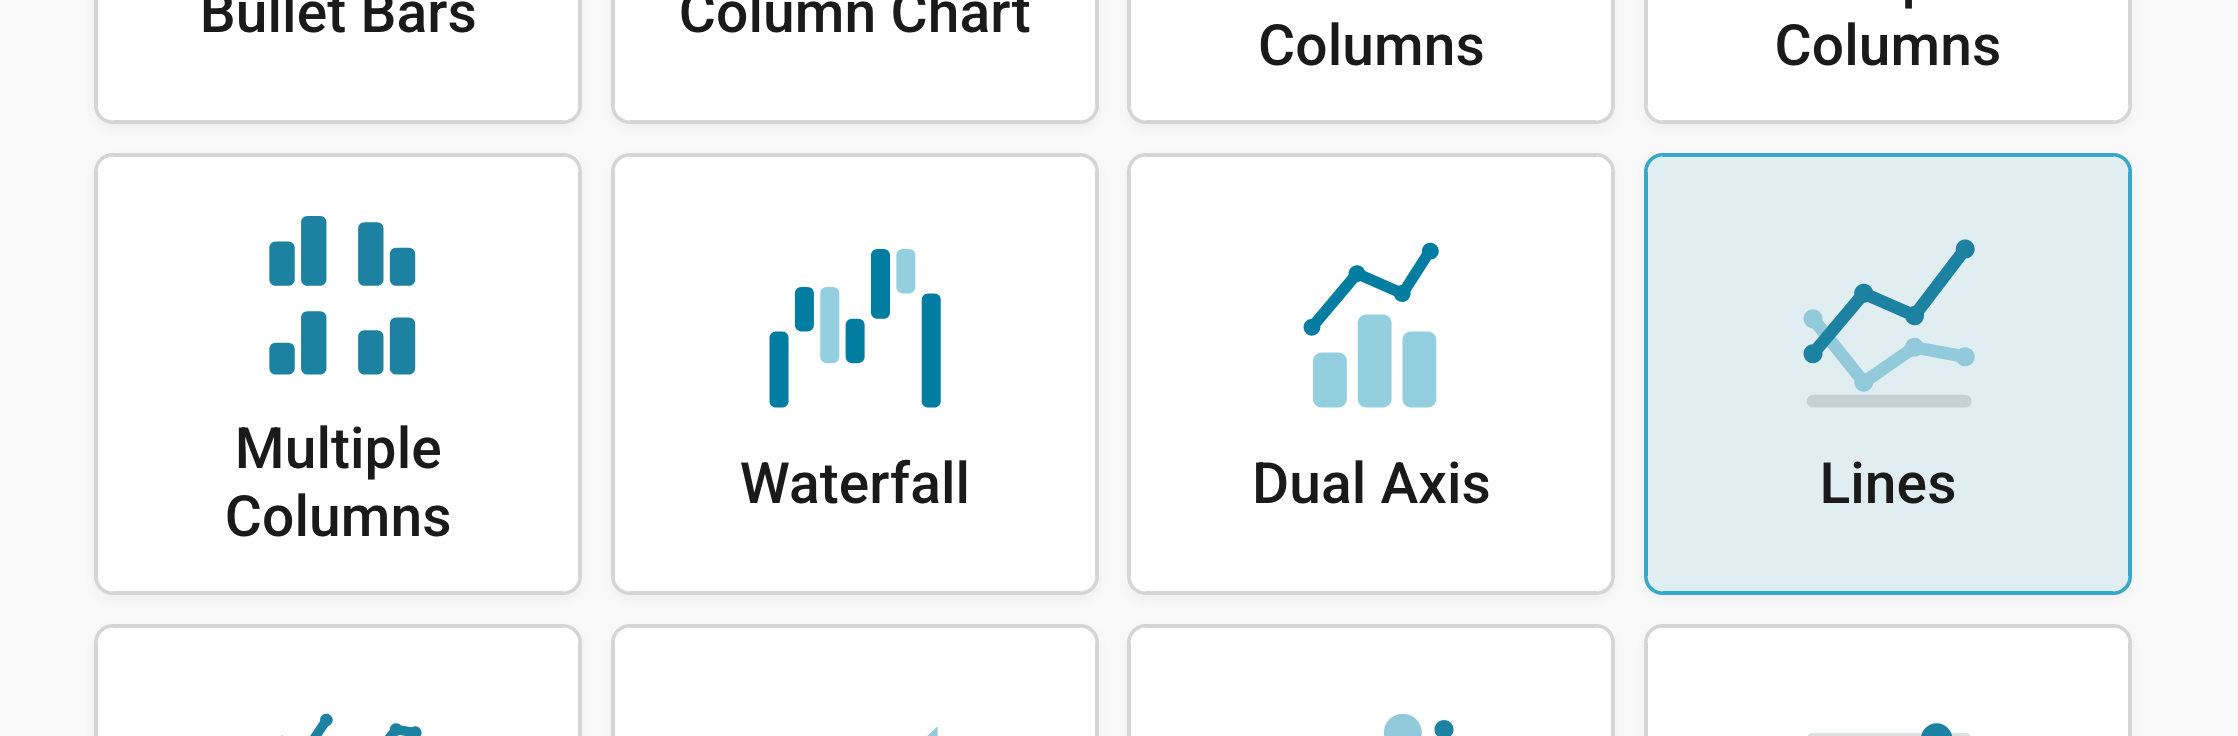
Congratulations! You just created a line chart. Now it's time to go to the Refine tab and style your chart according to your needs.
Refining your chart
Resizing
In any tab of step 3: Visualize, you can click, hold, and drag the arrow in the lower right corner to scale the chart window or manually determine the dimension of the chart by entering values in the boxes below the chart (Size).
We recommend checking what the chart looks like on different screen sizes multiple times while designing it, by clicking on the little icons (mobile, tablet, and computer) below the chart.
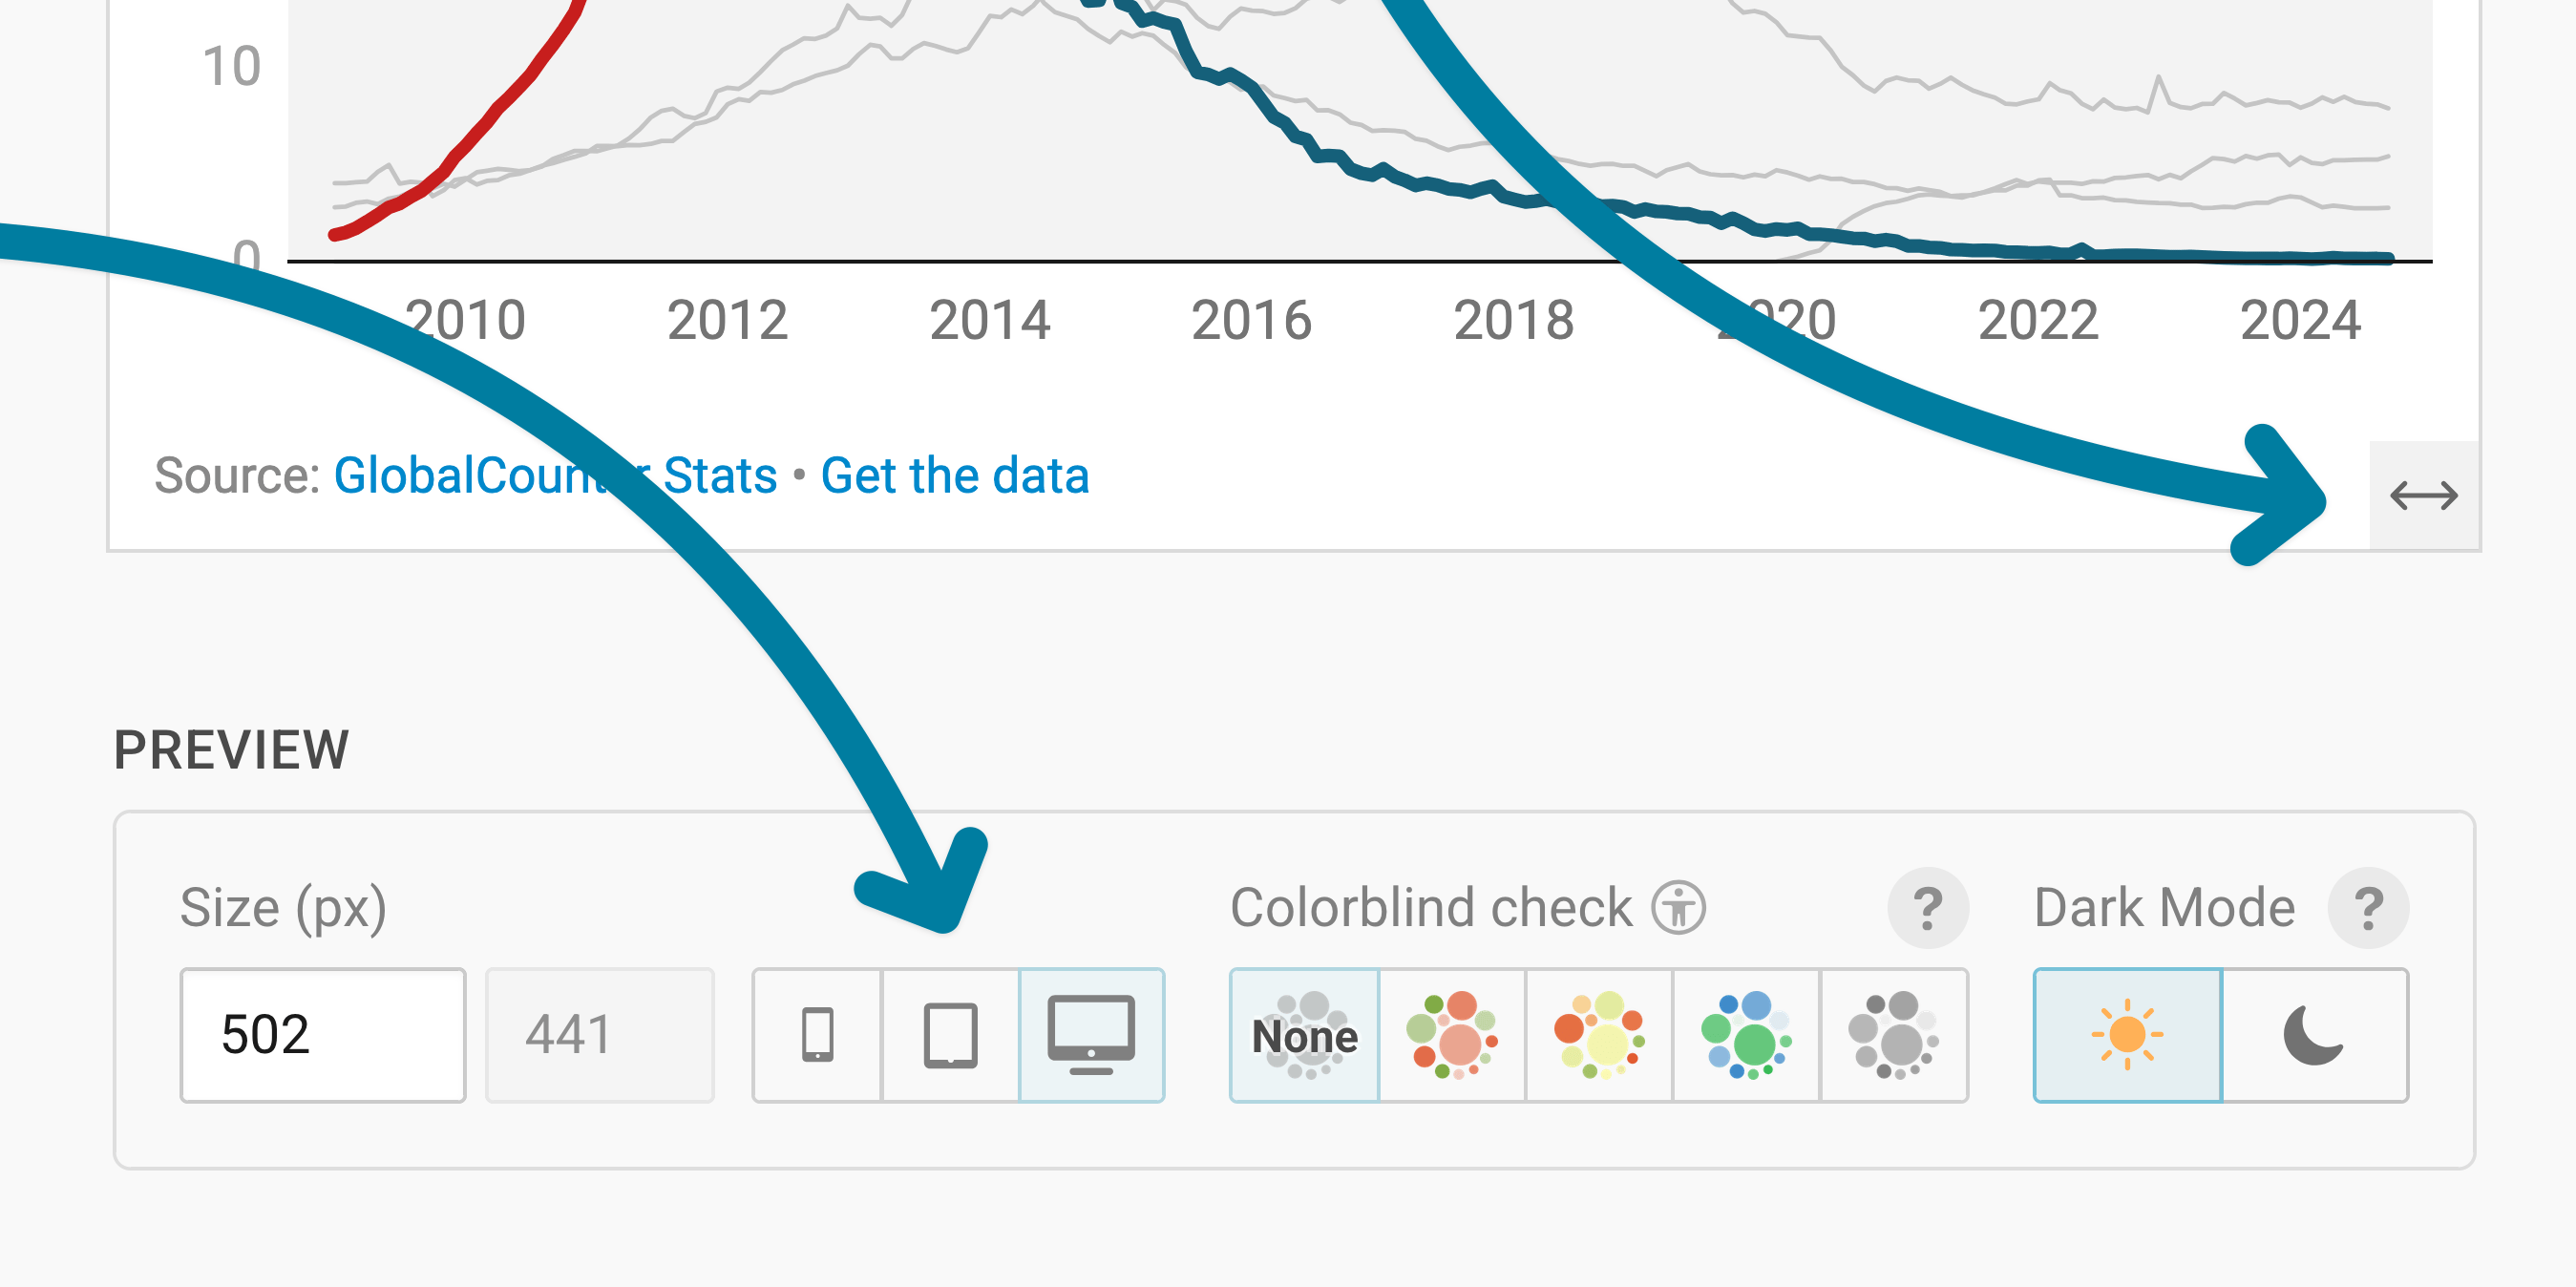
Learn more about changing the width and height of your chart in this article.
Changing the horizontal axis
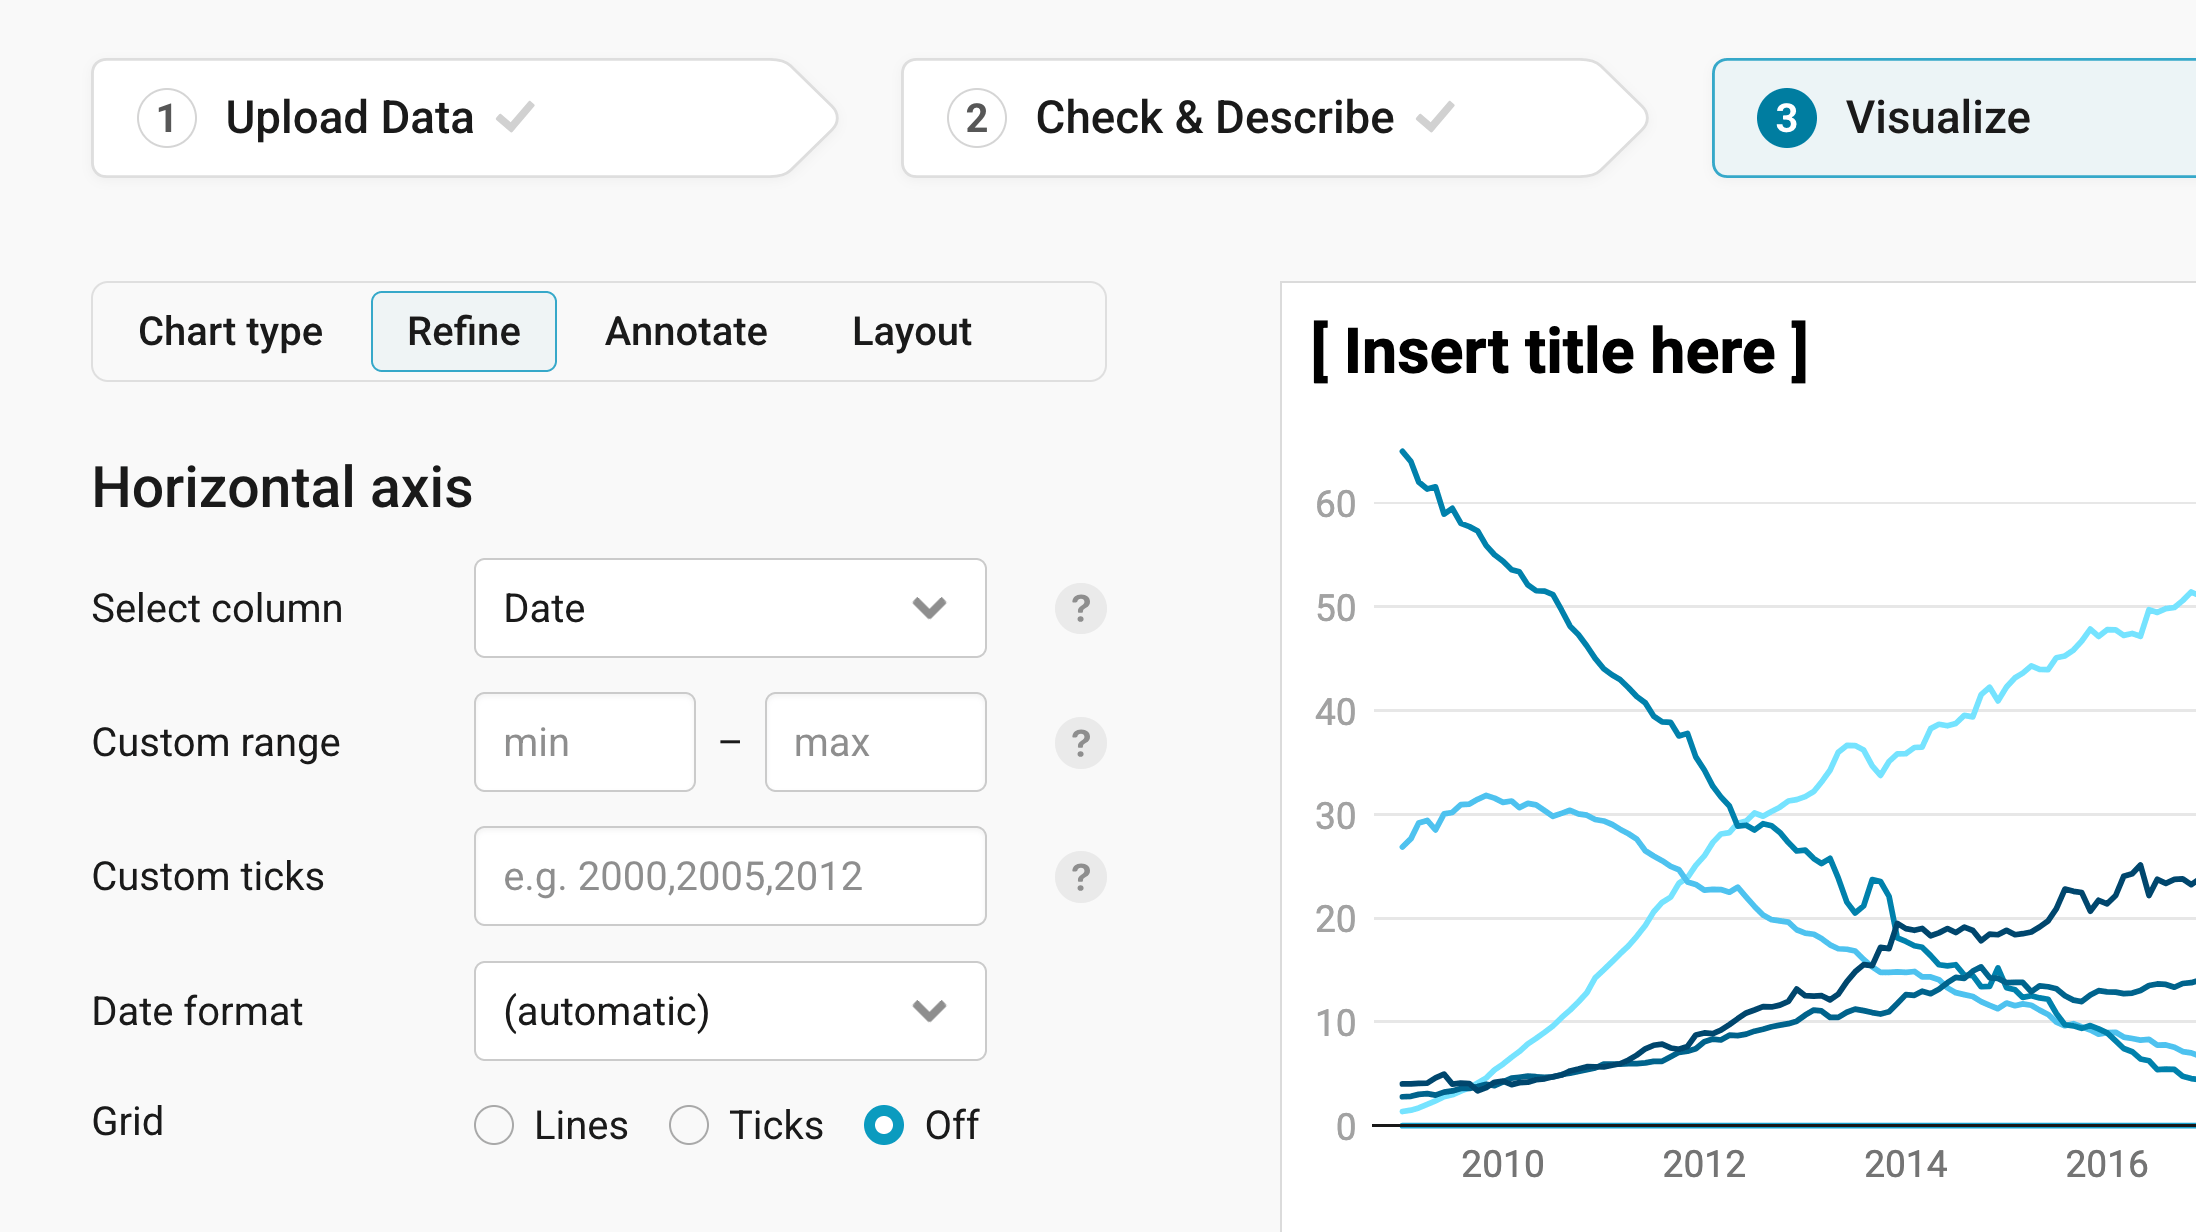
The Horizontal axis panel lets you change the axis below your chart (also called x-axis).
Select column: lets you choose the column with your dates. Datawrapper picks the column with dates, years, or time stamps by default, so you only need to touch this if your data has more than one date column.
Custom range: this lets you extend your time range (which will result in white space) or limit it (for example, instead of showing data starting in 2009, you can start in 2015):
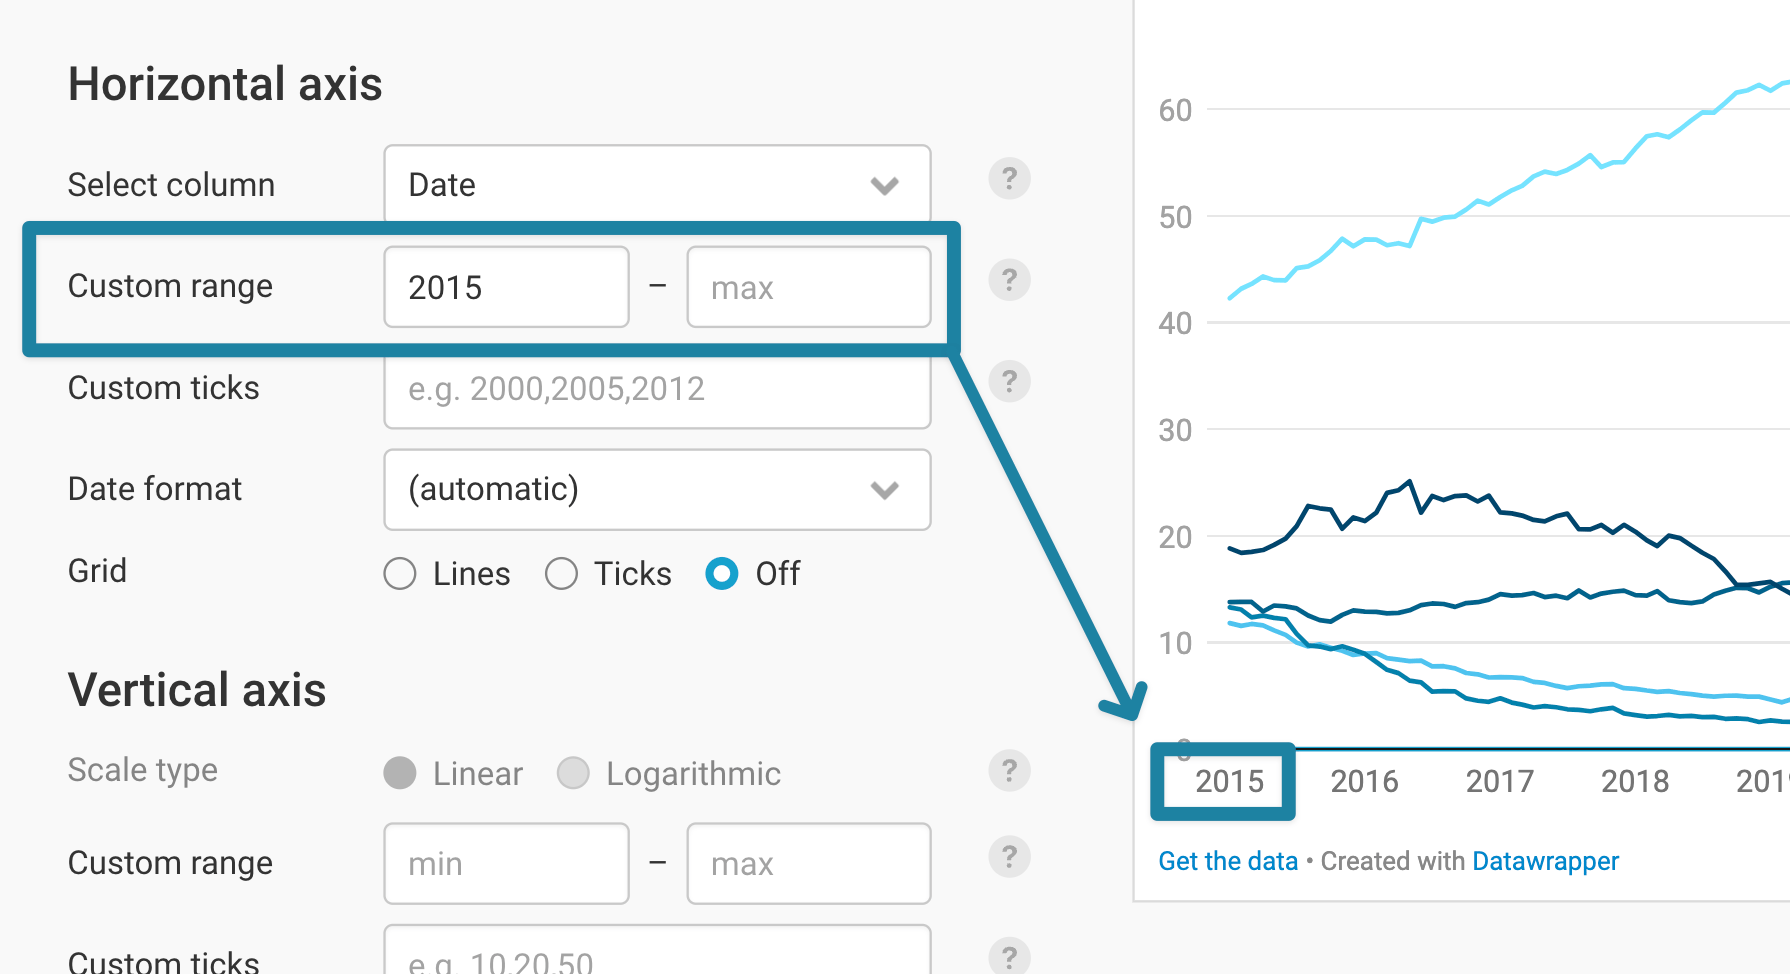
- Custom ticks: sets which labels appear on the axis. If you type in “2015, 2020, 2021”, only these three show up.
- Date format: decides how the dates on the axis look. By default, Datawrapper picks a format that fits your data, like years in our chart. Here’s an overview of all date formats Datawrapper can display.
- Grid: Would you rather show lines running from the top to the bottom of your chart, ticks (= short lines below the axis), or no grid at all? Here you can decide.
Changing the vertical axis
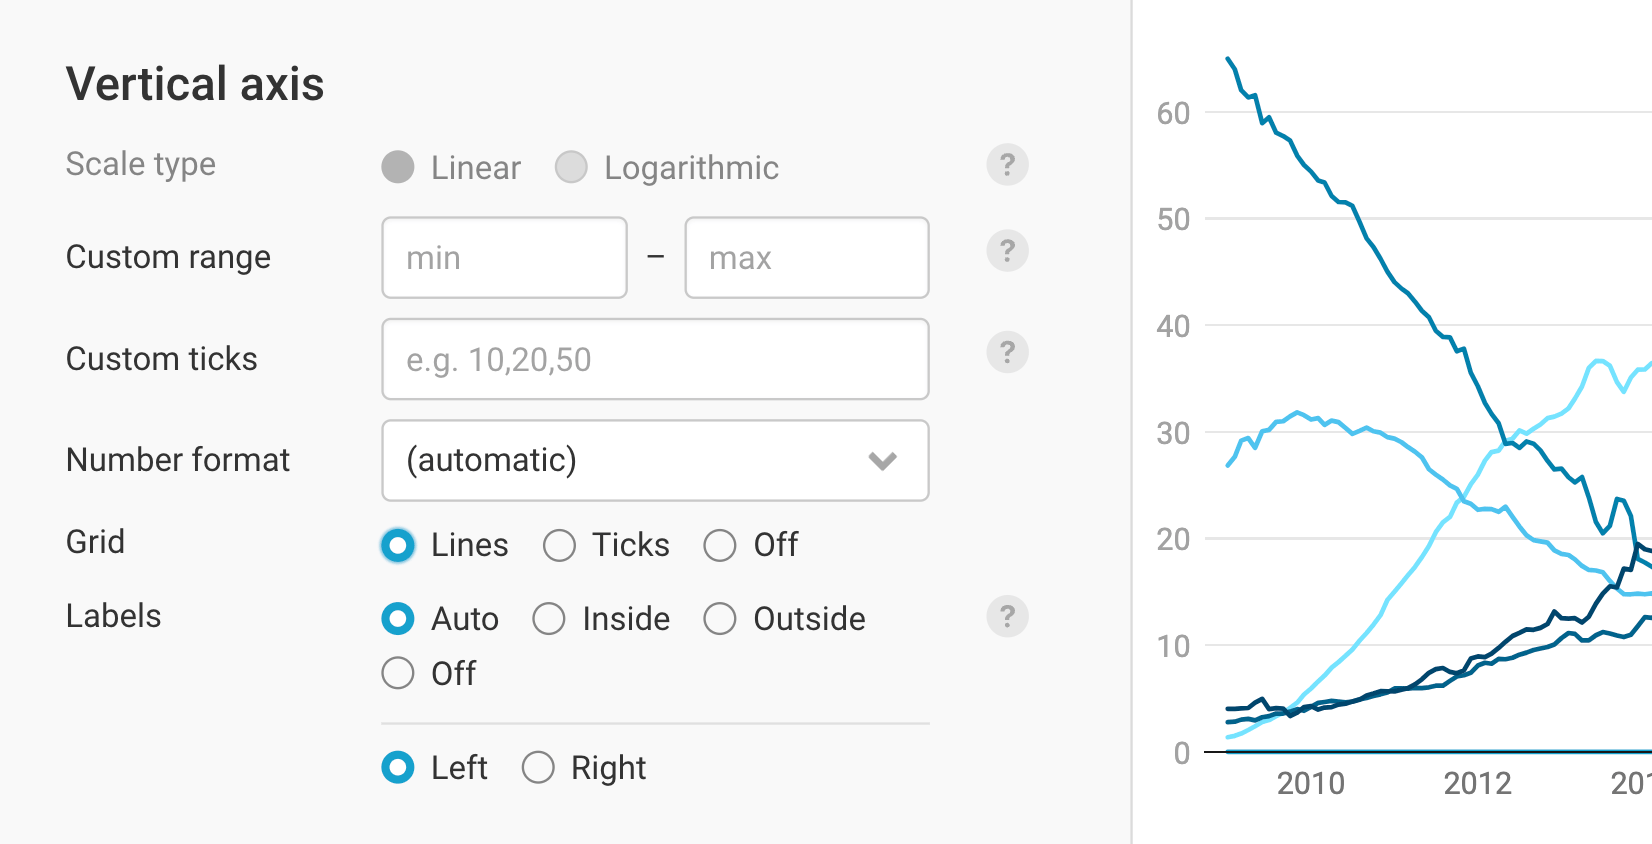
The settings for the vertical axis are very similar to the one in horizontal axis, though there are some additional features. Here's a brief description of each of these features:
- Scale type: By default, your line chart will always appear on a linear scale, where the difference between 1 and 2 is as big as the difference between 100 and 101 and 1000 and 1001. However, if you have important differences in your small numbers and large differences in your big numbers, a logarithmic scale might be the better alternative. If you choose it, the difference between 1 and 10 will become as big as between 0.1 and 1 and 1000 and 10,000. Learn more about logarithmic scales on our blog.
- Custom range and Custom ticks do the same as they do on the horizontal axis (see above). As with every setting, Datawrapper tries to set good default values. In our case, we decide to change the max range to 70.
- Number format: decides how the numbers on the axis look, for example “1.3m” instead of “1,303,428”. Our values are shares, so we chose 0%, which adds a percent sign. You can learn about all available number formats here.
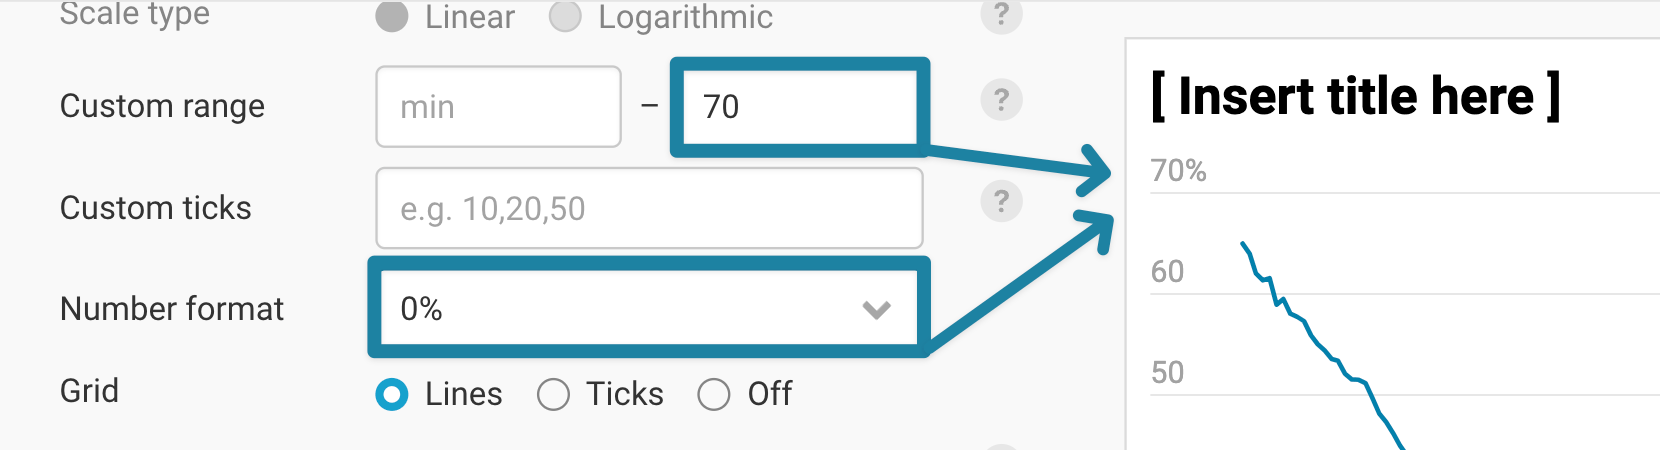
- Grid: shows lines that run from the left to the right of your chart, ticks, or no grid at all.
- Labels: shows the axis labels outside of the grid, inside of it (on top of the grid lines), or decides automatically, depending on the space. You can also show them on the right of your chart, which helps if your most interesting values are on the right.
Styling your lines
These two panels let you customize the style of your lines: the color, width, their labels, and more. They're some of the most important settings when it comes to crafting out the story you want to tell with your chart.
If you uploaded only one numeric column – and hence have a line chart with only one line –, you'll see the following:
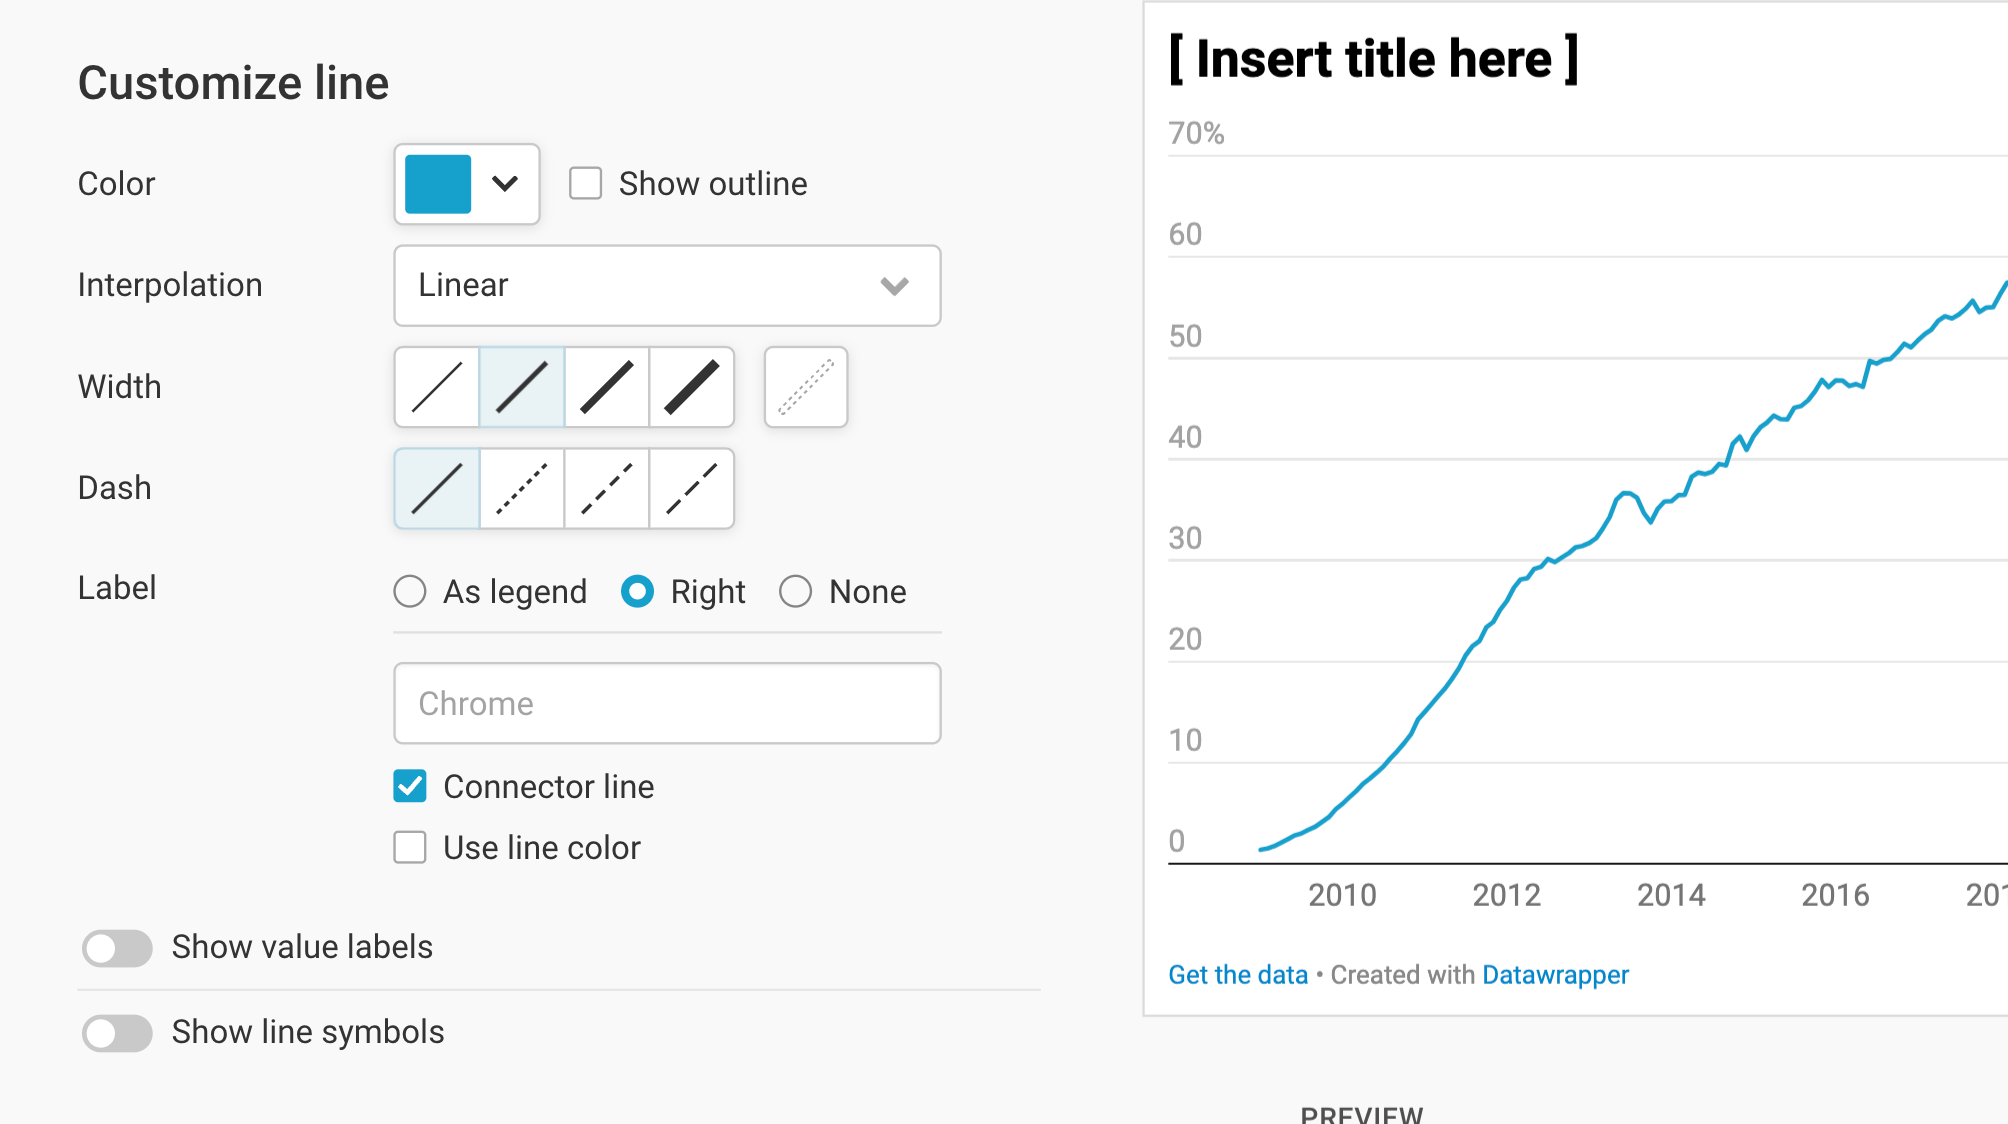
If you upload multiple numeric values (and therefore lines), you'll get a few less options in a panel called Lines, but you'll be able to customize each line individually. First, let's cover these basic settings:
Color lets you choose the color of the line (Base color, if you uploaded multiple lines, lets you choose the color in which shades all lines will appear in). To change the color, click on it, then select the color you want, enter a HEX code, or change some color parameters. Learn more about our color picker here.
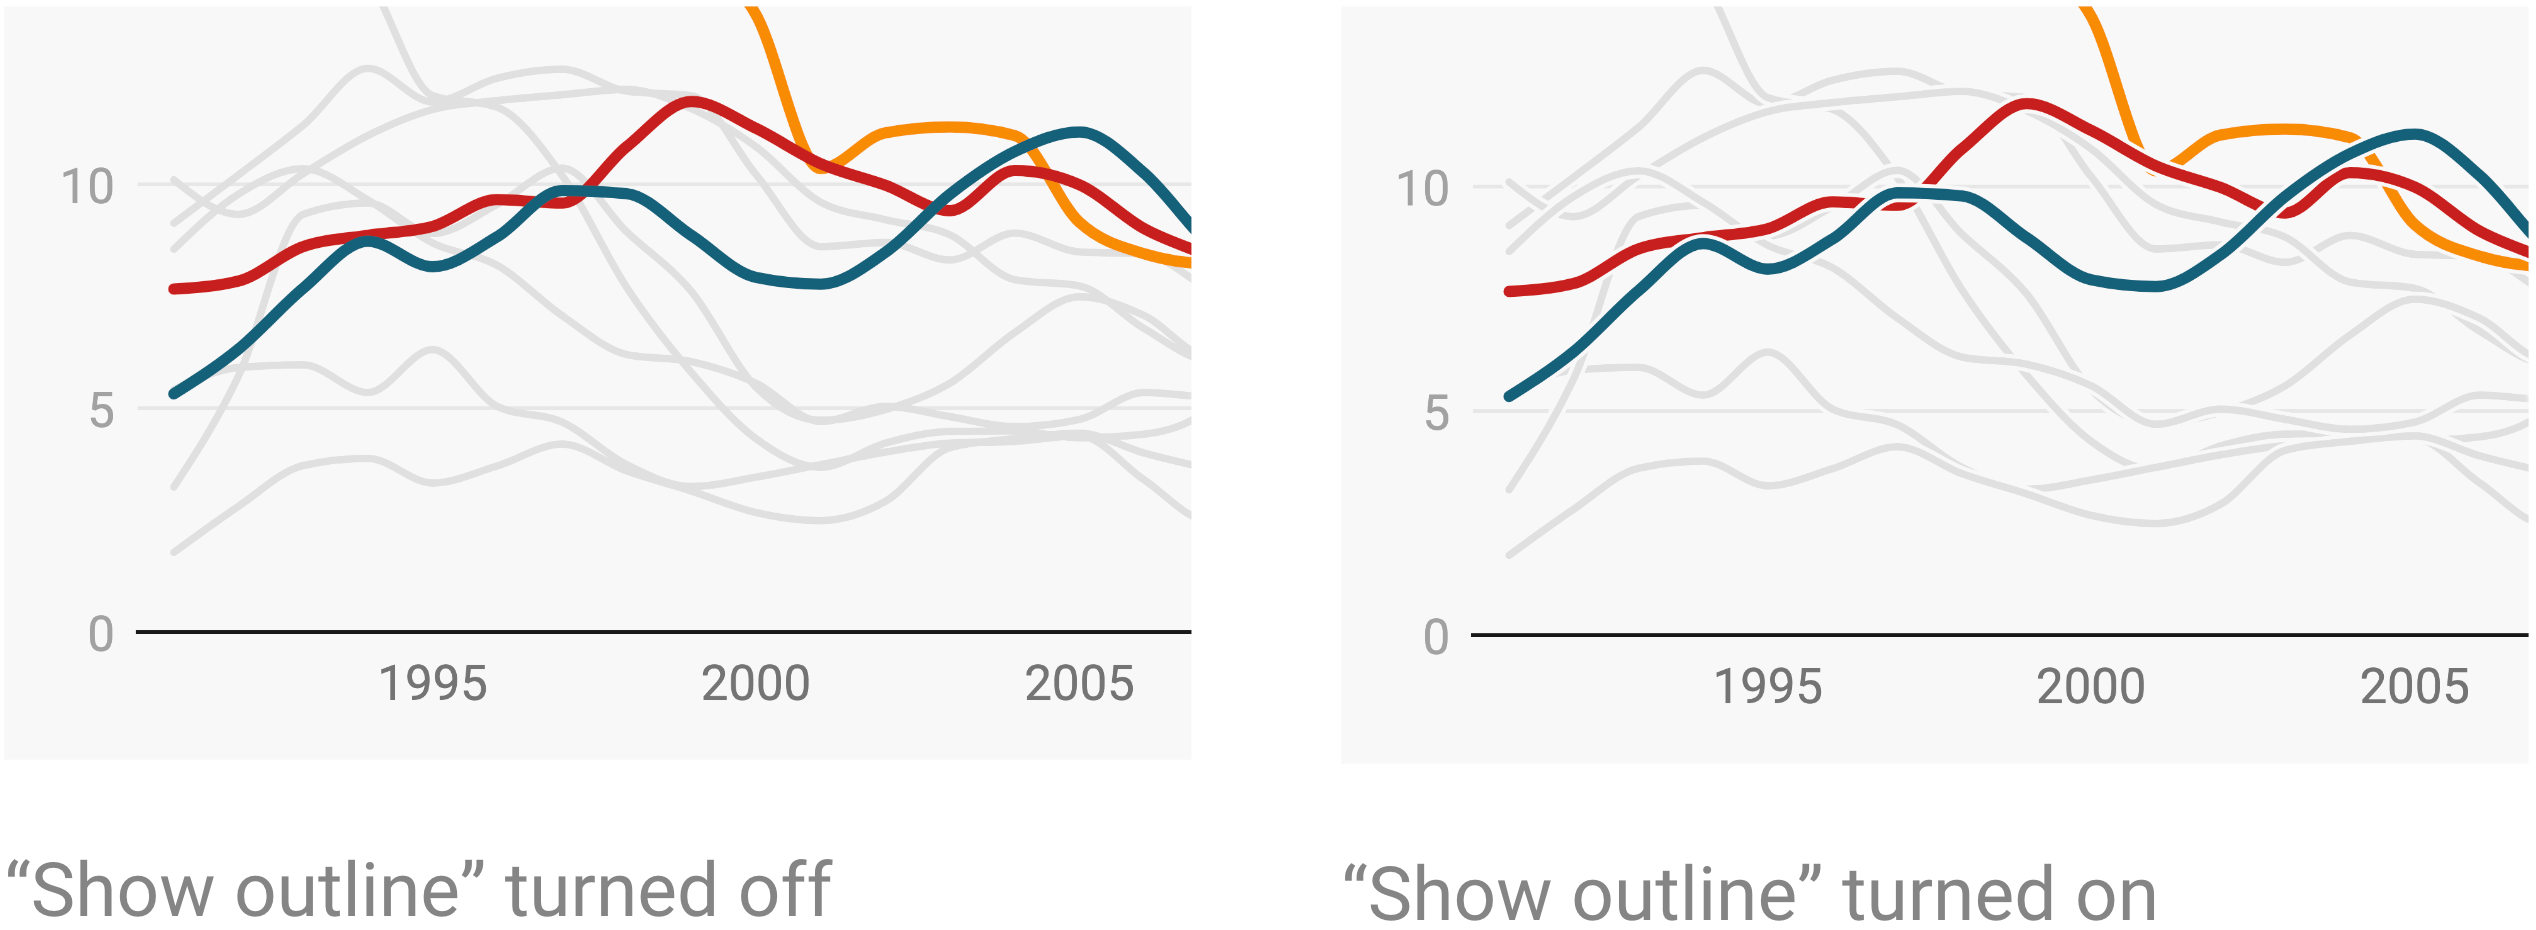
Show outline adds a very fine stroke around your line in the color of the chart background. This makes it easy to distinguish between lines if they overlap a lot:
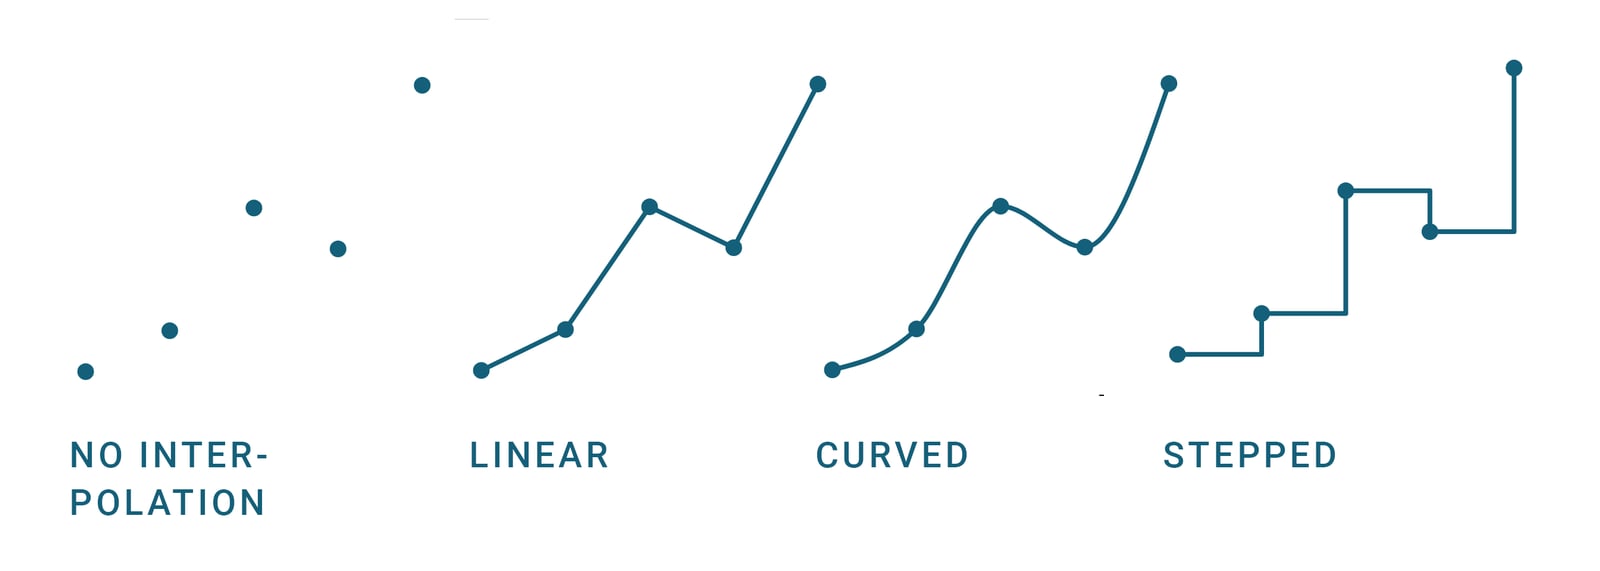
Interpolation allows you to control how the lines are connected between the data points. To read more about when to choose which interpolation, visit our blog post.
If your uploaded data misses some data points, you'll see the option to Connect all points below the Interpolation options. Learn more about this feature here.
Width and Dash allow you to define exactly that: How thick your line should be, and if it should be dashed. If you click on the last Width option, you can make your line disappear.
Labeling your lines
To decide where our labels should sit, Datawrapper gives you a few options: You can show them as a legend (meaning, as a color key) on the top of the chart:

Or you can let Datawrapper label the lines directly (Right). If you do so, you can also decide to show connector lines or use the line color for the labels:
With connector lines  |
Without connector lines, but uses line color  |
If you don't need labels because you mention what your chart shows in the title or in an annotation, you can also decide to not show them (None).
If you only uploaded one label, you'll also find the option to rename it – for example, because the data you uploaded includes a rather complicated name for your line, and you want to simplify it.
Showing value labels
Apropos labels: You can also show labels close to your line that tell readers which numeric values your line(s) show:
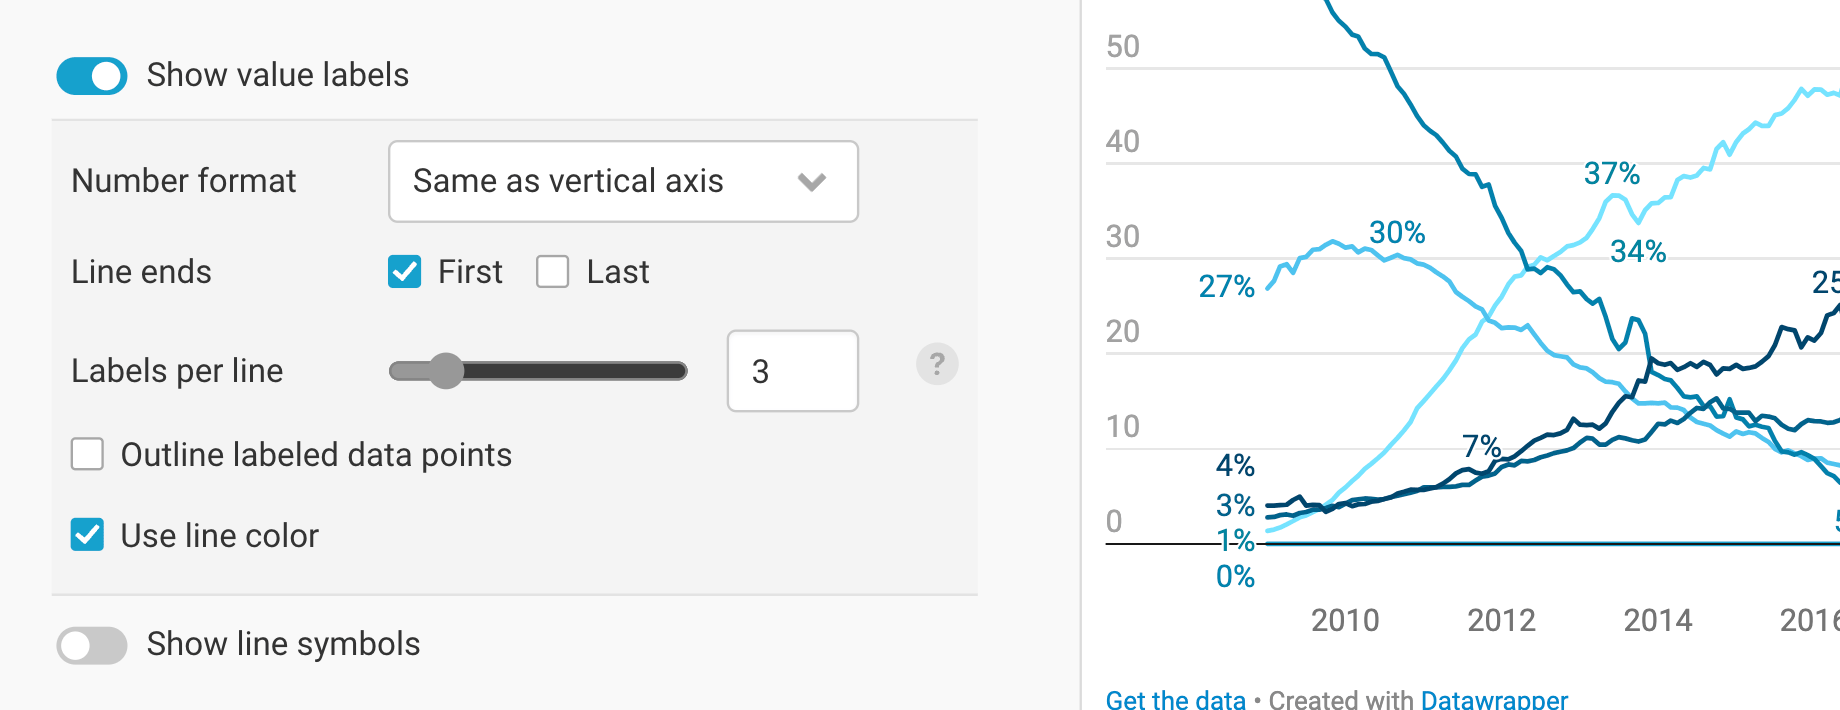
To do so, turn on Show value labels. Now you can customize the number format, decide if you want to label all first or last values of a line, decide how many value labels should be visible per line, add little circles to the lines that make clearer which data points are labeled (Outline labeled data points), or use the line color for the value labels. You can learn more about value labels in line charts on our blog.
Adding line symbols
The next option you have is to add little circles/triangles/squares etc. to your lines to highlight each data point, or just the beginning and/or end of each line:
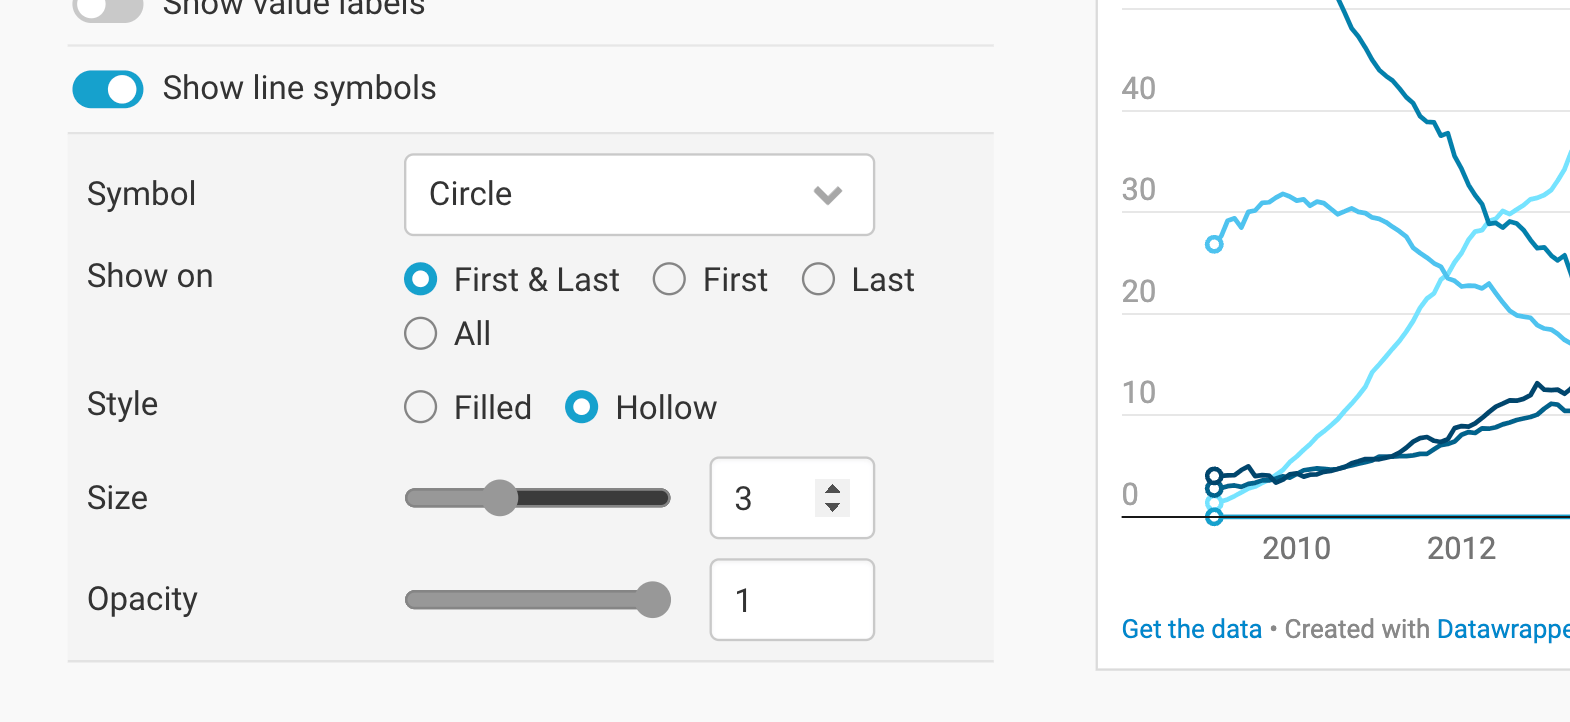
You can decide on
- the kind of symbol (circle, square, diamond, triangle, cross, hexagon, star, or wye)
- if the symbols should show up on the first and/or last, or on all data points. (Showing them on all data points only makes sense if you have few data points per line.)
- the style: filled ● or hollow ○
- the size (how big should the circles be?)
- and their opacity (how transparent should they be?)
Customizing single lines
If you upload multiple lines, you'll find options to Customize lines directly below the Lines options:
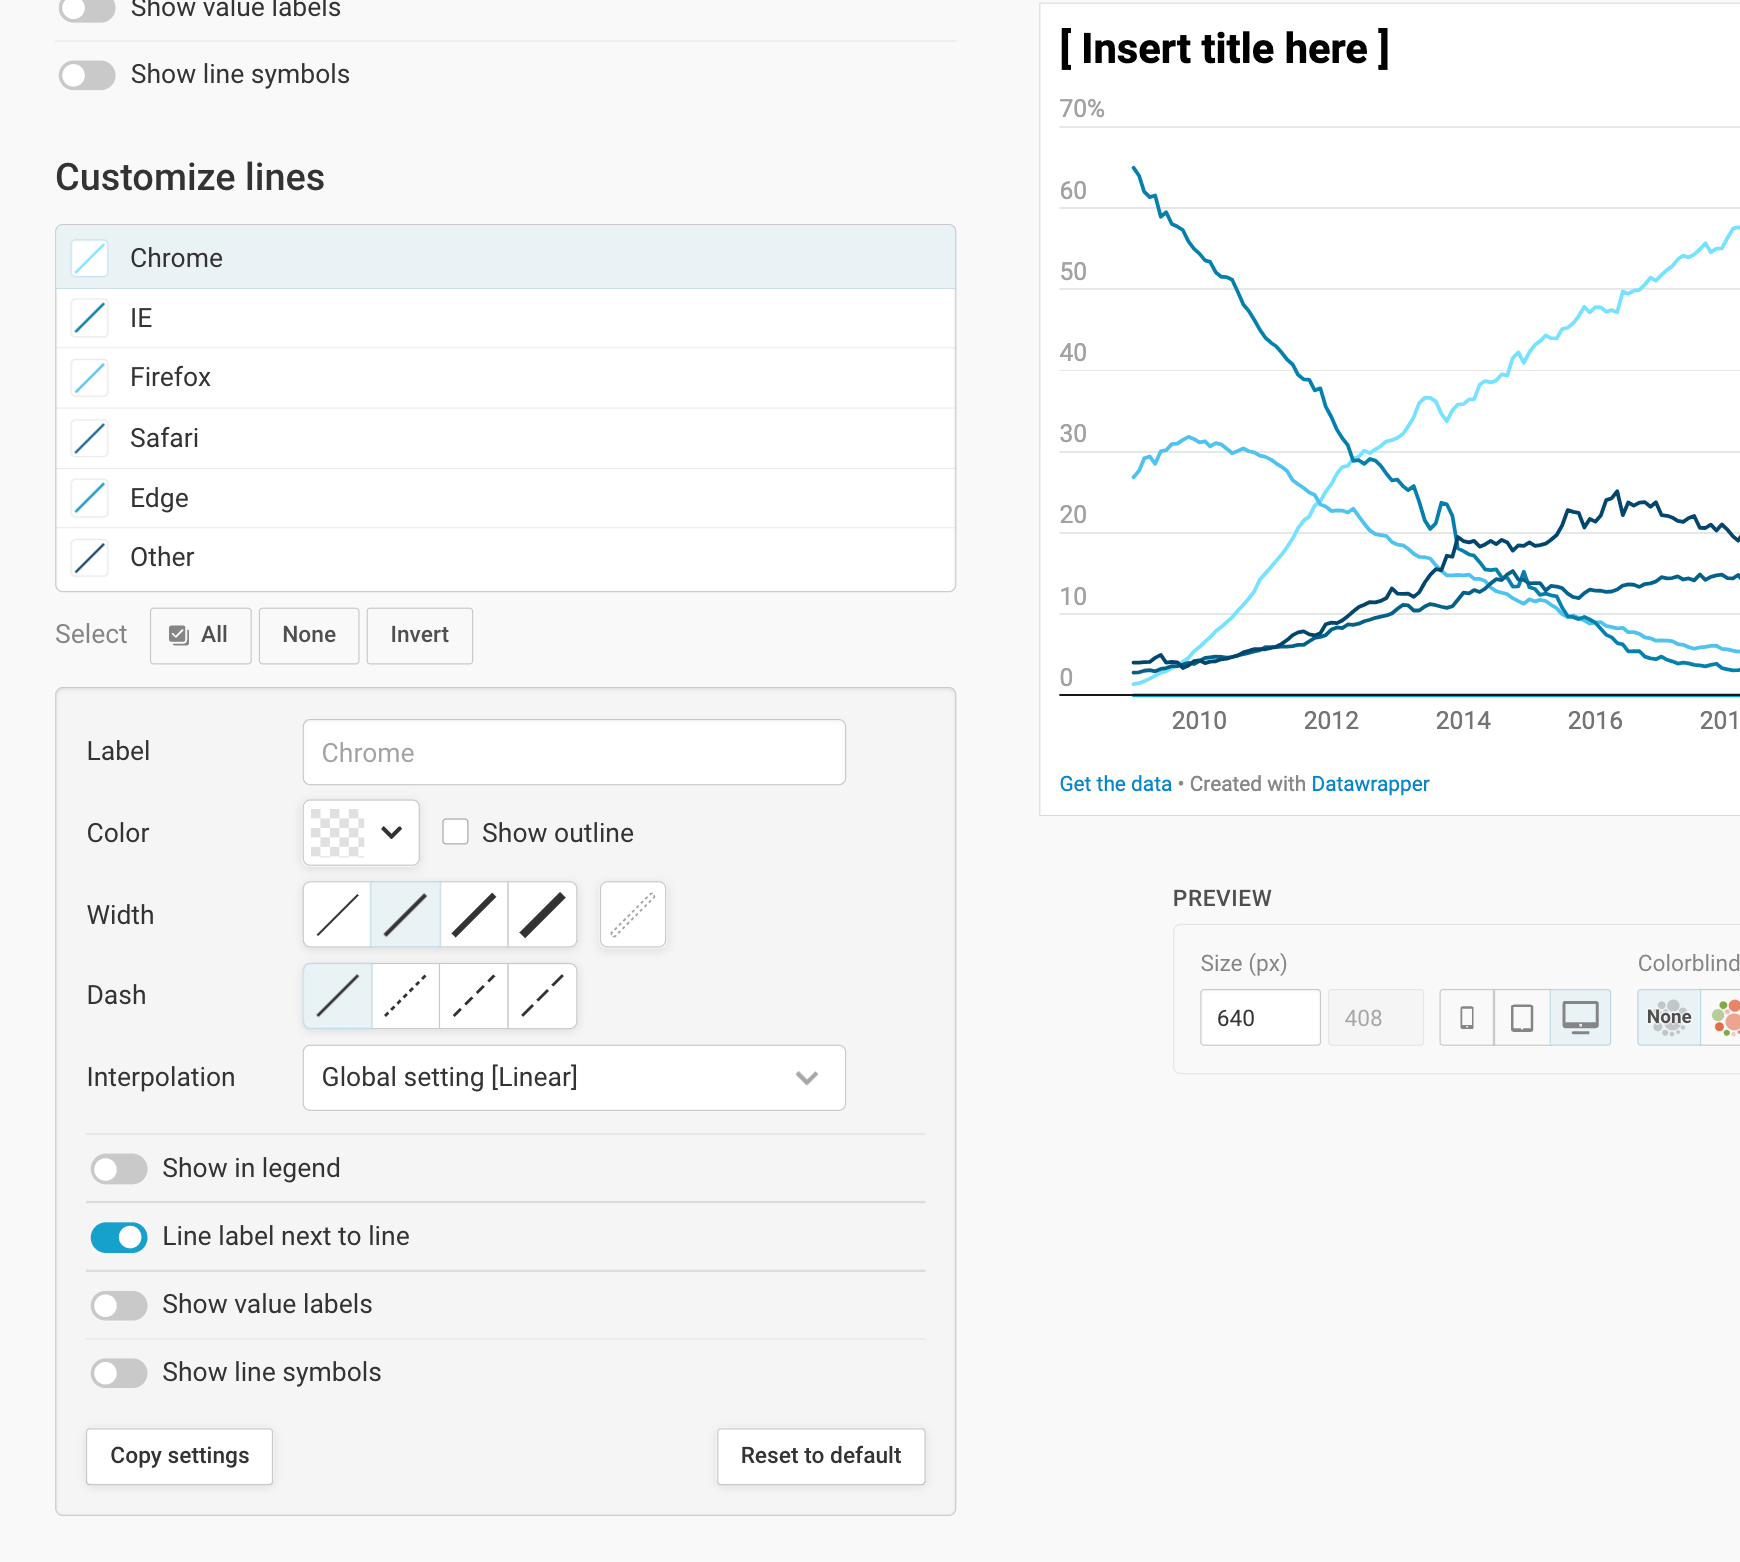
The options will look familiar. Here, too, you can rename the line label, change the color, width, dash, and interpolation of the line, connect all data points if you have patchy data, decide if you want to show your line label in the legend or next to it, show value labels and line labels – but you can do so for each line individually.
To customize one line, simply click on it in the list. You can also use the buttons All, None, and Invert (your selection) below the list to make changes to all lines, or to all other lines.
You can also use Shift and Cmd/Ctrl to select multiple lines and make changes to them:
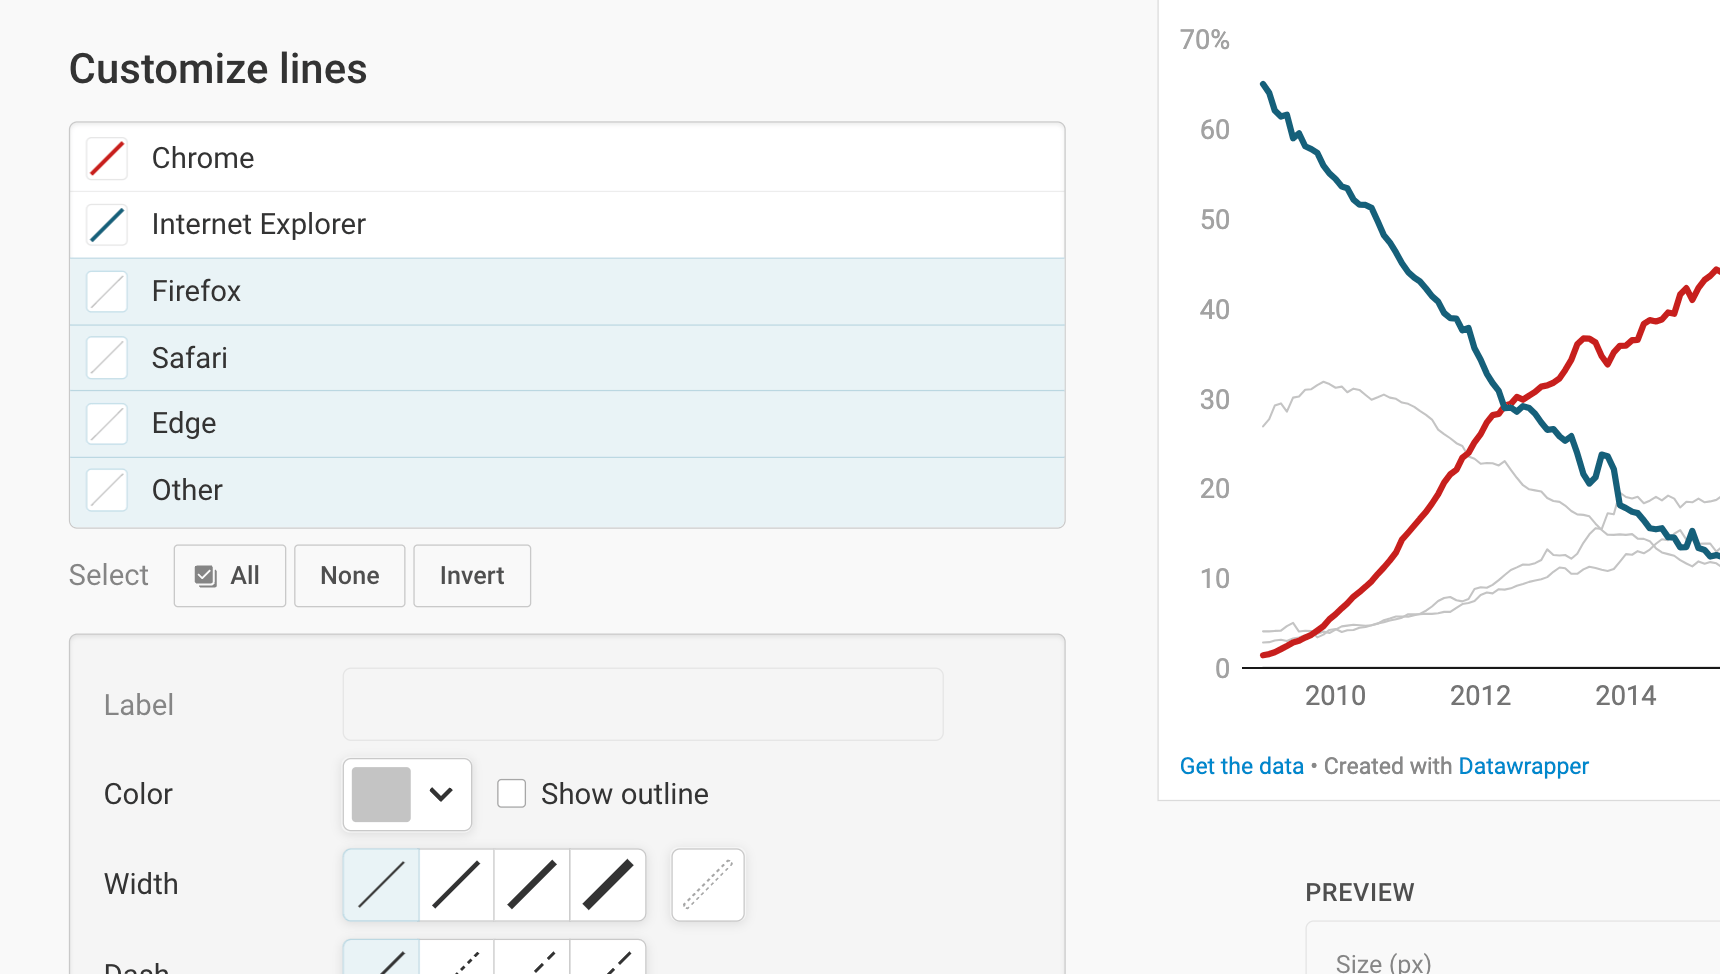
The combination of color and width can be a powerful storytelling tool: In our line chart at the top, you'll see that the gray lines reside in the background because of their, well, grayness – but also because their thinner than the blue and red line:
Adding area fills
Below the Lines panel, you'll find the option to fill areas. If you click on Add area fill, you get the following options:
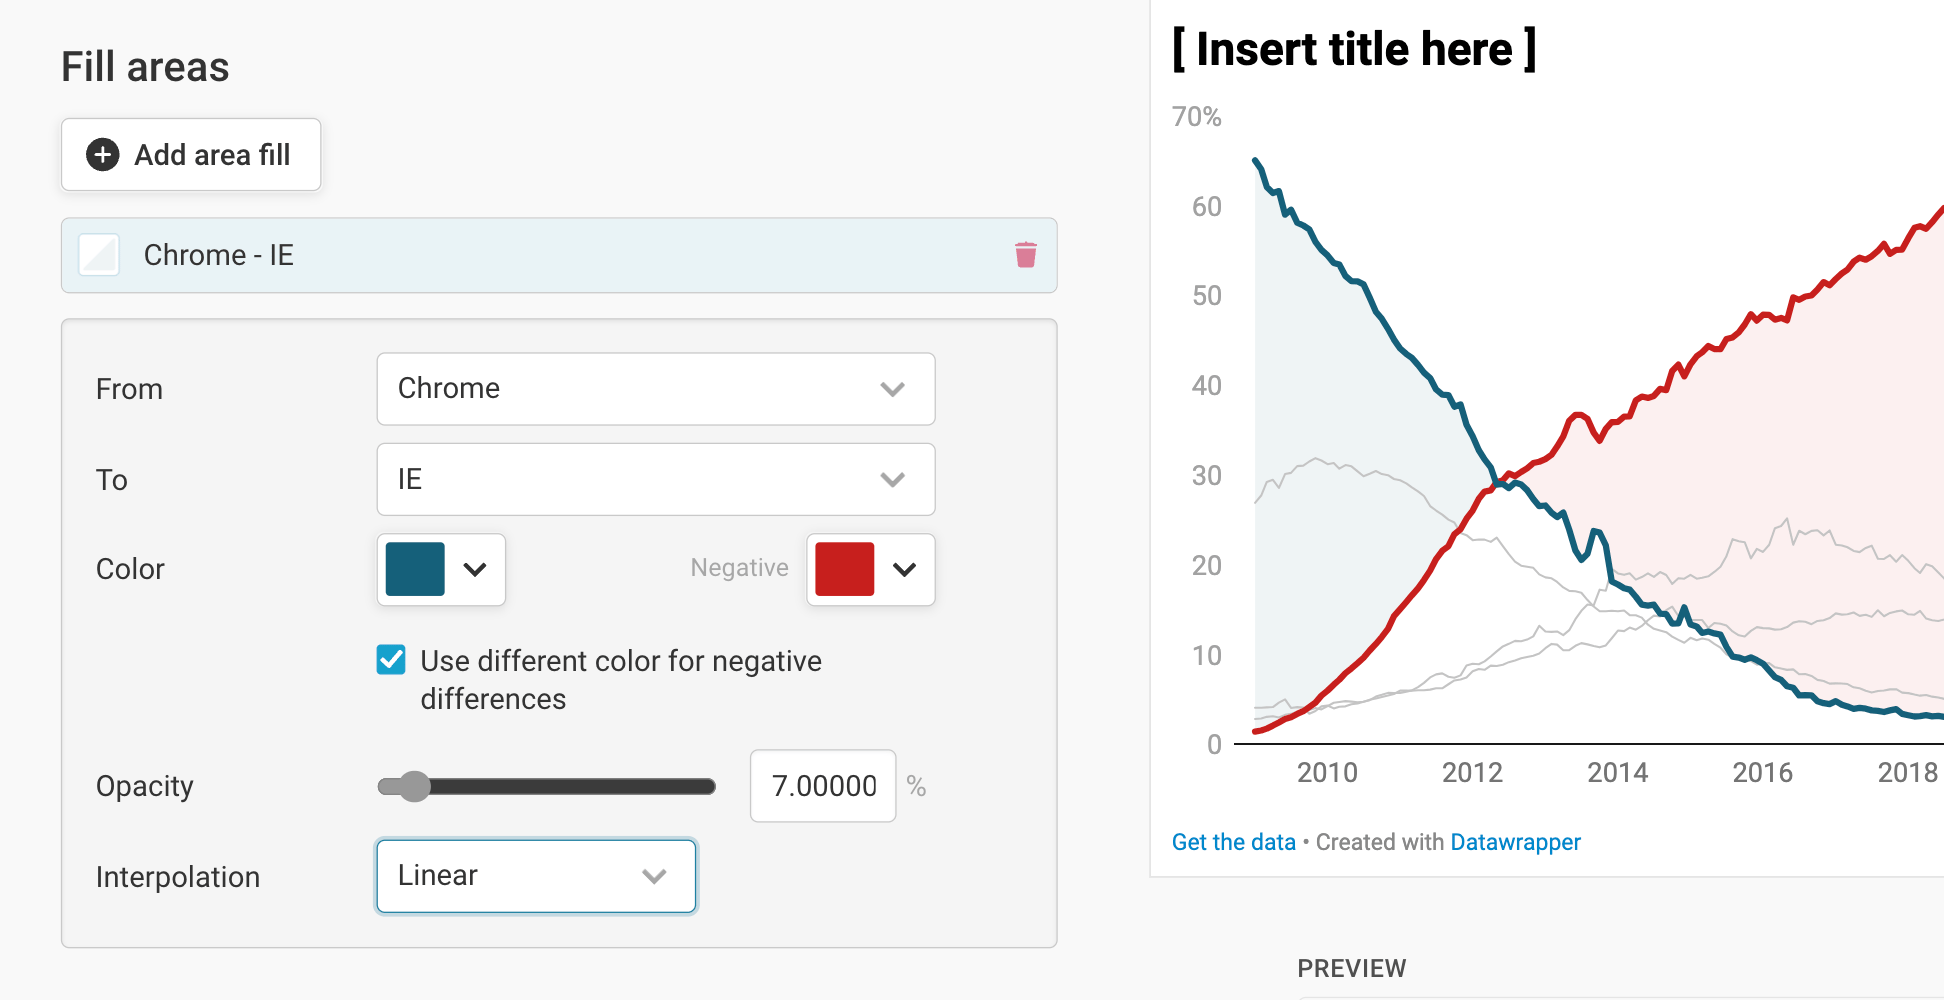
- From...To lets you choose two lines between which you want to add the area fill. Note that this could also be the zero baseline: If your chart only shows one line, you can still add an area fill between that line and zero.
- Color and Opacity let you define the style of your area fill. If you check Use different color for negative differences, you can give negative differences another fill. In our case, that means that we can change the color of the area fill once Chrome overtook the Internet Explorer.
- Interpolation allows you to decide the type of connection between the data points (see above). This should be the same interpolation as the one you chose for your lines.
Changing the tooltips
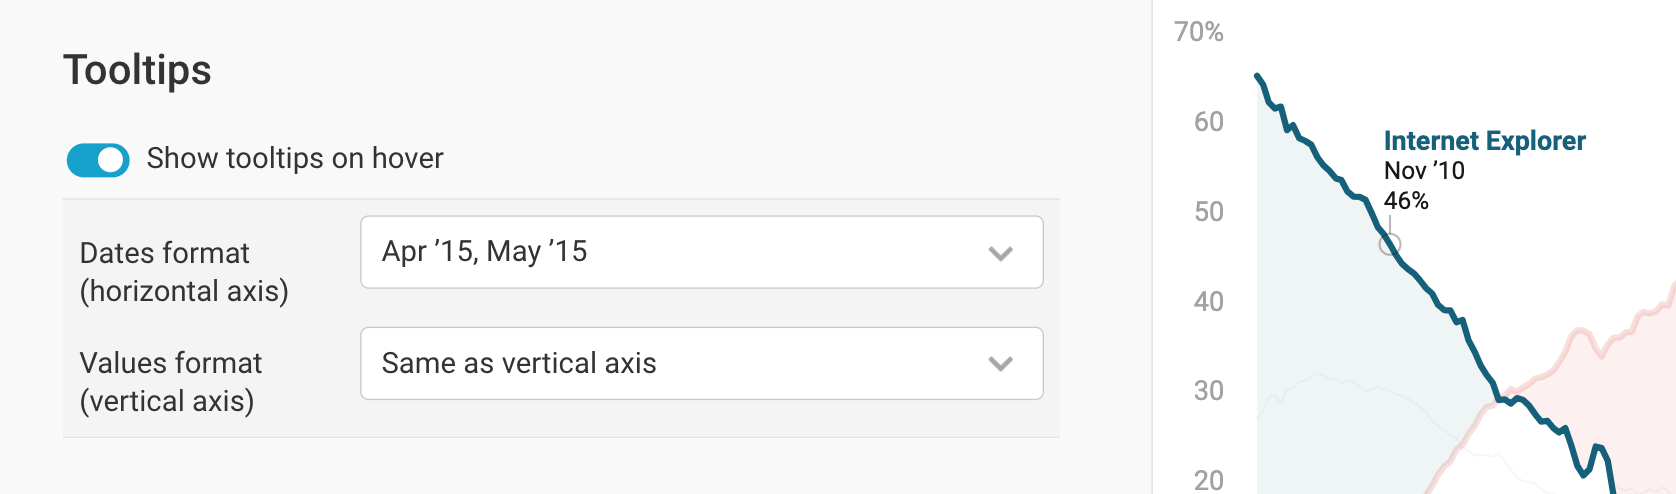
By default, your line chart will show tooltips: If you or your readers hover over a line in your chart, they will see the underlying values.
In the Tooltips panel, you can turn that behavior off, and decide on the date format and number format of your tooltips:
Changing height and margin
In the last panel of the Refine tab, you can decide on the chart height and the size of the margin of your chart.
You can set a fixed plot height, or one based on width that scales with the width of your chart. To learn more about the concept of chart resizing and the difference between fixed and width-based plot height, visit this Docs article.
The last option allows you to set the size of your label margin - that is, how much space you want to reserve for your labels. Note that on mobile screens, that margin gets ignored, and all line labels move into a color legend at the top.
These are all the options in the Refine tab. To proceed to the Annotate top, click on Proceed at the bottom of the page, or on Annotate at the top:
Annotating your chart
Adding a title and source
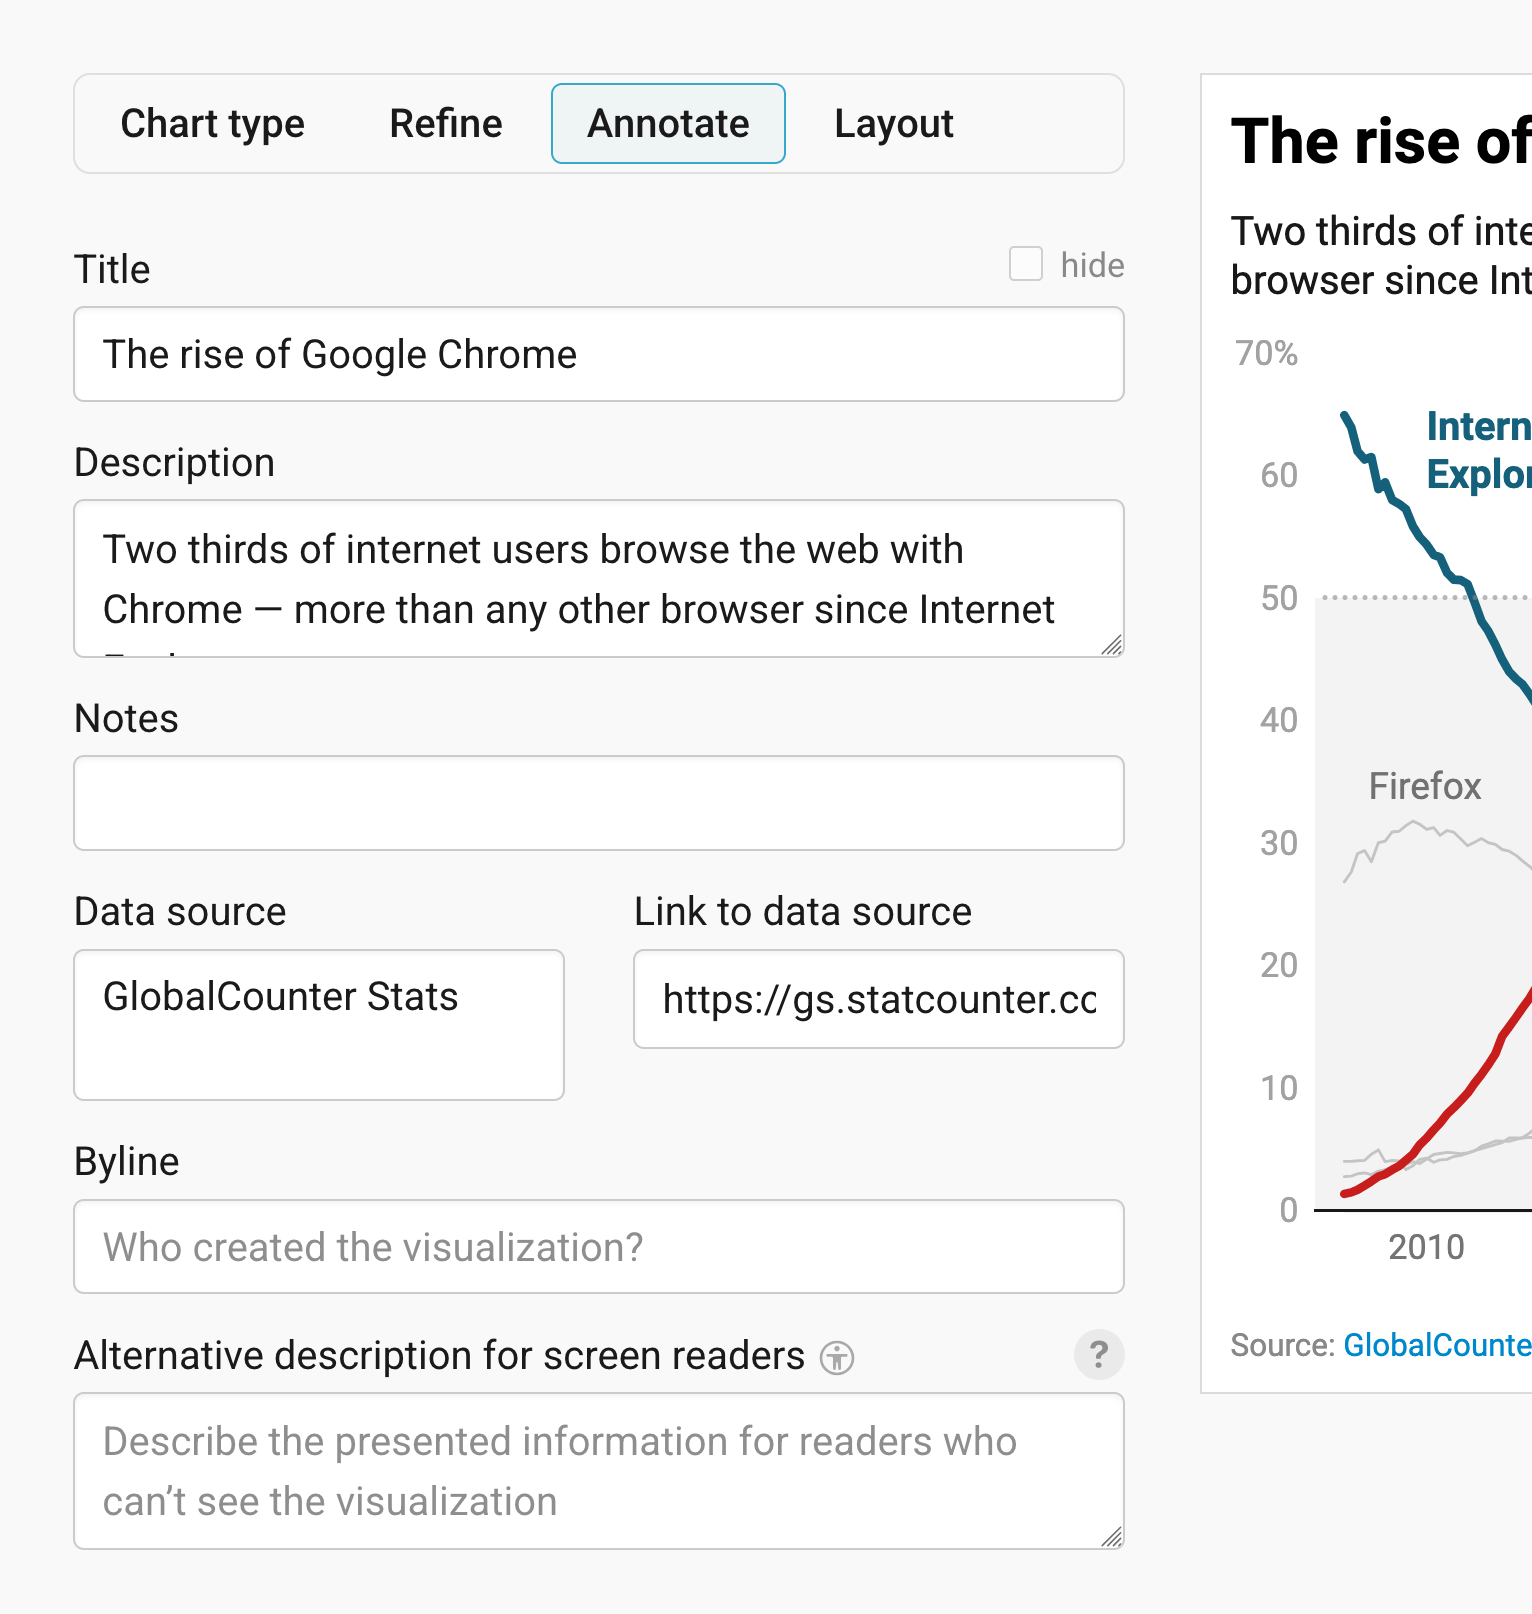
In the Annotate tab, you're first asked to give your visualization a title, description, notes, source, byline, and an alternative description for screen readers. You can find a detailed explanation of all these Annotate options here.
Adding text annotations
Text annotations in Datawrapper let you set text everywhere on your chart. You can type text into the text field and then place it with the little arrow that's left of the text field directly on the chart:
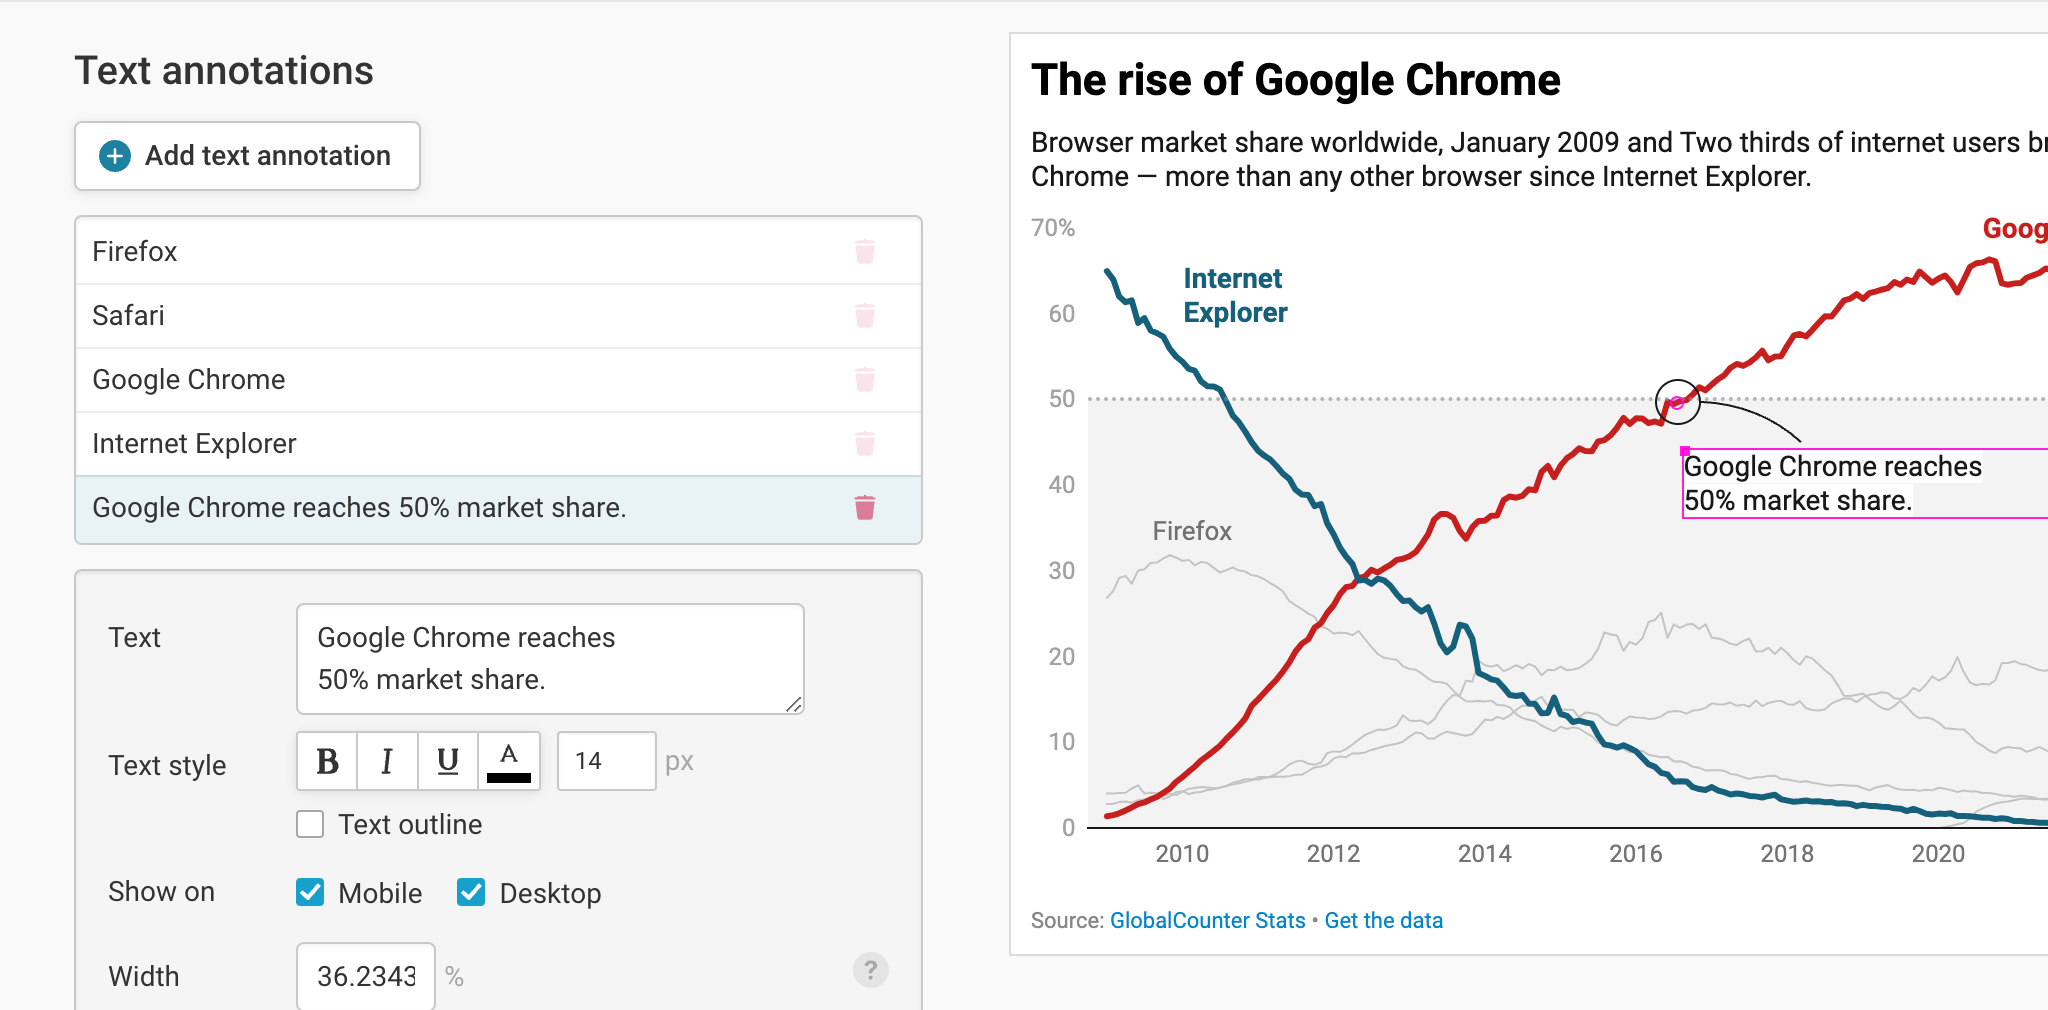
If you'd like to learn more about this feature and how to precisely set and format annotations, visit this article.
Highlighting ranges
If you want to draw your readers' attention to one specific time or value range in our chart, highlighting a range is perfect. It allows you to set grayed-out ranges directly in our chart. To do so, click on Add range highlight. Now select a starting and ending point of the range by clicking in the chart. If you want, you can also change the start and end position by entering values. Here's an in-depth explanation of all the options.
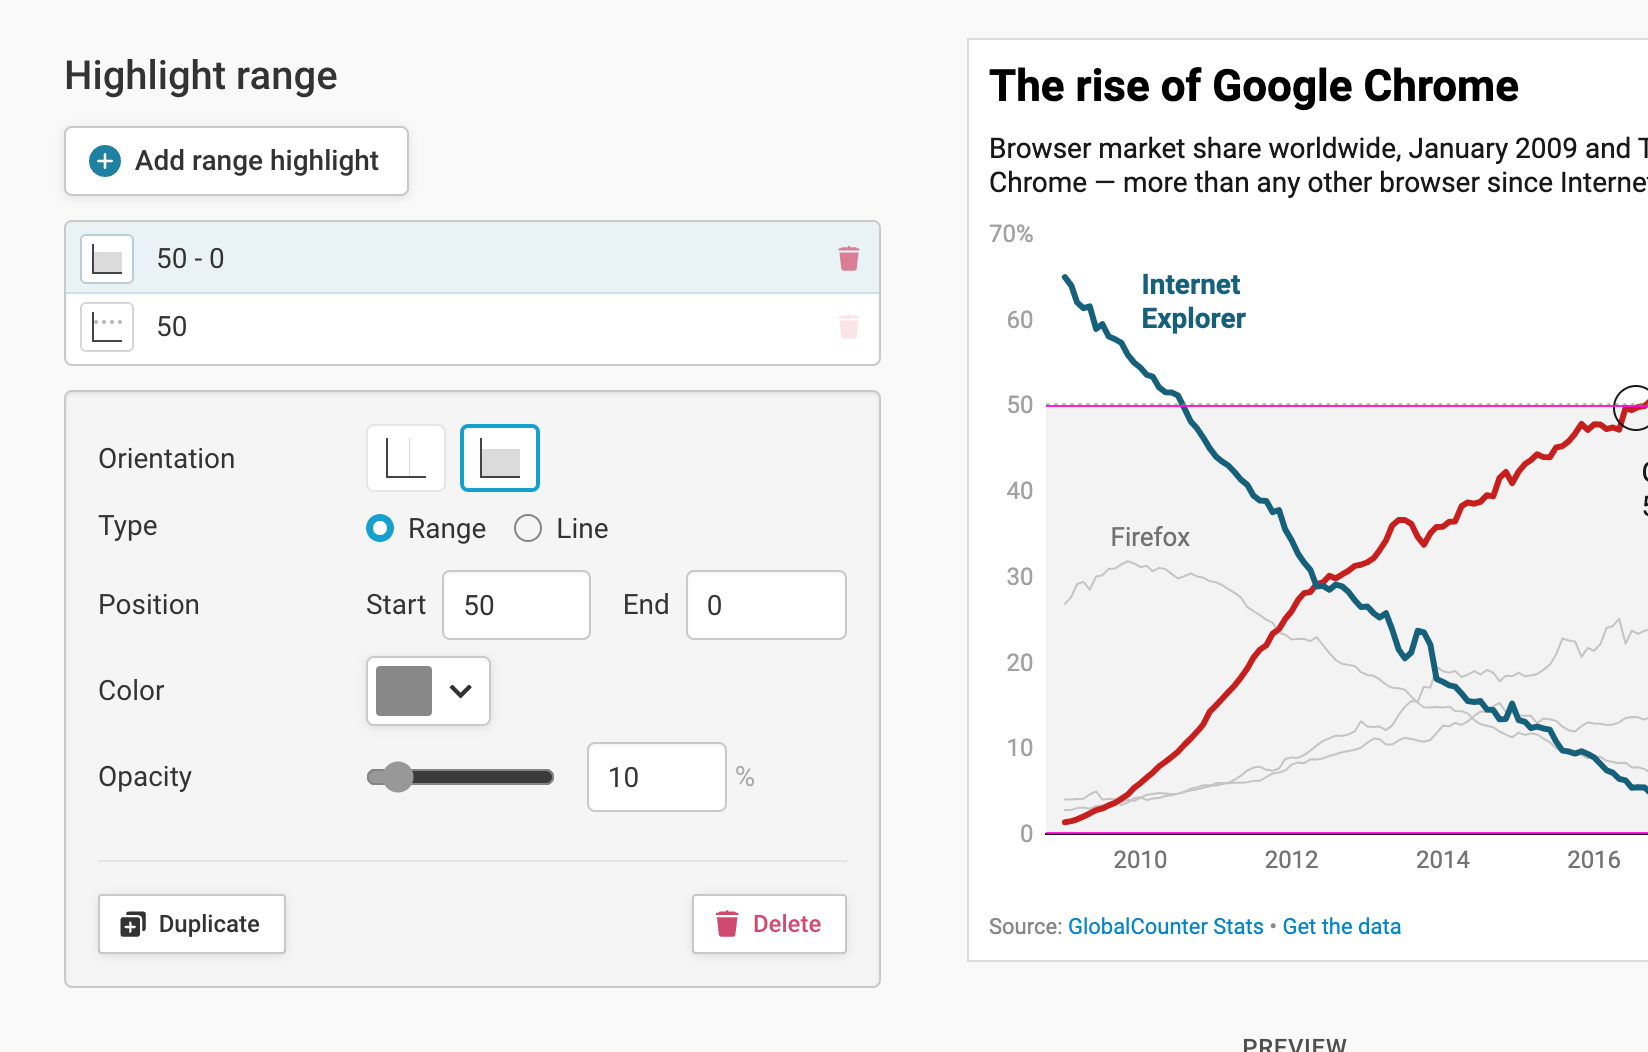
These are all the options in the Annotate tab. To continue to the Layout options, click on Proceed at the bottom of the page, or on Layout at the top:
Publishing your chart
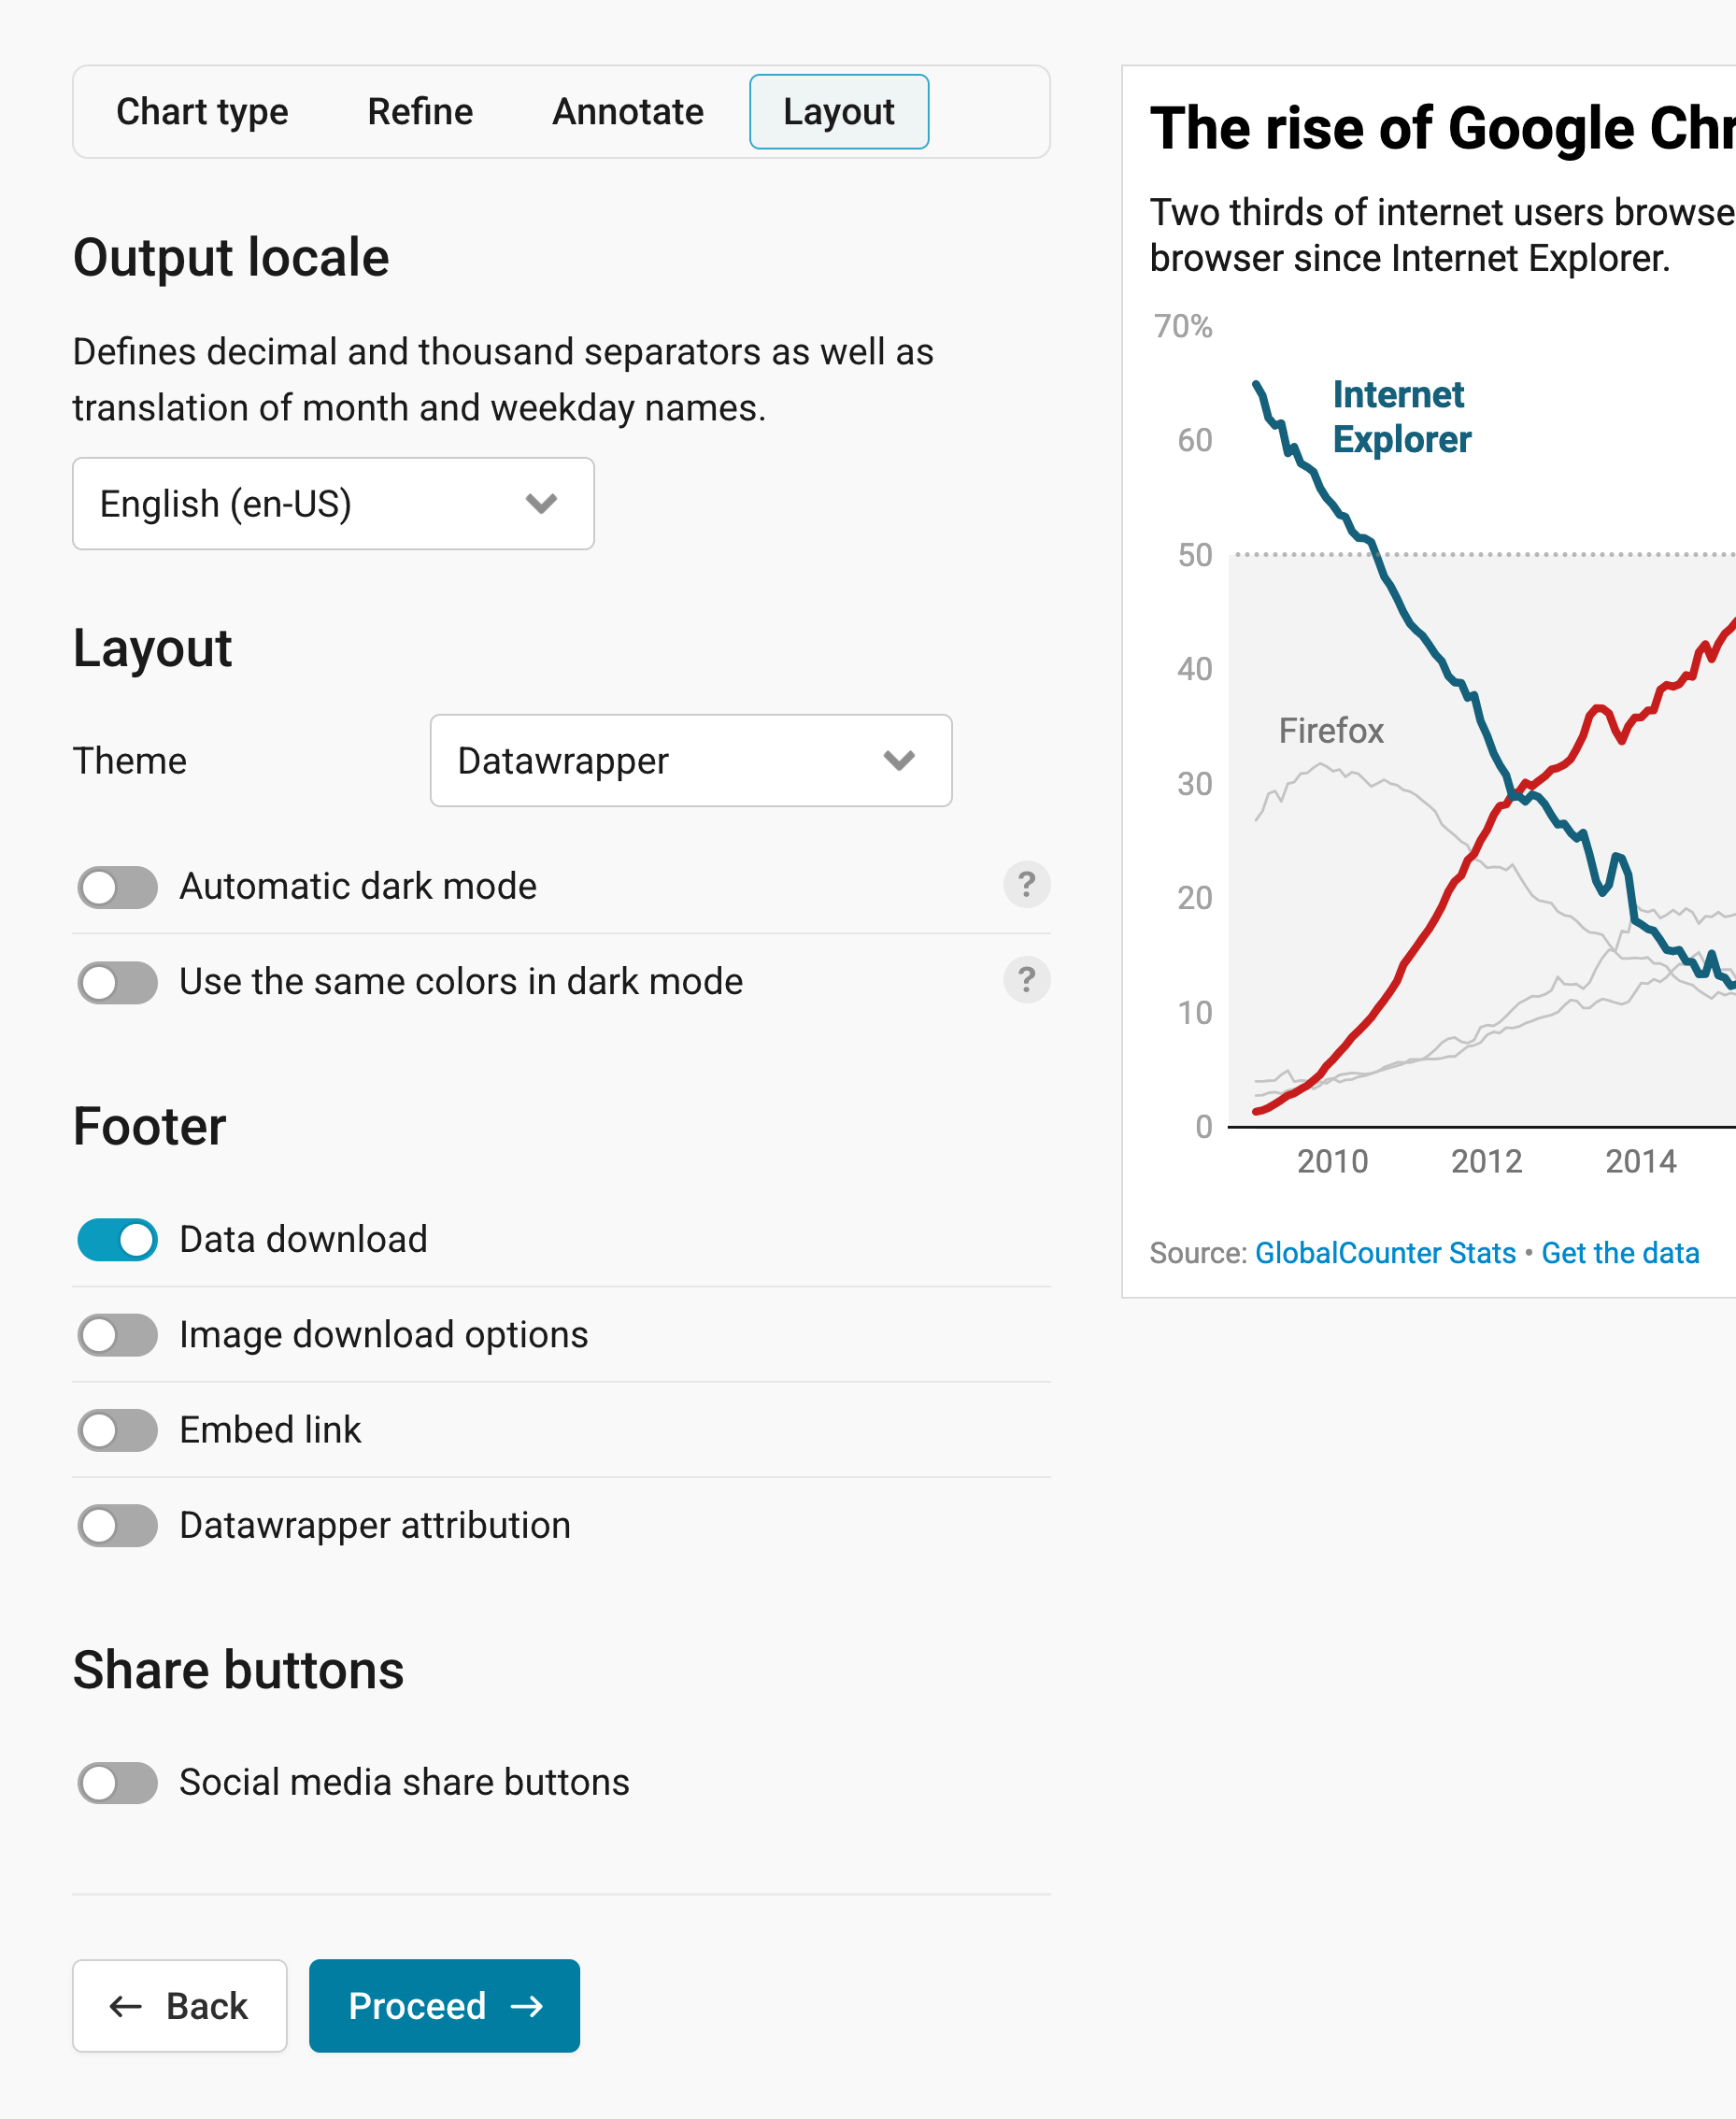
In the Layout tab, you can select an output locale, change the design theme and footer options, and enable social sharing. Find a detailed explanation of all the Layout options here.
Now that you refined, annotated, and changed the design of your chart in the Layout tab, it's time to publish:
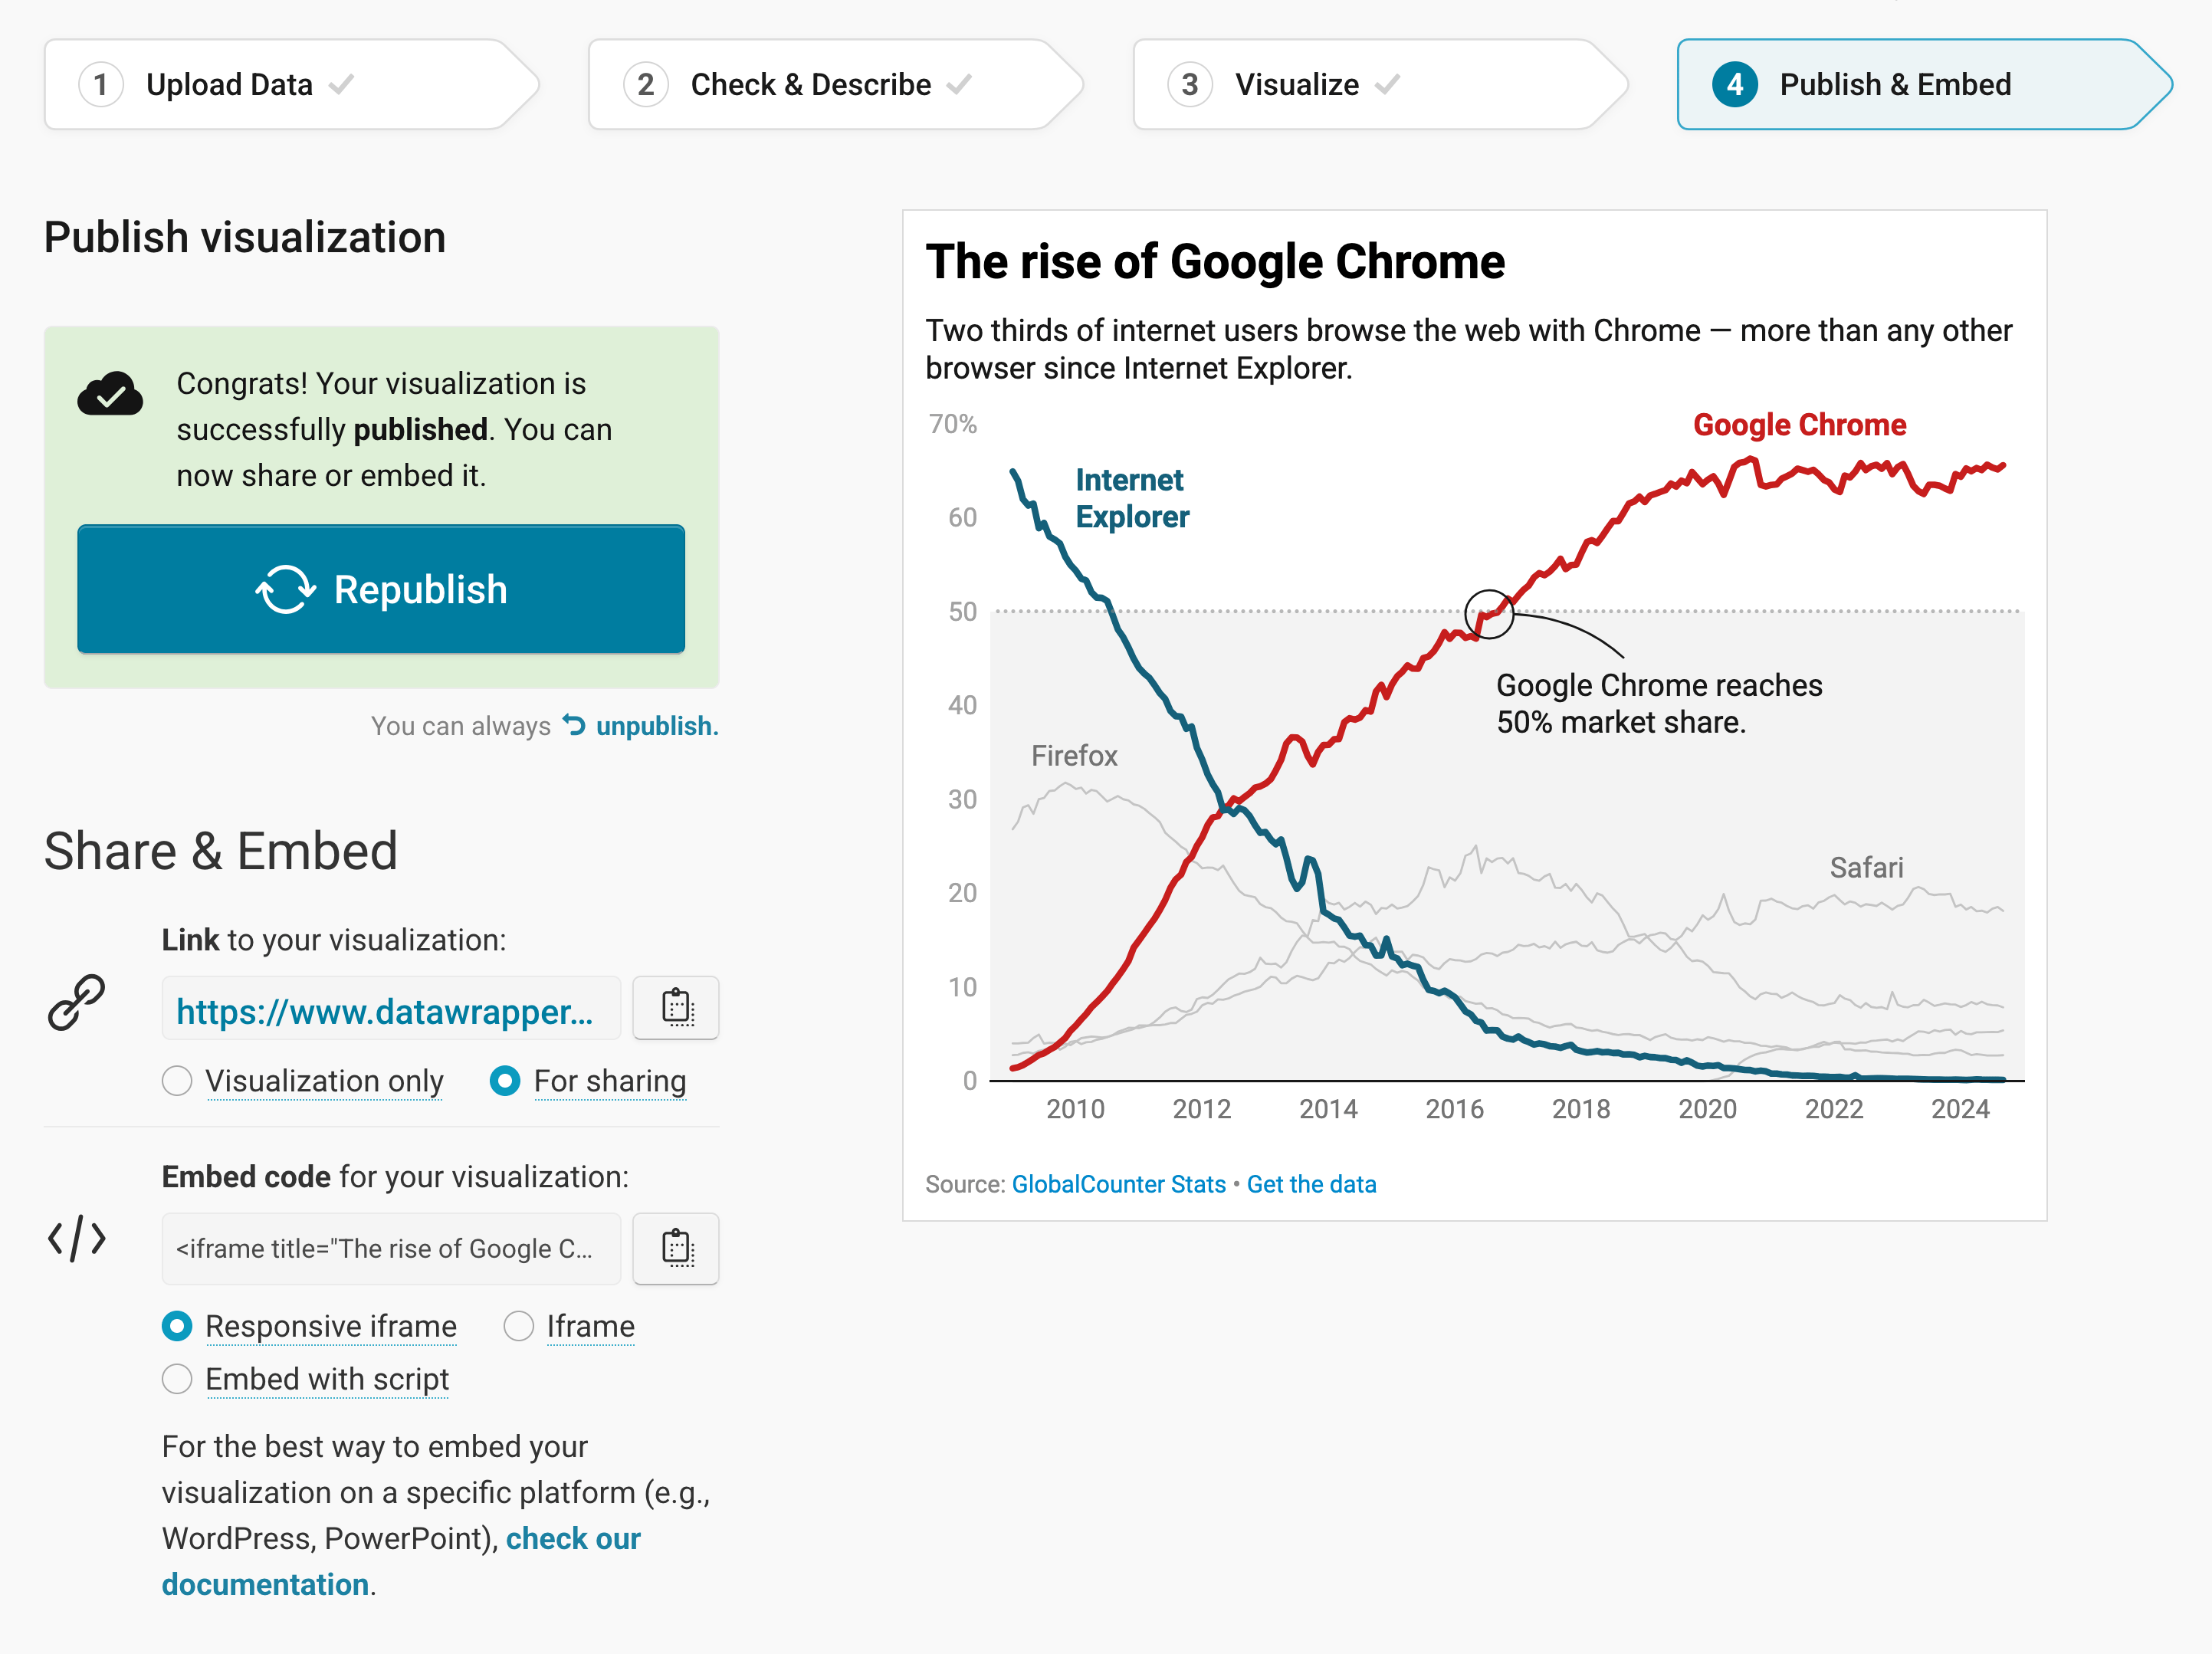
In step 4: Publish & Embed, you can first publish your chart and then decide how it gets to your readers. We recommend pasting the embed code into your website or CMS, but you can also share the chart's URL. Learn more about both options here. To use your chart somewhere else, download it as a PNG (on any plan) or as an SVG or PDF (on paid plans). See what each plan includes on our pricing page.
And that's it! You've successfully created and customized a line chart.