Data Vis Dispatch, November 4: #30DayMapChallenge, hurricane Melissa, and speeches

Welcome back to the 217th edition of Data Vis Dispatch! Every week, we’ll be publishing a collection of the best small and large data visualizations we find, especially from news organizations — to celebrate data journalism, data visualization, simple charts, elaborate maps, and their creators.
Recurring topics this week include our favorites from the #30DayMapChallenge, hurricane Melissa, and speech analysis in politics.
It's November, and you know what that means: the #30DayMapChallenge is on again! The themes so far: points, lines, polygons, and my data.
![Gaëlle Sutton: "Premier jour du #30DayMapChallenge - Point, Point par point, les violences contre les populations civiles, depuis 1989 [...]" [<em>First day of the #30DayMapChallenge - Point by point, violence against civilians since 1989</em>], November 1 (<a href="https://bsky.app/profile/gaellesutton.bsky.social/post/3m4ku6x7wmk2o"><strong>Bluesky</strong></a>)](https://datawrapper.de/cdn-cgi/image/quality=85,width=2000,f=auto,fit=cover/https://kirby.datawrapper.de/media/pages/blog/data-vis-dispatch-november-4-2025/40138dd09e-1762255847/bafkreifcts6zxpahkfpwpepqj7bnhcat4gex6vhjzcs77i26s3jg6xitne.jpg)
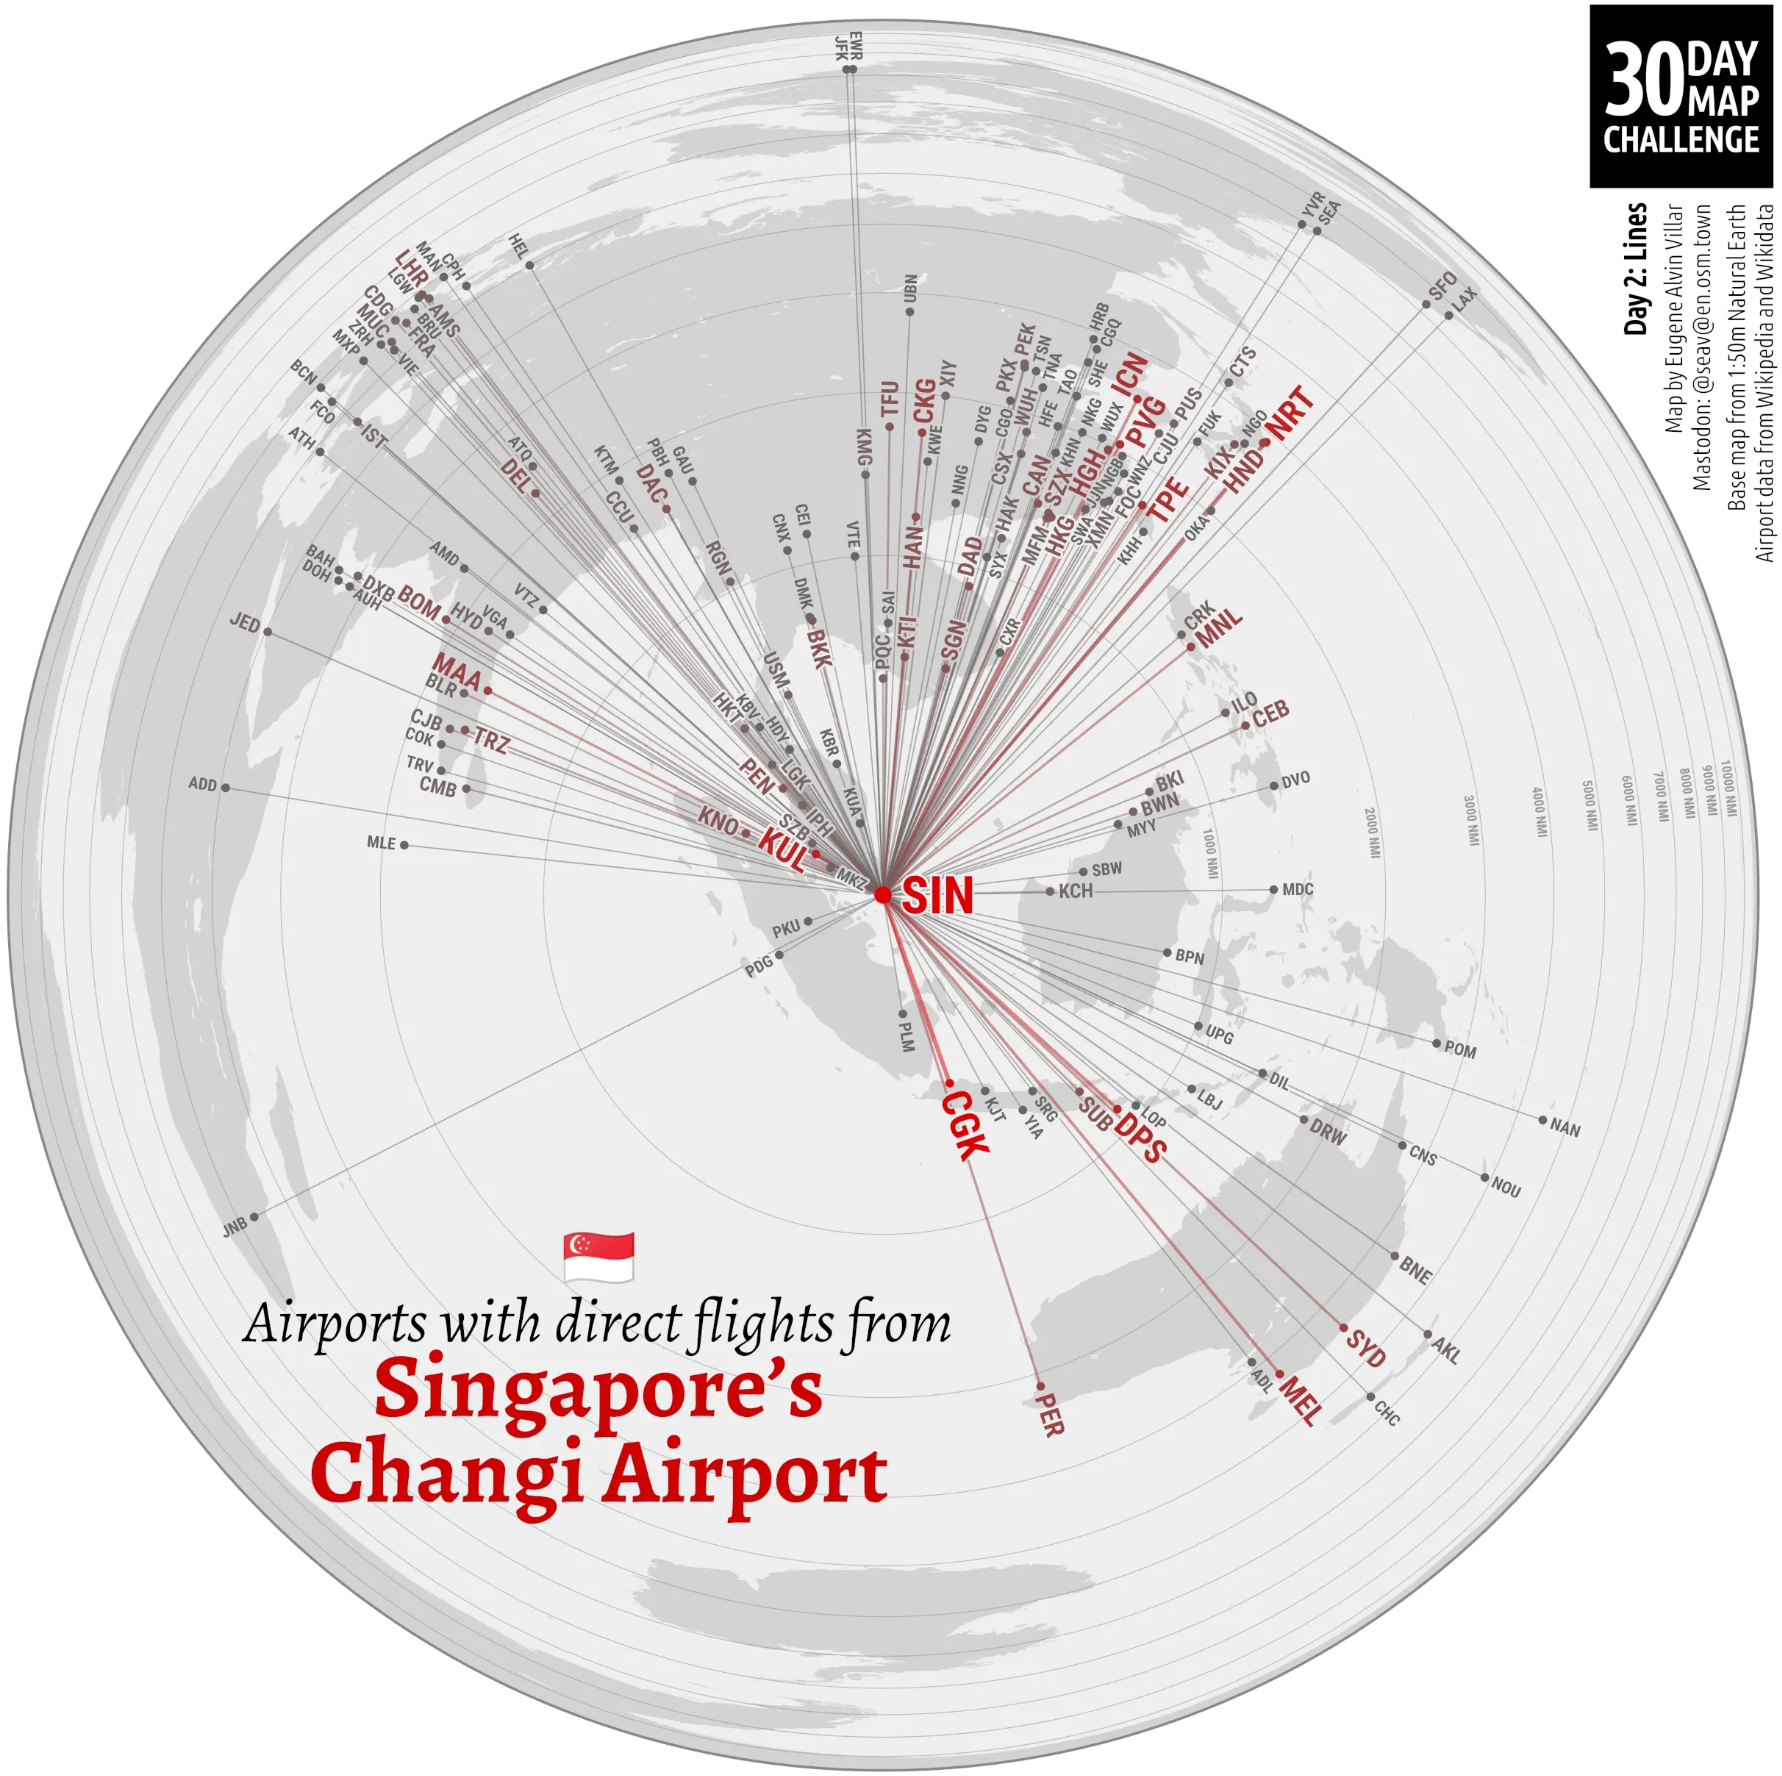
![Sacha Schlumpf: "Day 2 of the #30DayMapChallenge: Lines [...]," November 2 (<a href="https://www.linkedin.com/feed/update/urn:li:activity:7390720496654315520/"><strong>LinkedIn</strong></a>)](https://datawrapper.de/cdn-cgi/image/quality=85,width=1280,f=auto,fit=cover/https://kirby.datawrapper.de/media/pages/blog/data-vis-dispatch-november-4-2025/82cc97c98d-1762164959/maps_1.jpeg)
![Helen McKenzie: "Day 3: polygons, UK proximity to coast, I've always wanted to figure this one out! Credit to Kurt Menke [who] inspired this," November 3 (<a href="https://www.linkedin.com/feed/update/urn:li:activity:7391138854860279810/"><strong>LinkedIn</strong></a>)](https://datawrapper.de/cdn-cgi/image/quality=85,width=800,f=auto,fit=cover/https://kirby.datawrapper.de/media/pages/blog/data-vis-dispatch-november-4-2025/eff2c79427-1762248237/1762184822658.jpeg)
![ALSO Space: "Day 3: 'Polygons', Boundaries that no fence can mark, revealed only through data. From space, vegetation itself draws the lines that define our agricultural landscapes.This image shows agricultural plots surrounding the city of Brawley, United States, derived from satellite-based NDVI (Normalised Difference Vegetation Index) time series [...]," November 3 (<a href="https://www.linkedin.com/company/also-space/posts/"><strong>LinkedIn</strong></a>)](https://datawrapper.de/cdn-cgi/image/quality=85,width=1280,f=auto,fit=cover/https://kirby.datawrapper.de/media/pages/blog/data-vis-dispatch-november-4-2025/0345bce4f7-1762249087/1762190925758.jpeg)
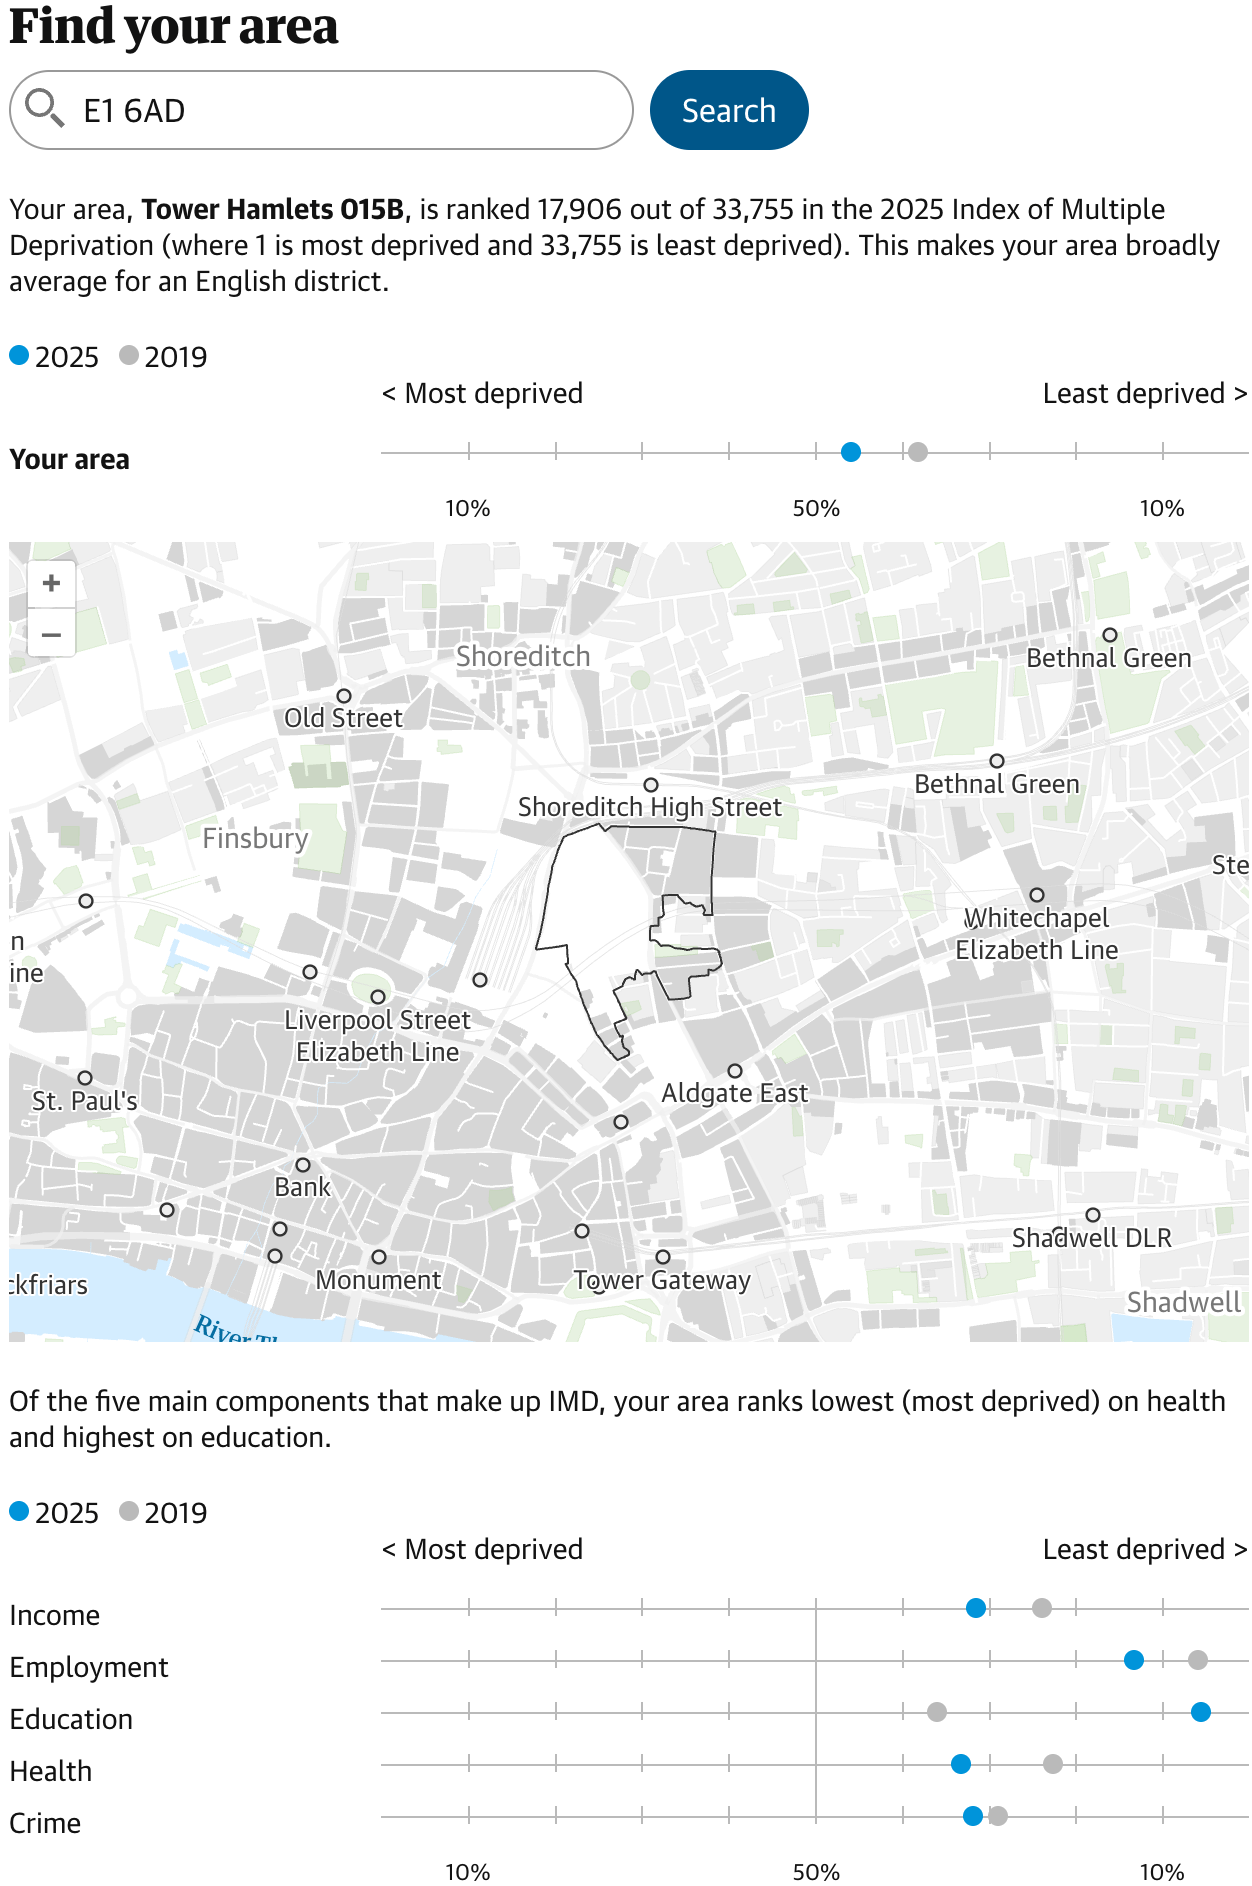
We’re not done with maps yet! Three interactive ones let residents explore their areas, through the lense of deprivation, cost of rent, and level of education.
![Tagesanzeiger: <a href="https://www.tagesanzeiger.ch/bildung-schweiz-wo-die-meisten-akademiker-leben-105781019015"><strong>Volksschule, Lehre, Uni? So gebildet ist Ihre Nachbarschaft</strong></a> [<em>Elementary school, apprenticeship, university? This is how educated your neighborhood is</em>], November 2](https://datawrapper.de/cdn-cgi/image/quality=85,width=2036,f=auto,fit=cover/https://kirby.datawrapper.de/media/pages/blog/data-vis-dispatch-november-4-2025/43def361fe-1762254531/cleanshot-2025-11-04-at-12.06.12@2x.png)
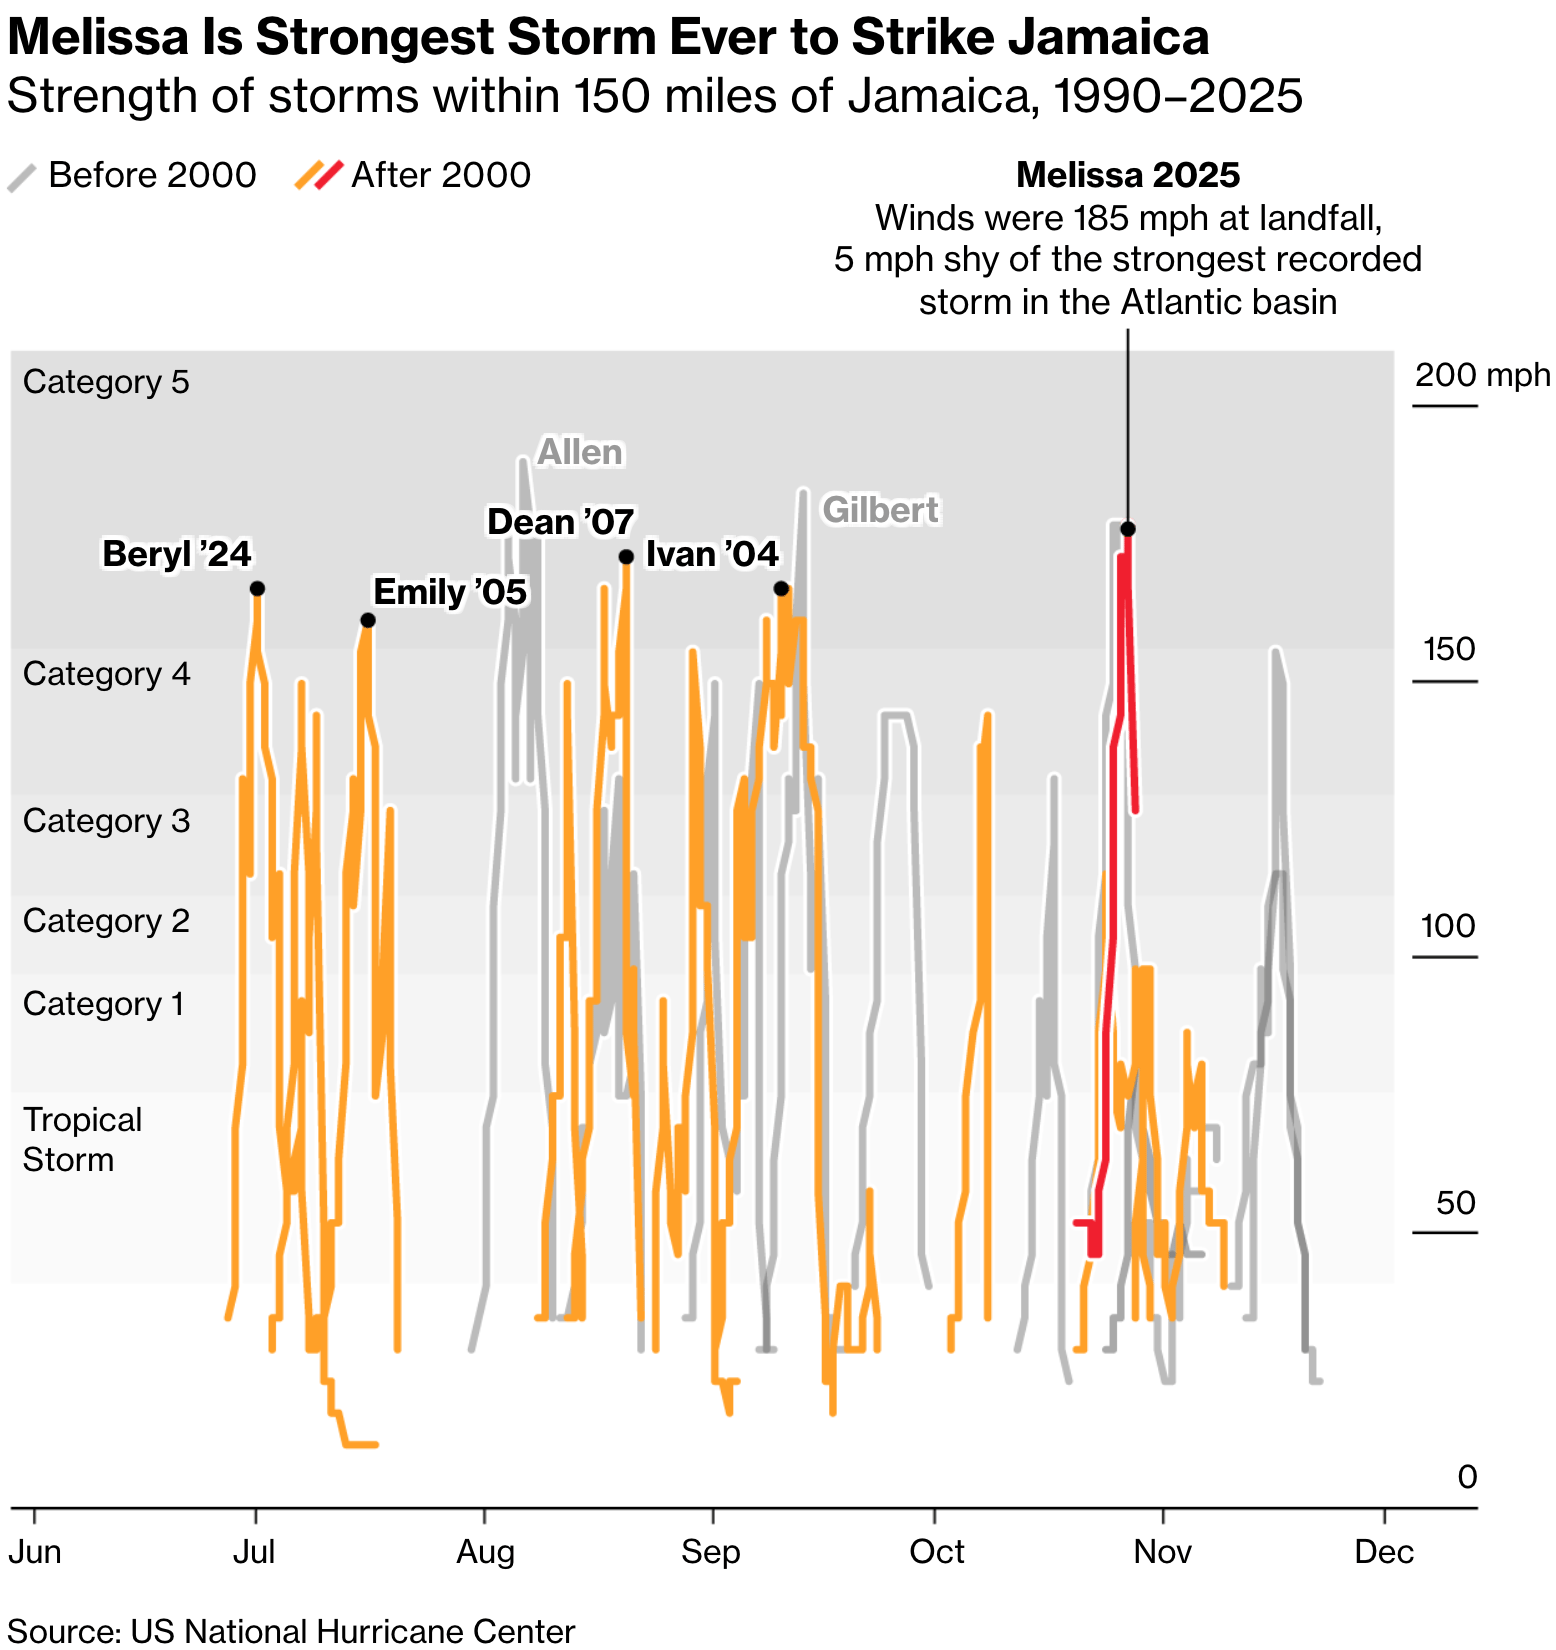
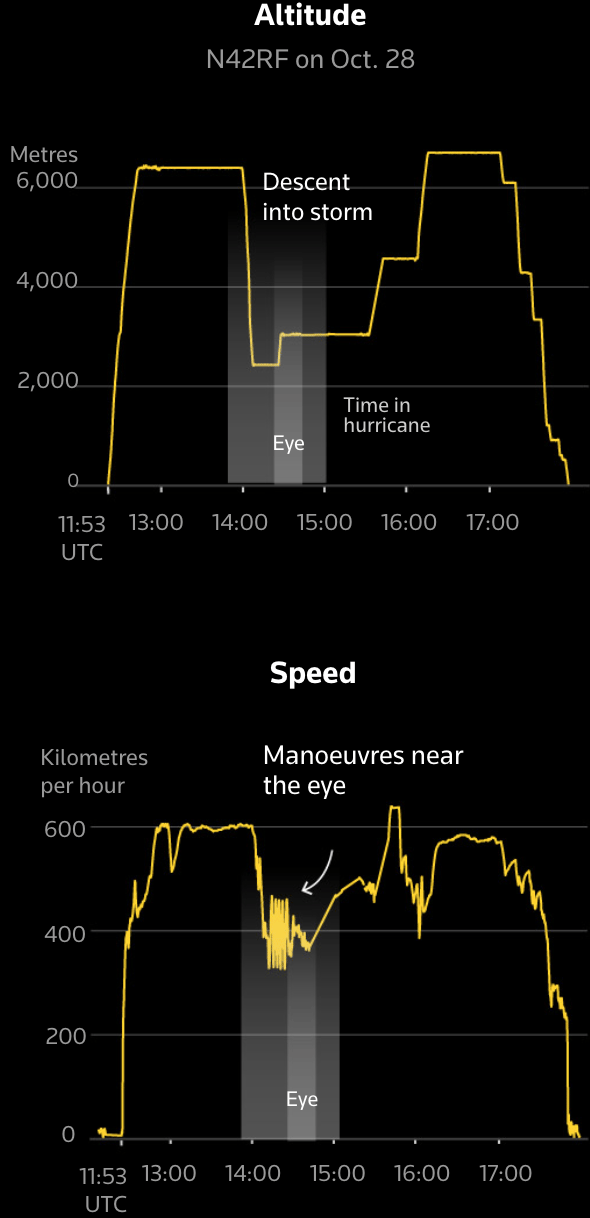
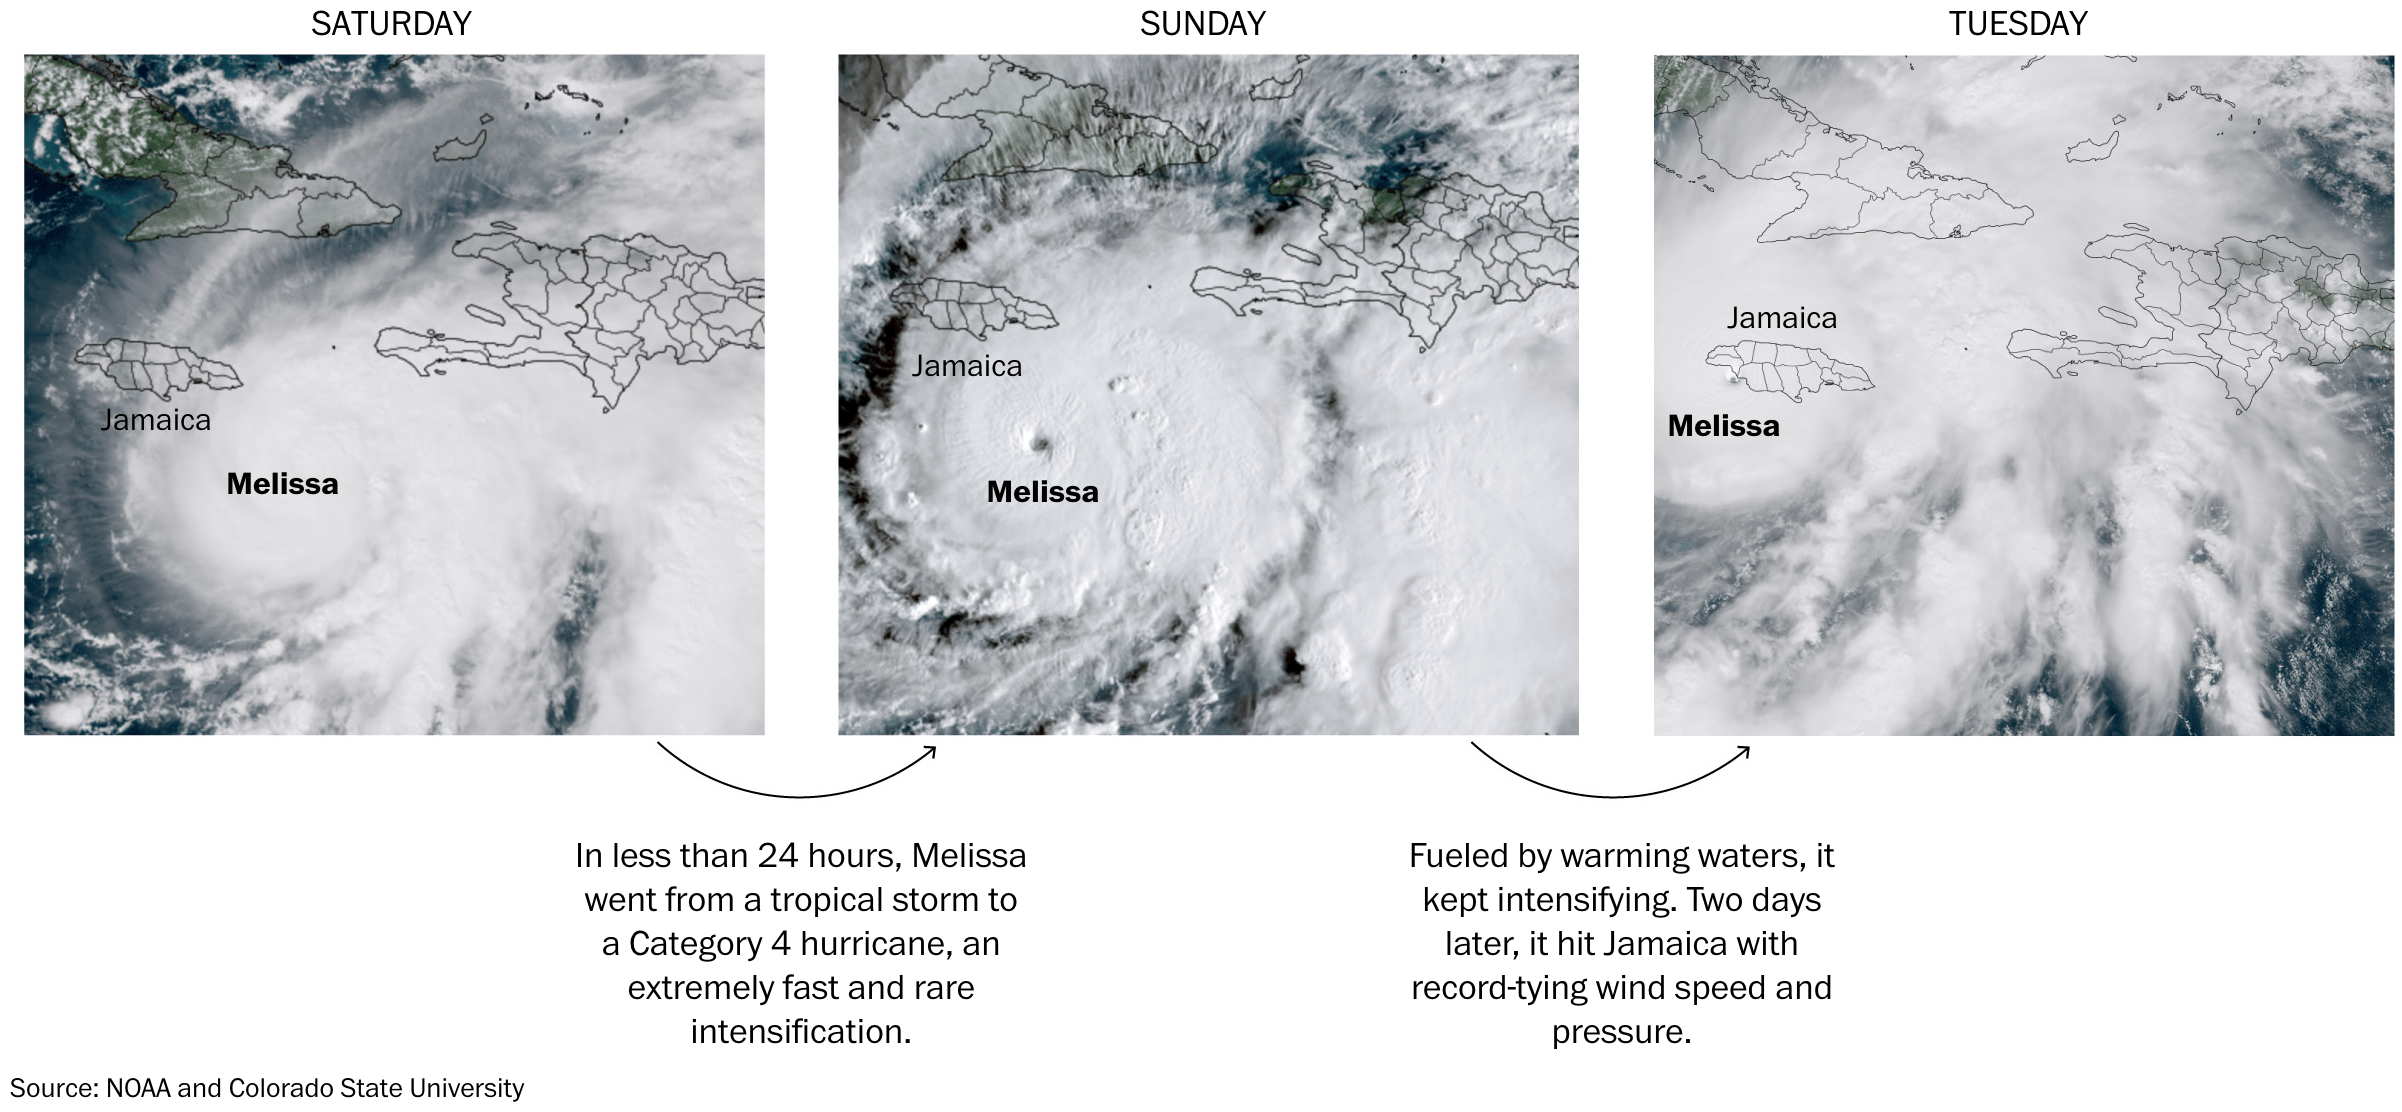
Surprisingly, Hurricane Melissa triggered a number of interesting visualizations beyond maps. In addition to the storm's path, wind speed measurements were of particular interest.
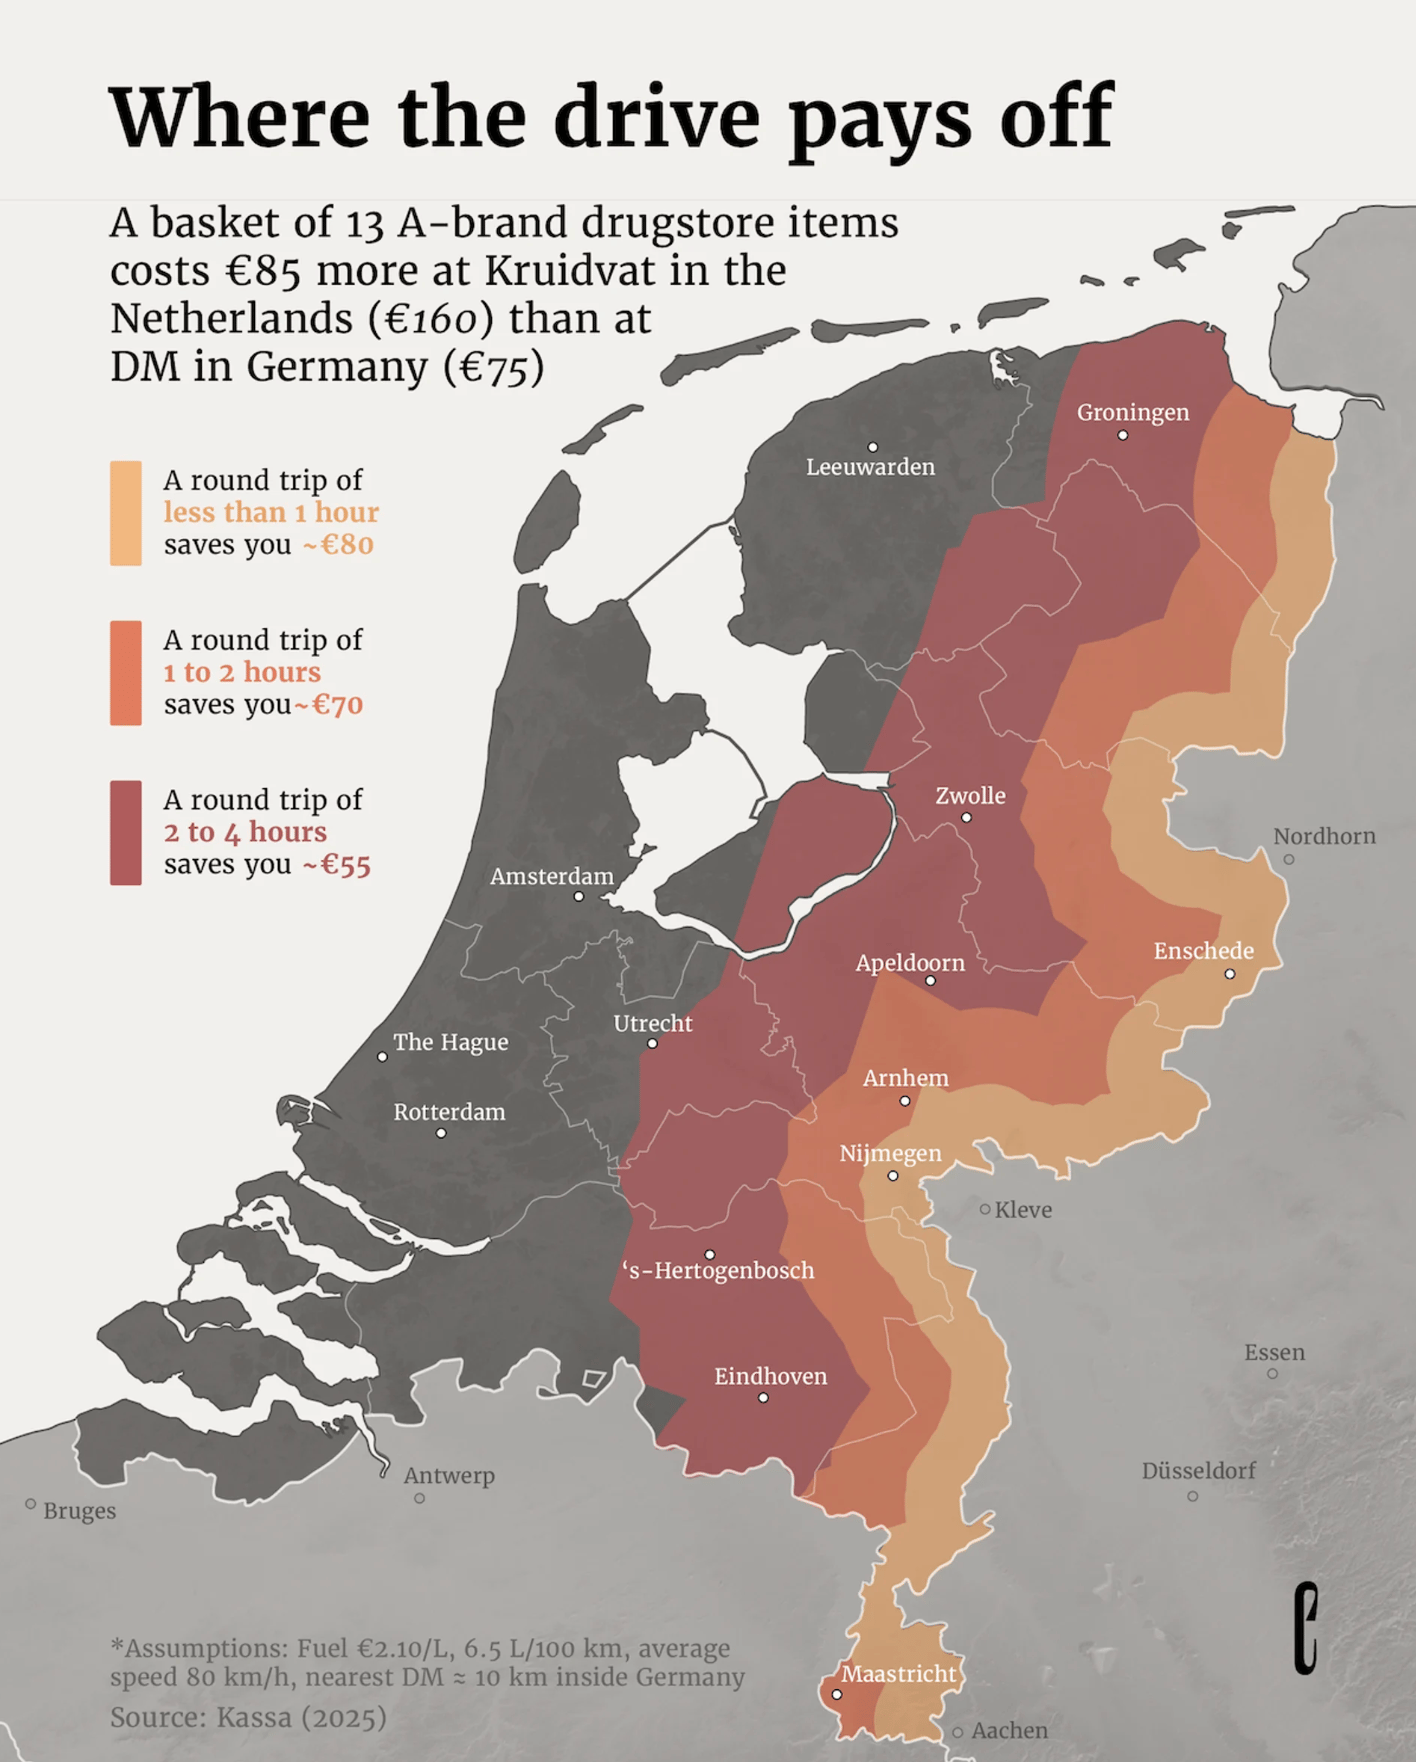
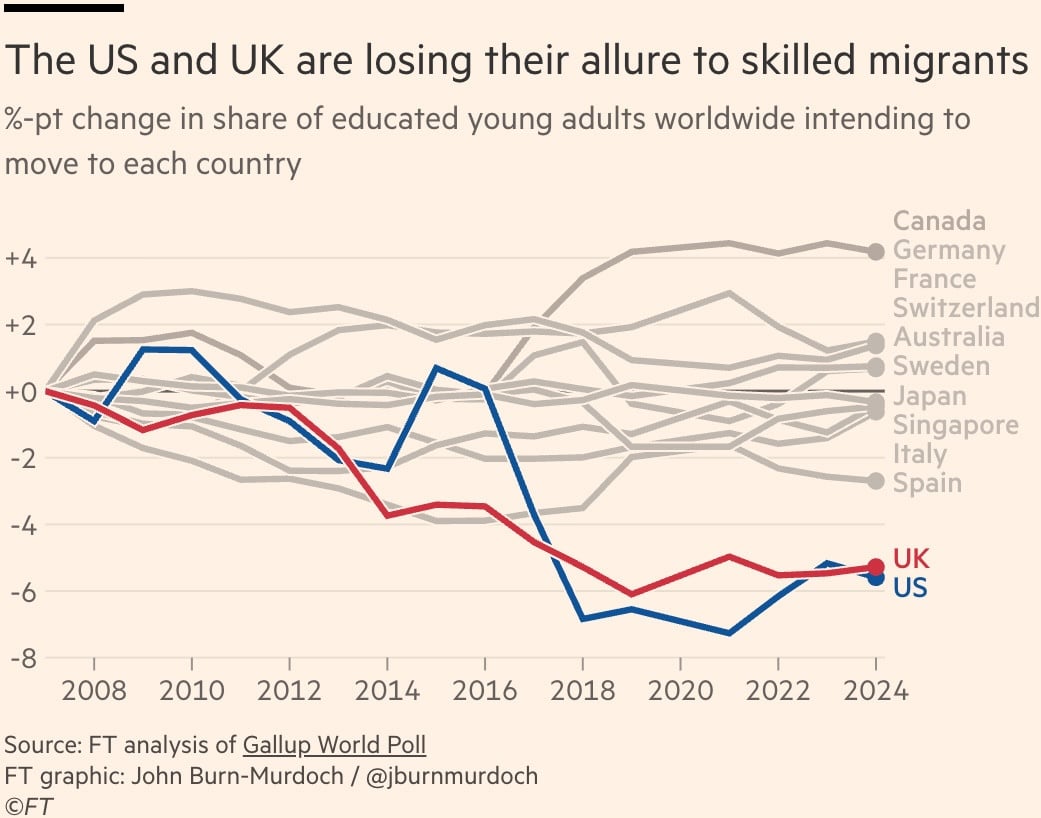
Borders can significantly impact people's lives, affecting them financially, politically, and professionally. Examples include Dutch shoppers crossing into Germany, redrawn political districts, the flow of international talent, and military activity near the Venezuelan border.
![SRF: <a href="https://www.srf.ch/news/international/usa/abstimmung-in-kalifornien-kampf-um-die-karte-zeichnen-sie-wie-ein-gerrymandering-profi"><strong>Kampf um die Karte: Zeichnen Sie wie ein Gerrymandering-Profi!</strong></a> [<em>Battle for the map: Draw like a gerrymandering pro!</em>], October 30](https://datawrapper.de/cdn-cgi/image/quality=85,width=1144,f=auto,fit=cover/https://kirby.datawrapper.de/media/pages/blog/data-vis-dispatch-november-4-2025/c6d7a2c962-1762175826/cleanshot-2025-11-03-at-14.15.49@2x.png)
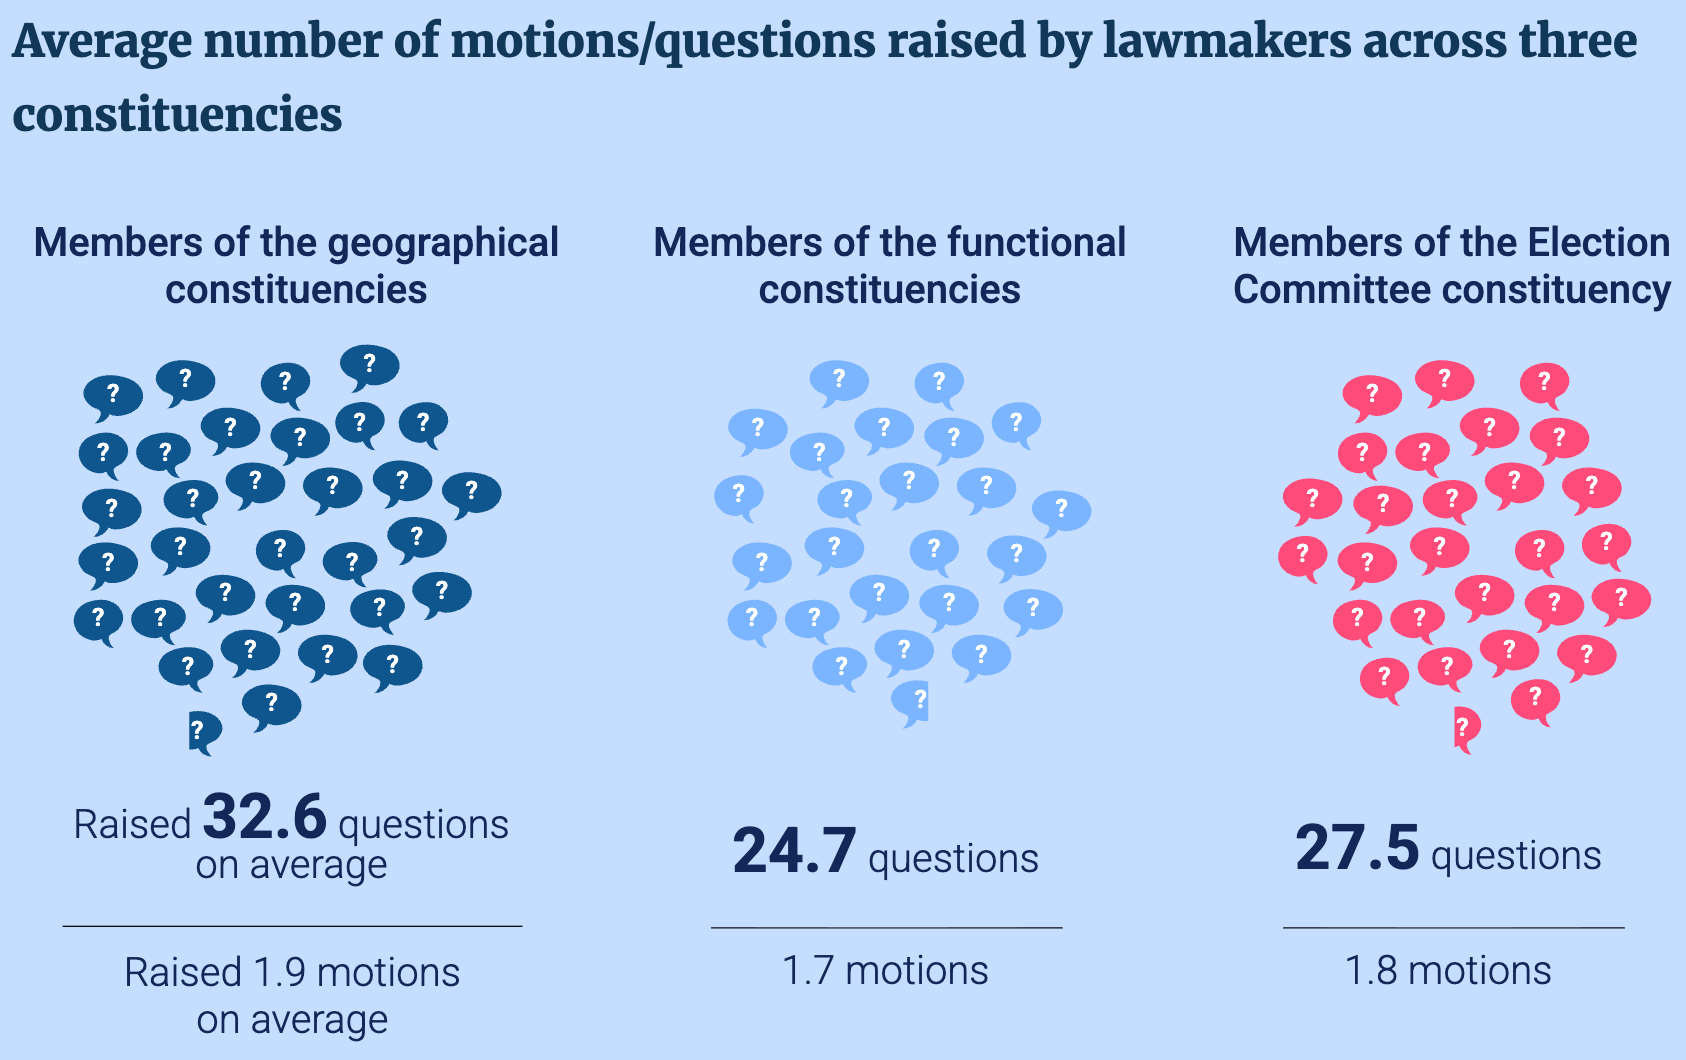
The next cluster speaks about speech (and silence) in politics, how often the word democracy was used in the U.S. Congress, and how often questions were asked by members of constituencies in Hong Kong.
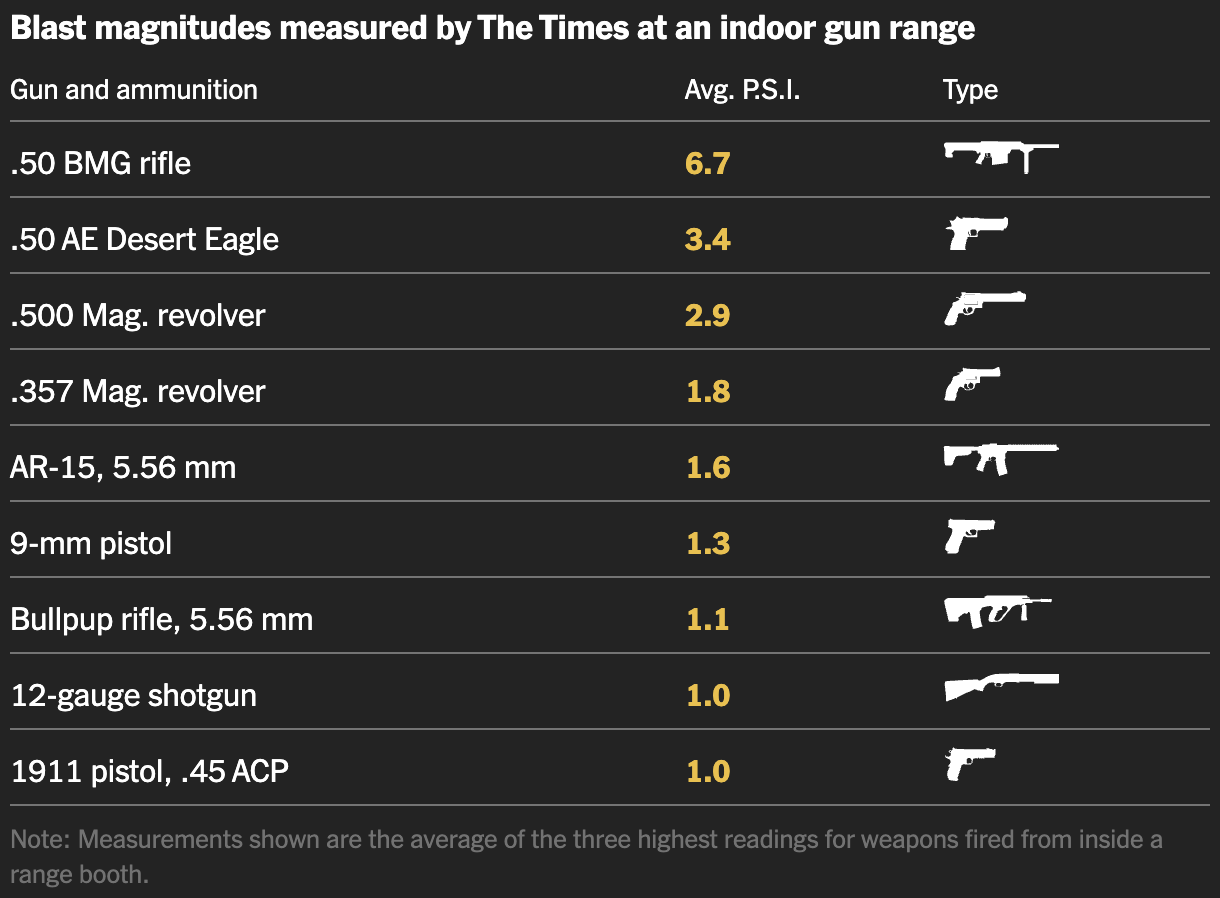
It's good to take a step back every now and then and appreciate a well-designed table, even if its contents are the destructive power of weapons or the unemployment rate among academics.
![DIE ZEIT: <a href="https://www.zeit.de/arbeit/2025-10/arbeitsmarktstatistik-arbeitslosigkeit-fachkraeftemangel-branche-qualifizierung"><strong>In diesen Berufen ist die Jobsuche für Akademiker besonders schwer</strong></a><strong> </strong>[<em>In these fields, job search is especially hard for academics</em><strong>]</strong>, October 31](https://datawrapper.de/cdn-cgi/image/quality=85,width=1488,f=auto,fit=cover/https://kirby.datawrapper.de/media/pages/blog/data-vis-dispatch-november-4-2025/e6c446776f-1762252882/cleanshot-2025-11-04-at-11.38.26@2x.png)
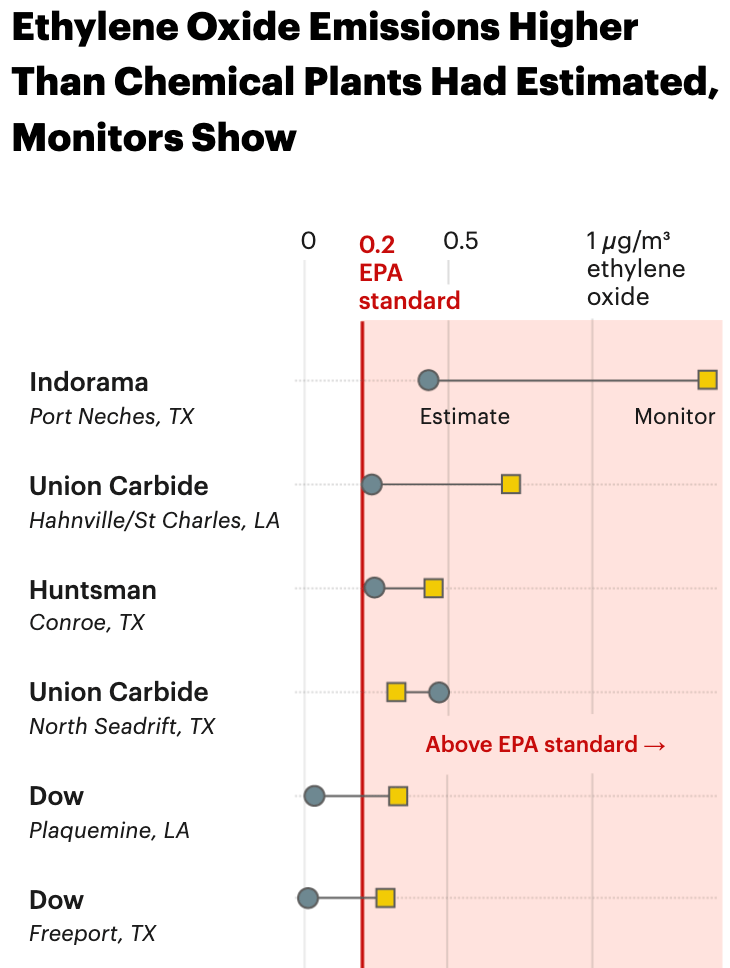
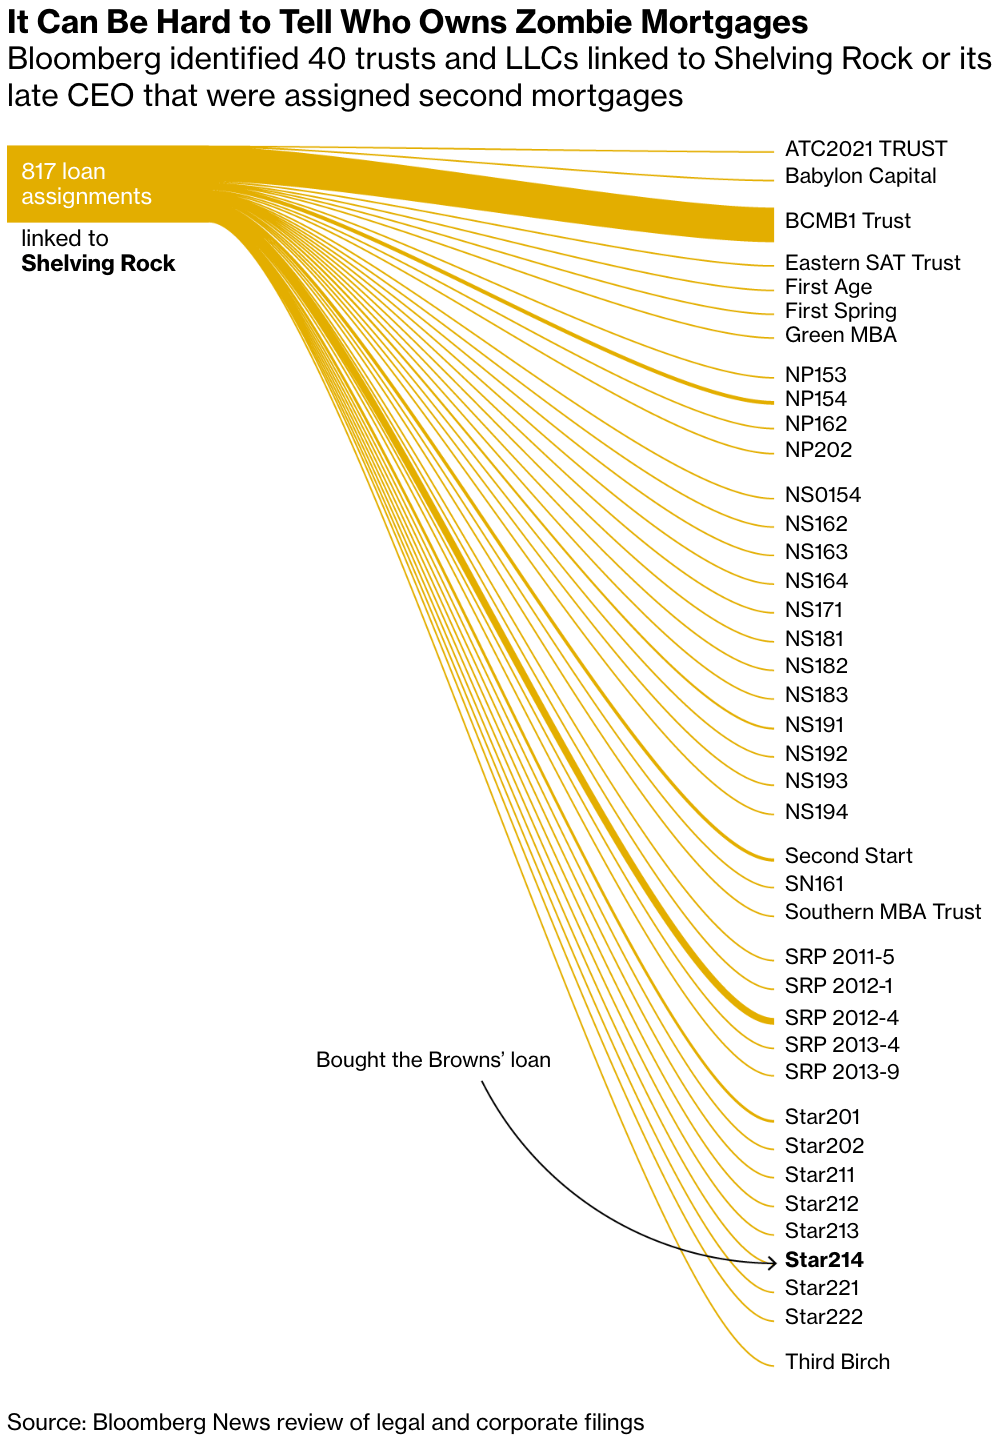
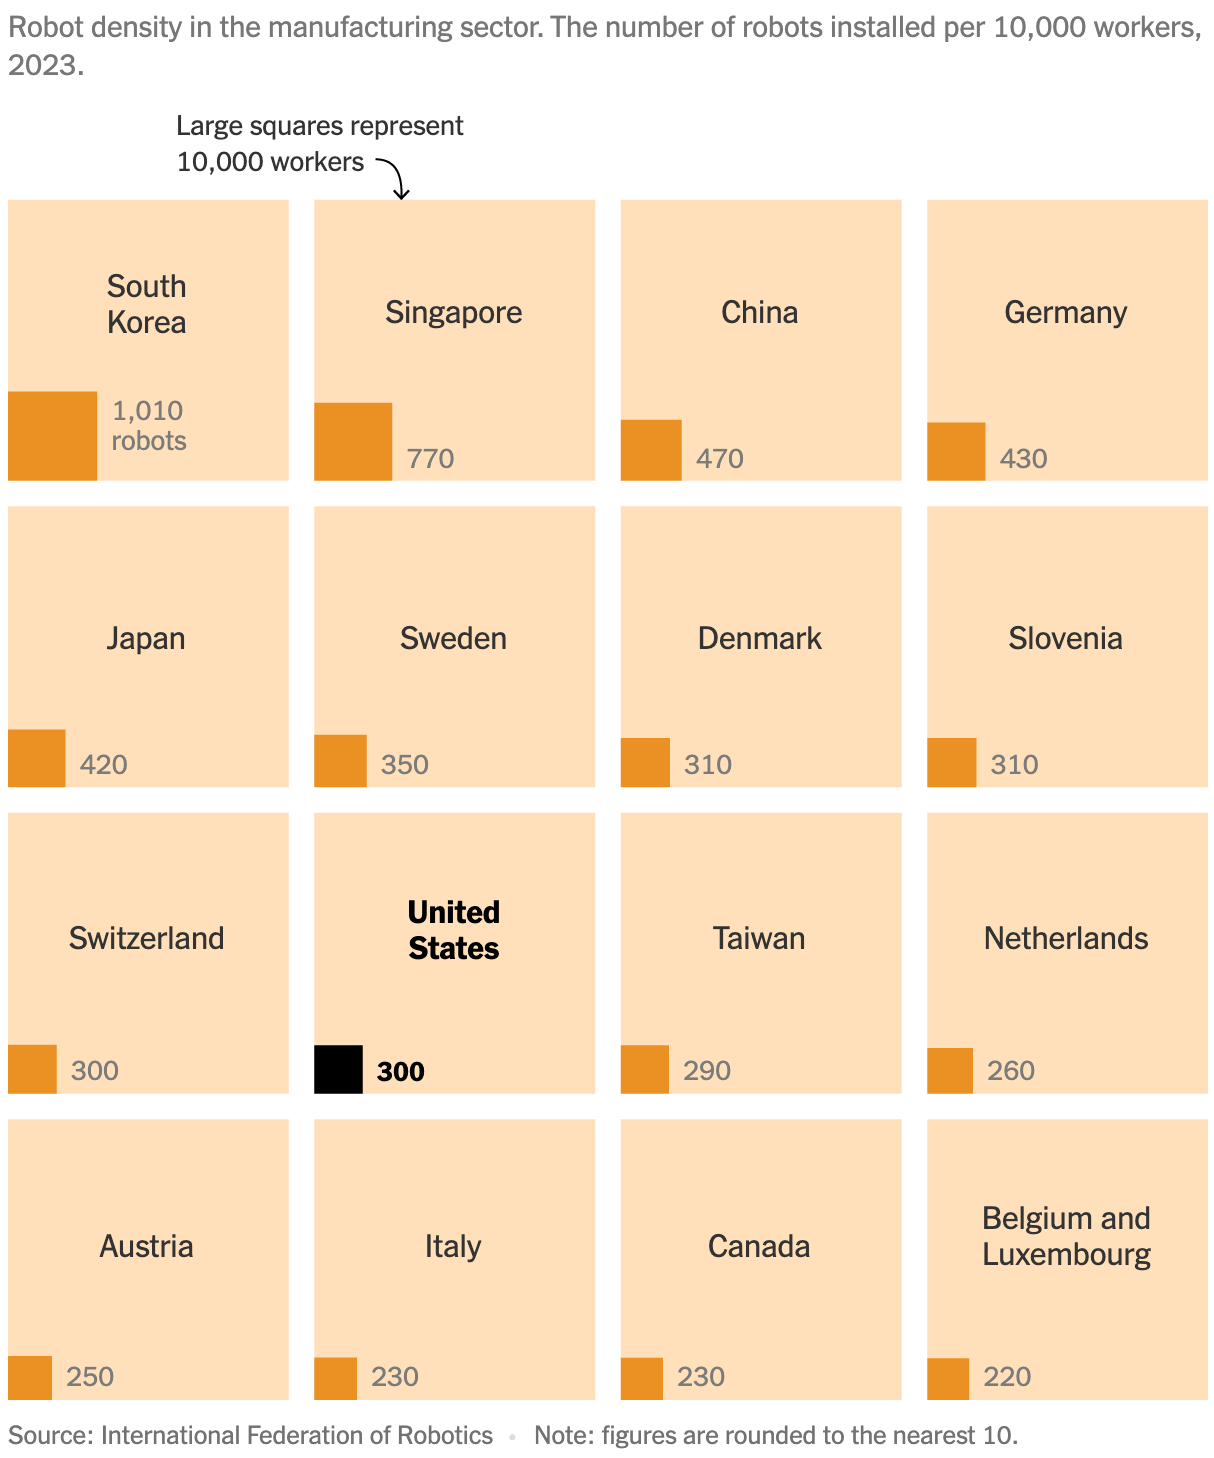
We're rounding off the week with a diverse mix: from corporate emission blind spots and resurrected "zombie" mortgages to the role of robots in manufacturing.
What else we found interesting
![Jer Thorp: "[...] Colors of birds extracted from Wikipedia descriptions," November 3 (<a href="https://bsky.app/profile/jerthorp.bsky.social/post/3m4lu35ma3c2f"><strong>Bluesky</strong></a>)](https://datawrapper.de/cdn-cgi/image/quality=85,width=1550,f=auto,fit=cover/https://kirby.datawrapper.de/media/pages/blog/data-vis-dispatch-november-4-2025/cf9761bd4c-1762254678/cleanshot-2025-11-04-at-12.10.07@2x.png)
Applications are open for…
A data projects editor at The Guardian
A professor for product and spatial practices at University of Applied Sciences Potsdam
A graphics reporter (deleted data project) at the Guardian
Multiple roles on the board of the Data Visualization Society


