This article is brought to you by Datawrapper, a data visualization tool for creating charts, maps, and tables. Learn more.

All Blog Categories

Data Vis Dispatch, November 17: AI chips, stolen paintings, and Tokyo’s street trees

The best of last week’s big and small data visualizations
Portrait of Michelle Otiji
Michelle Otiji

Welcome back to the 271st edition of Data Vis Dispatch! Every week, we’ll be publishing a collection of the best small and large data visualizations we find, especially from news organizations — to celebrate data journalism, data visualization, simple charts, elaborate maps, and their creators.

Recurring topics this week include AI chips, stolen paintings, and Tokyo’s street trees.

We're kicking off this dispatch with a fresh batch of #30DayMapChallenge viz we saw last week – featuring river shapes, Mount Fuji, an inside-out Earth, and municipal populations.
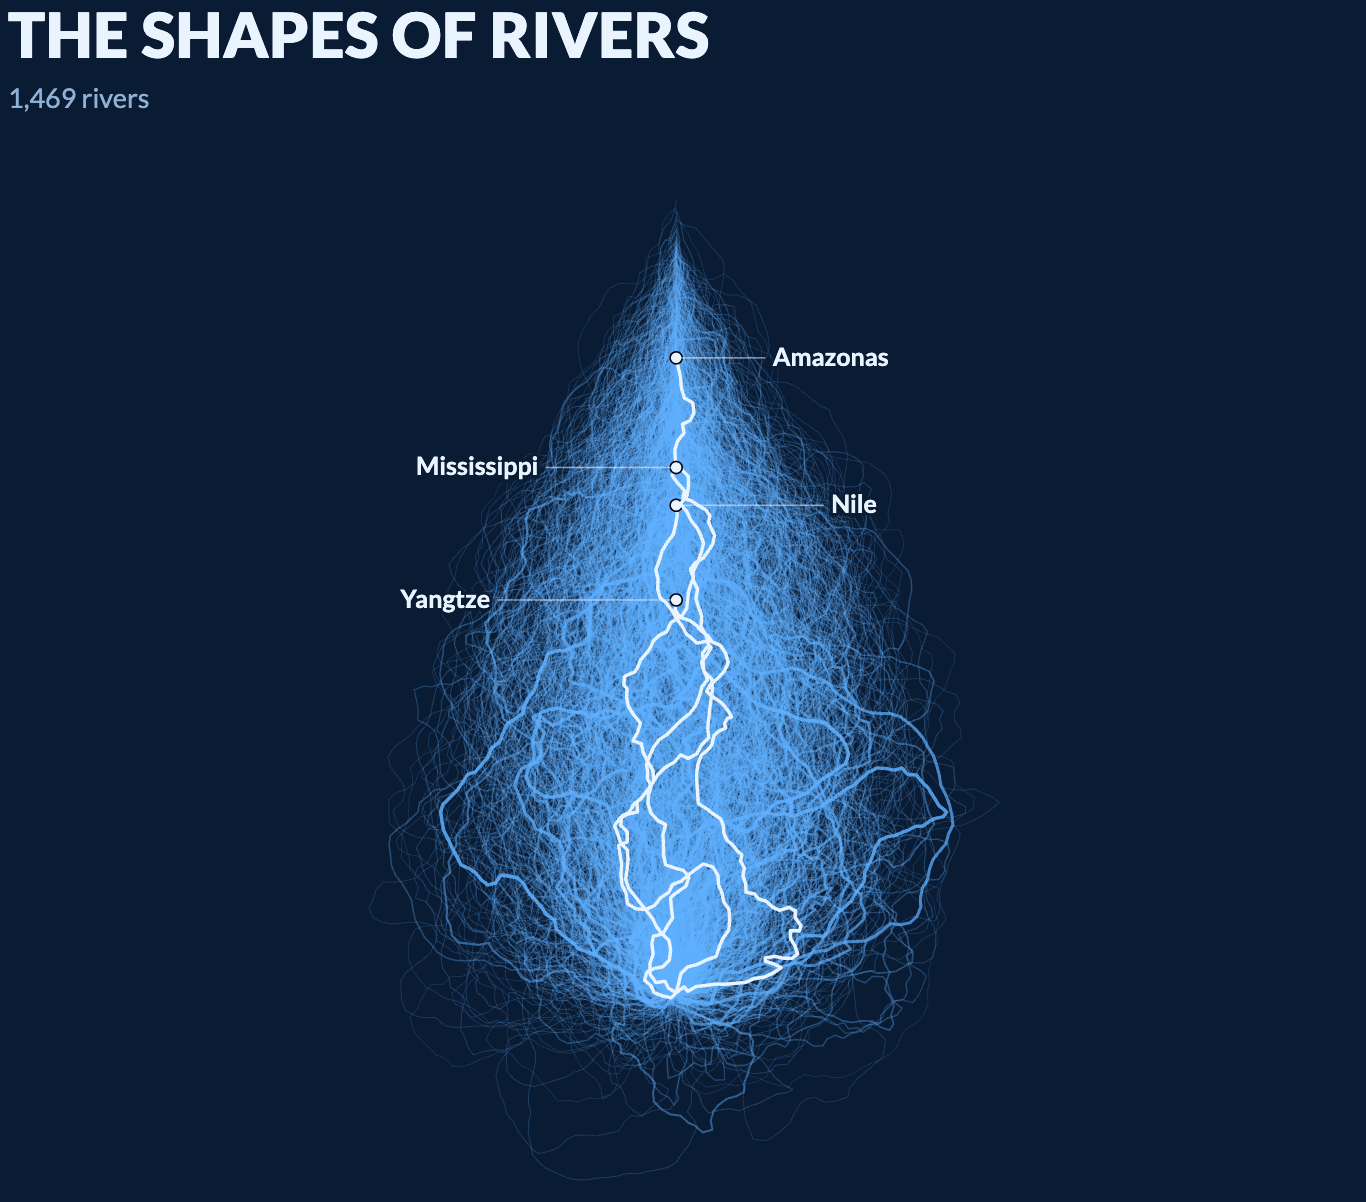
Dr. Dominic Royé: "The Shapes of Rivers is now interactive 🌊 Explore rivers from every continent, normalized by source and length and rotated north, and filter by region [...], November 16 (<a href="https://bsky.app/profile/drxeo.eu/post/3n2g73bturc2j"><strong>Bluesky</strong></a>, <a href="https://dominicroye.github.io/shapes-of-rivers/"><strong>project website</strong></a>) <span class="badge">Explore the interactive tool!</span>
Dr. Dominic Royé: "The Shapes of Rivers is now interactive 🌊 Explore rivers from every continent, normalized by source and length and rotated north, and filter by region [...], November 16 (Bluesky, project website) Explore the interactive tool!
Maps Mania: Contoured Fuji, November 10 (project website)
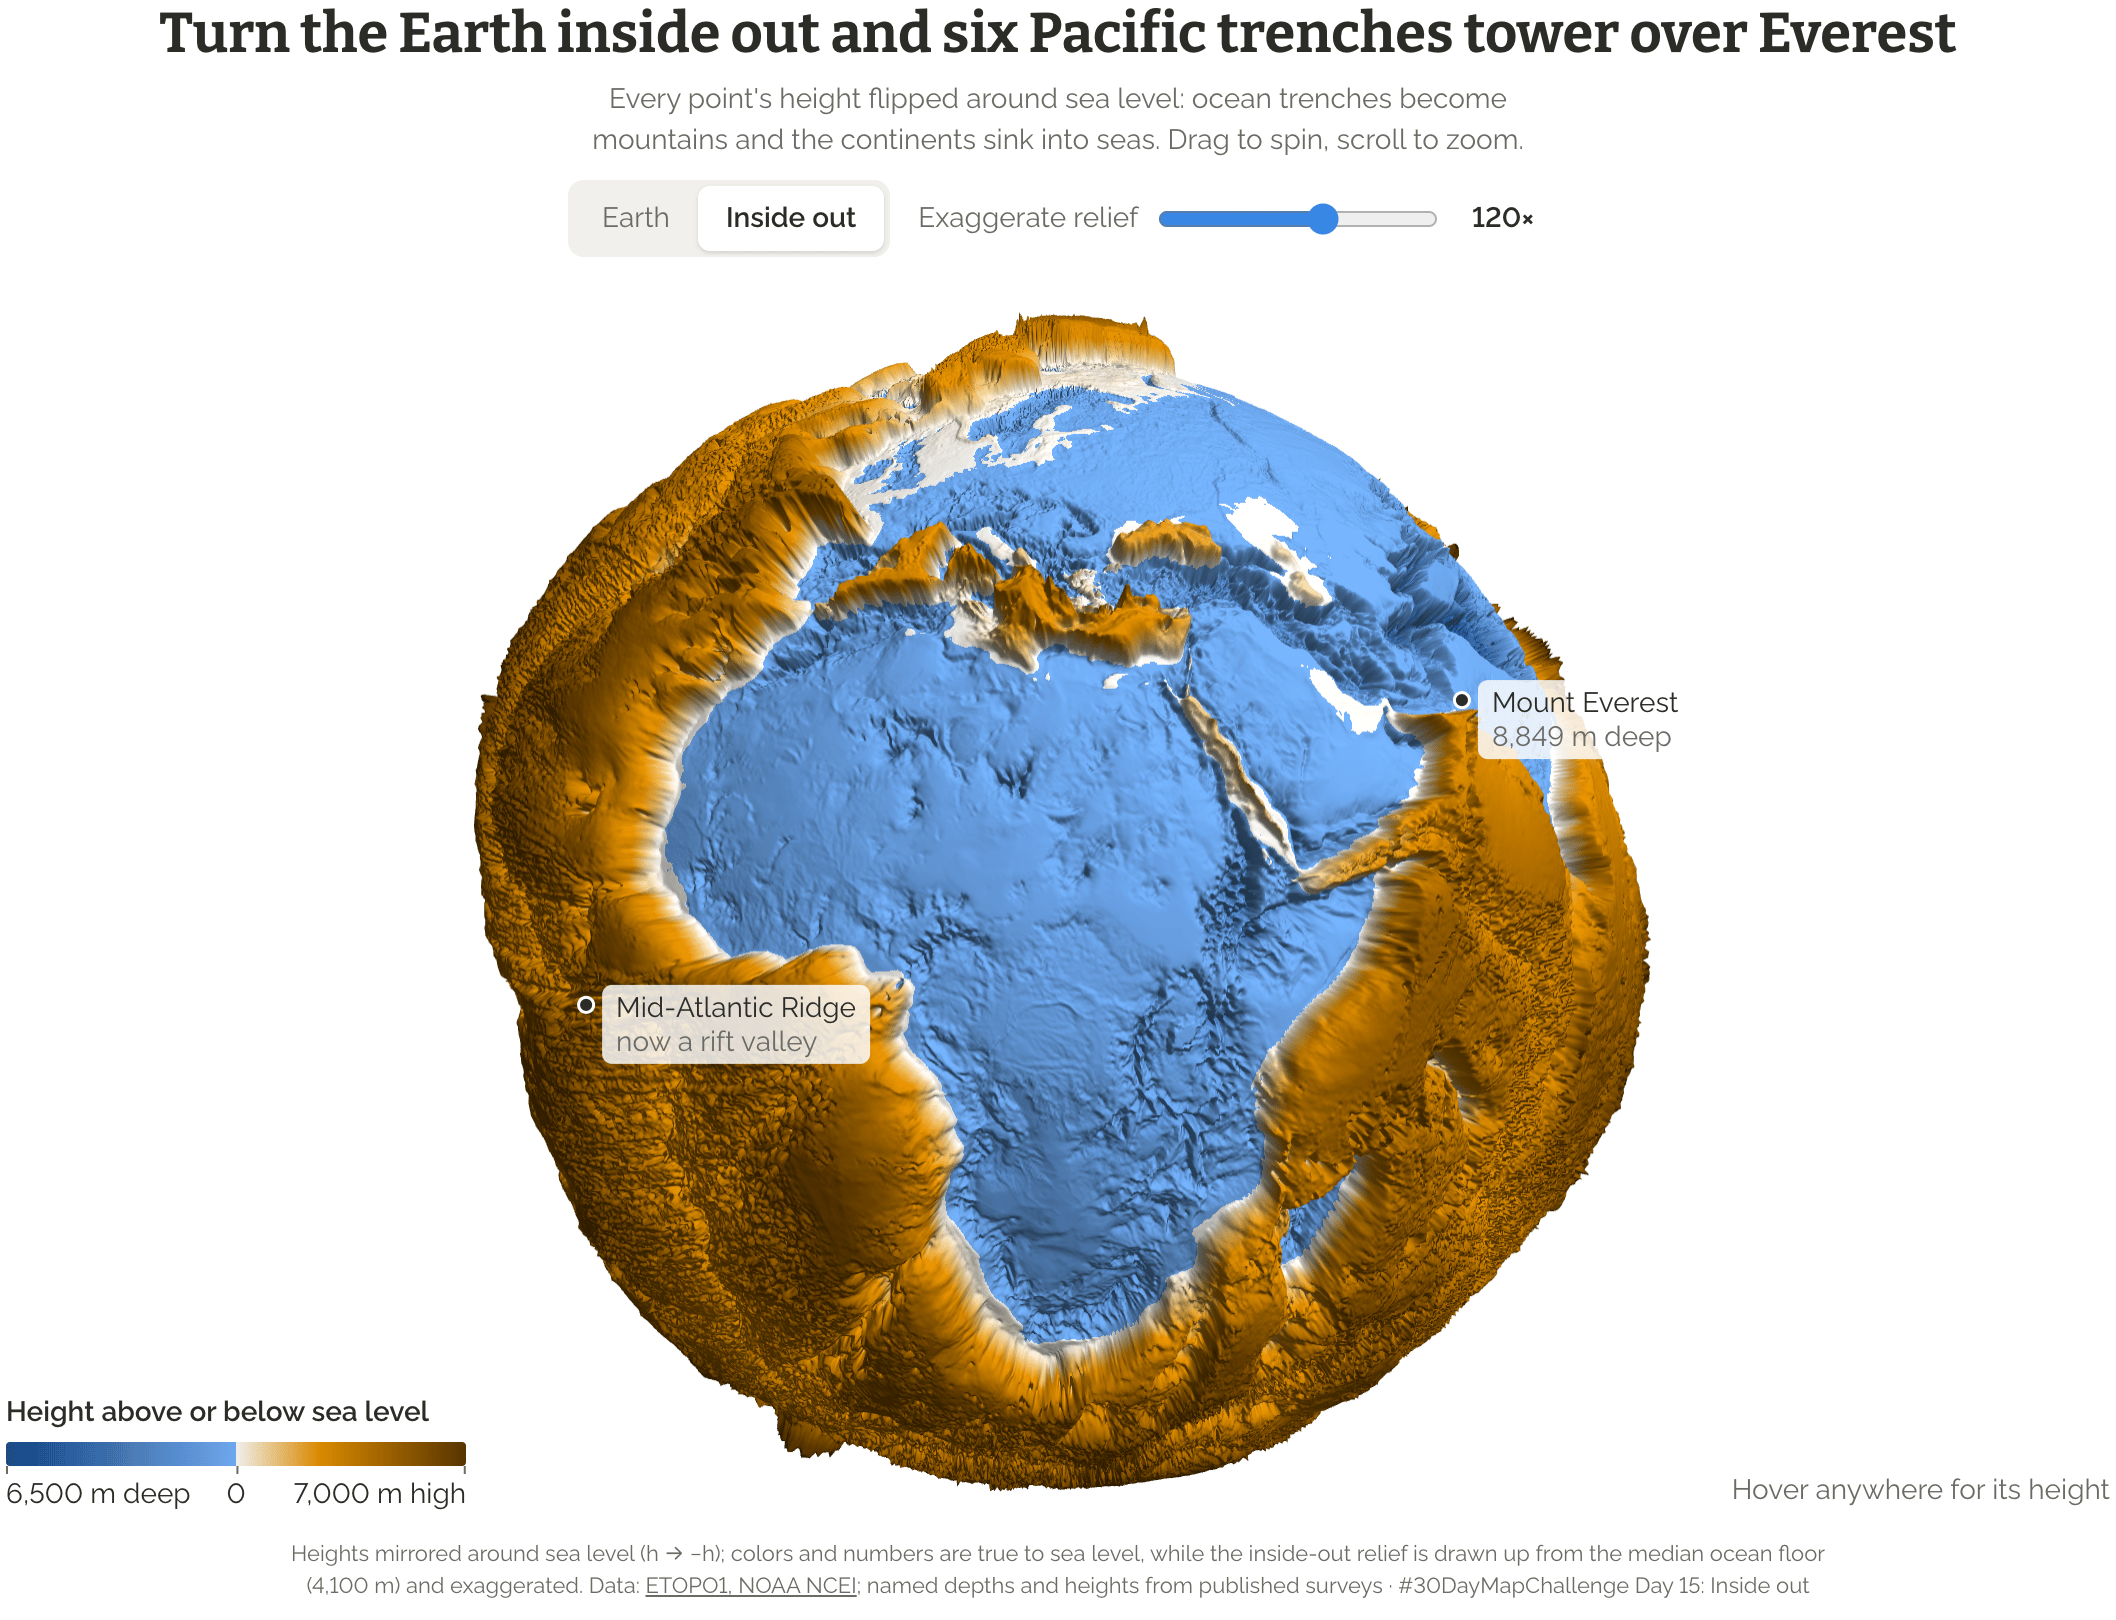
Danielle Carrick:<strong> "</strong>What if we turned the Earth inside out? Day 15 of the <a href="https://www.linkedin.com/search/results/all/?keywords=%2330daymapchallenge&amp;origin=HASH_TAG_FROM_FEED"><strong>#30DayMapChallenge</strong></a> asked for “inside out, upside down,” so I took that literally. I flipped every height on the planet around sea level. Mountains become trenches, oceans become land, and the seafloor becomes a giant plateau. On Inside Out Earth, six ocean trenches are deeper than Everest is tall. Challenger Deep in the Mariana Trench would stand 10,935 m high, about 2 km taller than Everest. And Everest? It becomes an 8,849 m pit," November 16 (<a href="https://www.linkedin.com/posts/daniellecarrick_30daymapchallenge-30daymapchallenge-datavisualization-ugcPost-7527745555545096194-aWIk/?utm_source=share&amp;utm_medium=member_desktop&amp;rcm=ACoAAEk-01sBCowJ89EcV5BWcY4FwVC0aeG9xj0"><strong>LinkedIn</strong></a>, <a href="https://daniellecarrick.github.io/30-day-map-challenge/day15/"><strong>project website</strong></a>)
Danielle Carrick: "What if we turned the Earth inside out? Day 15 of the #30DayMapChallenge asked for “inside out, upside down,” so I took that literally. I flipped every height on the planet around sea level. Mountains become trenches, oceans become land, and the seafloor becomes a giant plateau. On Inside Out Earth, six ocean trenches are deeper than Everest is tall. Challenger Deep in the Mariana Trench would stand 10,935 m high, about 2 km taller than Everest. And Everest? It becomes an 8,849 m pit," November 16 (LinkedIn, project website)
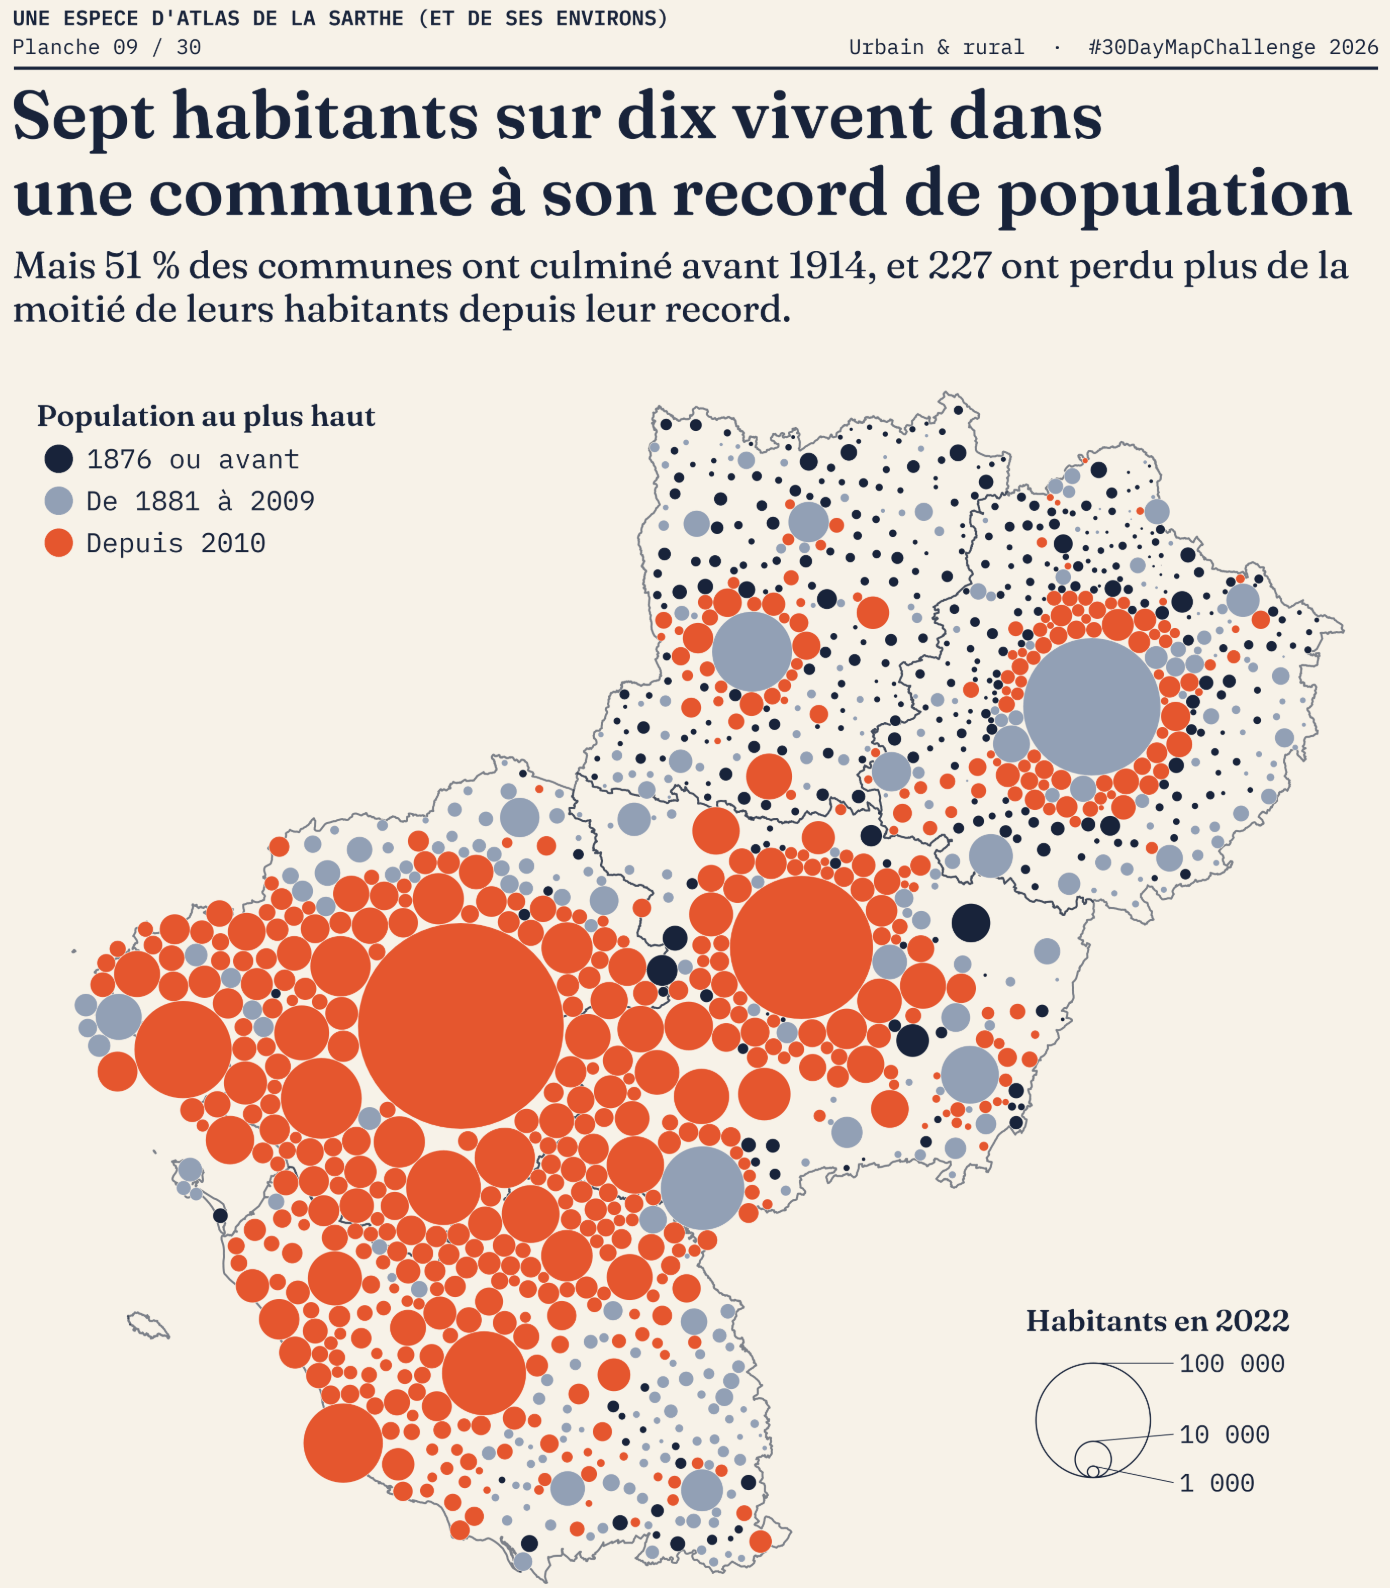
Guillaume Noblet: "#Day09 and #Day10 with an Urban/Rural map and a prompting one #30DayMapChallenge," November 11 (<a href="https://www.linkedin.com/posts/gnoblet_day09-day10-30daymapchallenge-ugcPost-7525885082574700544-IASd/?utm_source=share&amp;utm_medium=member_desktop&amp;rcm=ACoAAEk-01sBCowJ89EcV5BWcY4FwVC0aeG9xj0"><strong>LinkedIn</strong></a>, <a href="https://gnoblet.codeberg.page/30DayMapChallenge/2026/day_09/day_09.html"><strong>project website</strong></a>)
Guillaume Noblet: "#Day09 and #Day10 with an Urban/Rural map and a prompting one #30DayMapChallenge," November 11 (LinkedIn, project website)

Taking a look at a few climate charts we came across last week, the Atlantic Meridional Overturning Circulation (AMOC) plays a vital role in climate regulation, while the El Niño climate phenomenon disturbs global temperatures and polar jet streams. Check out this interactive tool to track Canada's climate progress.
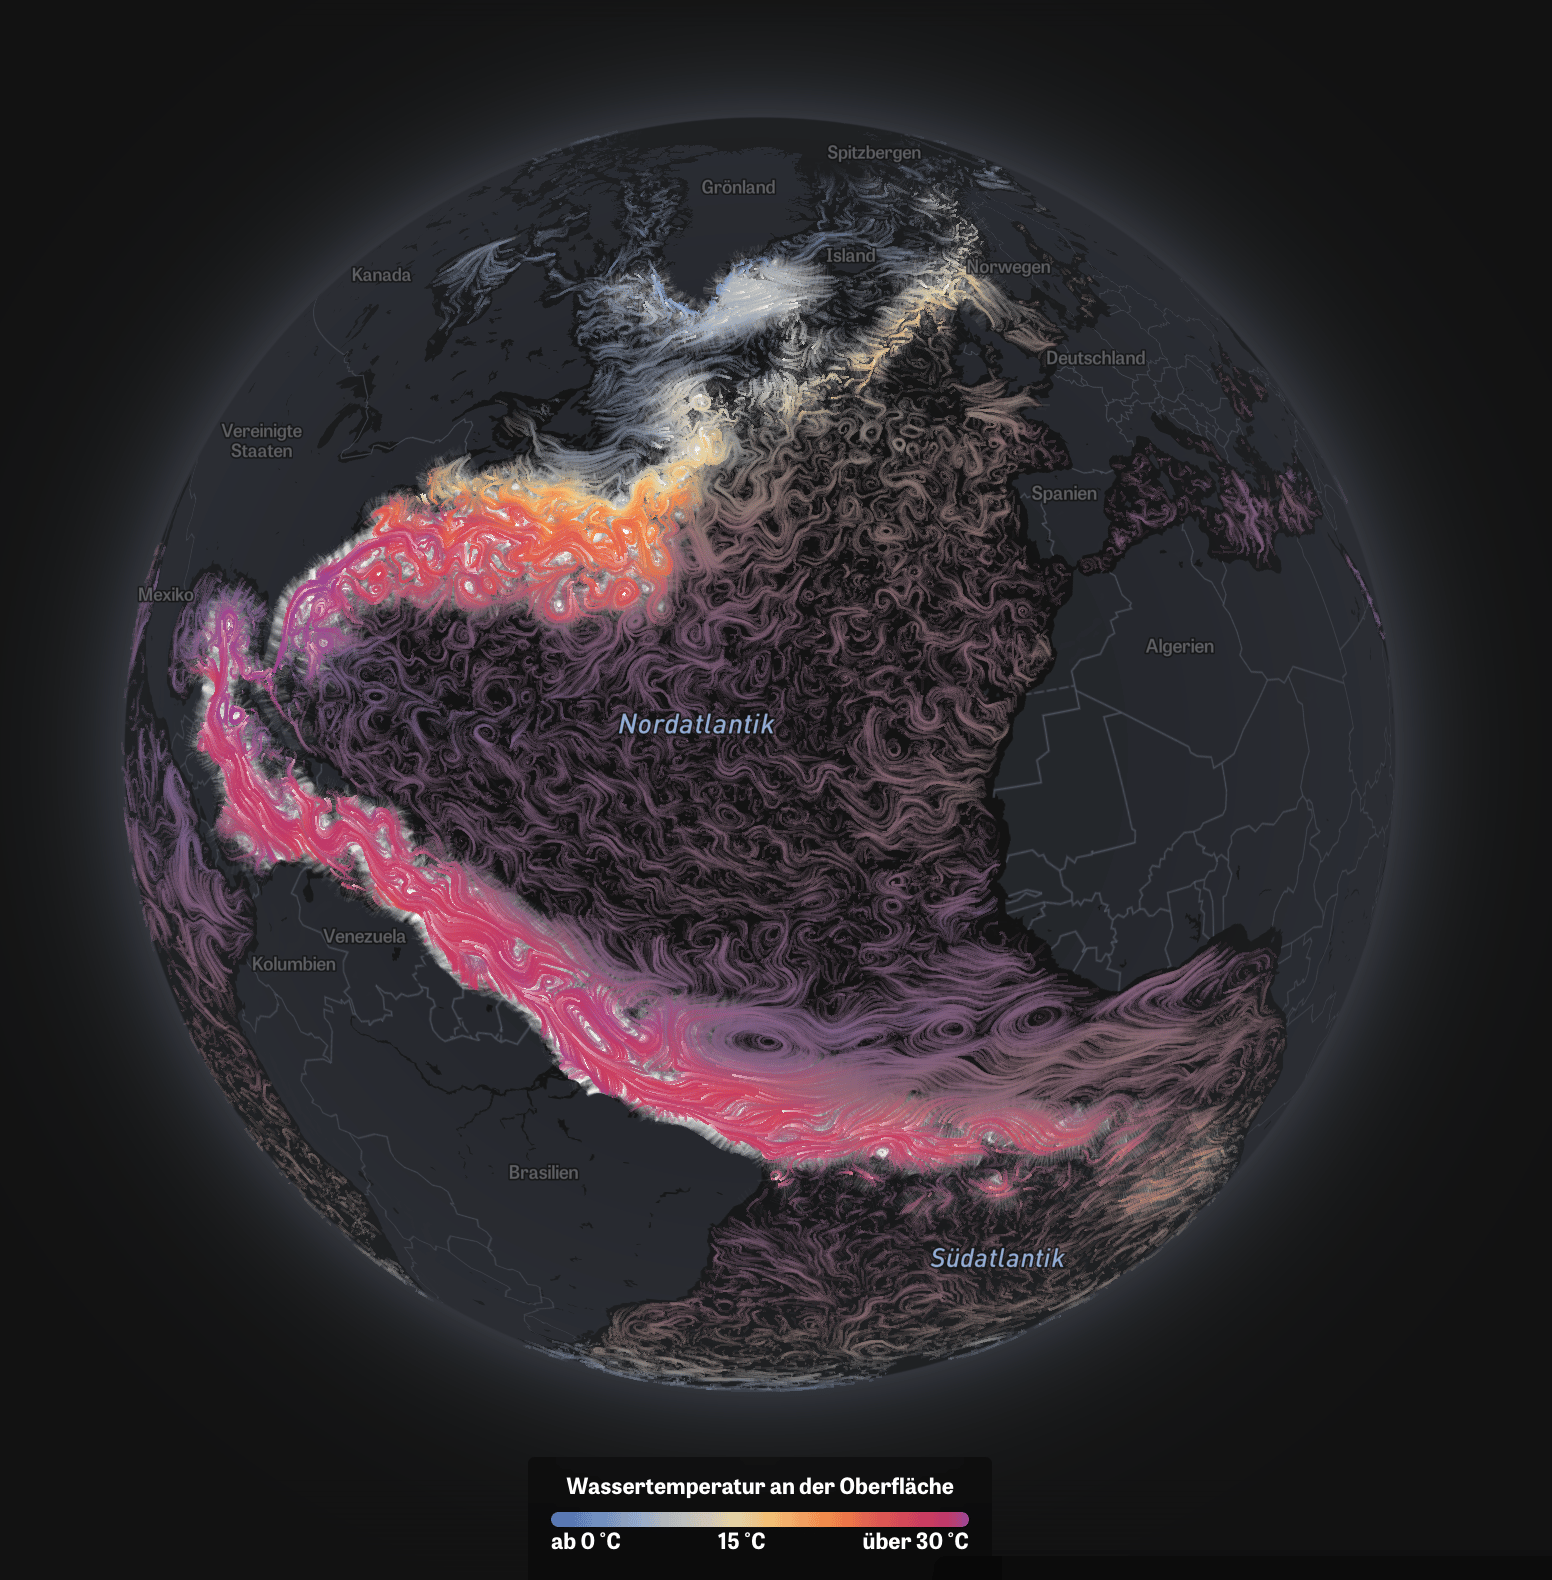
Die Zeit: <a href="https://www.zeit.de/wissenschaft/umwelt/2026-11/amoc-meeresstroemung-klima-europa-wetter"><strong>Von dieser Meeresströmung hängt unser Klima ab</strong></a> [<em>Our climate depends on this ocean current</em>], November 17 <span class="badge">Beautiful visuals</span>
Die Zeit: Von dieser Meeresströmung hängt unser Klima ab [Our climate depends on this ocean current], November 17 Beautiful visuals
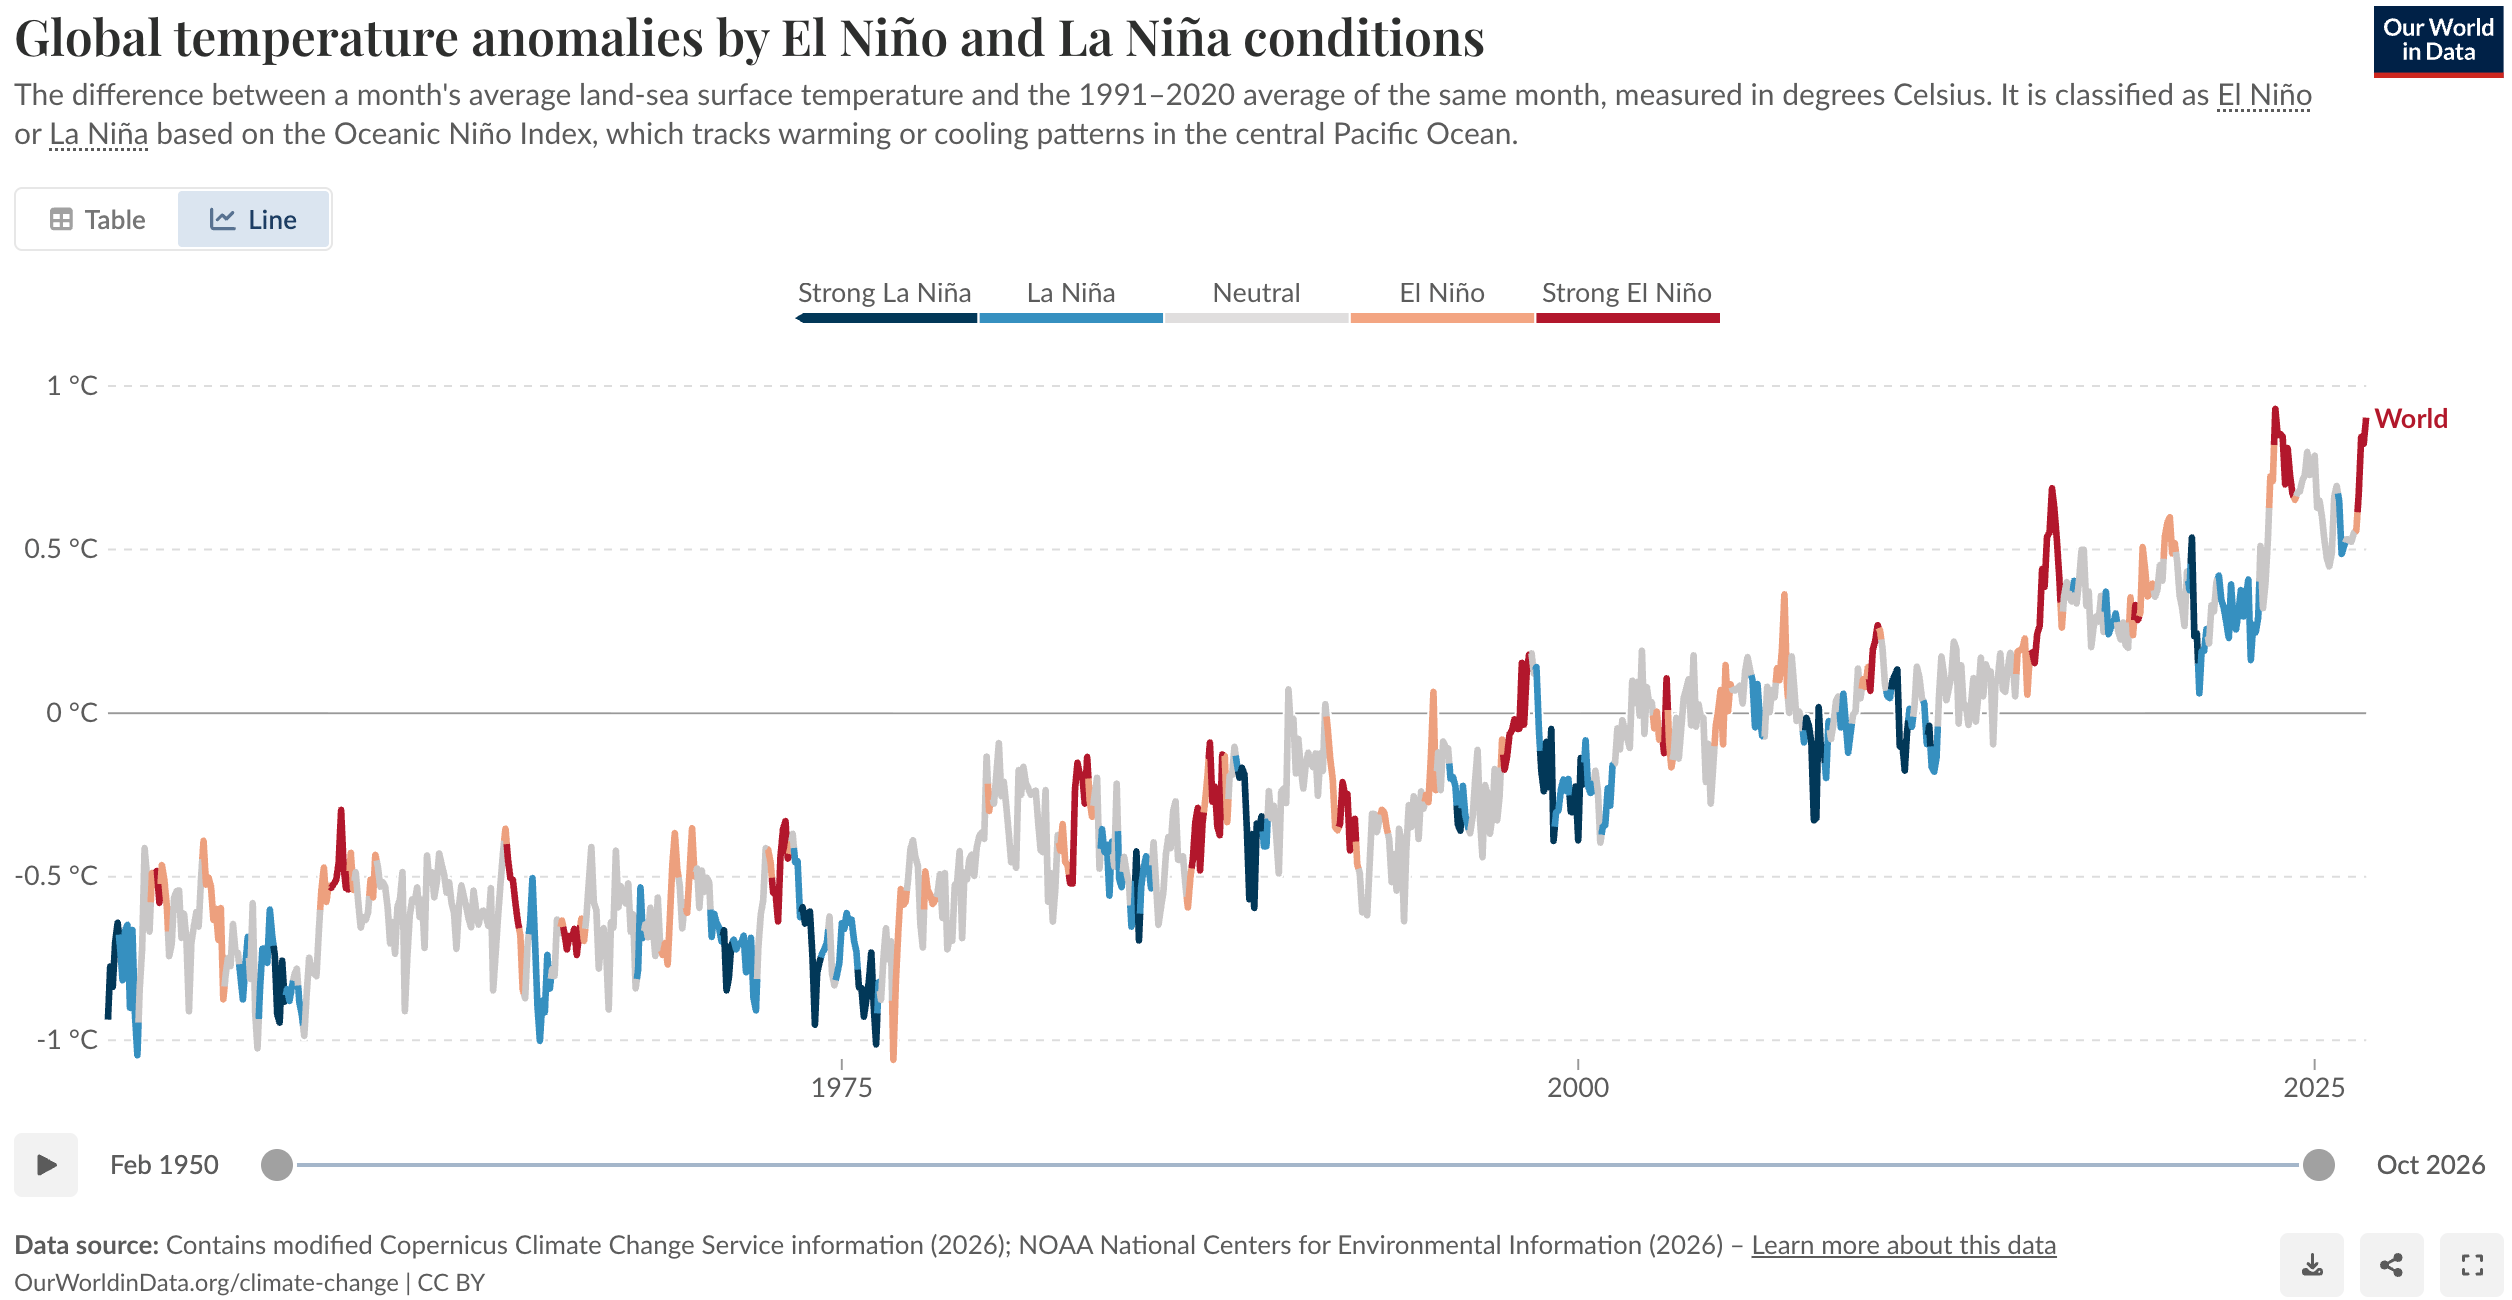
Our World in Data: <a href="https://ourworldindata.org/grapher/global-temperature-anomalies-by-el-nino-la-nina?time=earliest..latest"><strong>Global temperature anomalies by El Niño and La Niña conditions</strong></a>, November 11
Our World in Data: Global temperature anomalies by El Niño and La Niña conditions, November 11
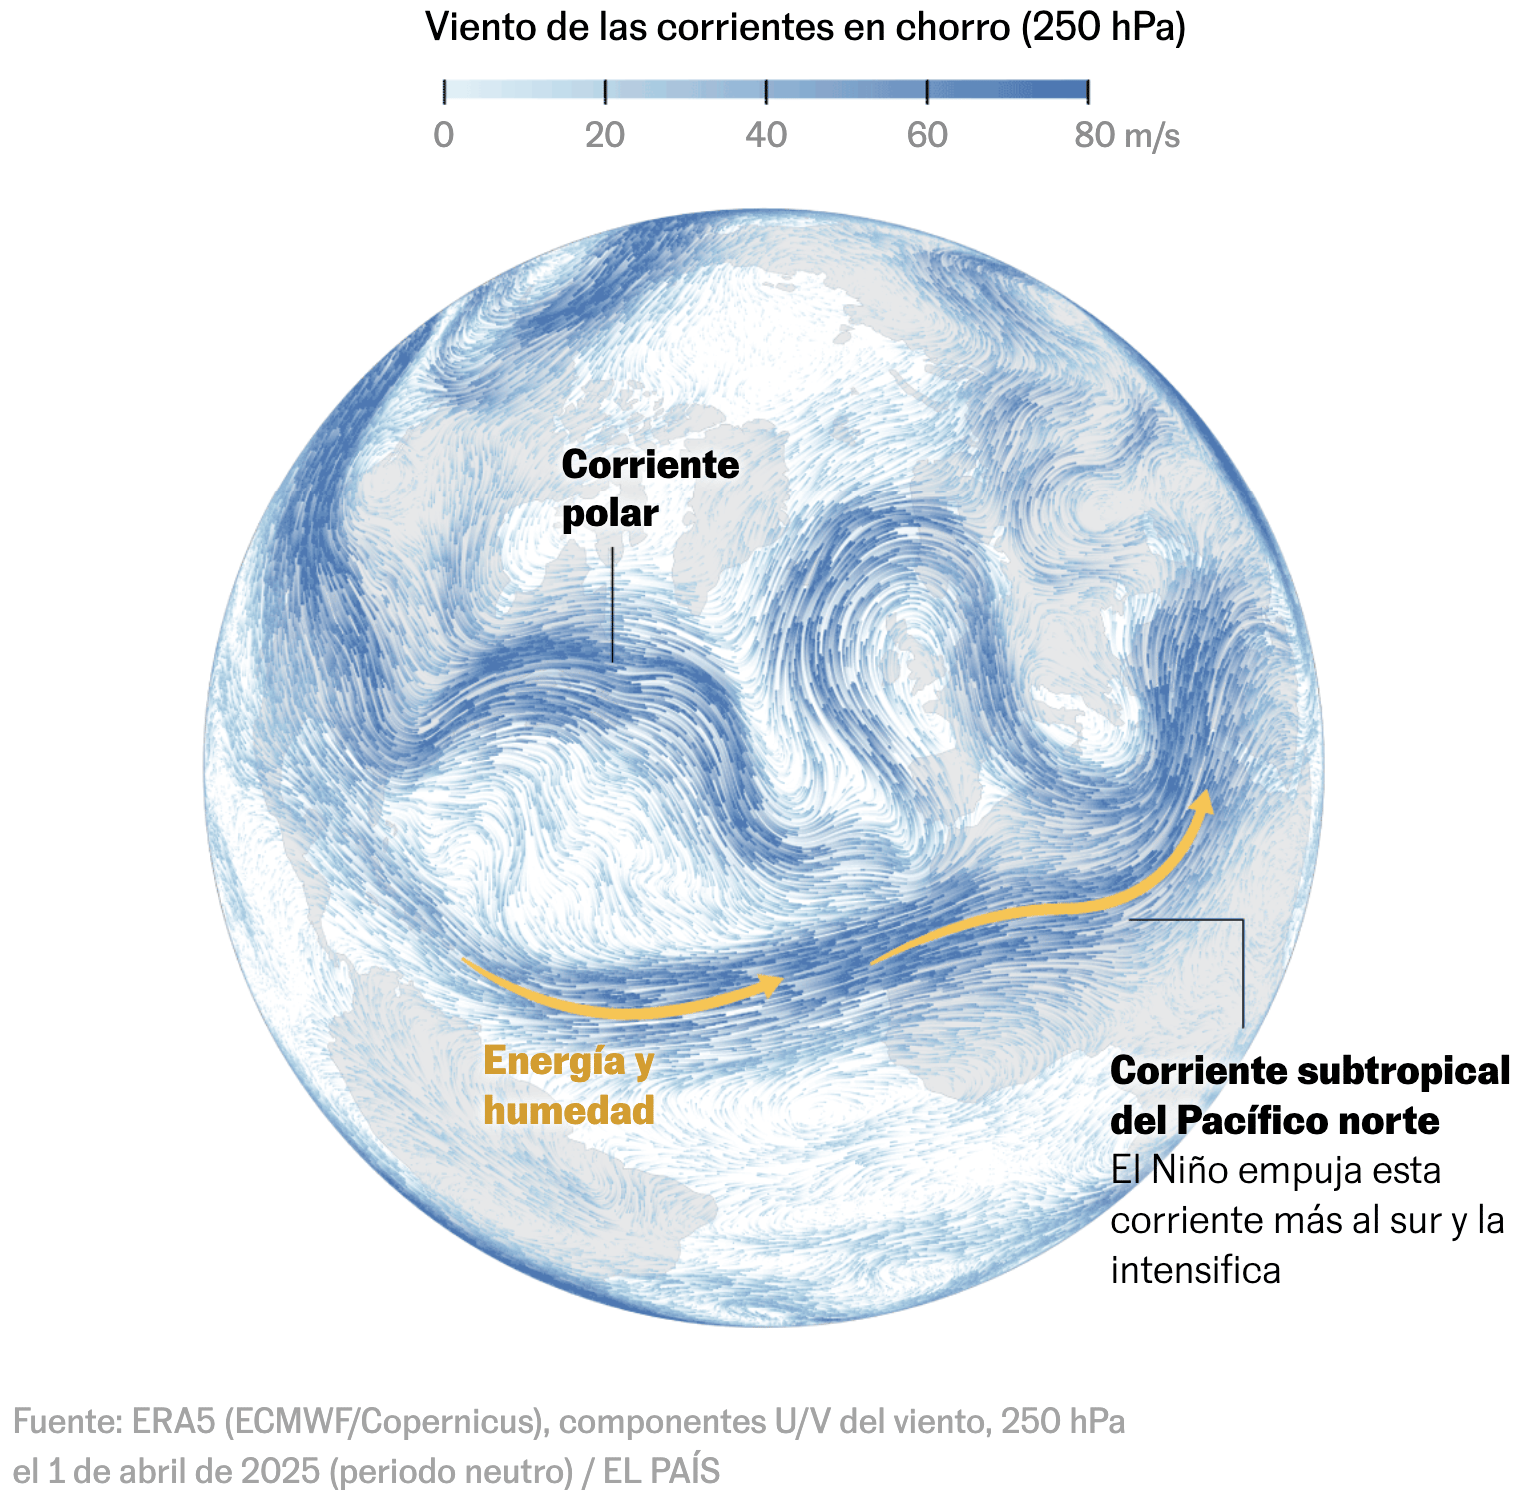
EL PAÍS: <a href="https://elpais.com/clima-y-medio-ambiente/cambio-climatico/2026-11-15/que-es-el-nino-asi-enloquece-el-clima-global-una-pequena-region-tropical-del-pacifico.html"><strong>¿Qué es El Niño? Así enloquece el clima global una pequeña región tropical del Pacífico</strong> </a>[<em>What is El Niño? This is how a small tropical region of the Pacific is throwing the global climate into chaos</em>], November 15 <span class="badge">Check out many more charts on the topic</span>
EL PAÍS: ¿Qué es El Niño? Así enloquece el clima global una pequeña región tropical del Pacífico [What is El Niño? This is how a small tropical region of the Pacific is throwing the global climate into chaos], November 15 Check out many more charts on the topic
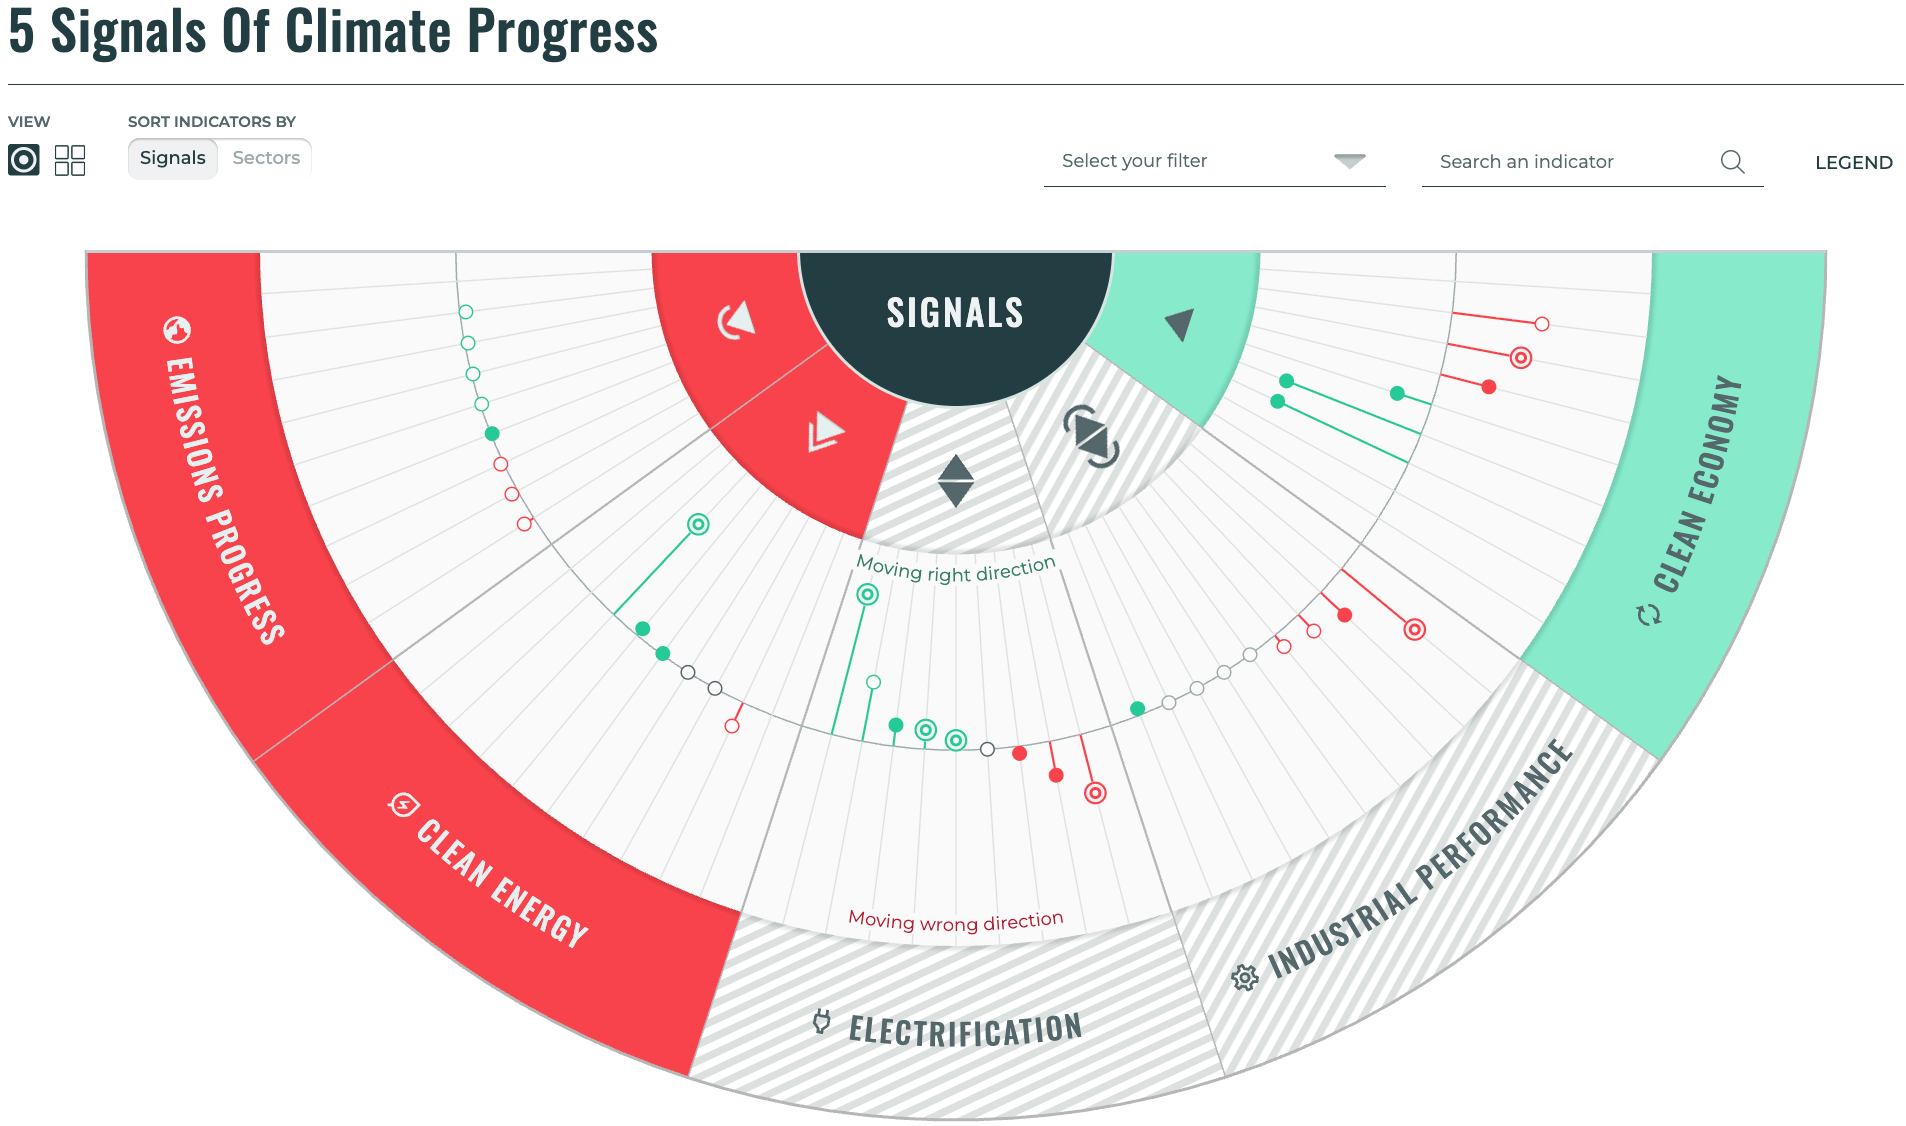
Voilà: Francis Gagnon: "One of our biggest interactive projects is being launched this morning, as part of #COP31 📊 💫  I've no time to get into the details just now, but click on the link below and see the amazing work of the Climate Institute. In short, it shows the future impact of the current climate policies in Canada," November 12 (<a href="https://bsky.app/profile/chezvoila.com/post/3n24l2tkfvc2r"><strong>Bluesky</strong></a>,<a href="https://climateprogress.ca/en"> <strong>project website</strong></a>)
Voilà: Francis Gagnon: "One of our biggest interactive projects is being launched this morning, as part of #COP31 📊 💫 I've no time to get into the details just now, but click on the link below and see the amazing work of the Climate Institute. In short, it shows the future impact of the current climate policies in Canada," November 12 (Bluesky, project website)

Similarly, on the topic of environmental harms, we found charts showing an increase in sunshine and low rainfall in Switzerland, carbon emissions from U.S. data centers, the export of toxic pesticides, and limits on CO₂ emissions.
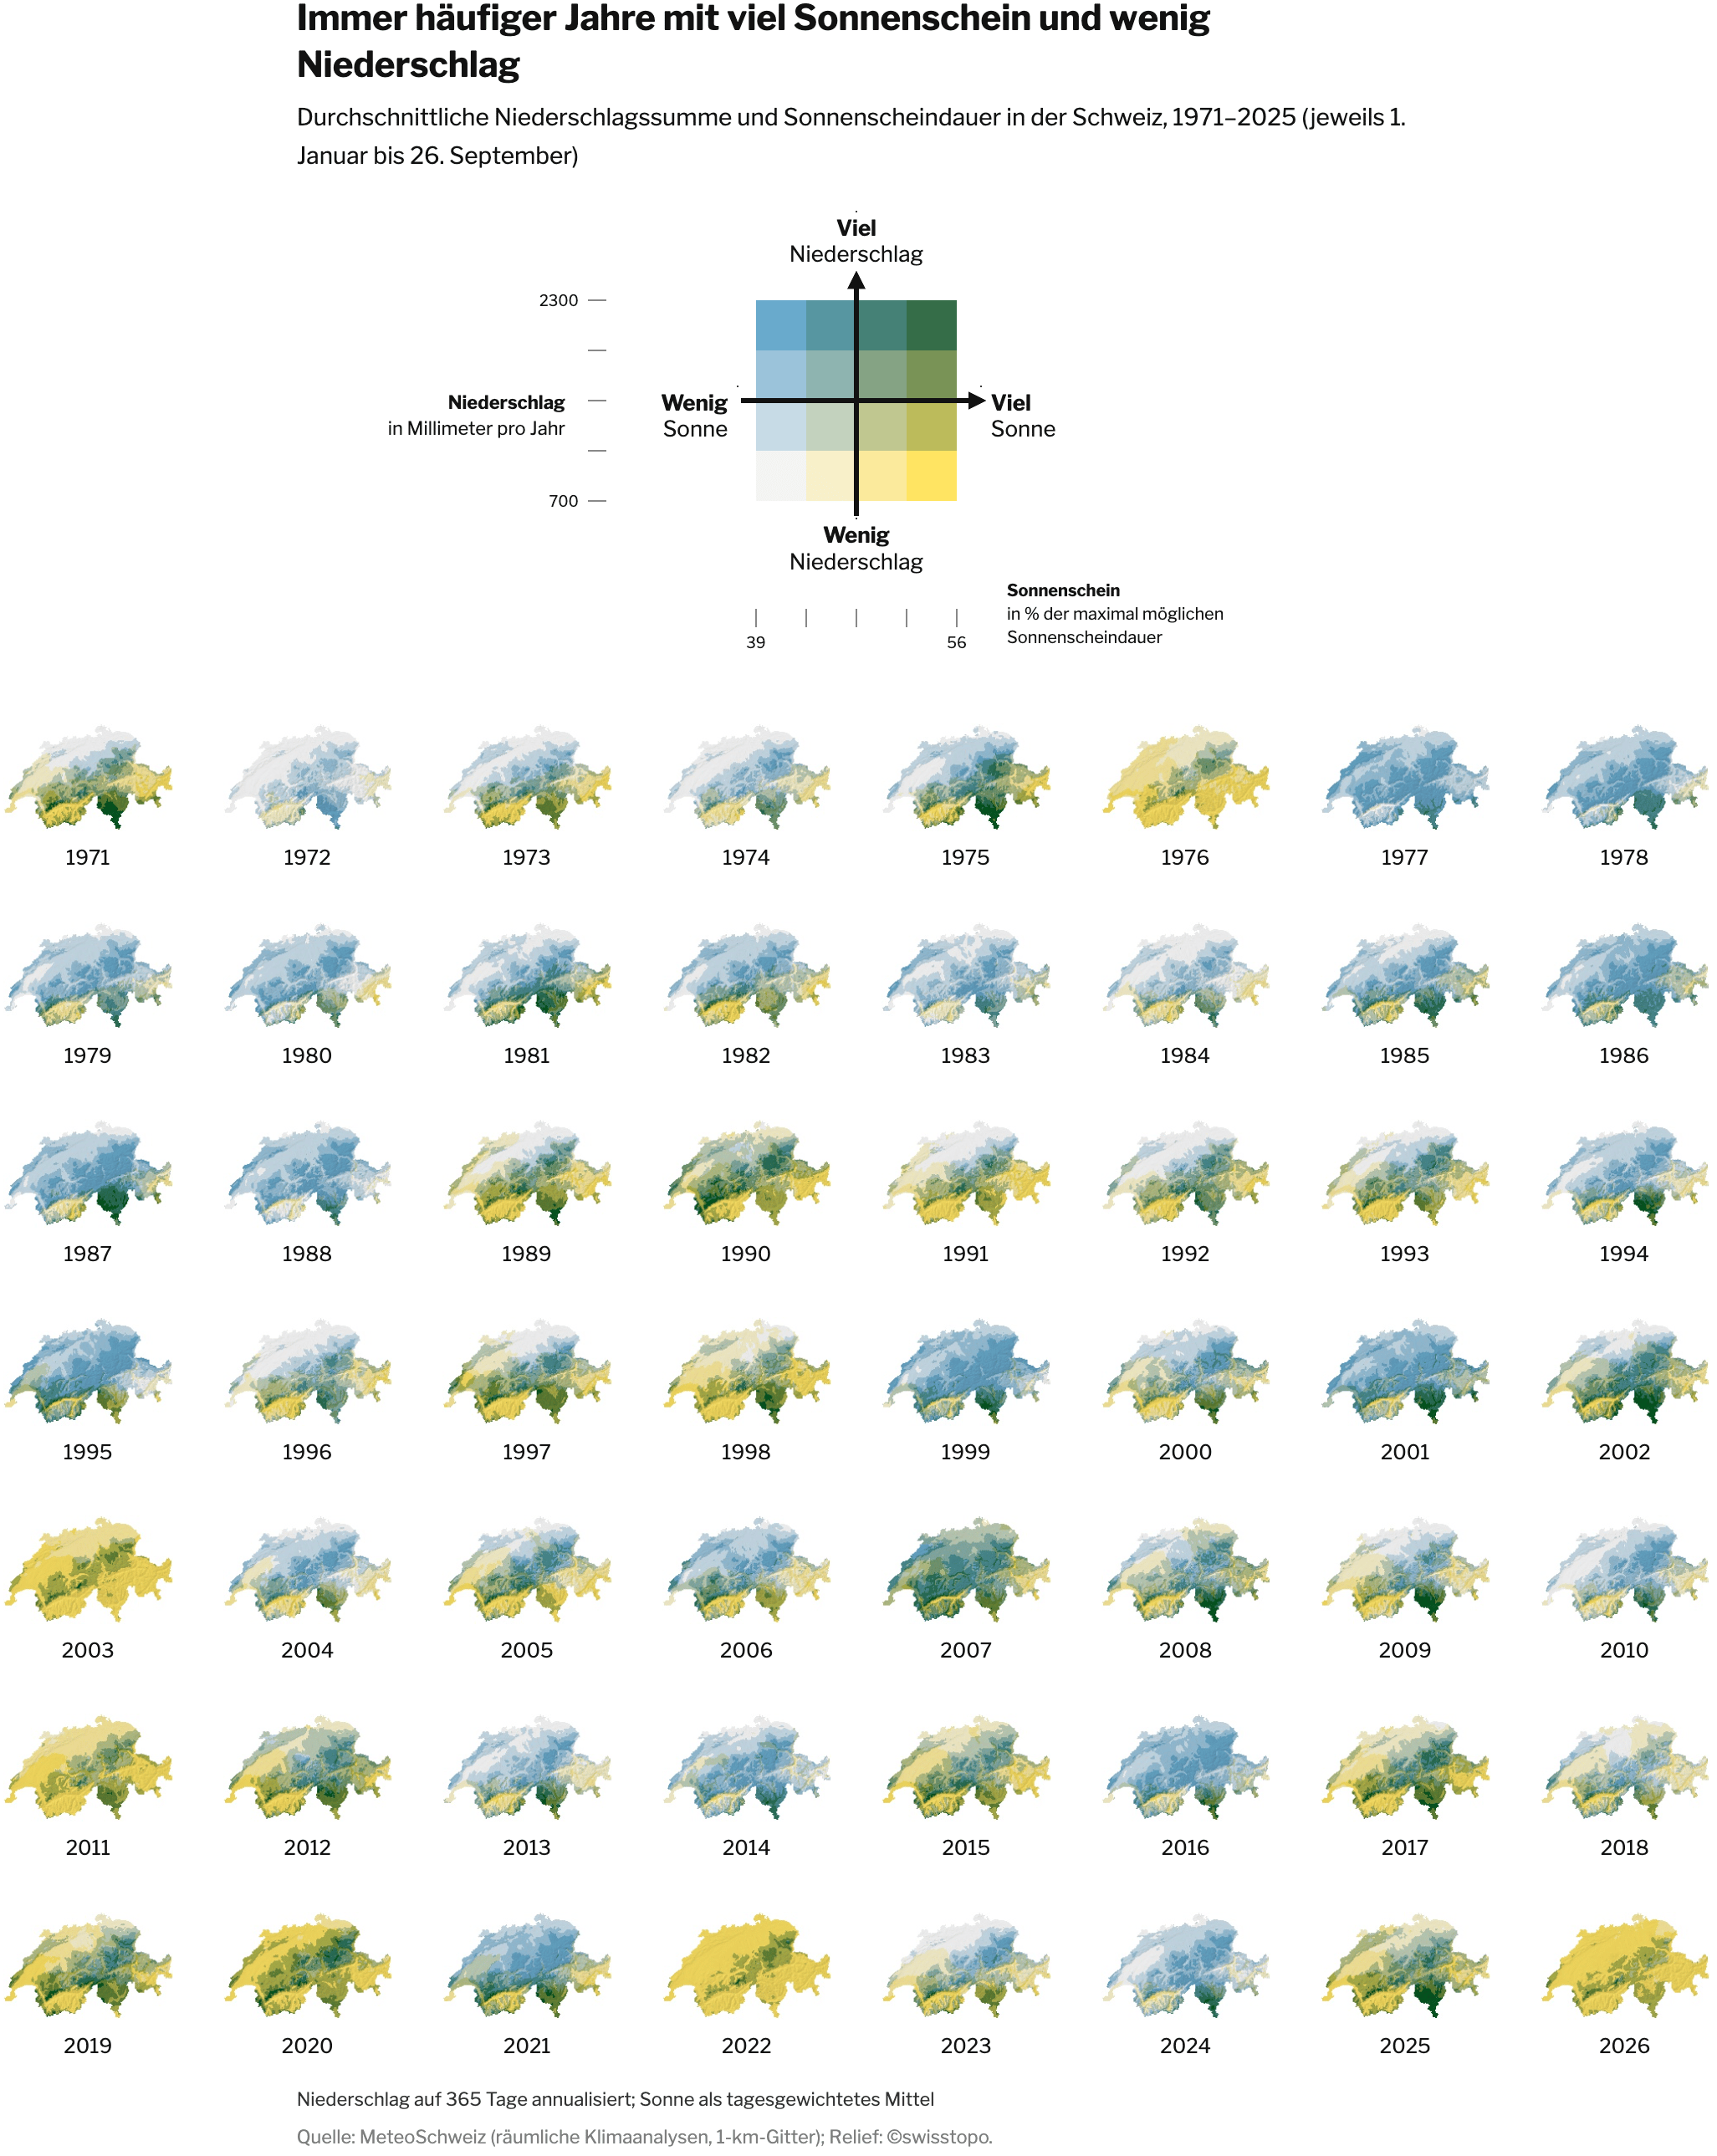

Tages-Anzeiger: <a href="https://www.tagesanzeiger.ch/wetter-so-viel-regen-und-sonne-hat-ihre-gemeinde-923682827825"><strong>Grauer November: So wenig Sonne hat Ihre Gemeinde im Vergleich</strong></a> [<em>Chart title: Years with plenty of sunshine and little rainfall are becoming increasingly frequent</em>], November 11
Tages-Anzeiger: Grauer November: So wenig Sonne hat Ihre Gemeinde im Vergleich [Chart title: Years with plenty of sunshine and little rainfall are becoming increasingly frequent], November 11
The New York Times: <a href="https://www.nytimes.com/interactive/2026/11/16/climate/ai-data-center-pollution-carbon-emissions.html"><strong>Carbon Emissions of Biggest U.S. Data Centers Already Rival Entire Countries, Study Reveals</strong></a>, November 16
The New York Times: Carbon Emissions of Biggest U.S. Data Centers Already Rival Entire Countries, Study Reveals, November 16
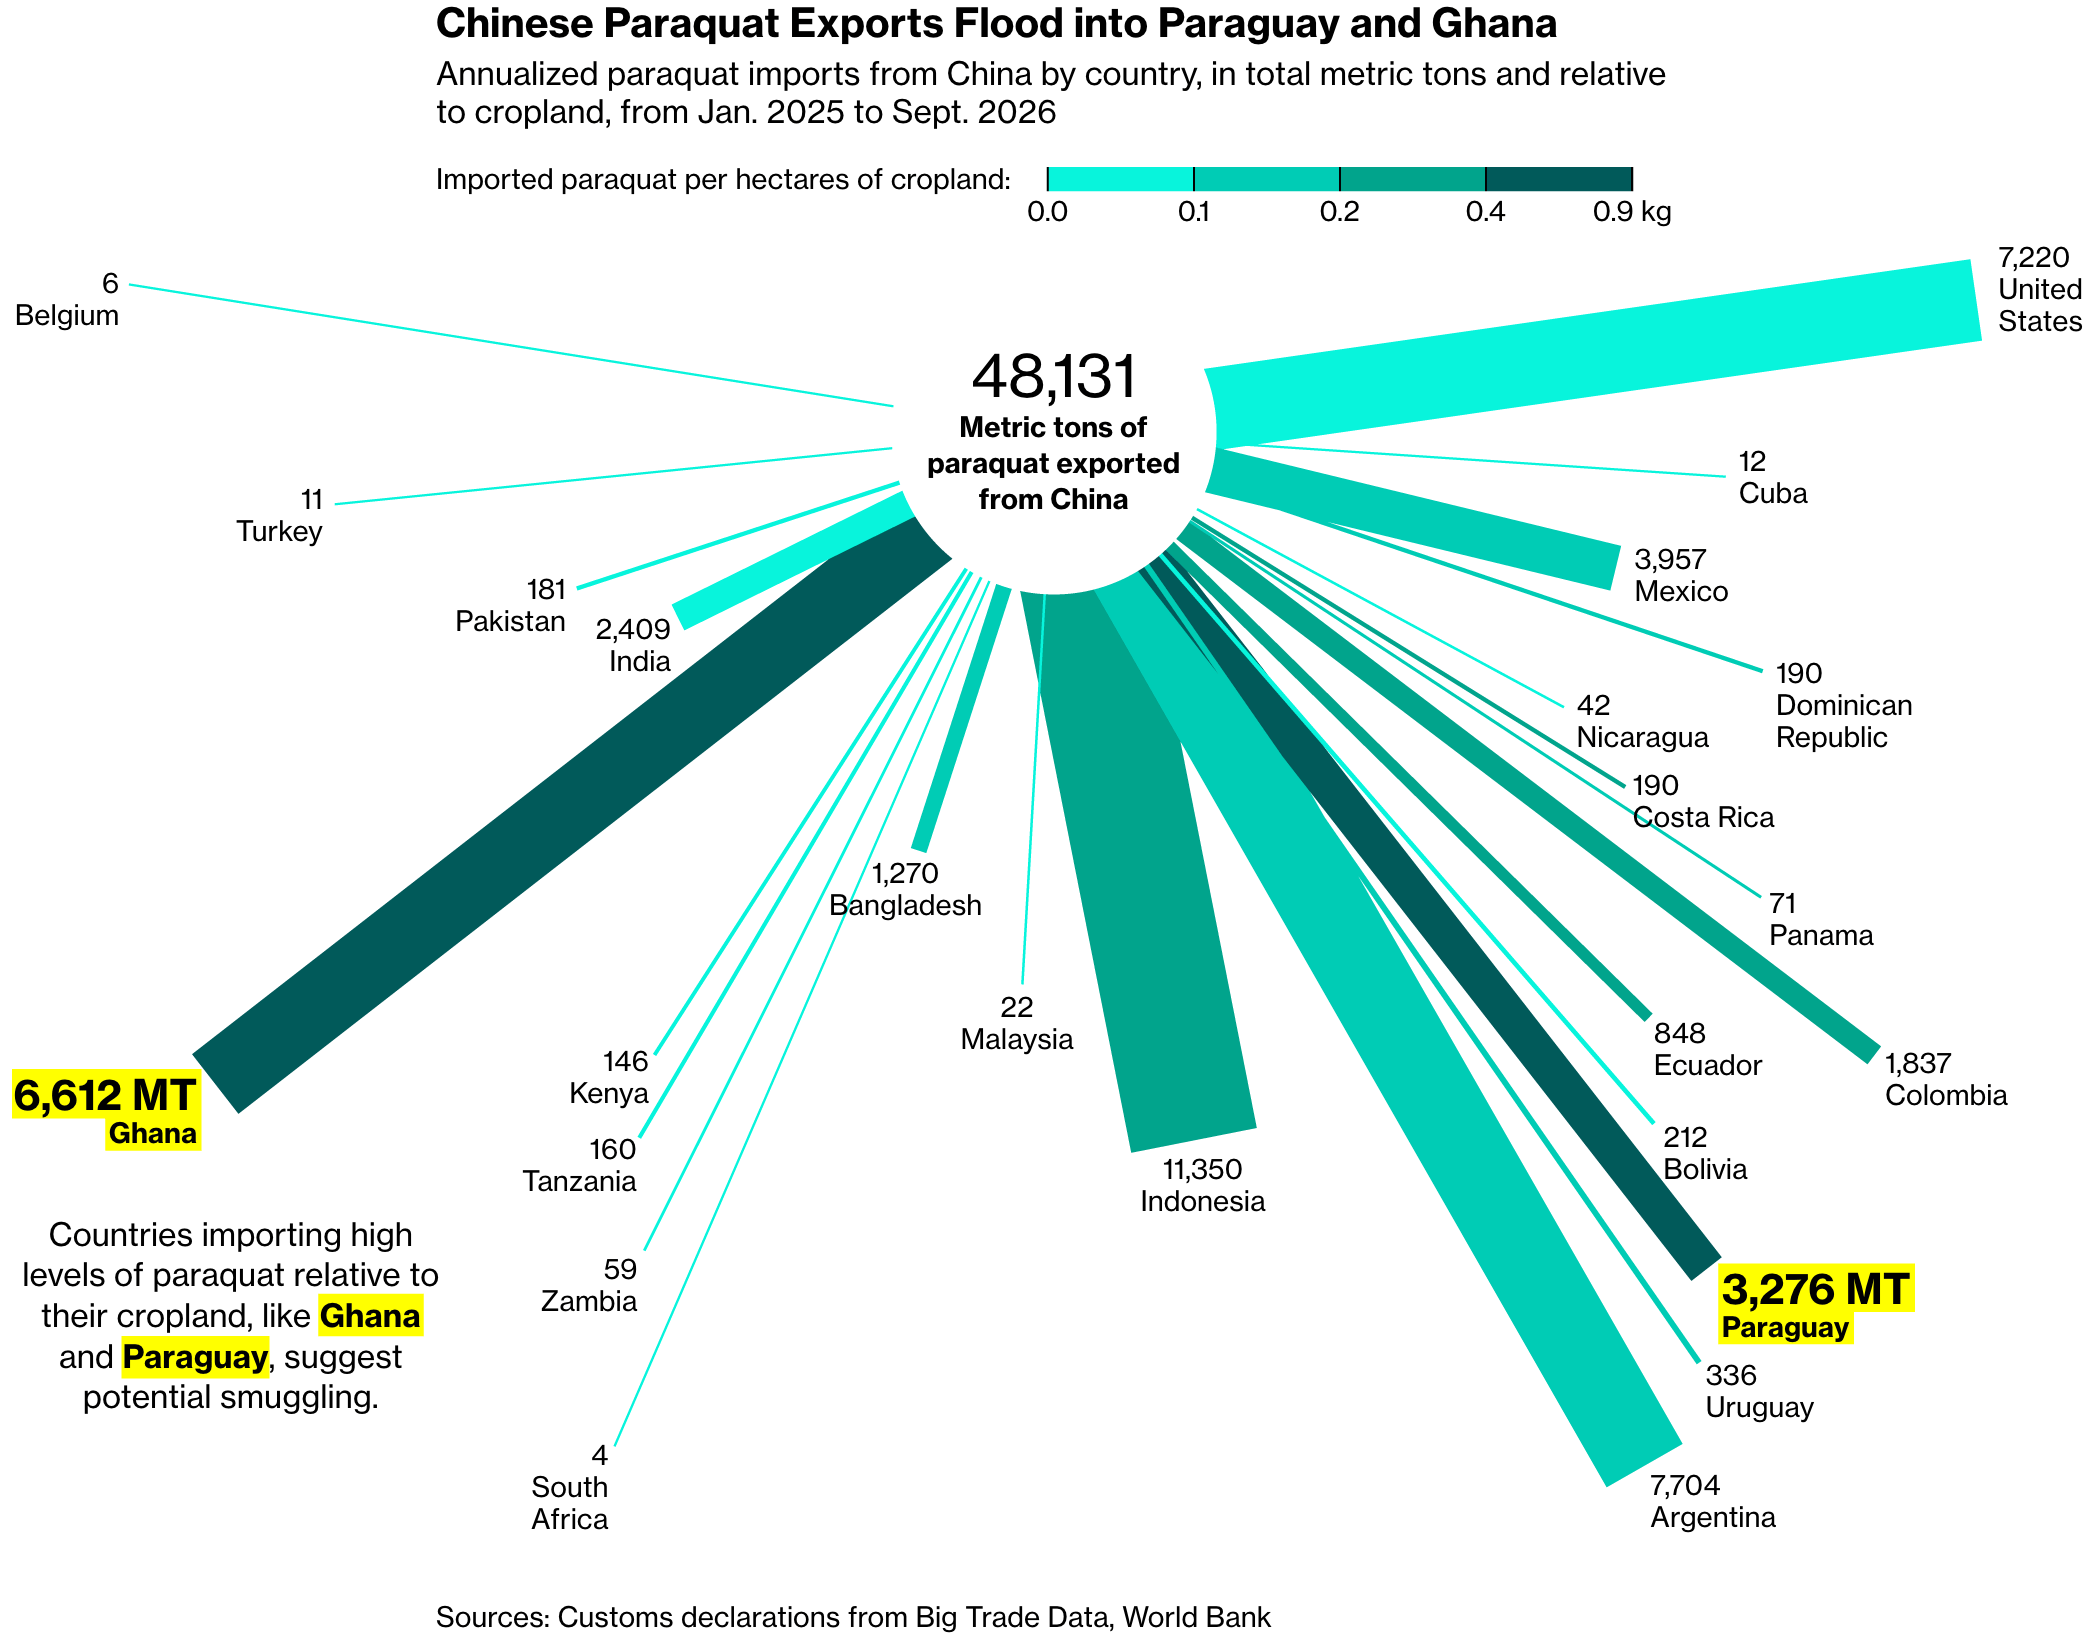
Bloomberg: <a href="https://www.bloomberg.com/features/2026-banned-chinese-pesticides-smuggling-brazil/?srnd=undefined"><strong>The Poison Pipeline</strong></a>, November 11
Bloomberg: The Poison Pipeline, November 11
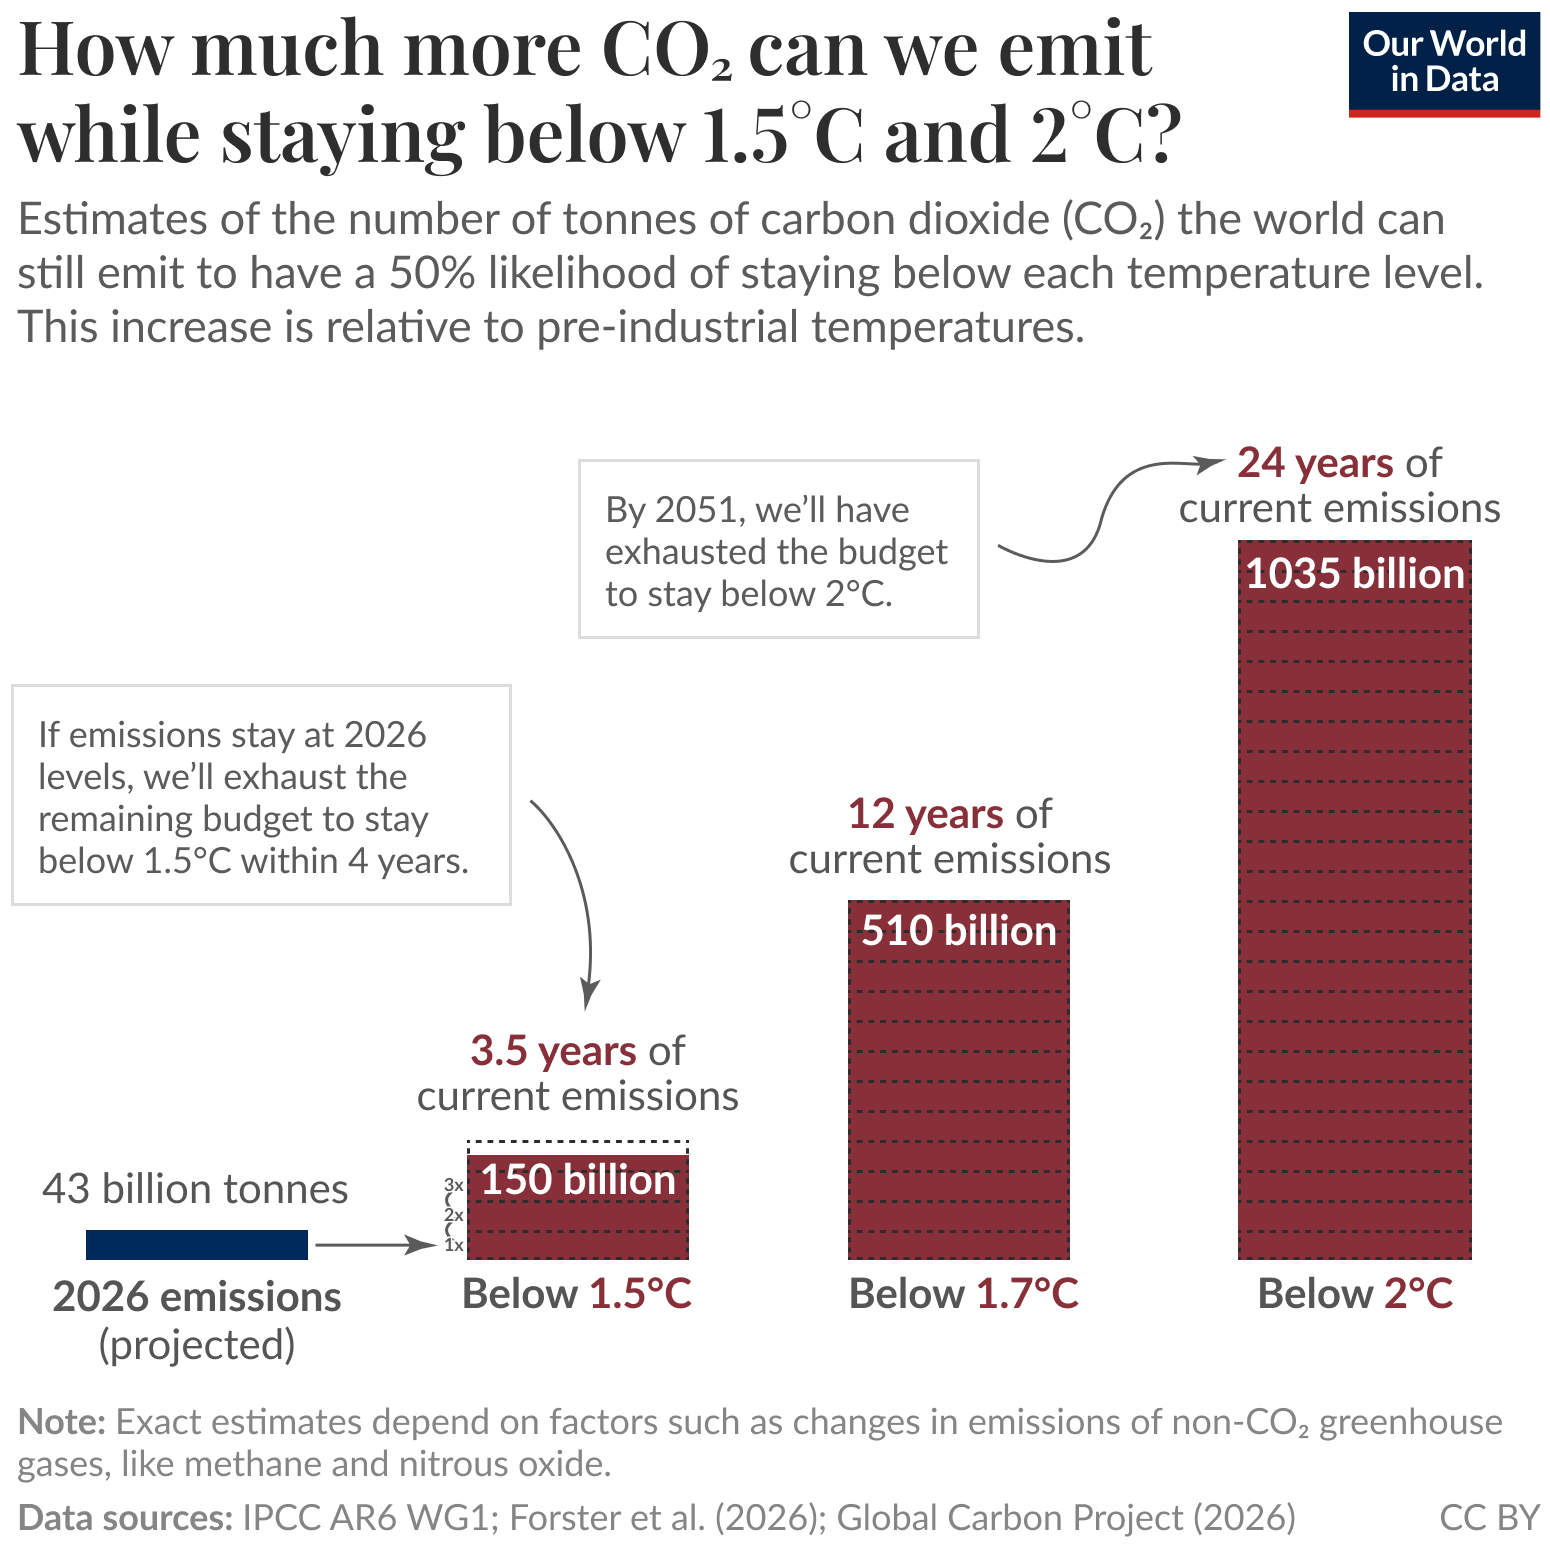
Our World in Data: <a href="https://ourworldindata.org/data-insights/how-much-co2-can-the-world-emit-while-limiting-global-temperature-rise"><strong>How much CO2 can the world emit while limiting global temperature rise?</strong></a>, November 12
Our World in Data: How much CO2 can the world emit while limiting global temperature rise?, November 12

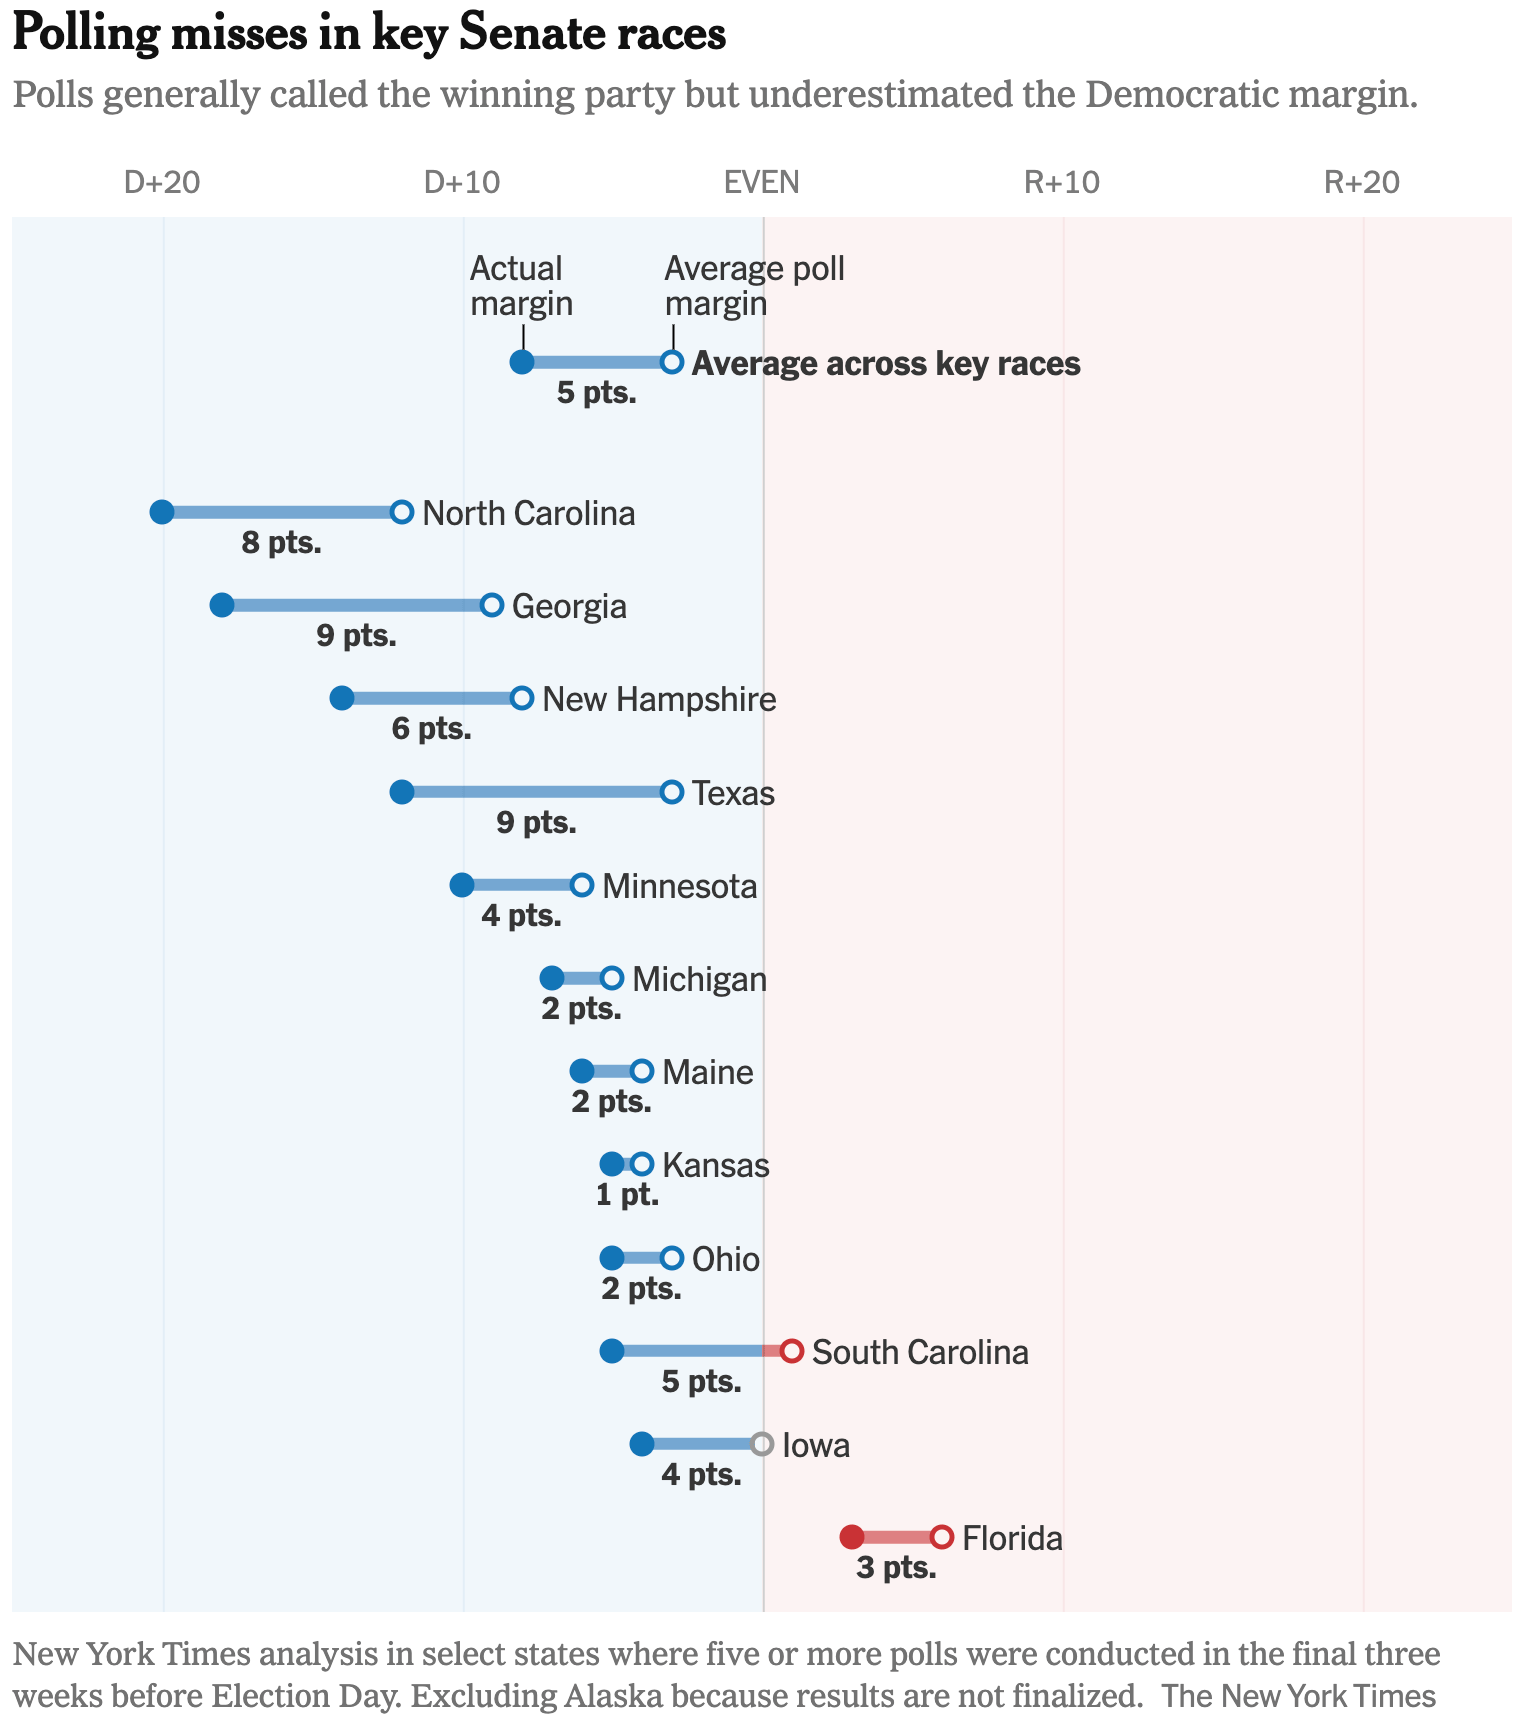
As the final results of the 2026 U.S. midterm elections are rolling in, charts are showcasing vote margins, polling misses, turnout gaps, leading Democrats, and potential advantages in the 2028 elections.
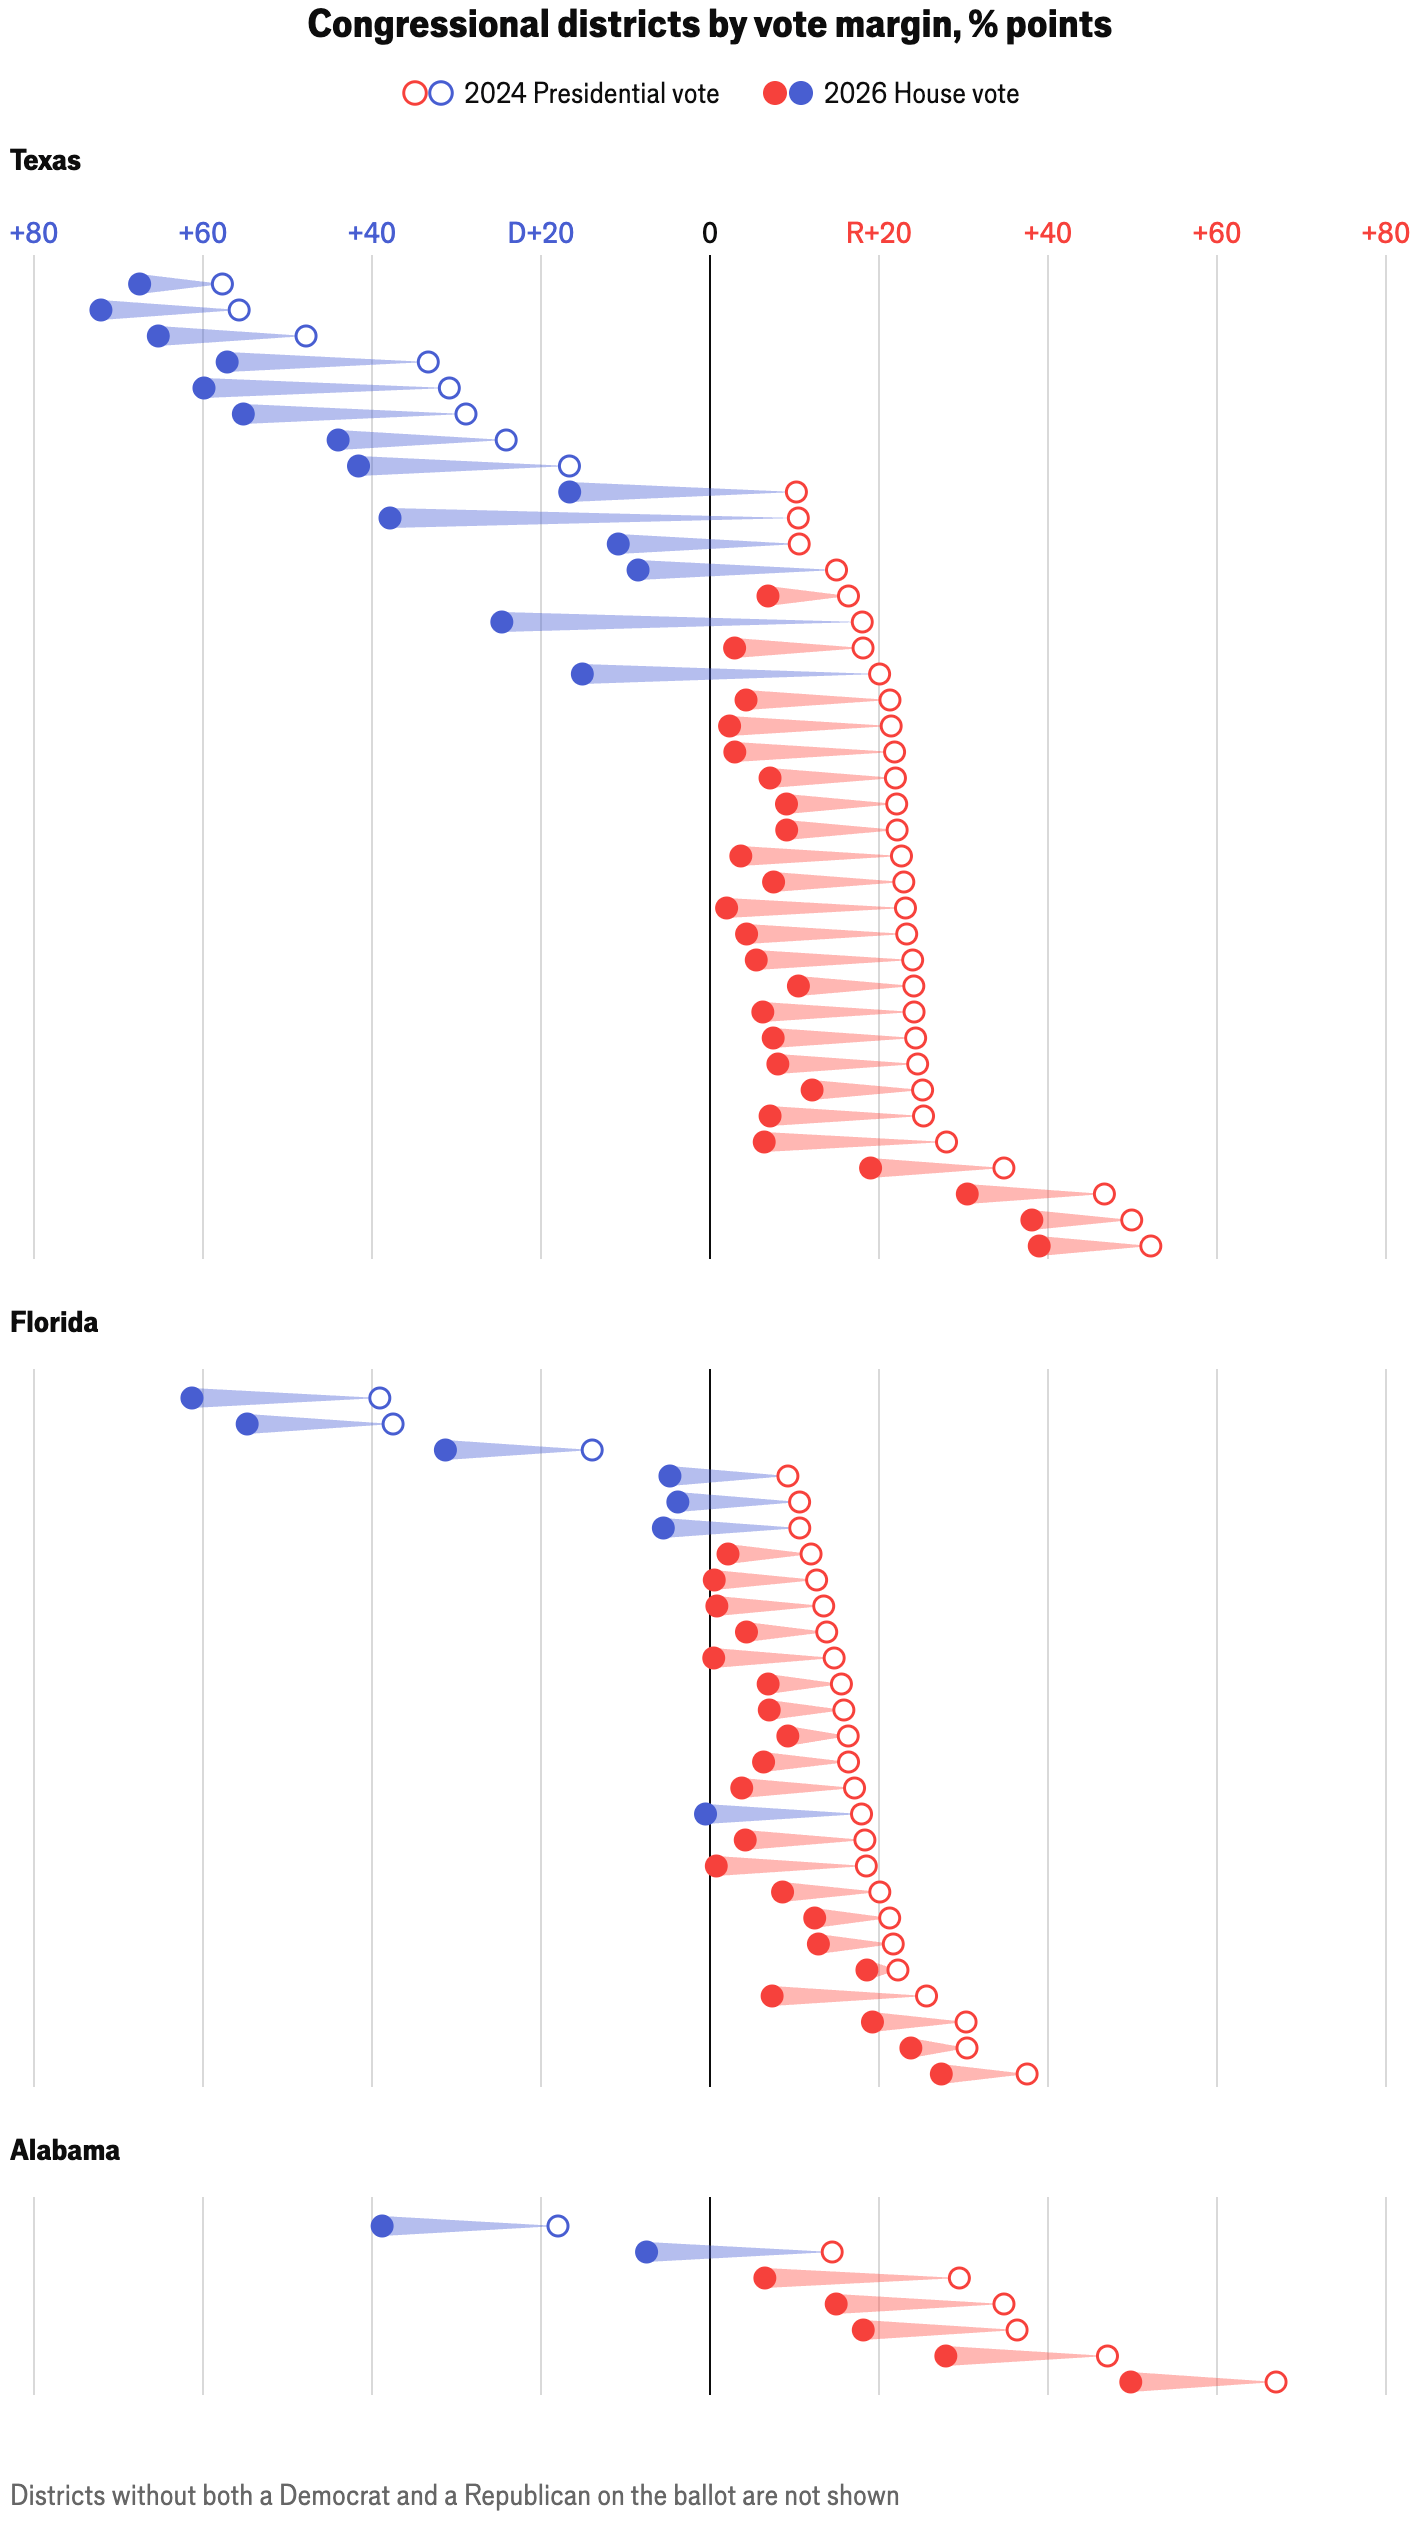
The Economist: <a href="https://www.economist.com/interactive/graphic-detail/2026/11/13/how-badly-did-republican-gerrymandering-fail"><strong>How badly did Republican gerrymandering fail?</strong></a>, November 13
The Economist: How badly did Republican gerrymandering fail?, November 13
The New York Times: <a href="https://www.nytimes.com/2026/11/12/us/politics/poll-error-democrats-midterms.html"><strong>Polls Found Strength for Democrats, but Still Missed Badly</strong></a>, November 12
The New York Times: Polls Found Strength for Democrats, but Still Missed Badly, November 12
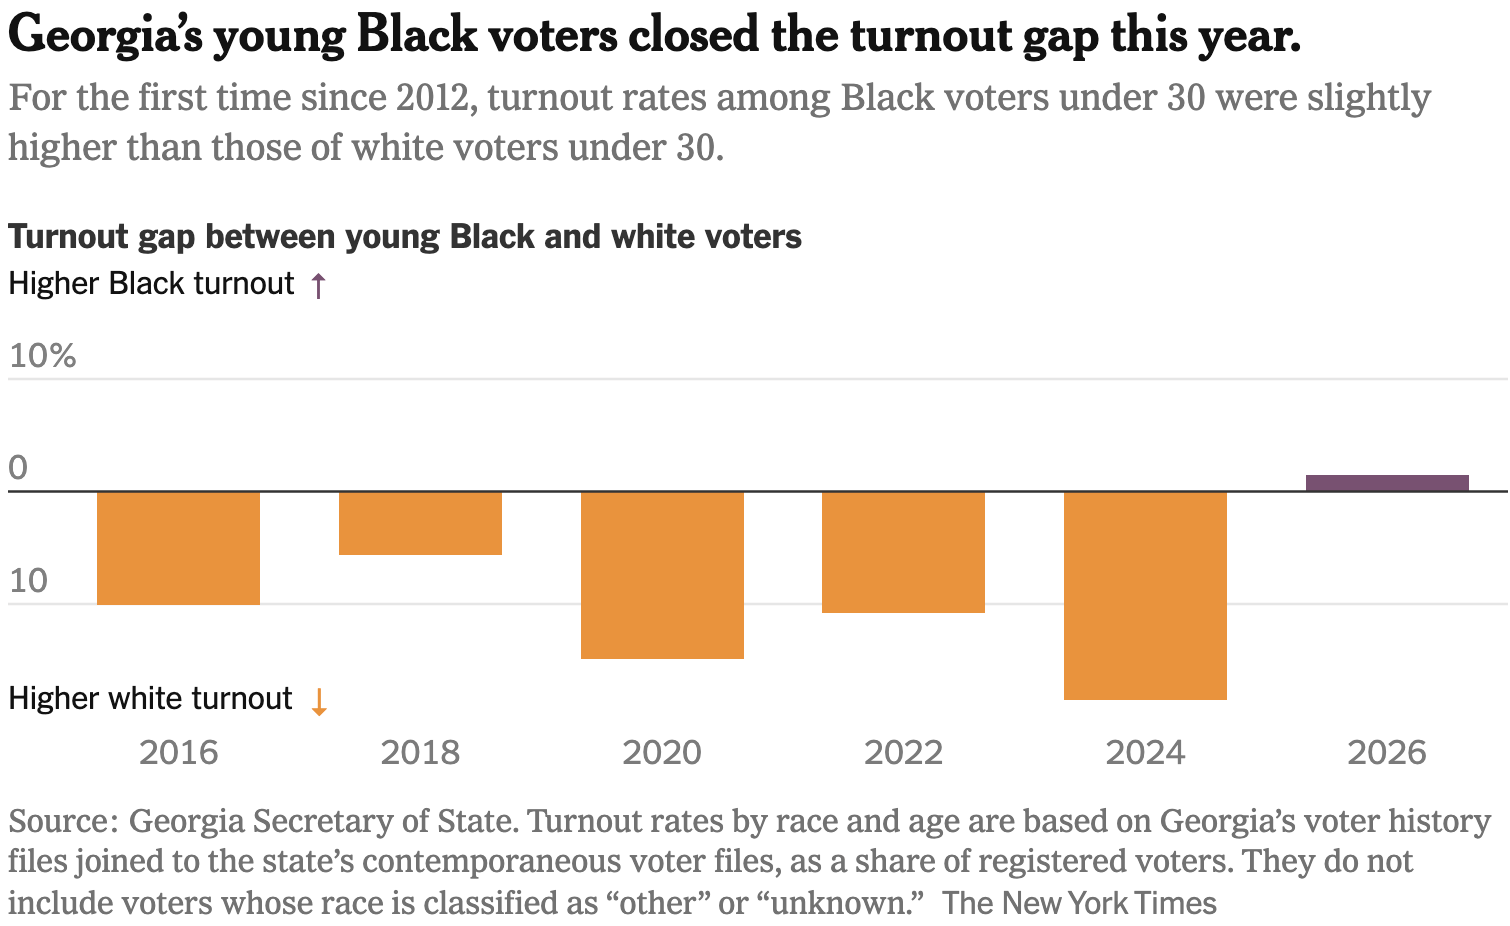
The New York Times:<a href="https://www.nytimes.com/2026/11/12/us/black-turnout-georgia.html?unlocked_article_code=1.P1E.NKSr.xJjVPz0wE0Iy&amp;smid=url-share"> <strong>Black Turnout Rose in Georgia, Powered by Younger Voters</strong></a>, November 12
The New York Times: Black Turnout Rose in Georgia, Powered by Younger Voters, November 12
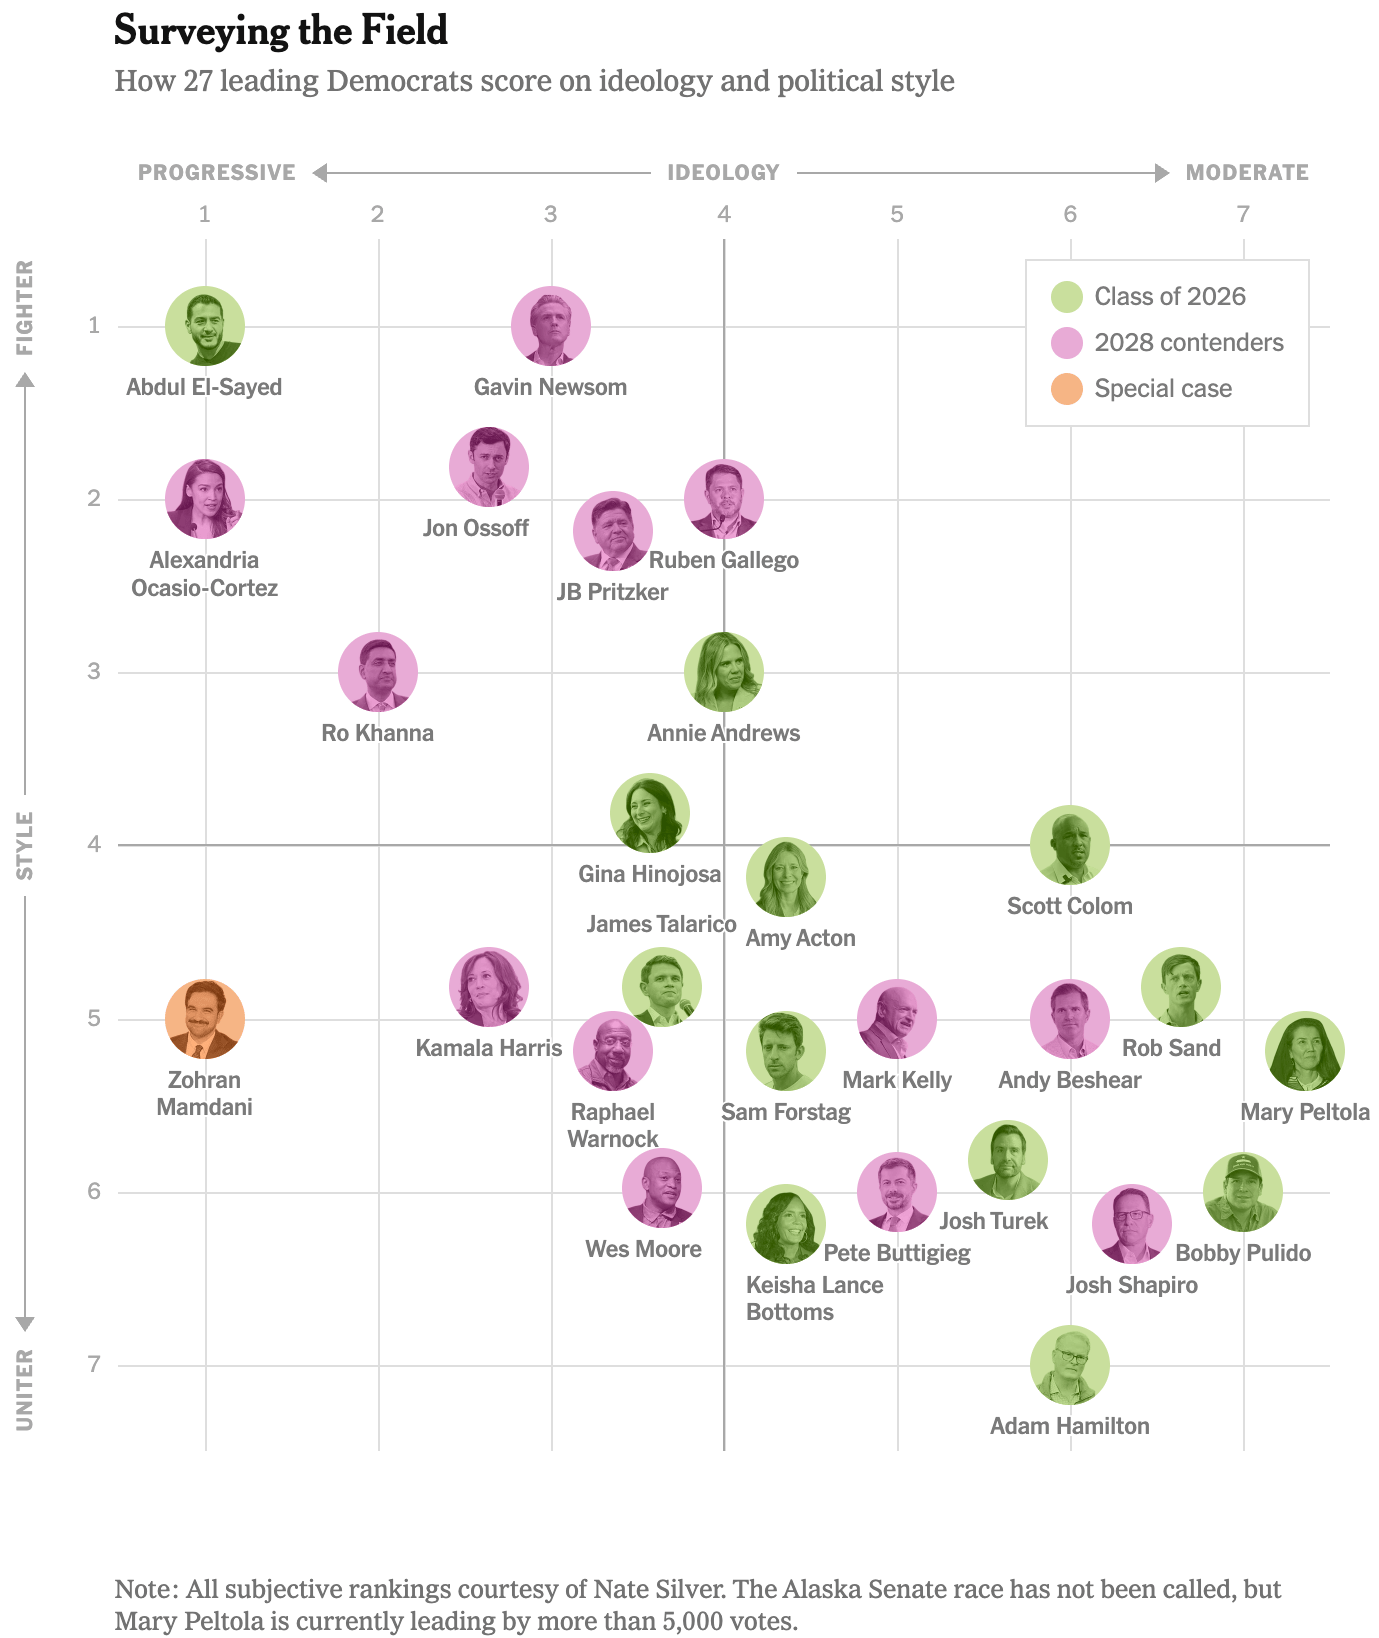
The New York Times: <a href="https://www.nytimes.com/2026/11/15/opinion/nate-silver-democrats-midterms-president.html?unlocked_article_code=1.QlE.2WmA.LuTuSFS6qUfz&amp;smid=url-share"><strong>Nate Silver’s Unscientific, Totally Subjective Breakdown of the Democrats’ Future Stars</strong></a>, November 15
The New York Times: Nate Silver’s Unscientific, Totally Subjective Breakdown of the Democrats’ Future Stars, November 15
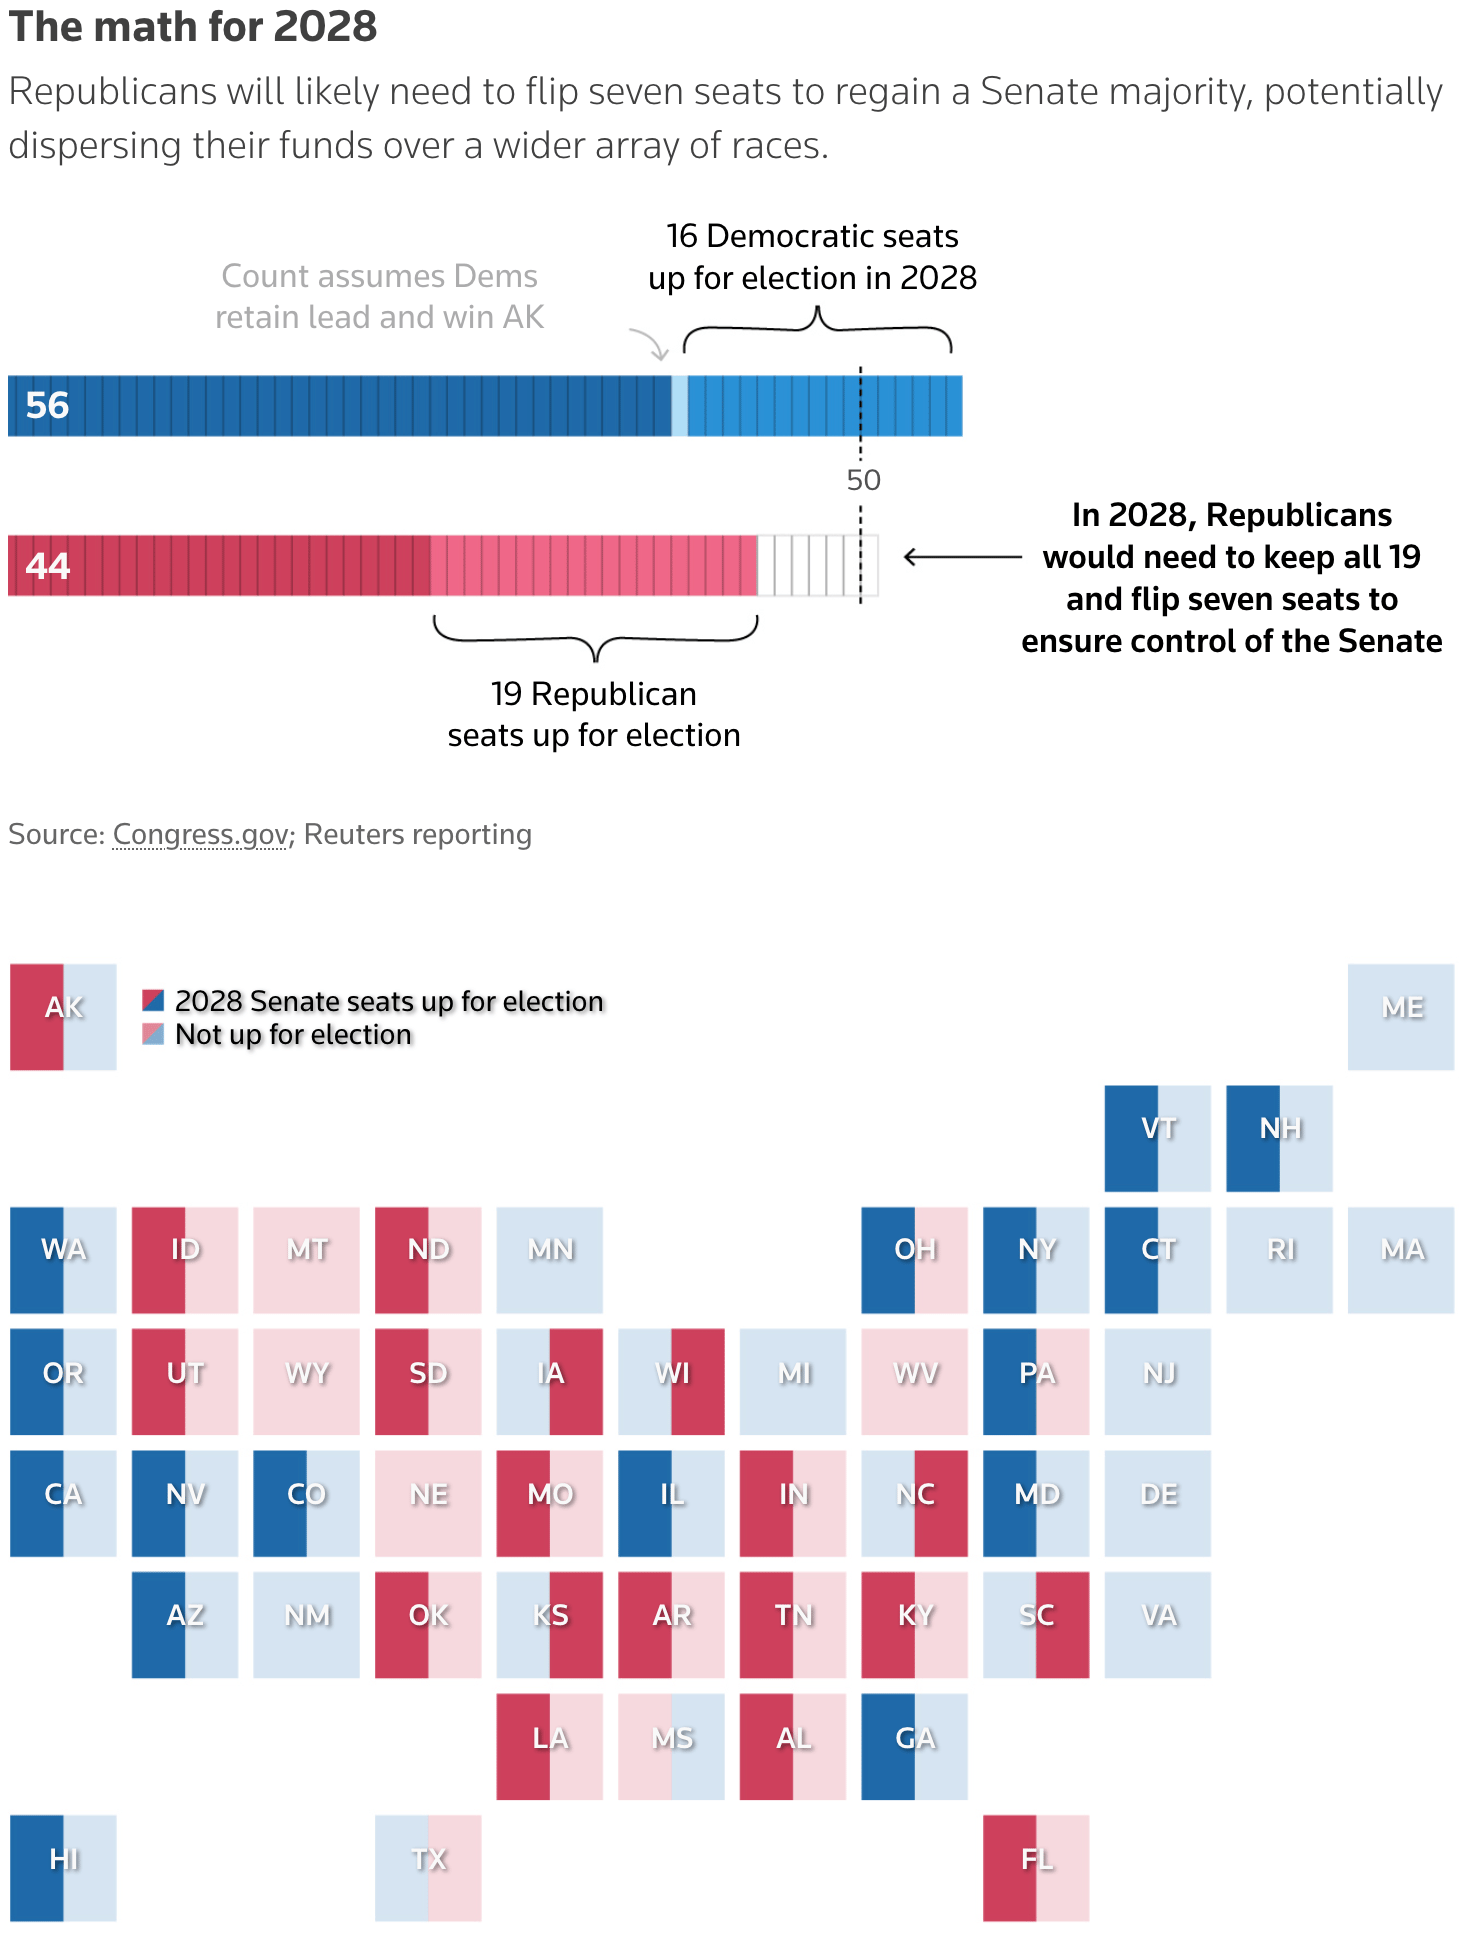
Reuters: <a href="https://www.reuters.com/graphics/US-ELECTIONS/GRAPHICS-BLOG/akpelkldzvr/#future-senate"><strong>Democrats may hold US Senate advantage in 2028 election</strong></a>, November 16
Reuters: Democrats may hold US Senate advantage in 2028 election, November 16

Additionally, polls reveal Americans' stance on Trump's building projects and AI.
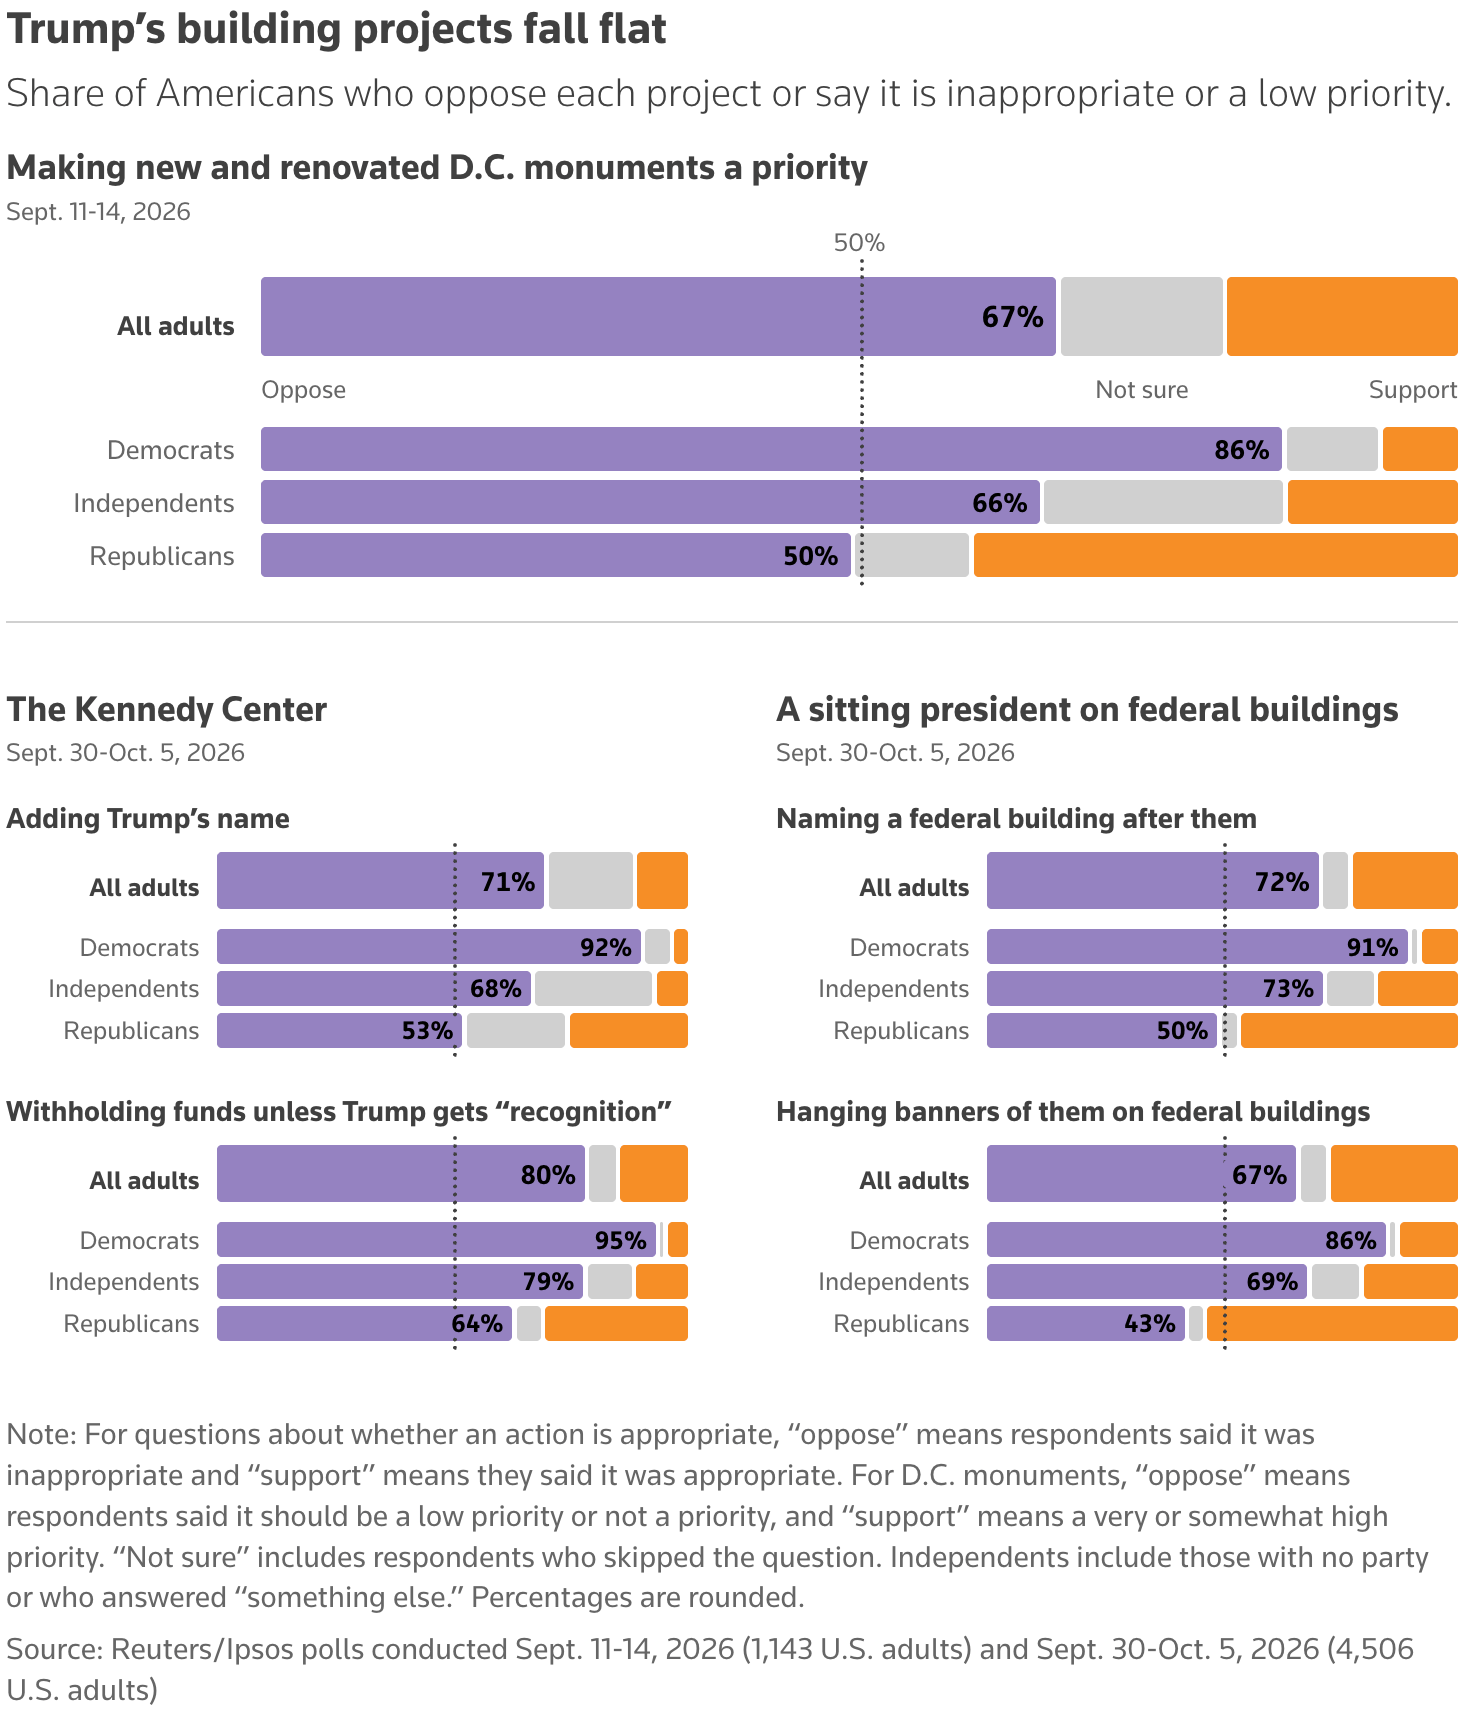
Reuters: <a href="https://www.reuters.com/graphics/US-ELECTIONS/GRAPHICS-BLOG/akpelkldzvr/#trump-polling"><strong>Trump’s construction projects are even less popular than his presidency</strong></a>, November 11
Reuters: Trump’s construction projects are even less popular than his presidency, November 11
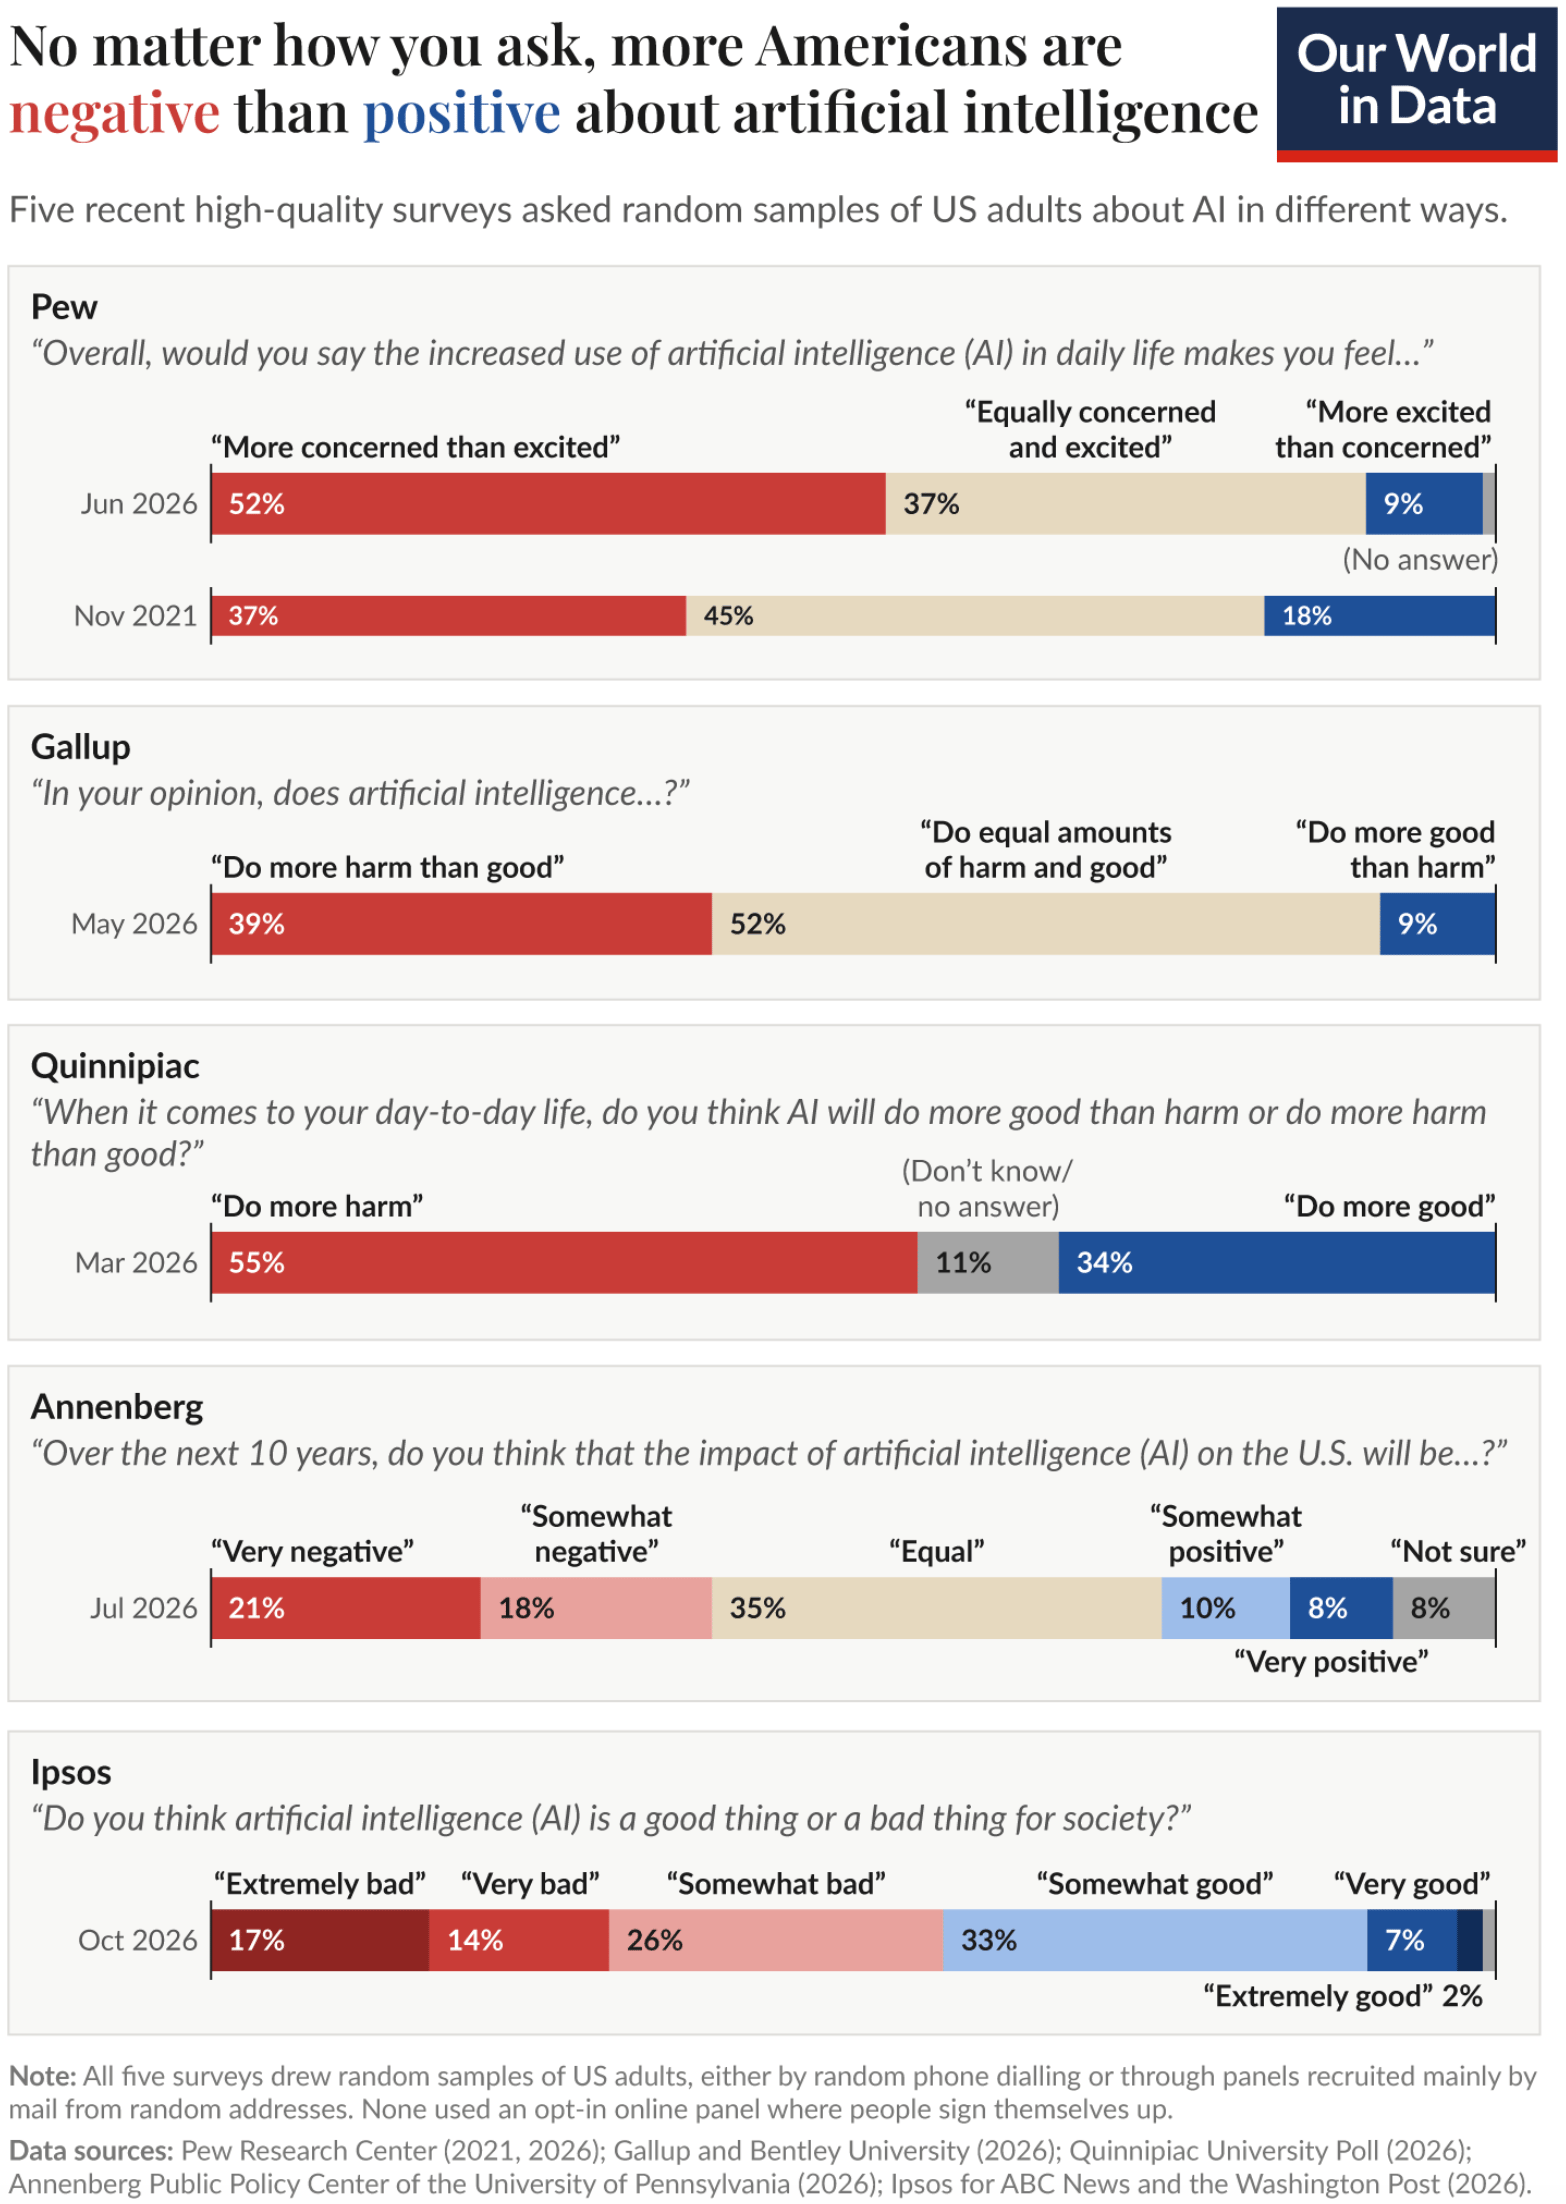
Our World in Data:<a href="https://ourworldindata.org/no-matter-how-you-ask-more-americans-are-negative-than-positive-about-ai"> <strong>No matter how you ask, more Americans are negative than positive about AI</strong></a>, November 16
Our World in Data: No matter how you ask, more Americans are negative than positive about AI, November 16

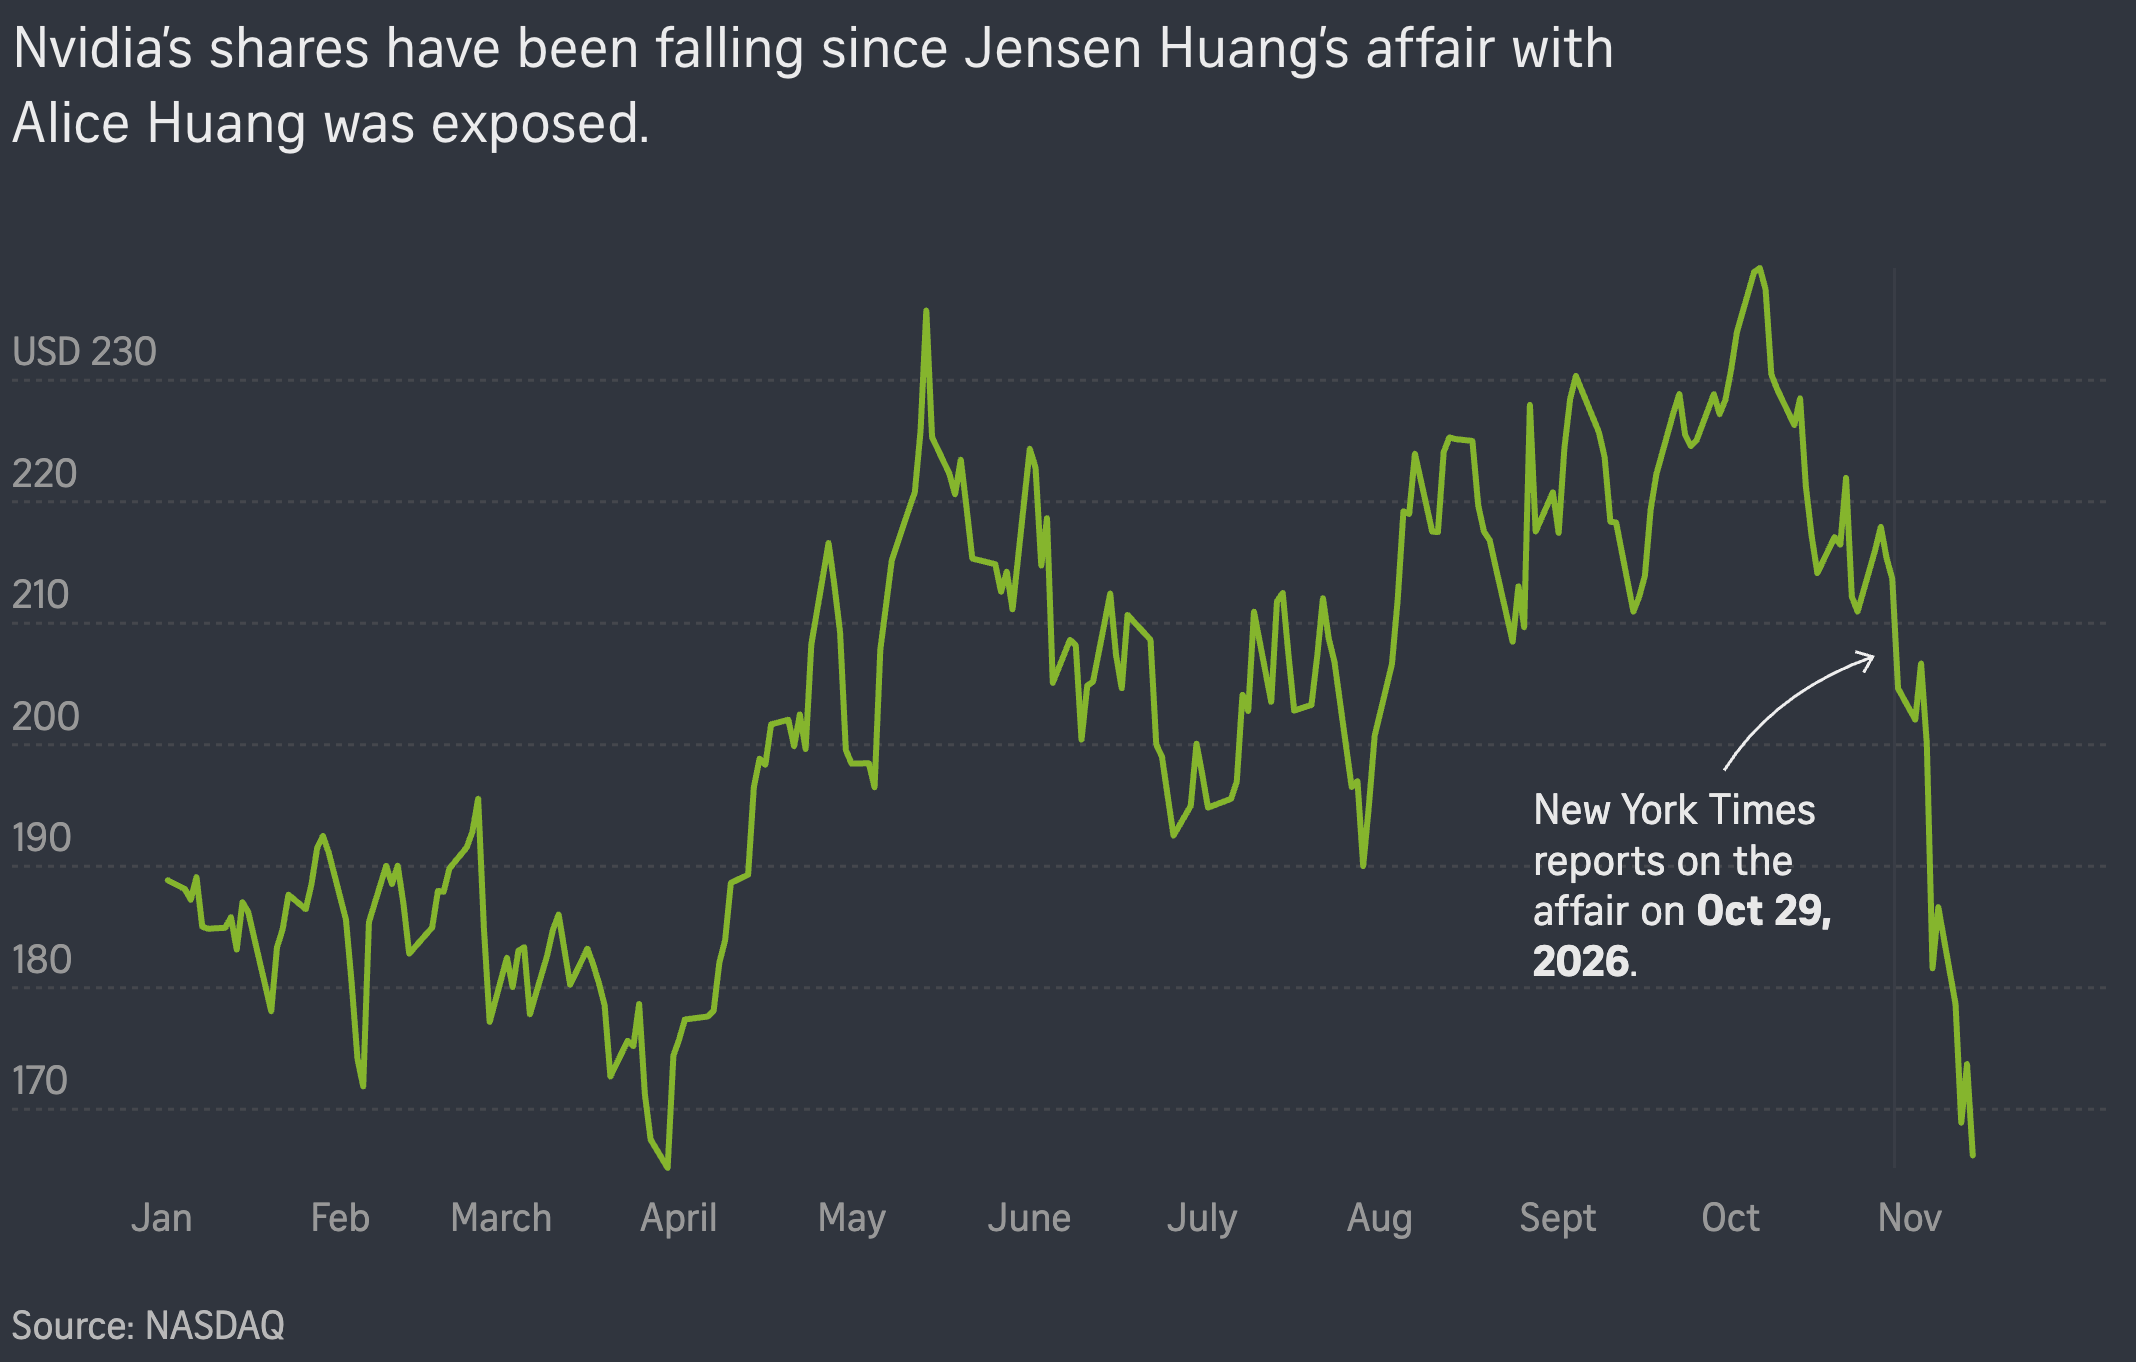
On the topic of AI chips, Chinese exports of memory chips have soared, while the scandal surrounding Nvidia has taken a toll on the tech company's shares.
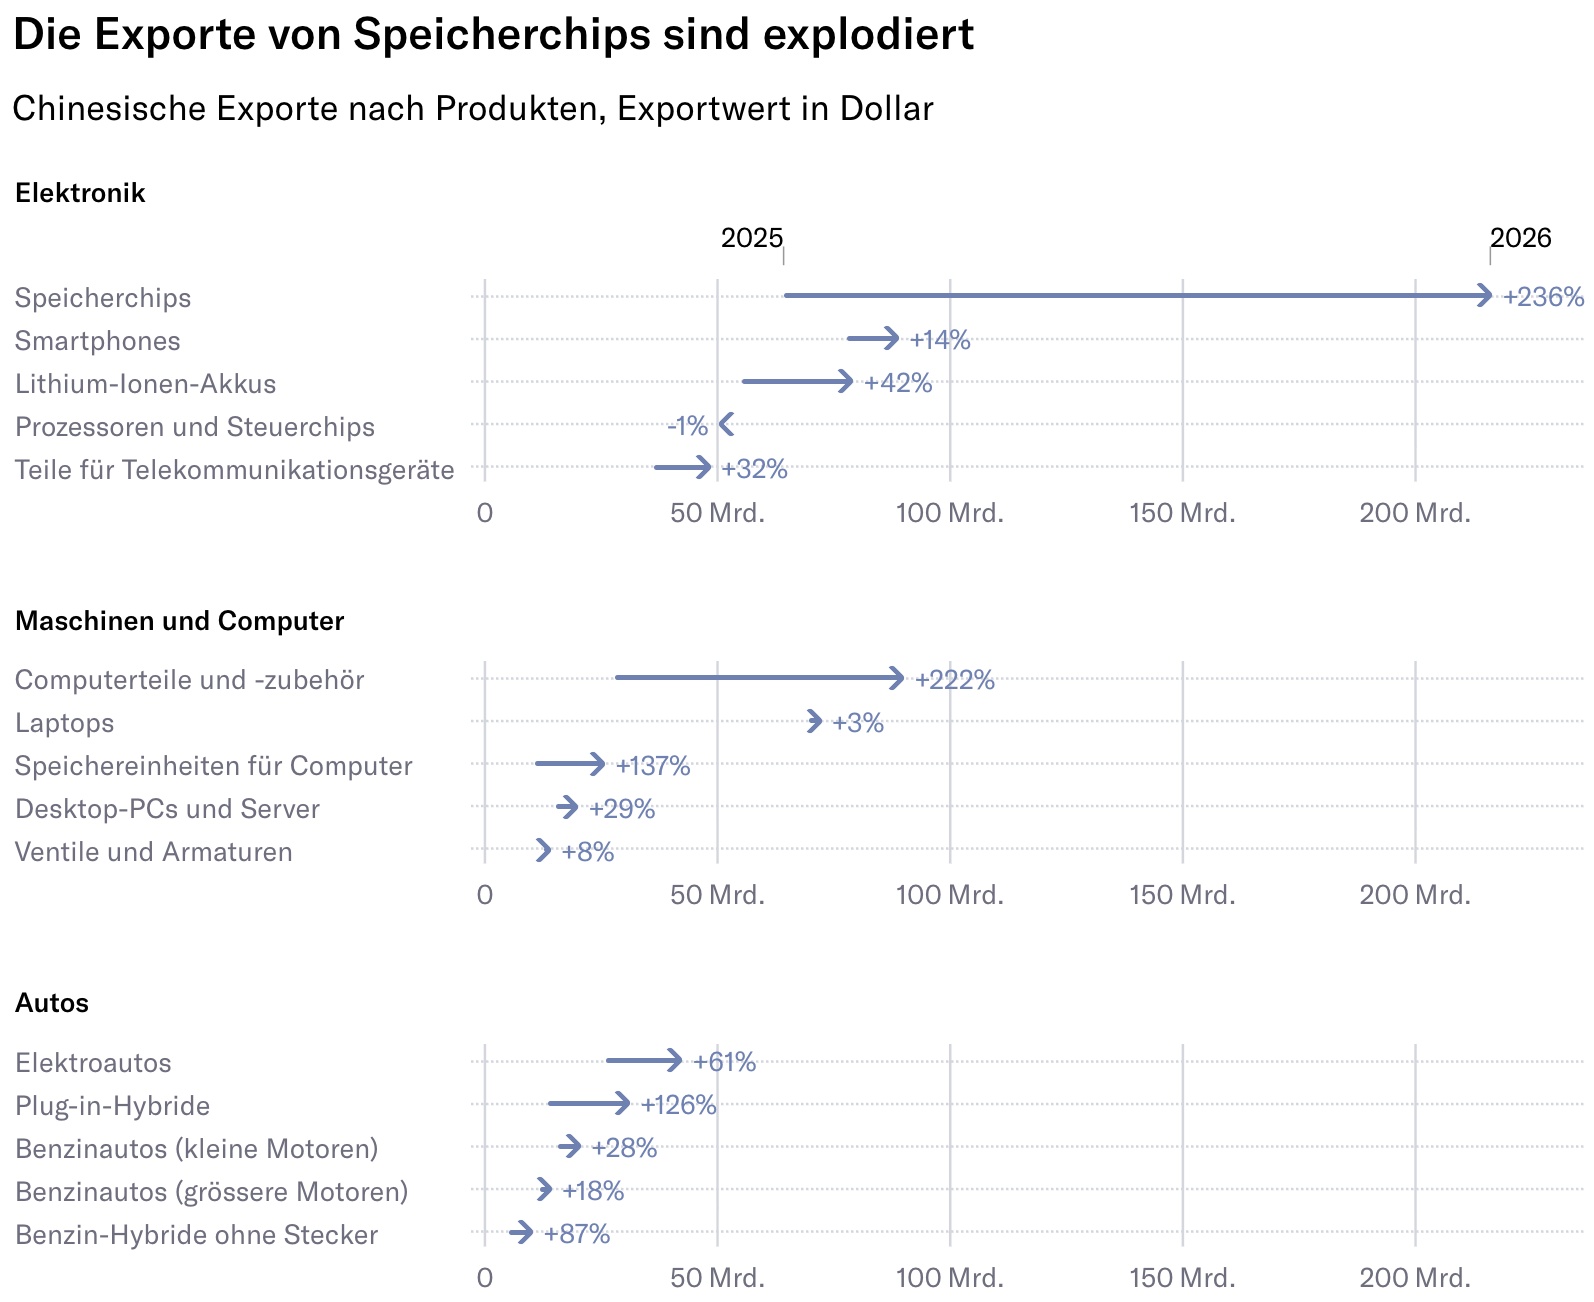

Neue Zürcher Zeitung:<a href="https://www.nzz.ch/visuals/chinas-exporte-brechen-rekorde-unsere-interaktive-uebersicht-zeigt-welche-produkte-am-staerksten-zulegen-und-in-welche-laender-sie-gehen-ld.10046983"> <strong>Chinas Exporte brechen Rekorde. Unsere interaktive Übersicht zeigt, welche Produkte am stärksten zulegen und in welche Länder sie geliefert werden</strong></a> [<em>China's exports are breaking records. Our interactive overview shows which products are growing the most and which countries they are being shipped to</em>], November 13
Neue Zürcher Zeitung: Chinas Exporte brechen Rekorde. Unsere interaktive Übersicht zeigt, welche Produkte am stärksten zulegen und in welche Länder sie geliefert werden [China's exports are breaking records. Our interactive overview shows which products are growing the most and which countries they are being shipped to], November 13
The New York Times: <a href="https://www.nytimes.com/interactive/2026/11/13/technology/nvidia-jensen-huang.html?unlocked_article_code=1.Q1E.4Fas.-zycVpwoO5Kx&amp;smid=url-share"><strong>The Fall of Jensen Huang</strong></a>, November 13
The New York Times: The Fall of Jensen Huang, November 13
The Straits Times: <a href="https://www.straitstimes.com/multimedia/graphics/2026/11/jensen-huang-timeline/index.html?shell"><strong>Jensen Huang’s affair: A timeline of events</strong></a>, November 13
The Straits Times: Jensen Huang’s affair: A timeline of events, November 13

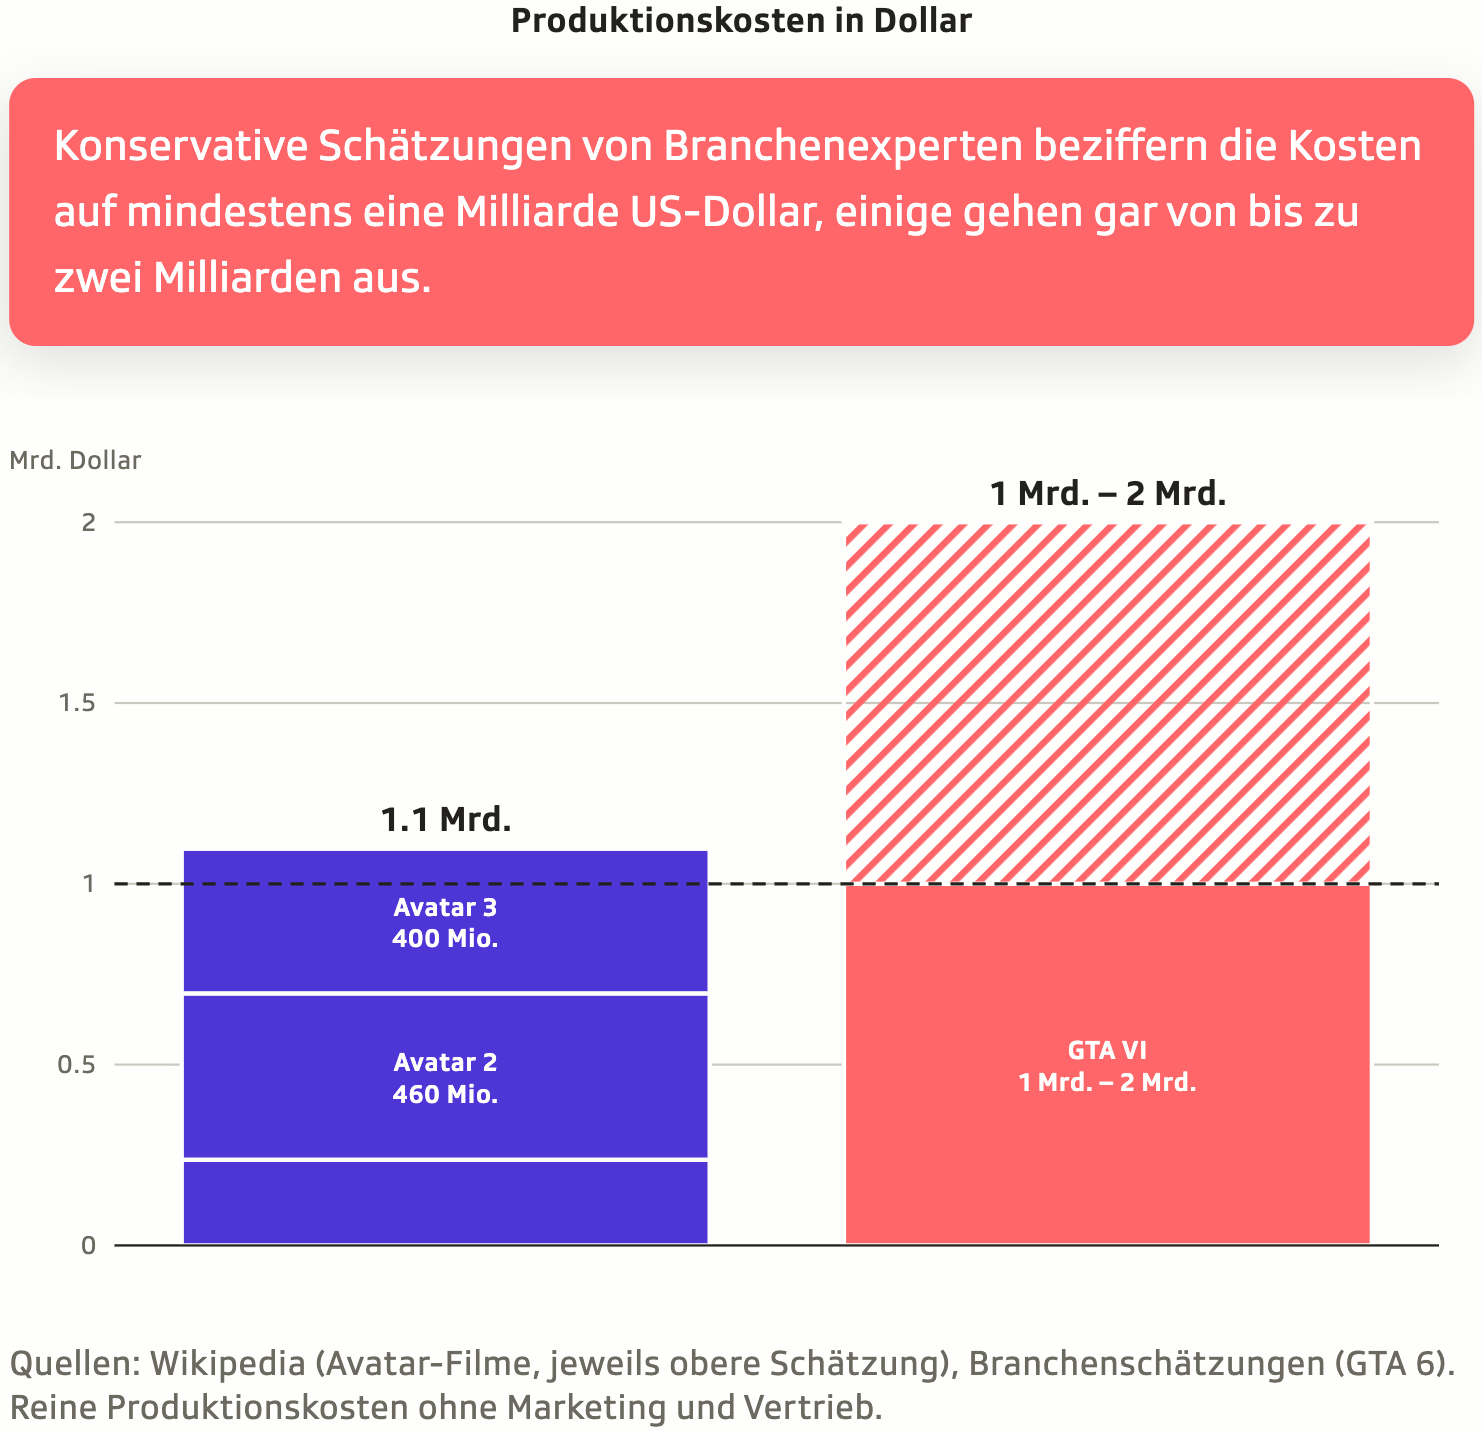
Moving on to the topic of media, real-life art heists were compared with art theft portrayed in films, and an analysis of WNBA player coverage across various news channels was explored. The long-awaited release of Grand Theft Auto VI is set for this week, amid estimates of high production costs.
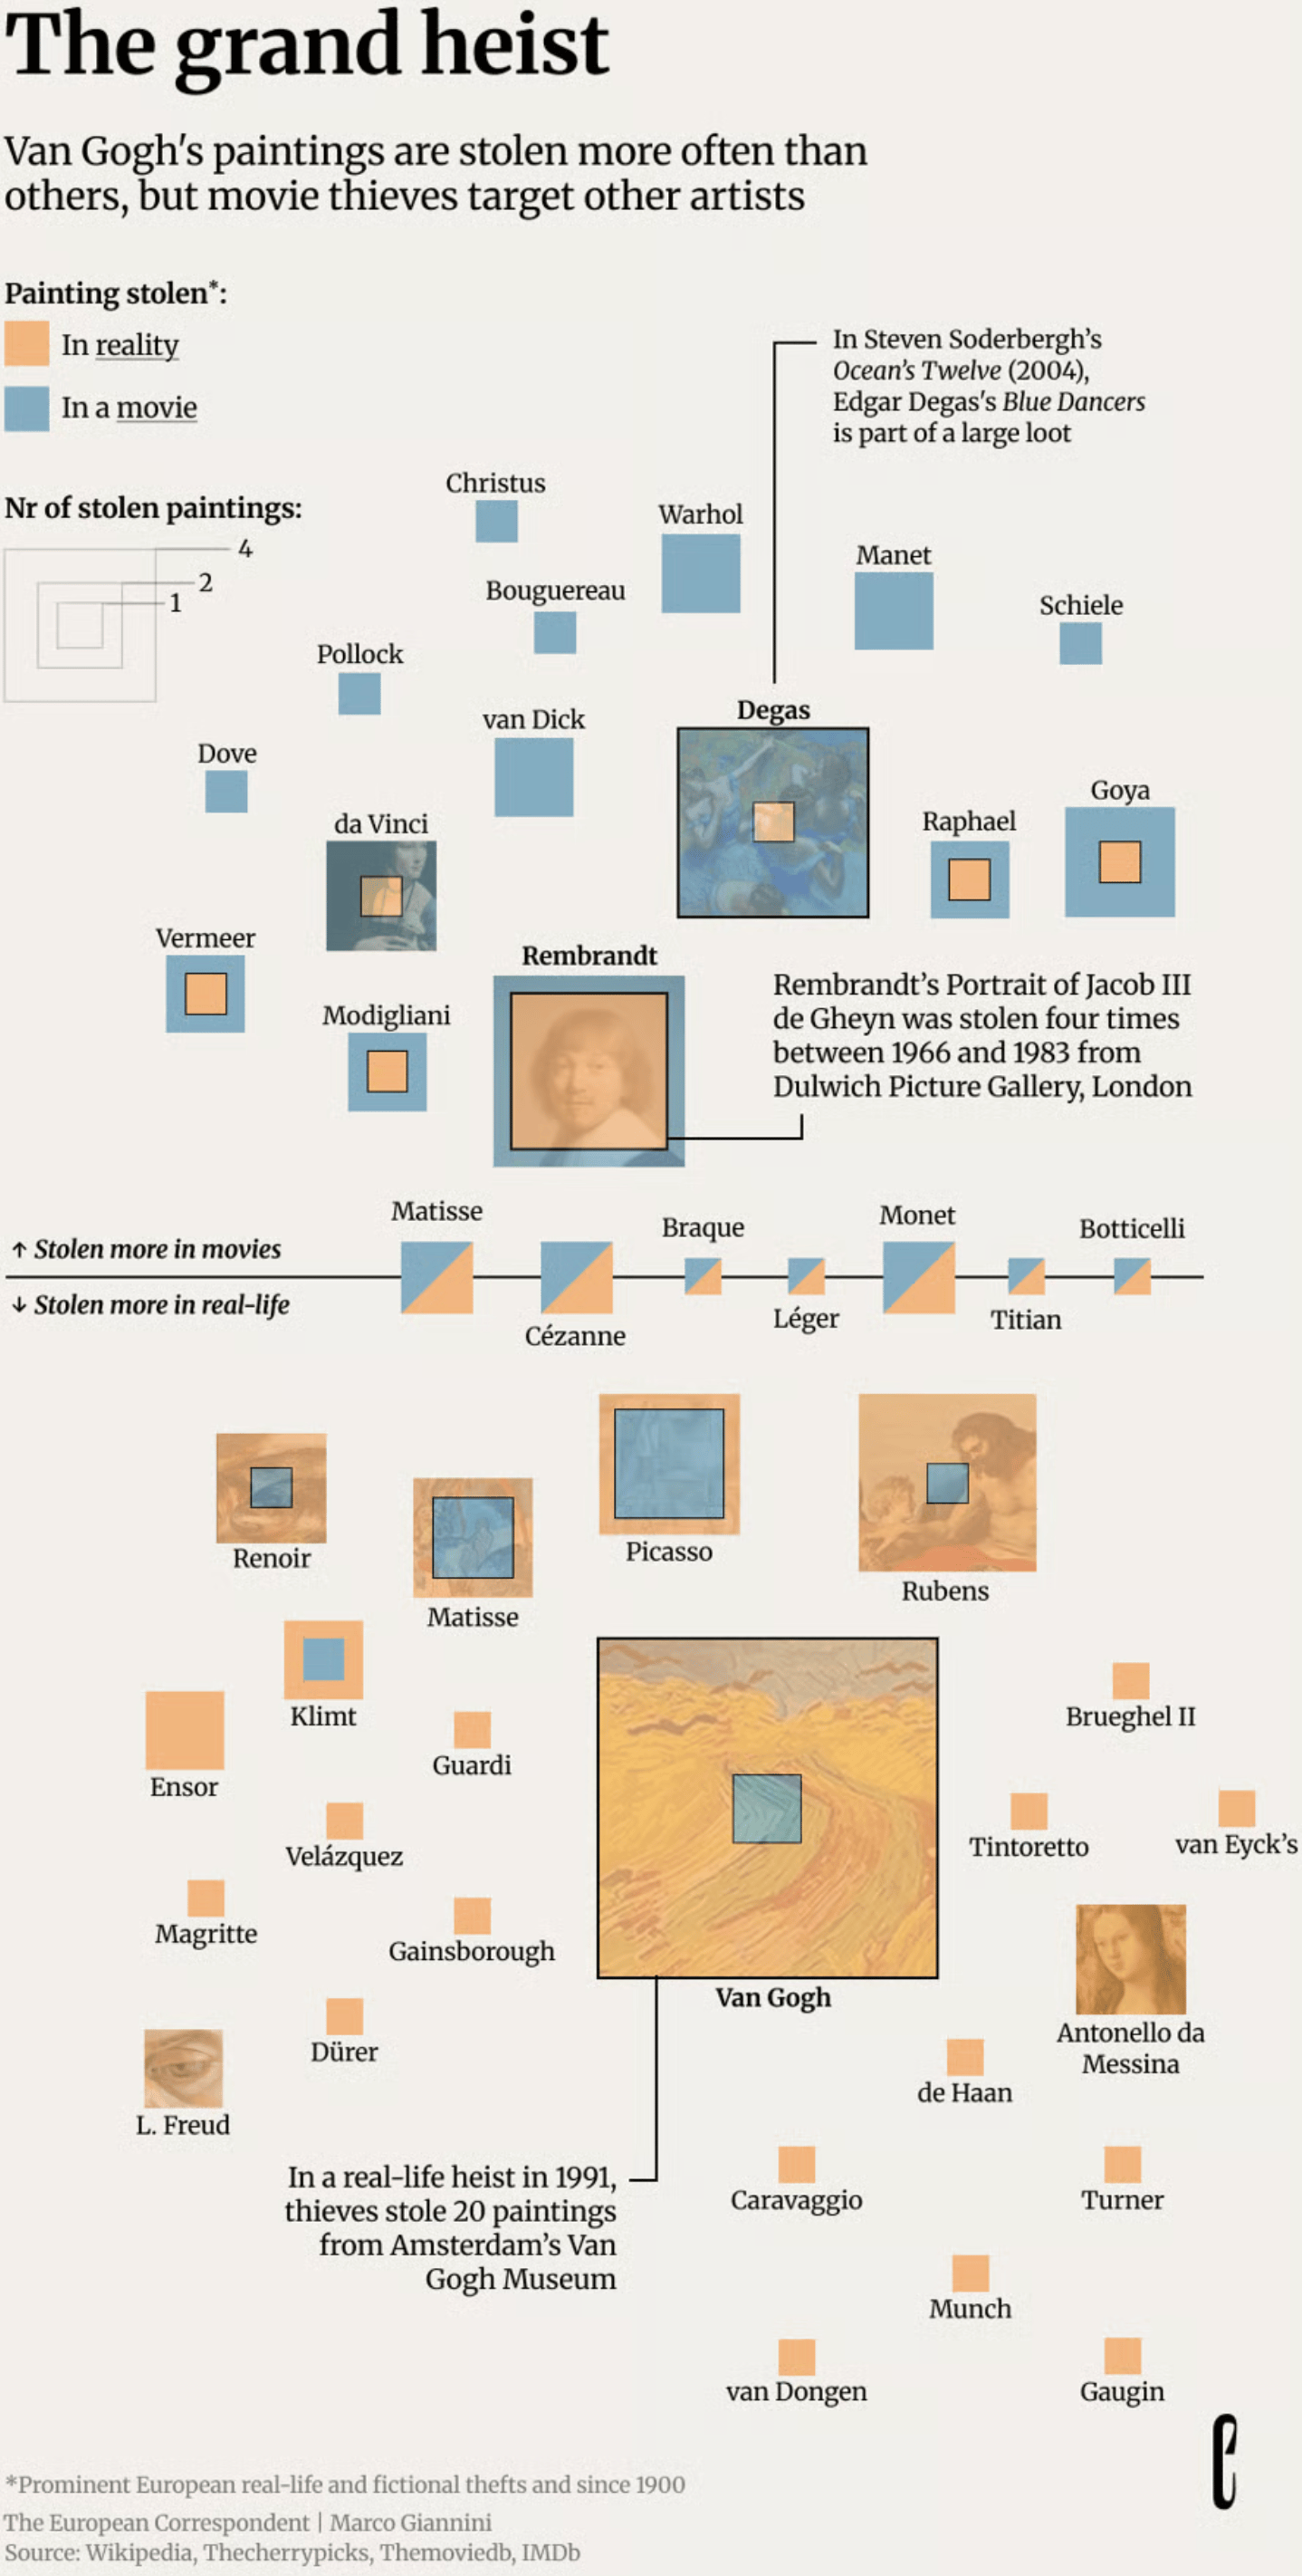

The European Correspondent: <a href="https://europeancorrespondent.com/en/r/the-grand-arttaking-tracking-europes-missing-paintings"><strong>The grand art-taking - Tracking Europe's missing paintings</strong></a>, November 13
The European Correspondent: The grand art-taking - Tracking Europe's missing paintings, November 13
The Pudding: "Fox News: WNBA this, WNBA that, WNBA bad  WNBA: Why you so obsessed with me?  We analyzed 30,000 articles and thousands of TV chyrons to examine the right-wing politicization of the league," November 12 (<a href="https://bsky.app/profile/pudding.cool/post/3n24z35syyk2u"><strong>Bluesky</strong></a>, <a href="https://pudding.cool/2026/11/wnba-politics/"><strong>project website</strong></a>)
The Pudding: "Fox News: WNBA this, WNBA that, WNBA bad WNBA: Why you so obsessed with me? We analyzed 30,000 articles and thousands of TV chyrons to examine the right-wing politicization of the league," November 12 (Bluesky, project website)
SRF:<a href="https://www.srf.ch/news/gta-6-was-sie-zum-spielereignis-des-jahres-wissen-muessen"> <strong>Das Spielereignis des Jahres</strong></a> [<em>The gaming event of the year</em>], November 16
SRF: Das Spielereignis des Jahres [The gaming event of the year], November 16

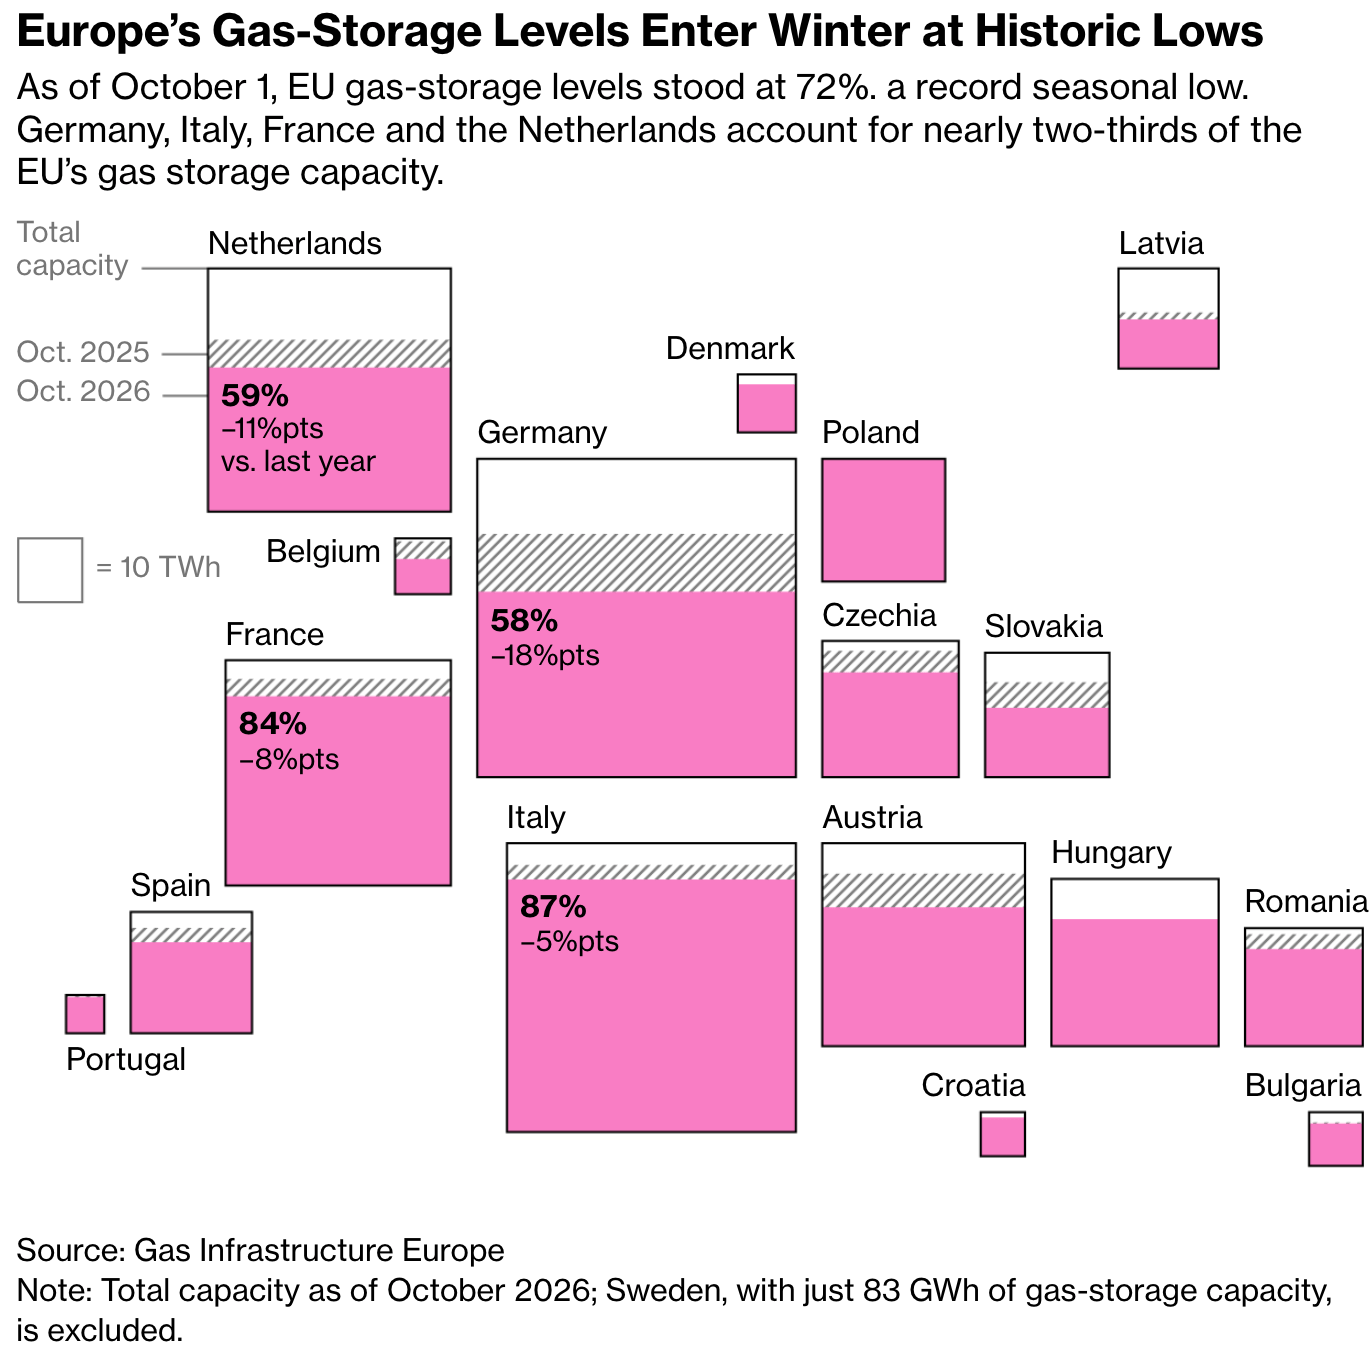
We end this Dispatch with some other interesting topics: Tokyo’s street trees, Europe's low gas-storage levels, rising unemployment, changes in governing parties' vote shares, and a wealth comparison tool.
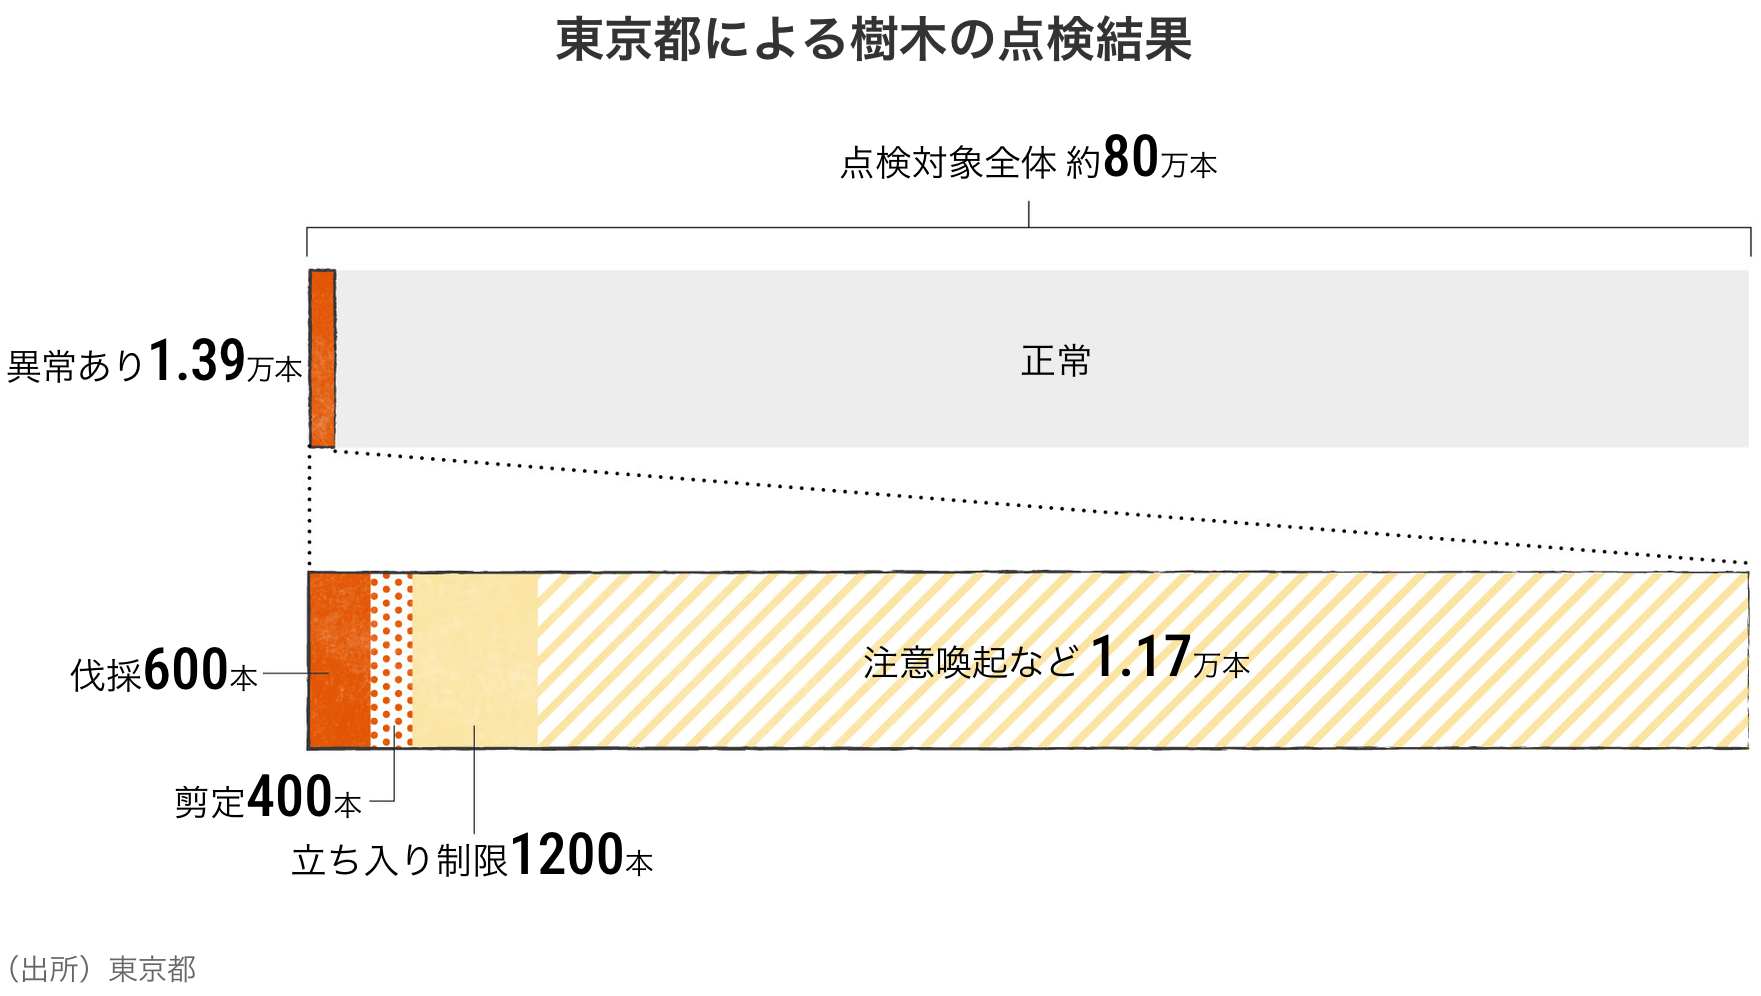
Nikkei Visual Data: <a href="https://vdata.nikkei.com/newsgraphics/urban-tree-dilemma/"><strong>東京彩る400種の街路樹 「緑の日傘」に老齢化の波</strong> </a>[<em>Chart title: Results of tree inspections conducted by the Tokyo Metropolitan Government</em>], November 15
Nikkei Visual Data: 東京彩る400種の街路樹 「緑の日傘」に老齢化の波 [Chart title: Results of tree inspections conducted by the Tokyo Metropolitan Government], November 15
Bloomberg: <a href="https://www.bloomberg.com/graphics/2026-europe-energy-woes/?srnd=phx-graphics-v2"><strong>Why the Iran War Means Europe Can’t Afford A Severe Winter</strong></a>, November 11
Bloomberg: Why the Iran War Means Europe Can’t Afford A Severe Winter, November 11
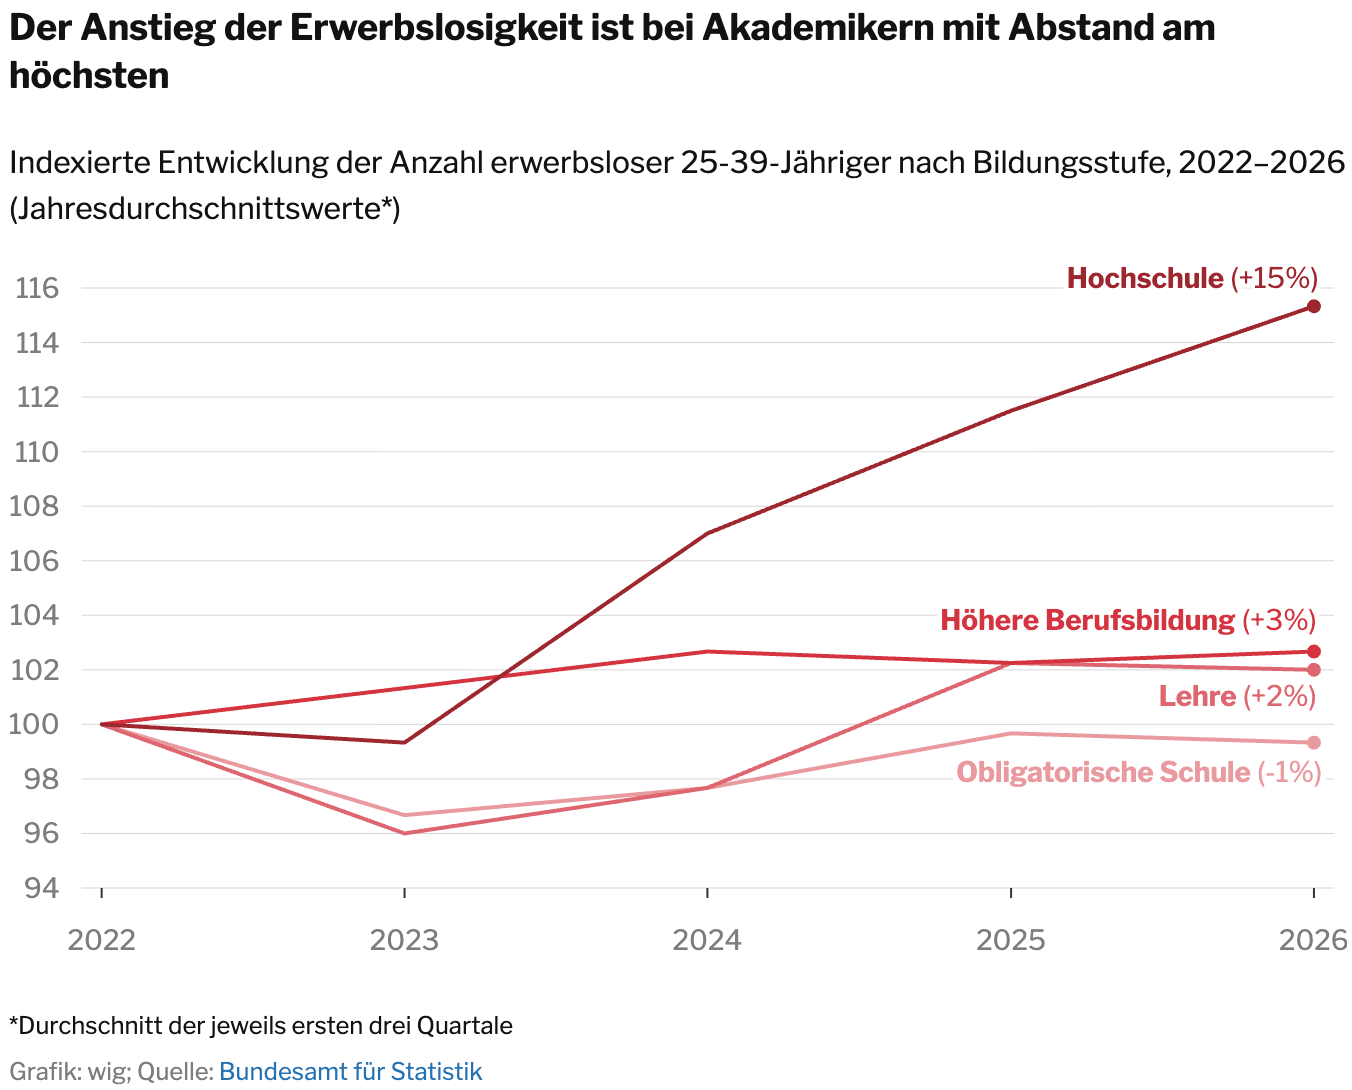
Tages-Anzeiger: <a href="https://www.tagesanzeiger.ch/jugendarbeitslosigkeit-12-6-prozent-rekord-in-der-schweiz-201866505134"><strong>76’000 ohne Job – darum erreicht die Erwerbslosigkeit der Jungen einen neuen Höchstwert</strong></a> [<em>Chart title: The rise in unemployment is by far the highest among college graduates</em>], November 12
Tages-Anzeiger: 76’000 ohne Job – darum erreicht die Erwerbslosigkeit der Jungen einen neuen Höchstwert [Chart title: The rise in unemployment is by far the highest among college graduates], November 12
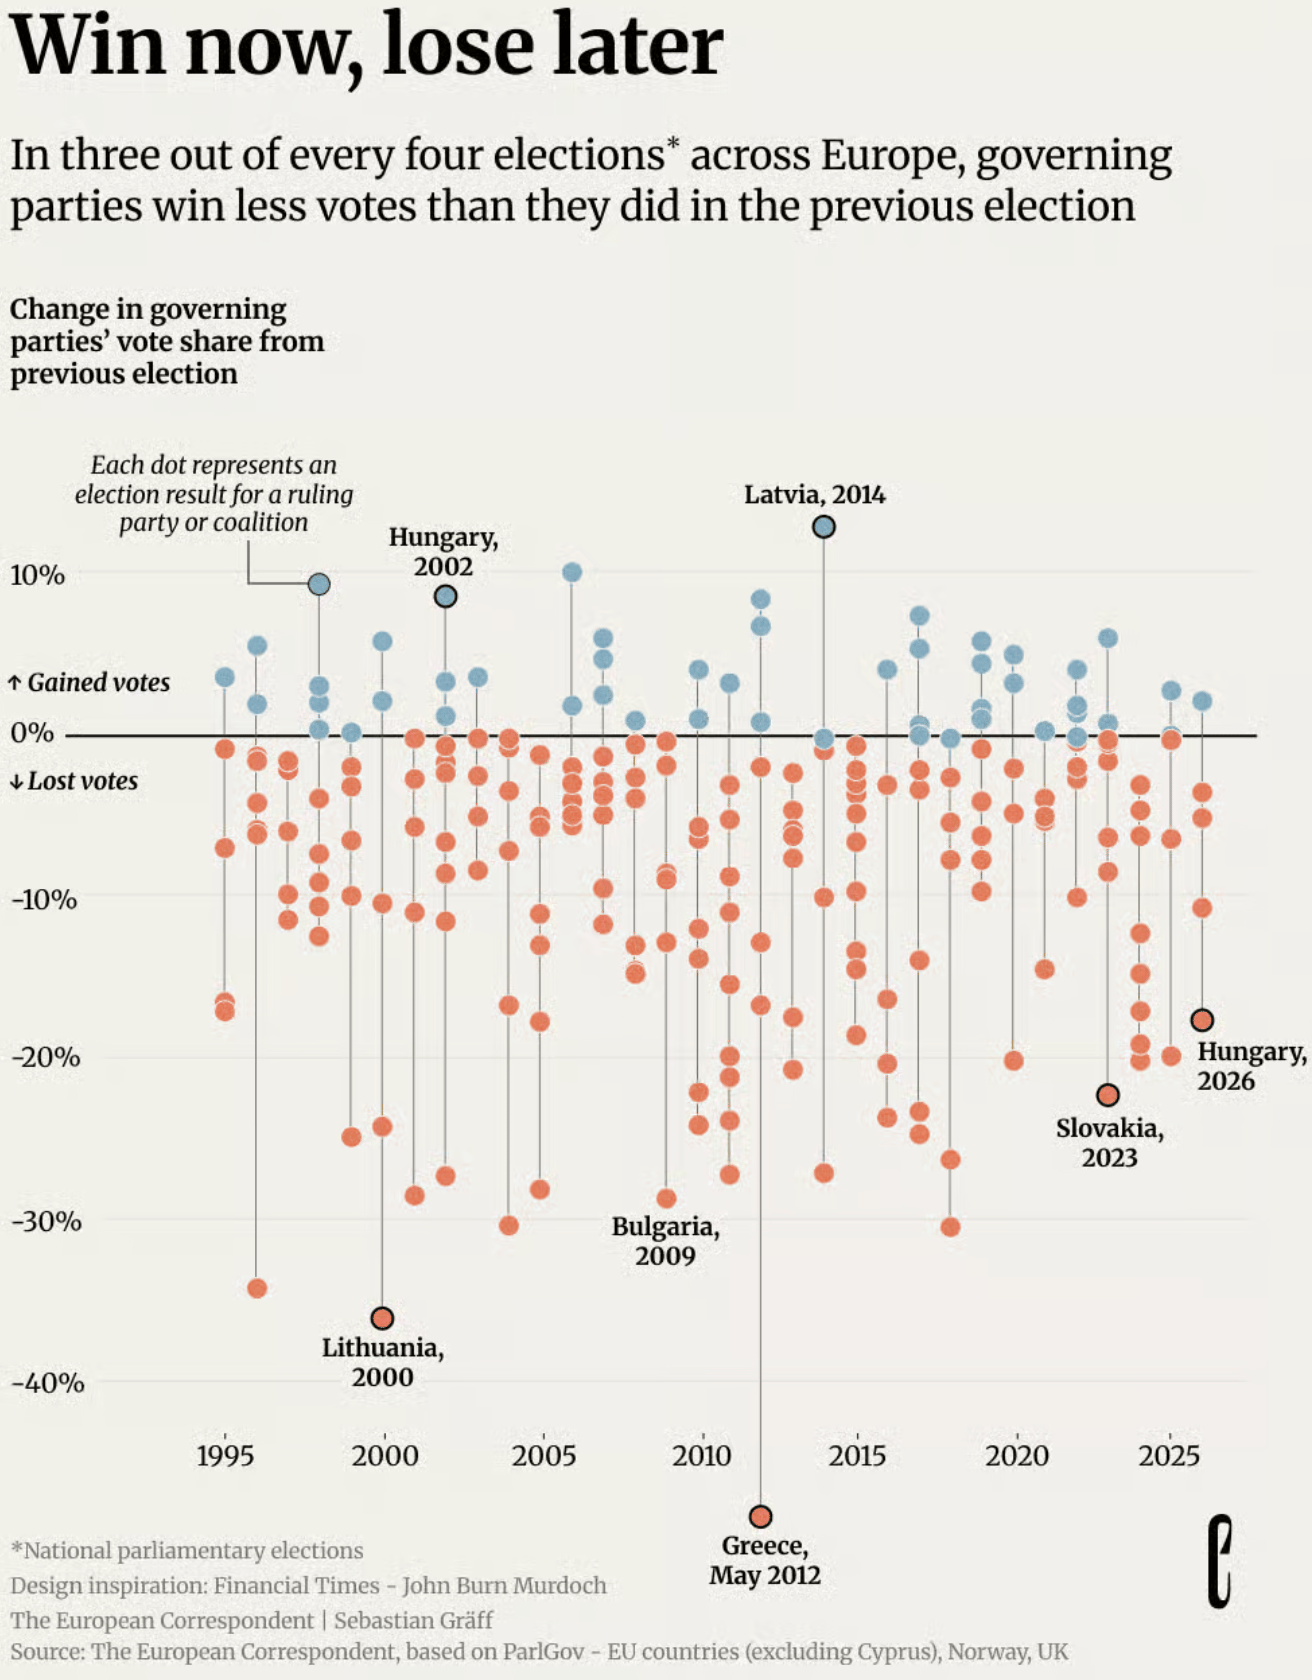
The European Correspondent: <a href="https://europeancorrespondent.com/en/r/incumbents-lose-elections"><strong>Incumbents lose elections</strong></a>, November 10
The European Correspondent: Incumbents lose elections, November 10
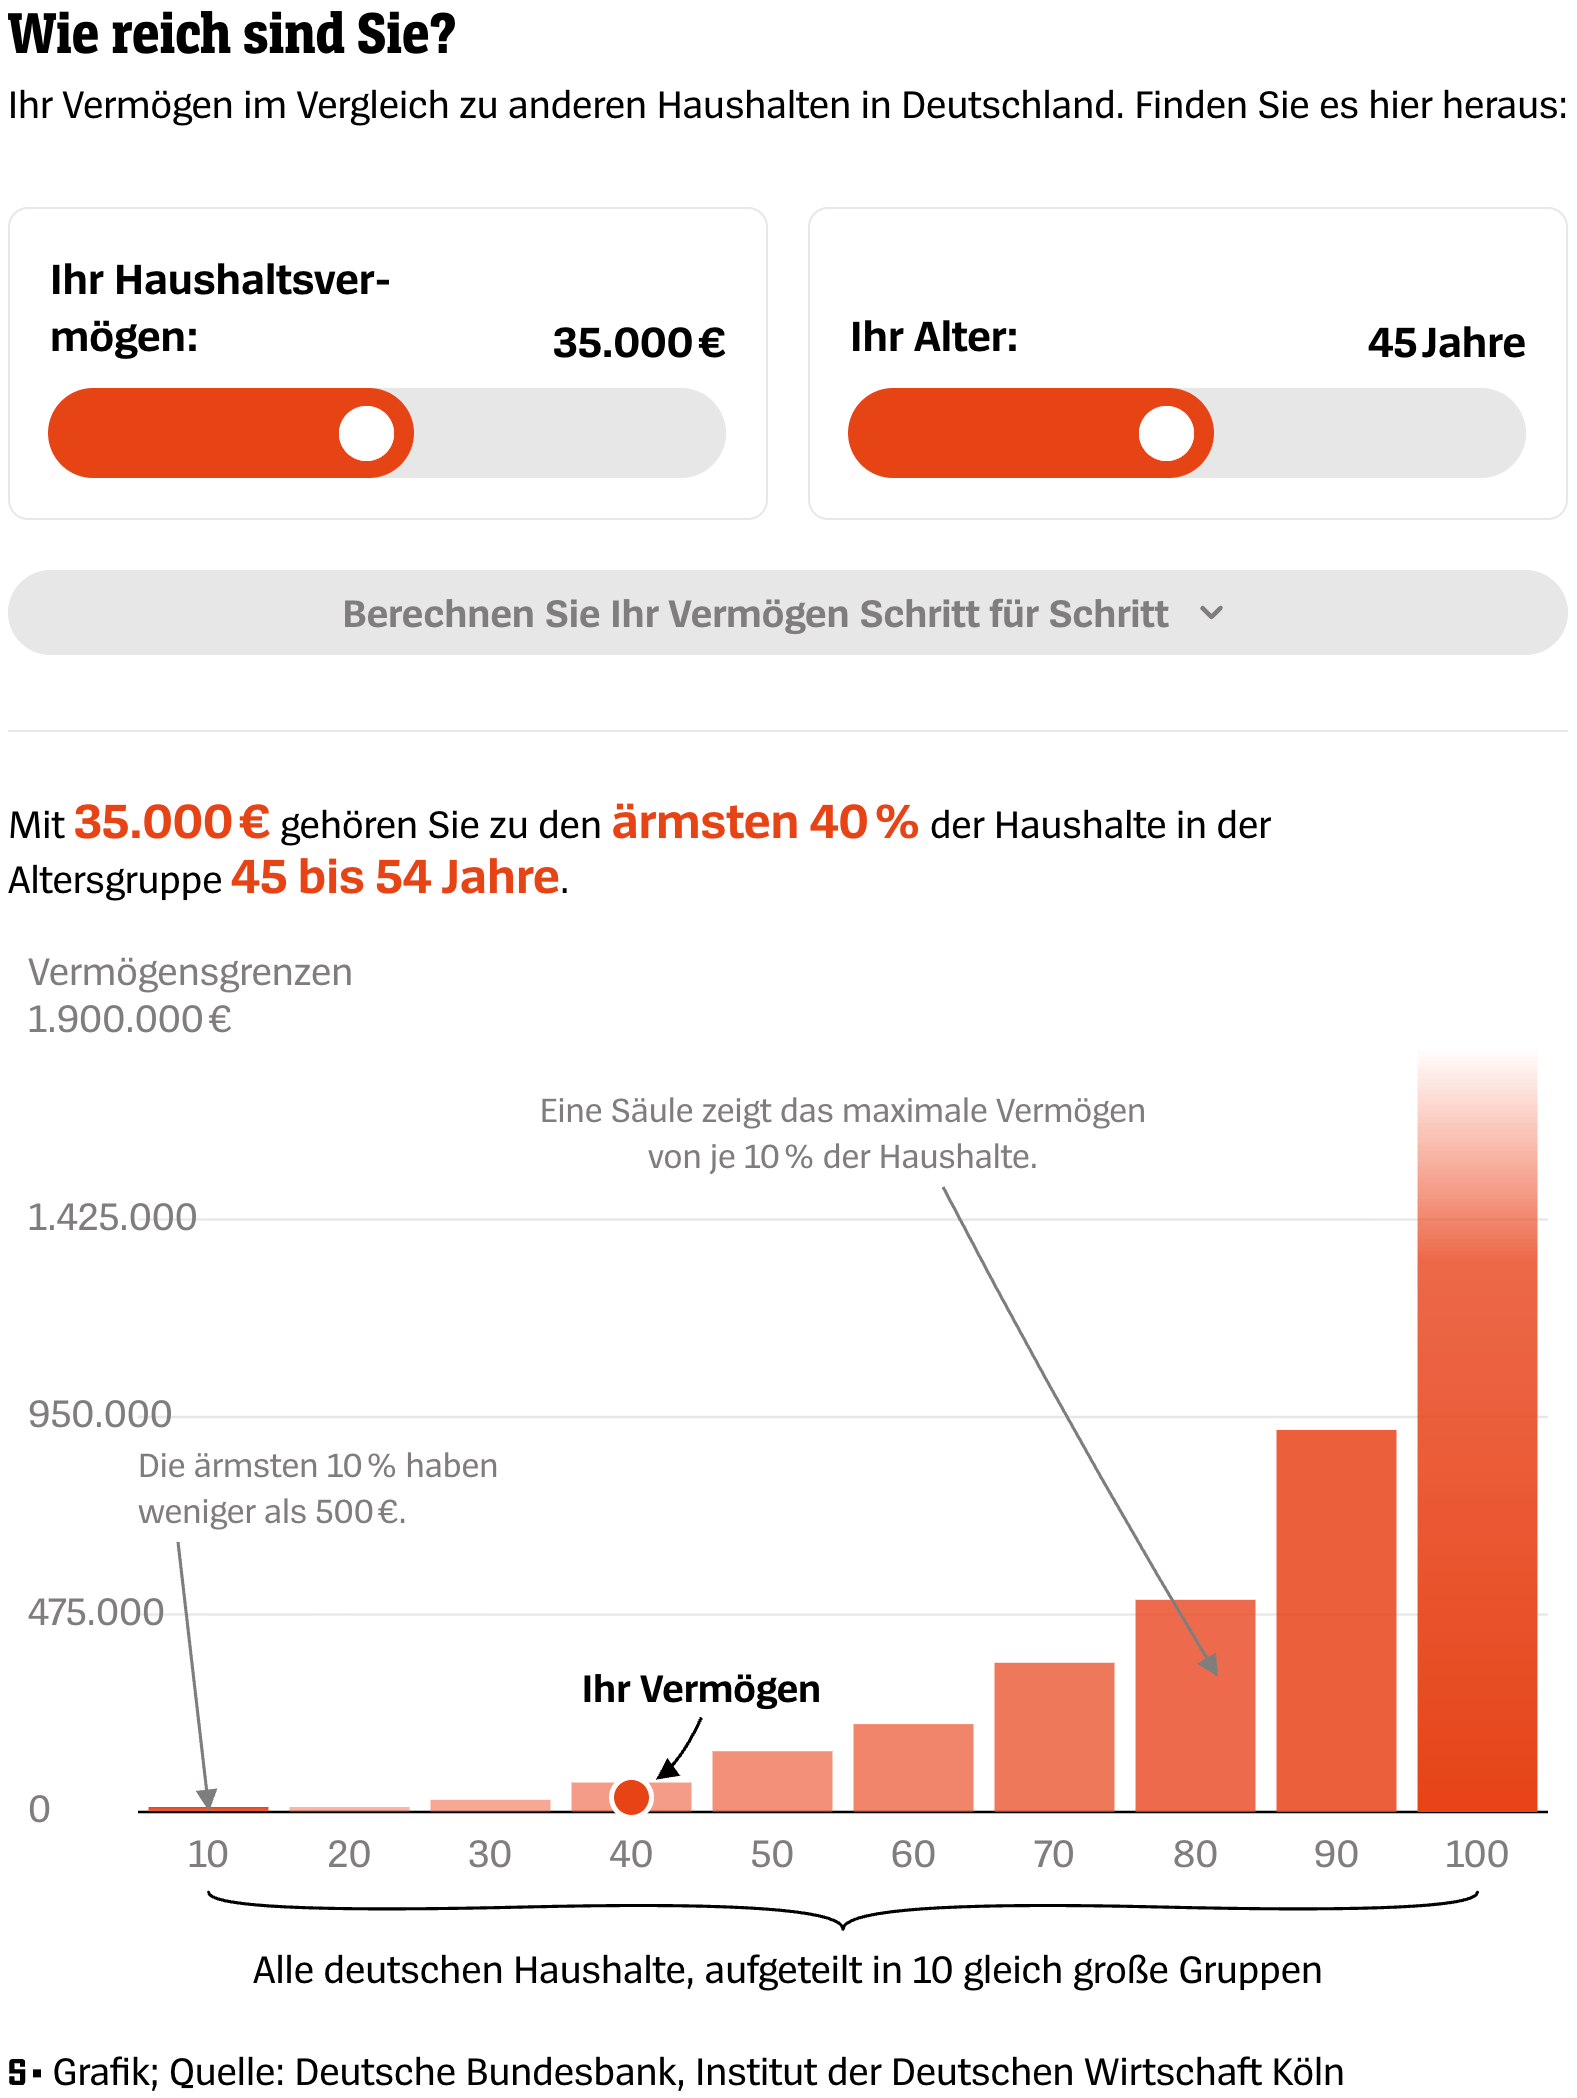
Der Spiegel: <a href="https://www.spiegel.de/wirtschaft/service/vermoegen-und-einkommen-wie-reich-sie-wirklich-sind-finden-wir-es-heraus-a-762ac689-da1b-4816-89f0-436c71cd2389"><strong>Sind Sie reicher als der Deutschland-Durchschnitt? Hier finden Sie es heraus</strong></a> [<em>Are you richer than the German average? Find out here</em>], November 16
Der Spiegel: Sind Sie reicher als der Deutschland-Durchschnitt? Hier finden Sie es heraus [Are you richer than the German average? Find out here], November 16

What else we found interesting

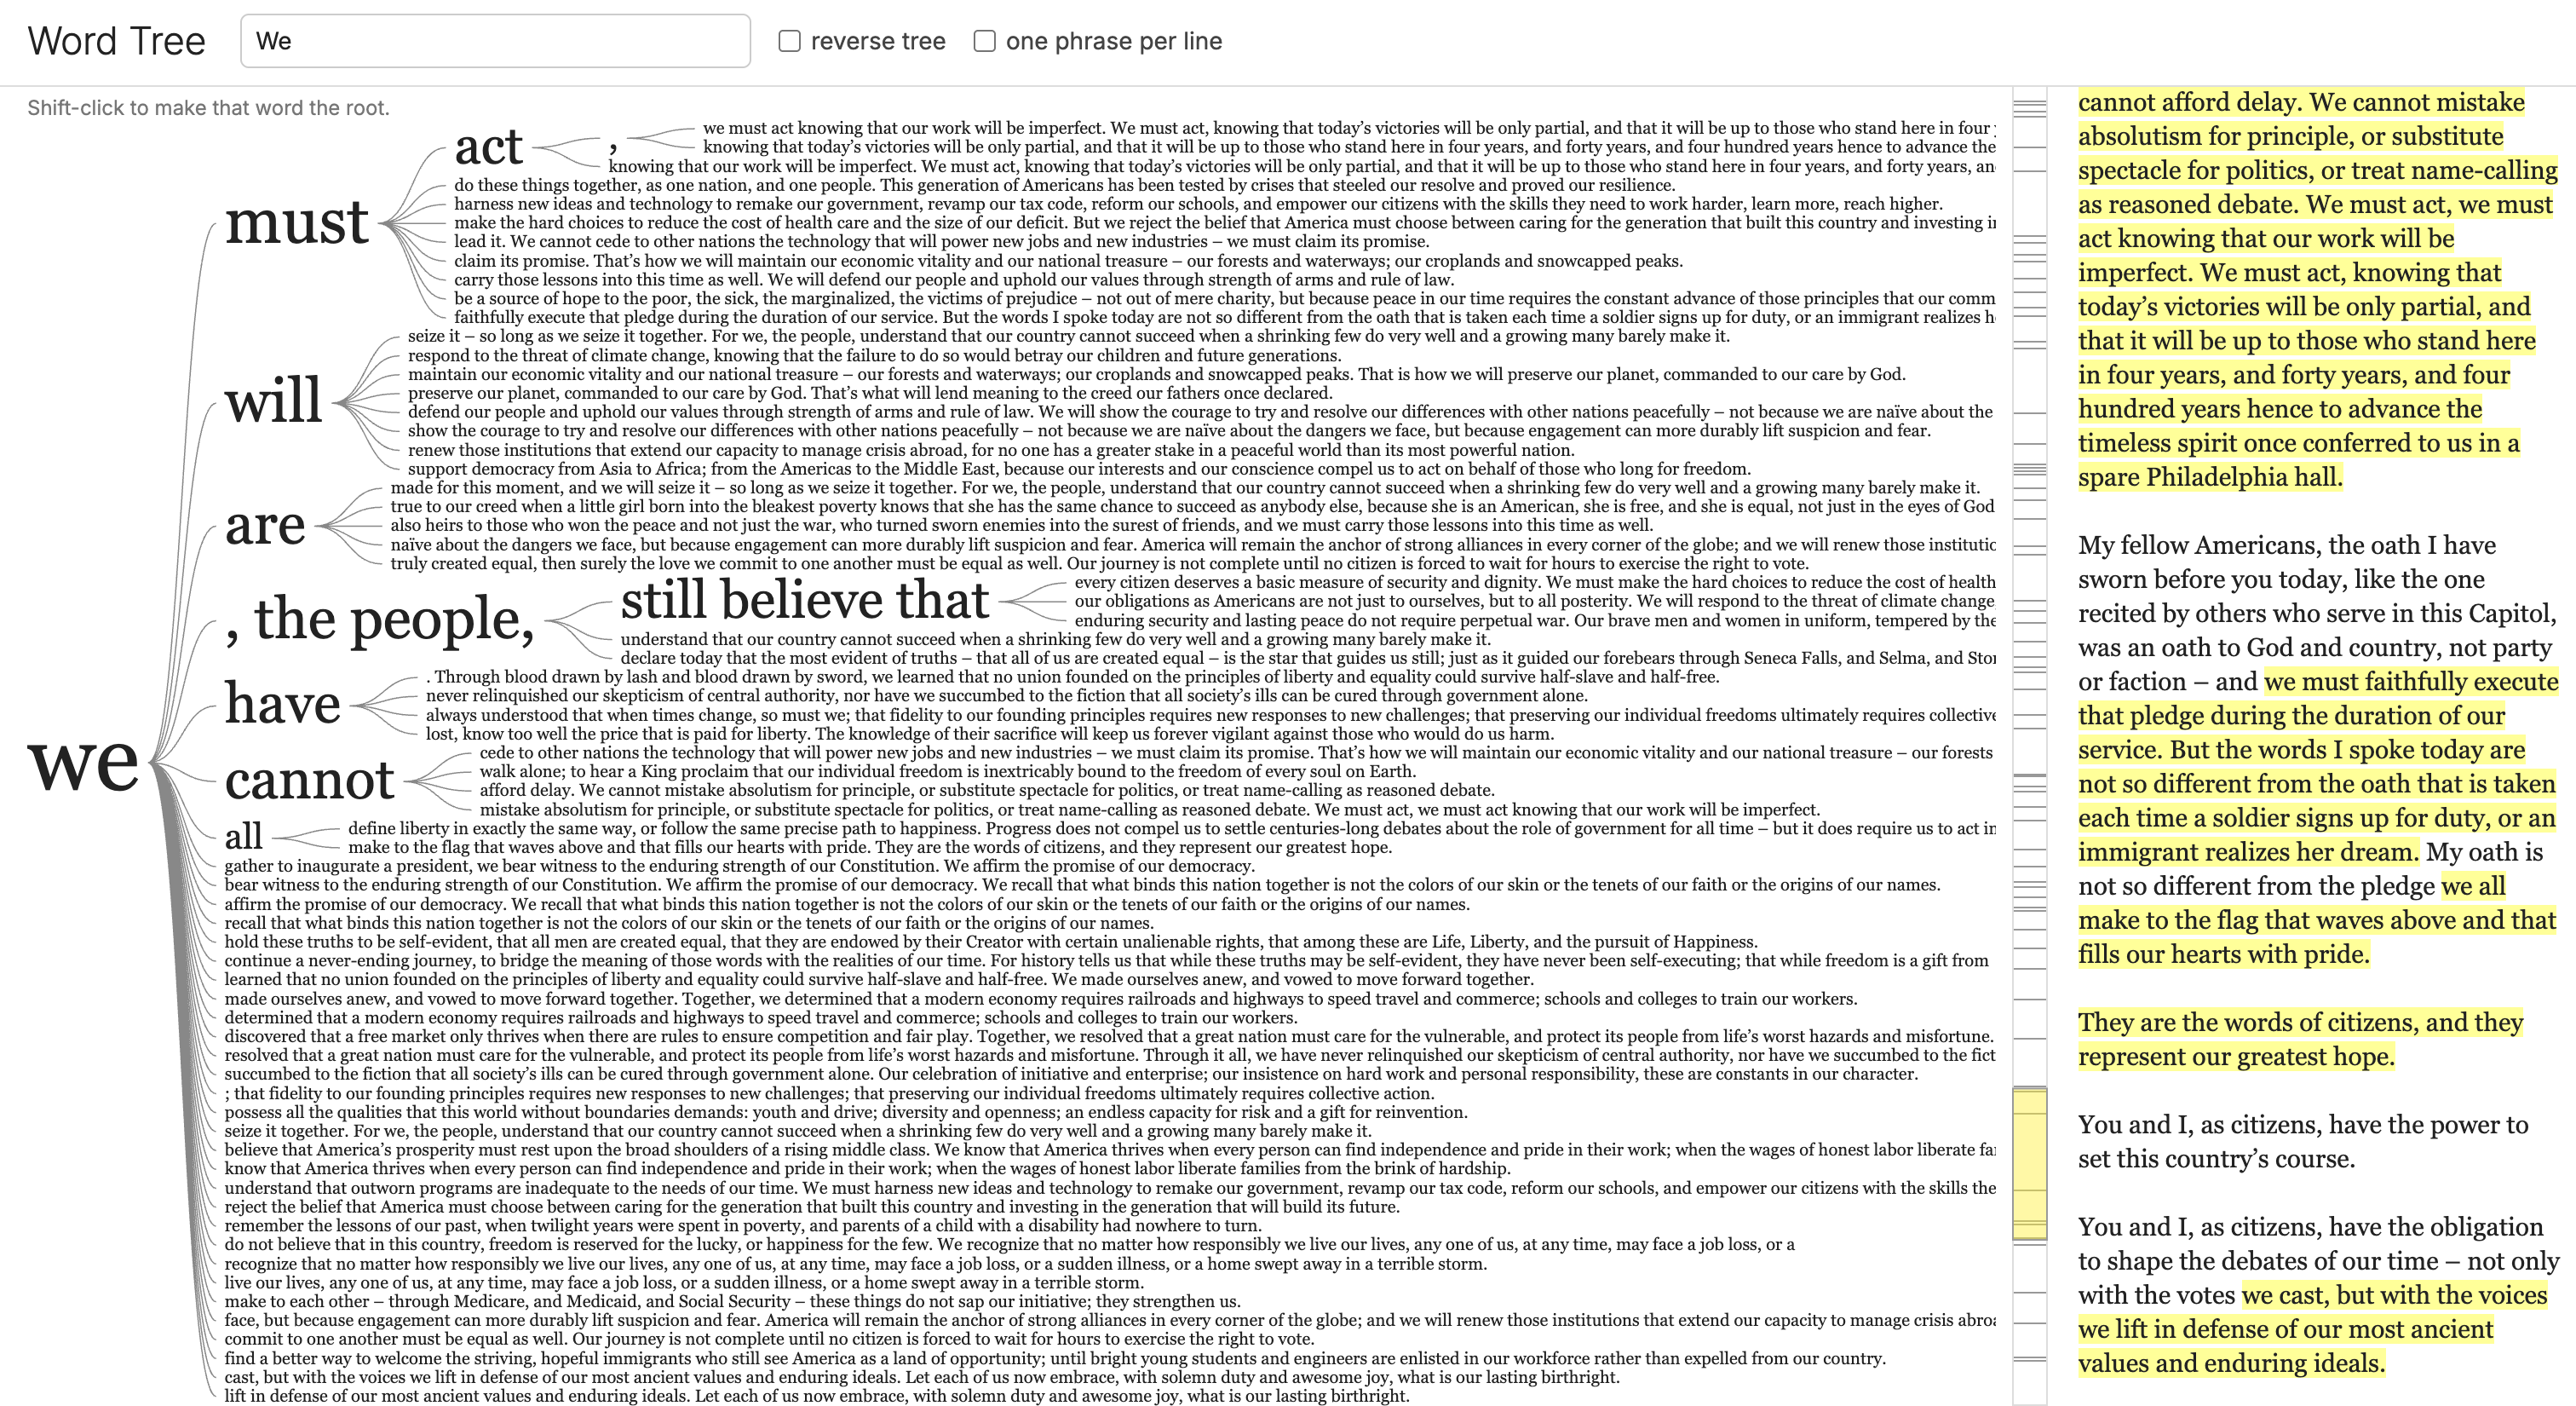
Flowing Data: <a href="https://flowingdata.com/2026/11/11/word-tree-to-visualize-structure-in-a-body-of-text/"><strong>Word Tree to visualize structure in a body of text</strong></a>, November 11
Flowing Data: Word Tree to visualize structure in a body of text, November 11
The Philadelphia Inquirer: <a href="https://www.inquirer.com/news/inq2/ss-united-states-reef-sinking-process-florida-20261111.html?id=g01h7gvDvekLg&amp;utm_source=social&amp;utm_campaign=gift_link&amp;utm_medium=referral"><strong>Sinking an icon</strong></a>, November 11
The Philadelphia Inquirer: Sinking an icon, November 11
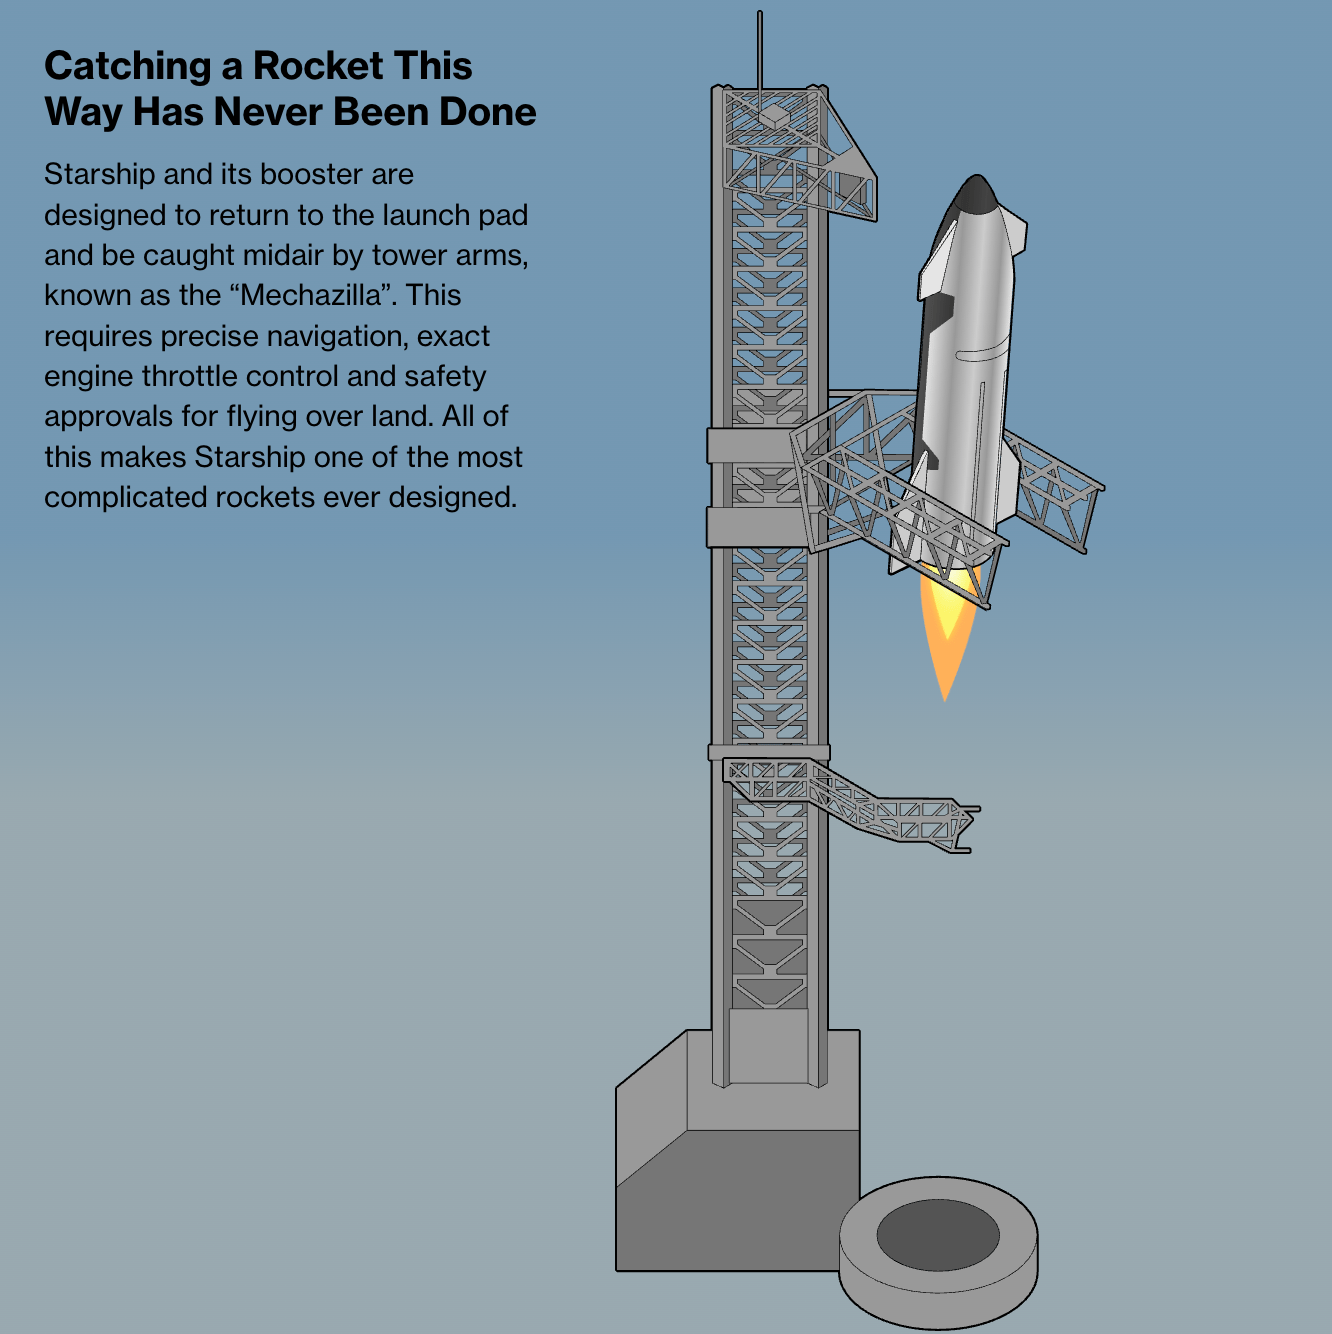
Bloomberg: <a href="https://www.bloomberg.com/graphics/2026-spacex-starship-rocket-future/?srnd=phx-graphics-v2"><strong>SpaceX’s Future Hinges on Starship. Can It Deliver?</strong></a>, November 13
Bloomberg: SpaceX’s Future Hinges on Starship. Can It Deliver?, November 13

Applications are open for…


Help us make the Data Vis Dispatch better! Let us know which newsletters, blogs, or social media accounts we should follow to learn about interesting projects, especially from less-covered parts of the world (Asia, South America, Africa). And if you’ve published something new in the last week, we’d love to see it. Write to us at blog@datawrapper.de. (Please note that we don't have the capacity to respond to obviously AI-generated requests.) Want to make sure you never miss a Dispatch? Sign up for our Data Vis Dispatch newsletter.
Portrait of Michelle Otiji

Michelle Otiji (she/her) is a working student on Datawrapper’s communications team. She creates the Data Vis Dispatch to keep data visualization enthusiasts up to date on exciting new projects. Michelle studies interface design in Potsdam.

Sign up to our newsletters to get notified about everything new on our blog.