This article is brought to you by Datawrapper, a data visualization tool for creating charts, maps, and tables. Learn more.

All Blog Categories

Data Vis Dispatch, November 10: A blue wave, pi, and the pancake index

The best of last week’s big and small data visualizations
Portrait of Michelle Otiji
Michelle Otiji

Welcome back to the 270th edition of Data Vis Dispatch! Every week, we’ll be publishing a collection of the best small and large data visualizations we find, especially from news organizations — to celebrate data journalism, data visualization, simple charts, elaborate maps, and their creators.

Recurring topics this week include the Democrats' historic blue wave, pi, and the pancake index.

We begin this week by taking a look at the historic results of the U.S. midterm elections, which saw the Democrats secure a victory after winning many of the competitive races, despite the Republicans' redistricting efforts. Slow vote counting delayed results in some areas, while tech and AI-related stocks declined following the Democrats' win.
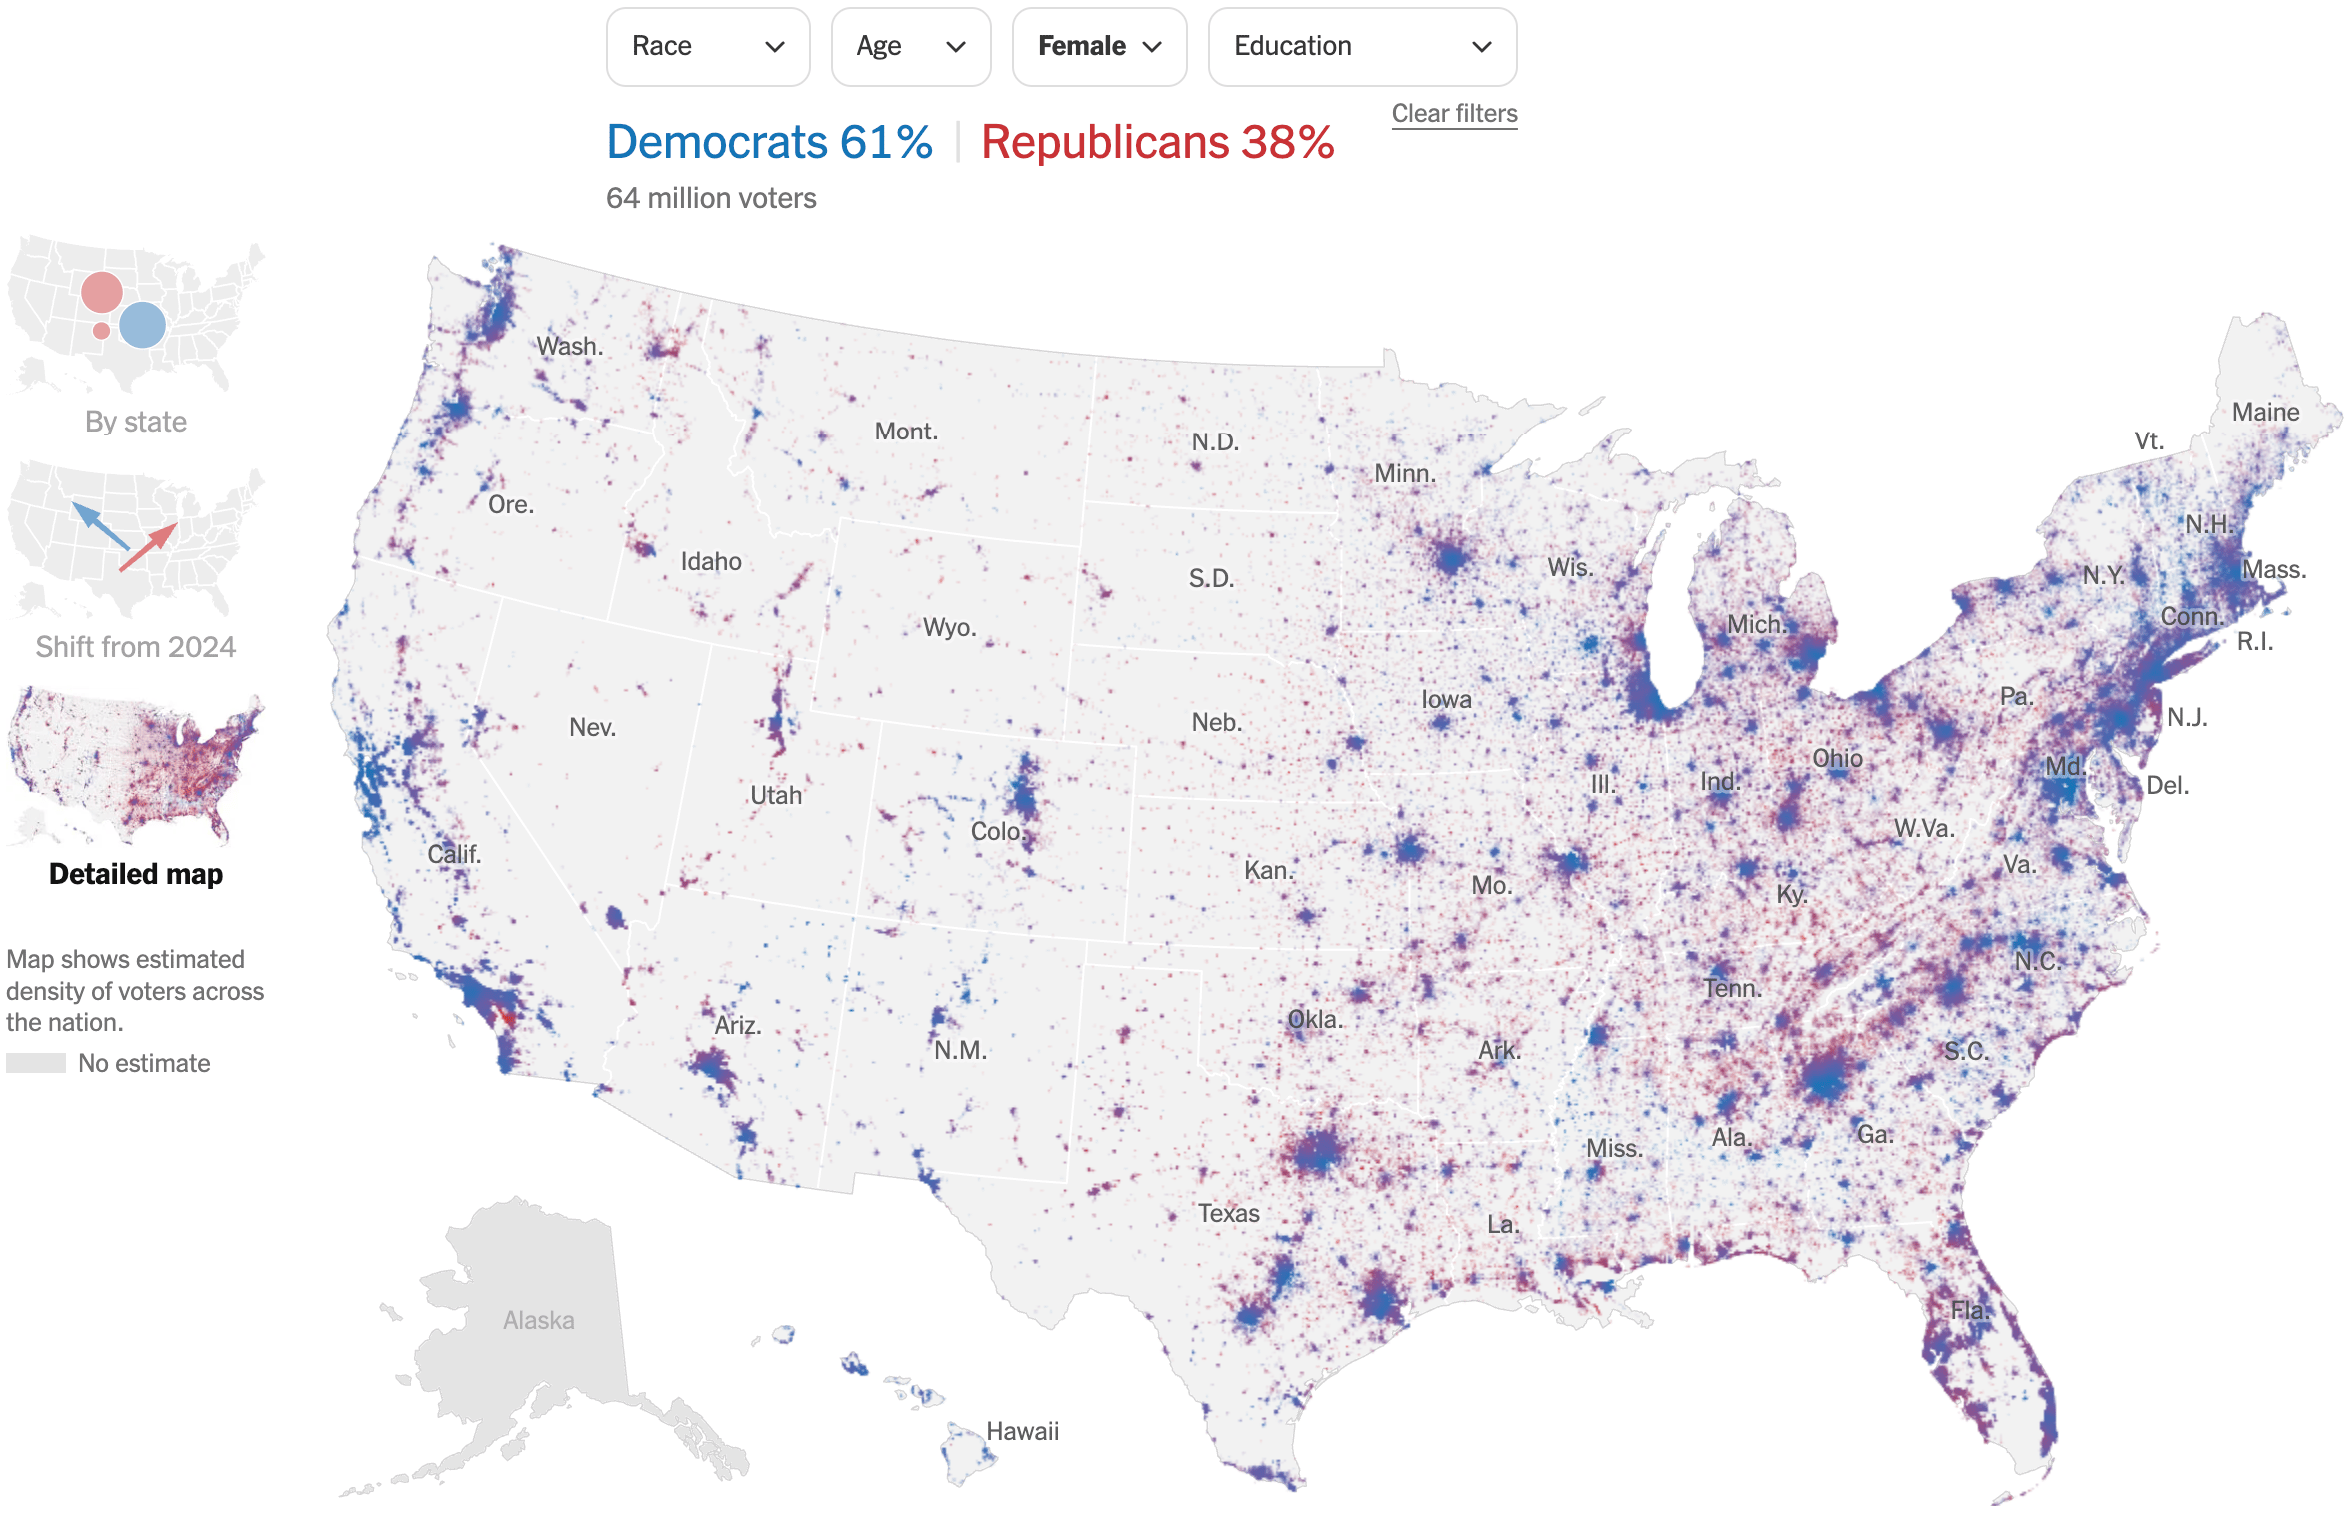
The New York Times: <a href="https://www.nytimes.com/interactive/2026/elections/voter-trends-national.html"><strong>How Americans Voted in 2026</strong></a>, November 7 <span class="badge">Explore and filter through the results of the elections</span>
The New York Times: How Americans Voted in 2026, November 7 Explore and filter through the results of the elections
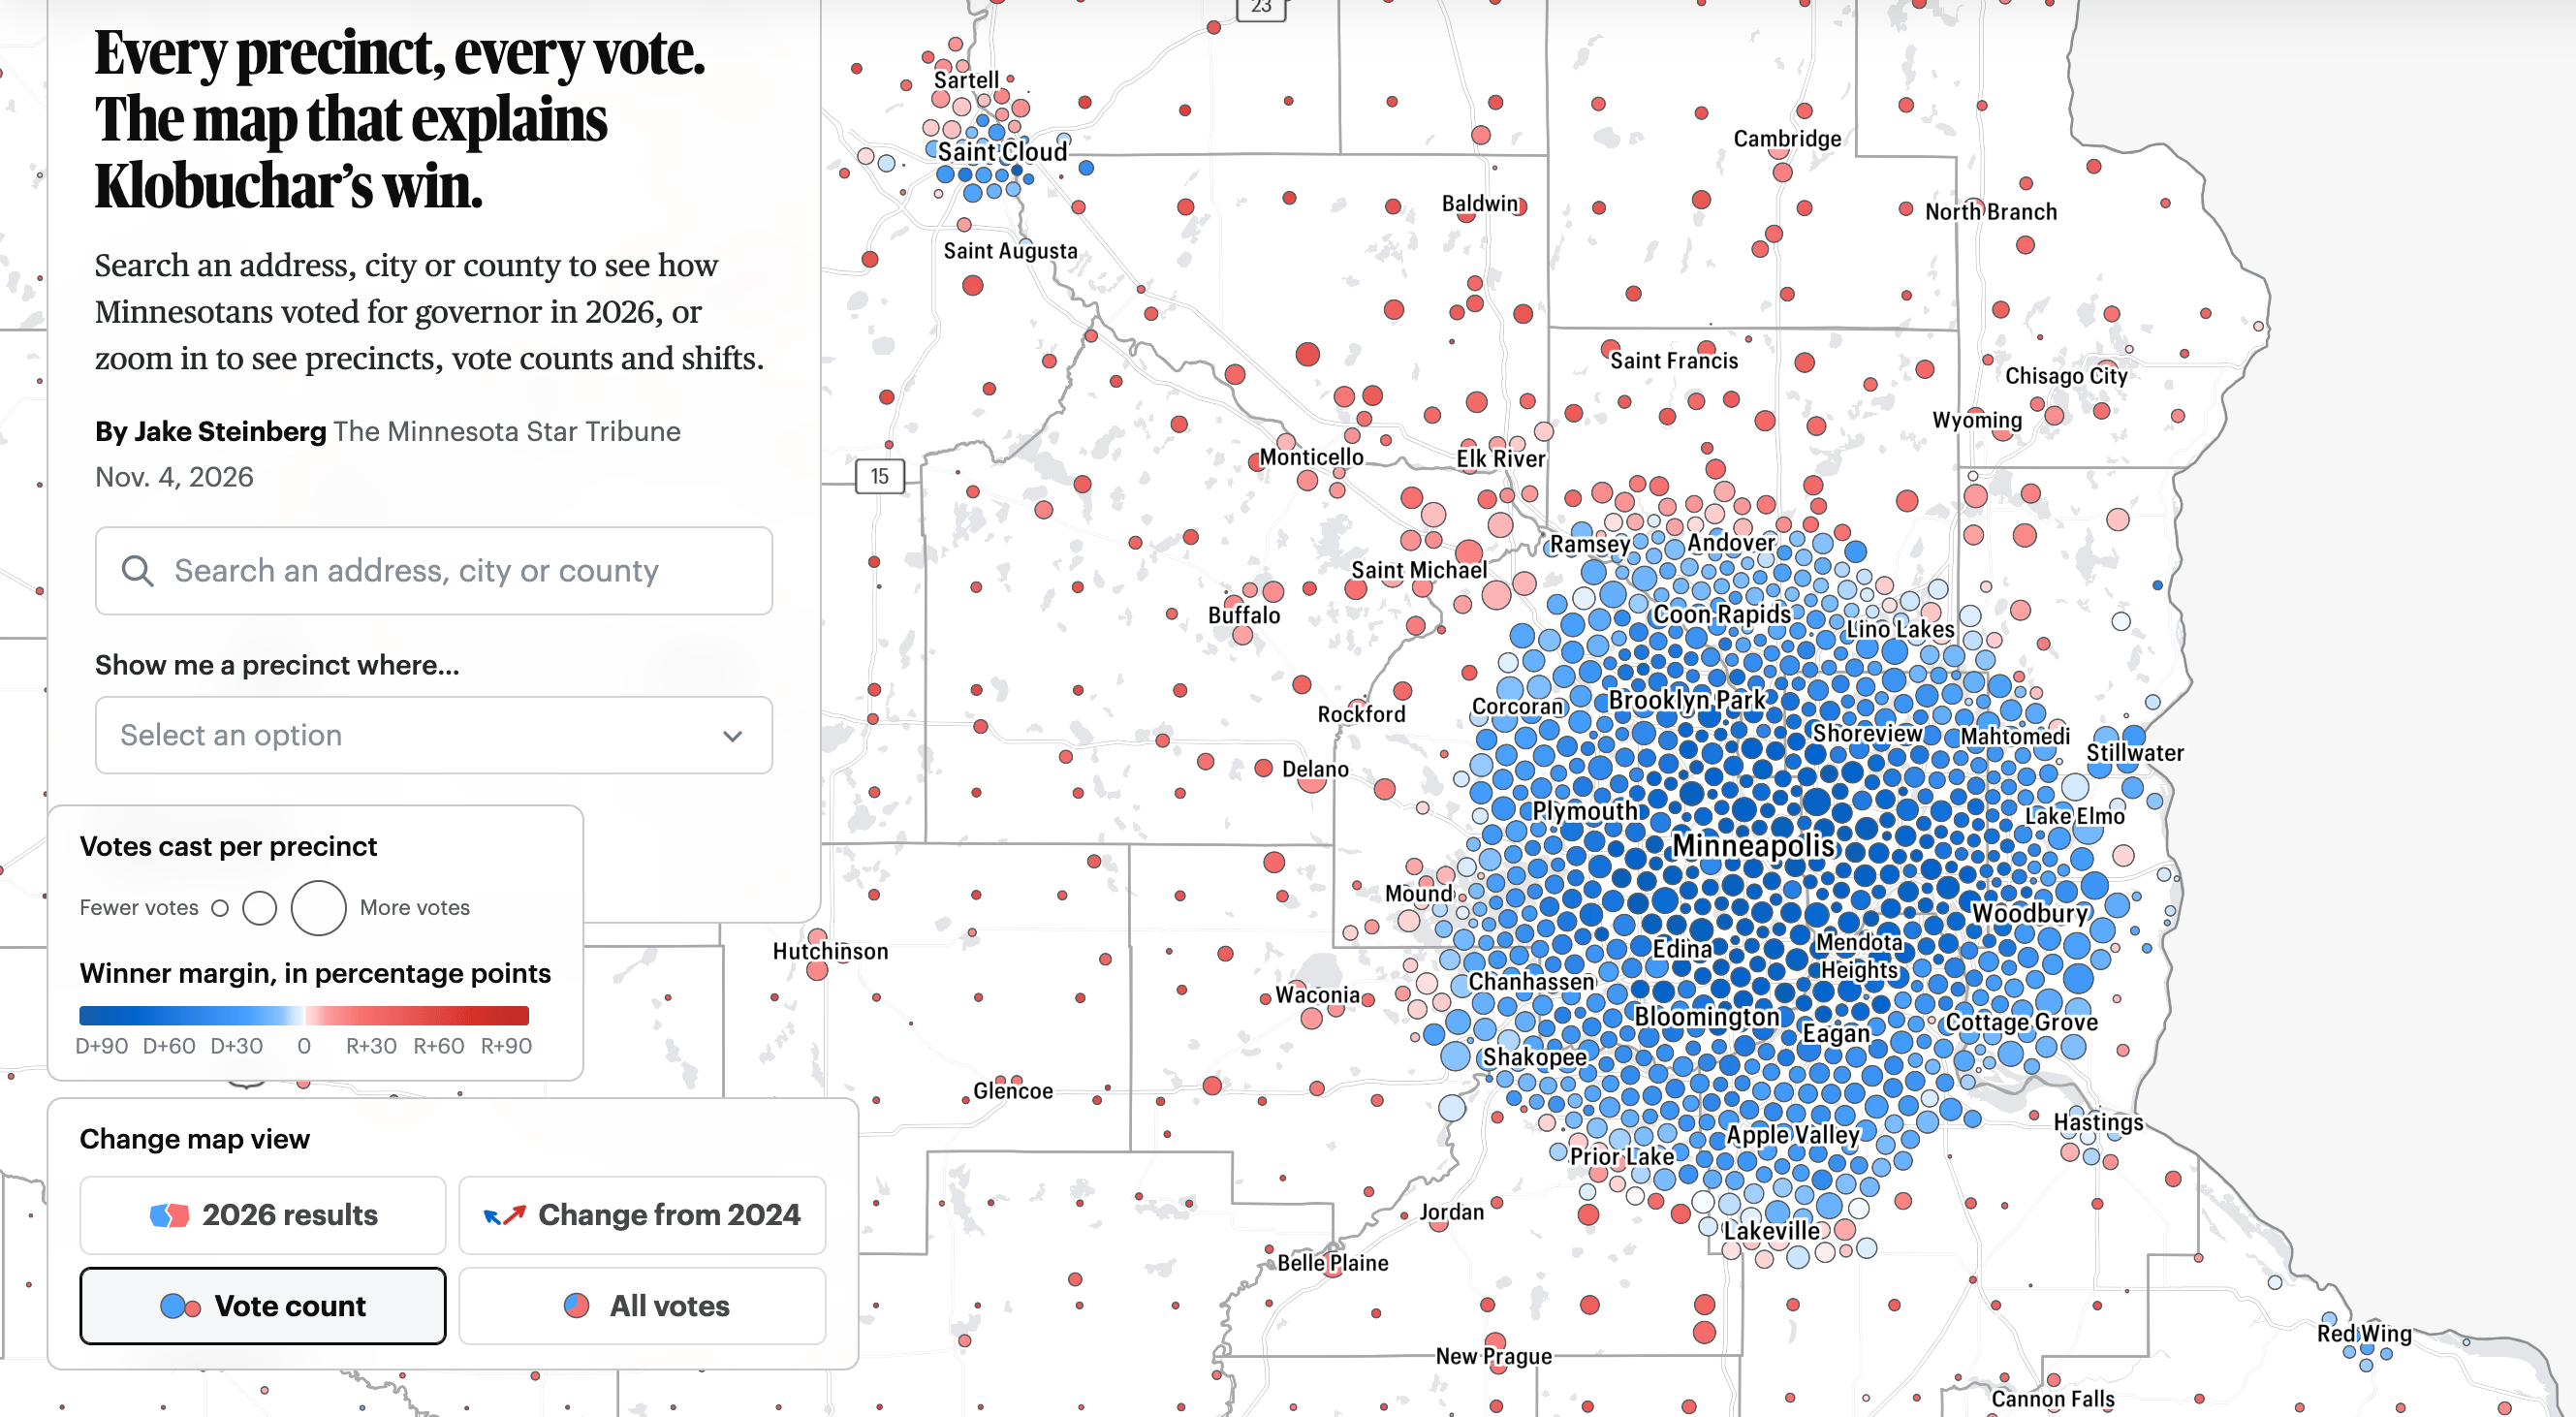
The Minnesota Star Tribune: <a href="https://www.startribune.com/every-precinct-vote-map-explains-amy-klobuchar-minnesota-governor-shift/601884985?utm_source=copy"><strong>Every precinct, every vote. The map that explains Klobuchar’s win</strong></a>, November 4
The Minnesota Star Tribune: Every precinct, every vote. The map that explains Klobuchar’s win, November 4
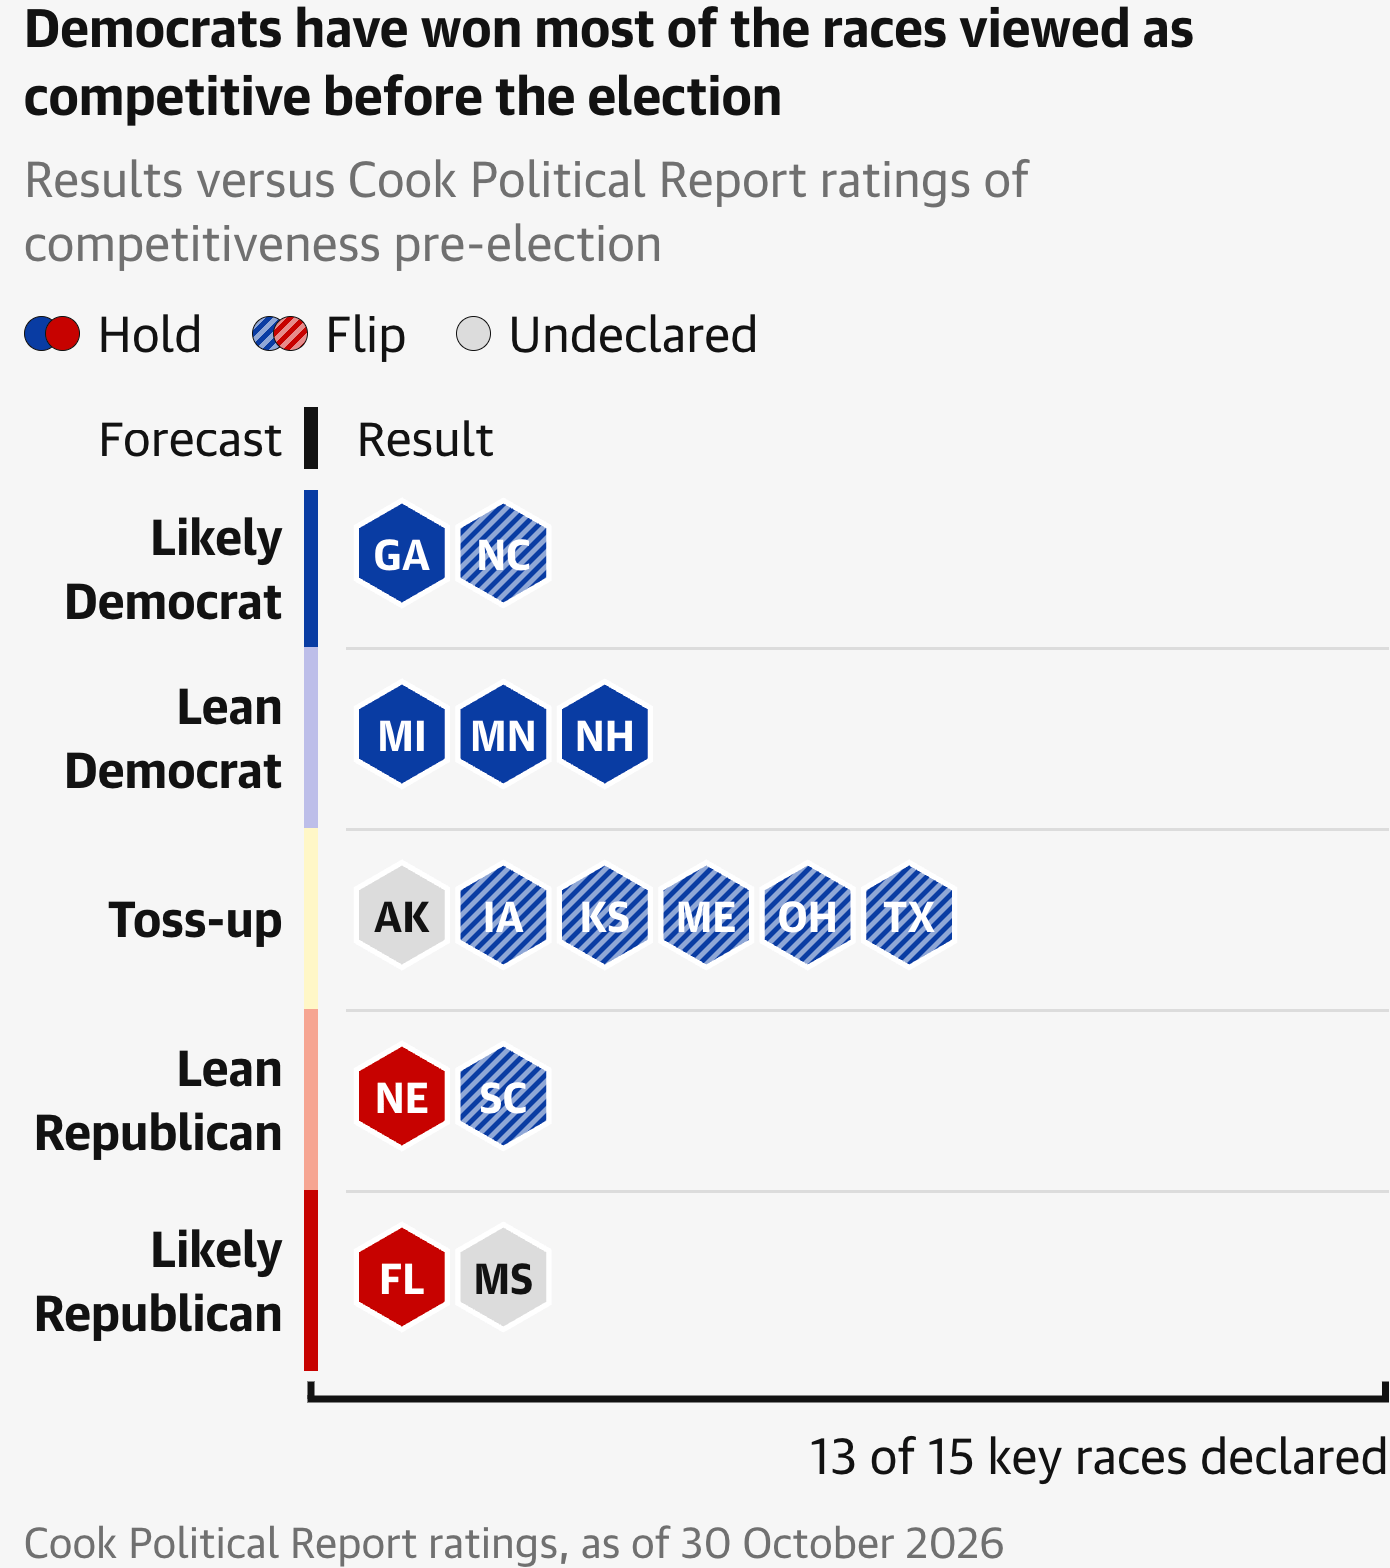
The Guardian: <a href="https://www.theguardian.com/us-news/ng-interactive/2026/nov/04/midterm-election-results-maps-guide"><strong>Where Trump and Republicans lost the midterms – a visual analysis of the key states</strong></a>, November 5
The Guardian: Where Trump and Republicans lost the midterms – a visual analysis of the key states, November 5
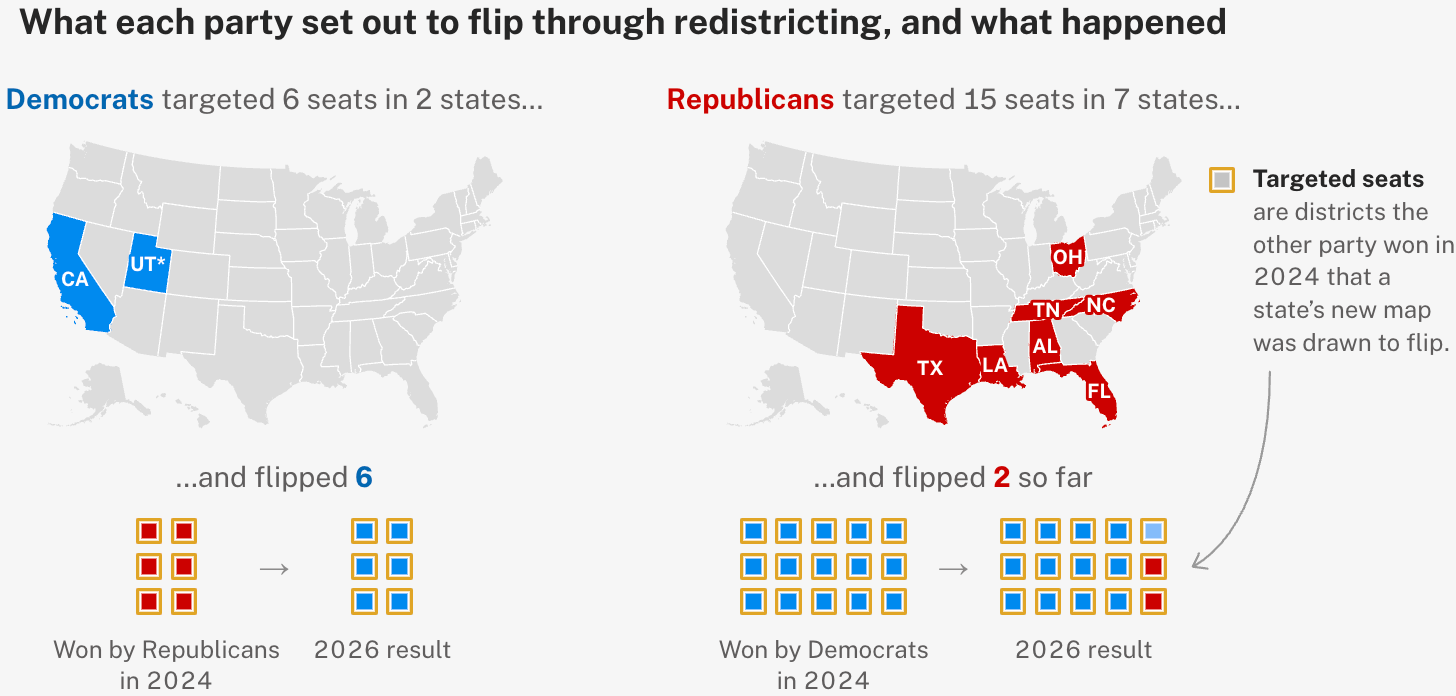
CNN: <a href="https://edition.cnn.com/politics/redistricting-midterms-republicans-congressional-maps-vis"><strong>Republican redistricting efforts collapse under blue wave</strong></a>, November 8
CNN: Republican redistricting efforts collapse under blue wave, November 8
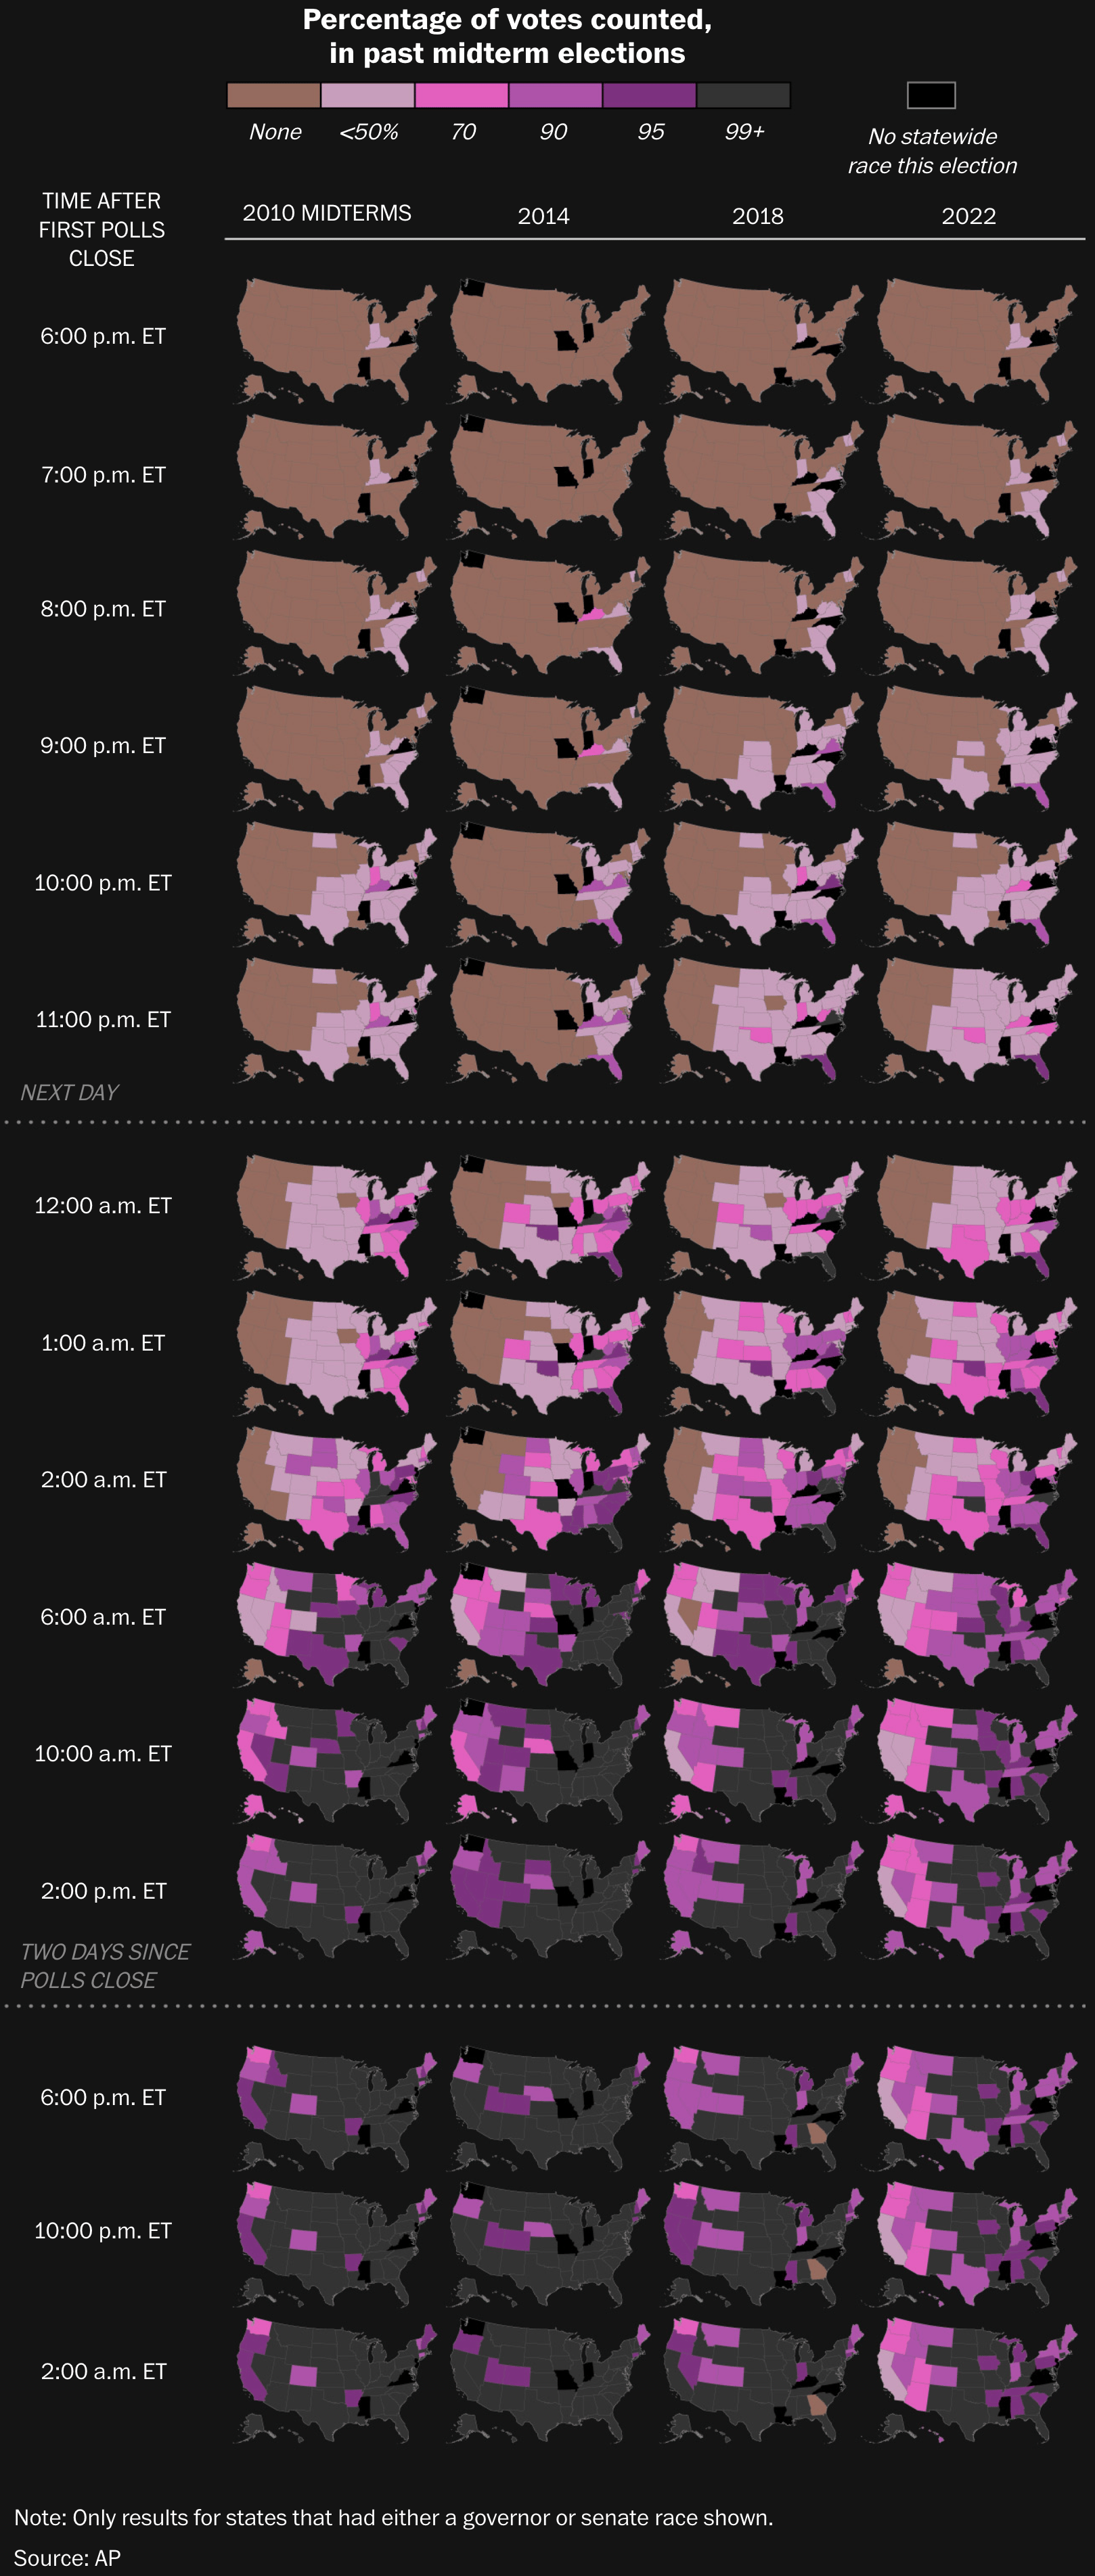
The Washington Post: <a href="https://www.washingtonpost.com/politics/interactive/2026/11/03/see-where-votes-are-being-counted-senate-house-midterm-races/"><strong>See where votes are being counted in Senate and House midterm races</strong></a>, November 4
The Washington Post: See where votes are being counted in Senate and House midterm races, November 4
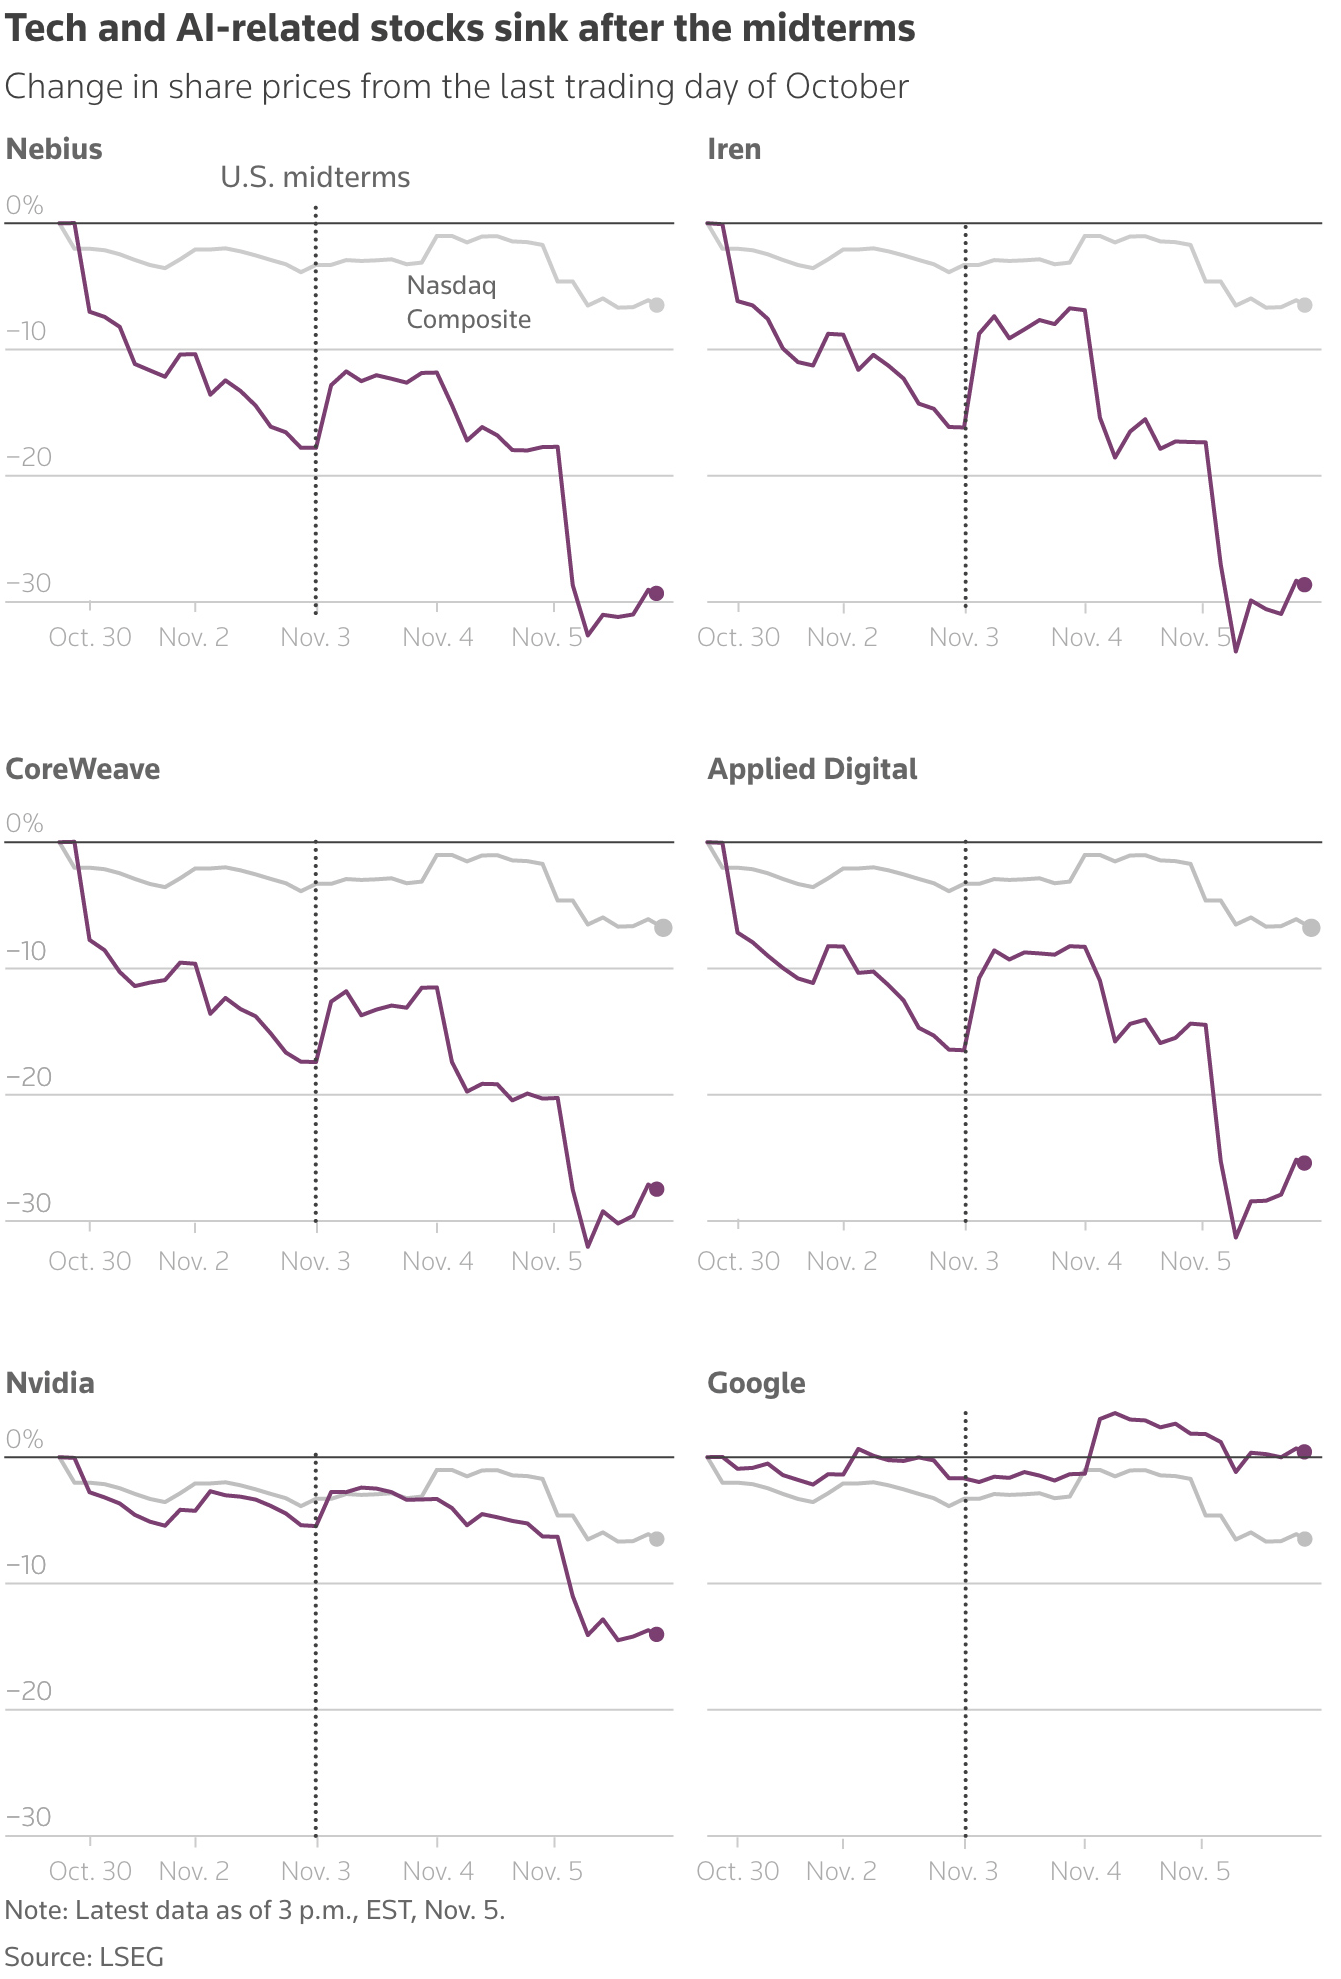
Reuters: <a href="https://www.reuters.com/graphics/US-ELECTIONS/GRAPHICS-BLOG/akpelkldzvr/2026-11-05/midterm-results/"><strong>Data centers took a beating in the midterms. AI firms felt the pain</strong></a>, November 5
Reuters: Data centers took a beating in the midterms. AI firms felt the pain, November 5

Taking a closer look at the results of the U.S. Senate elections, the Democrats flipped multiple seats and secured major victories in Texas. A ranking of prediction markets shows varying levels of prediction accuracy. Meanwhile, despite spending millions on marquee races, Republicans still lost a number of seats.
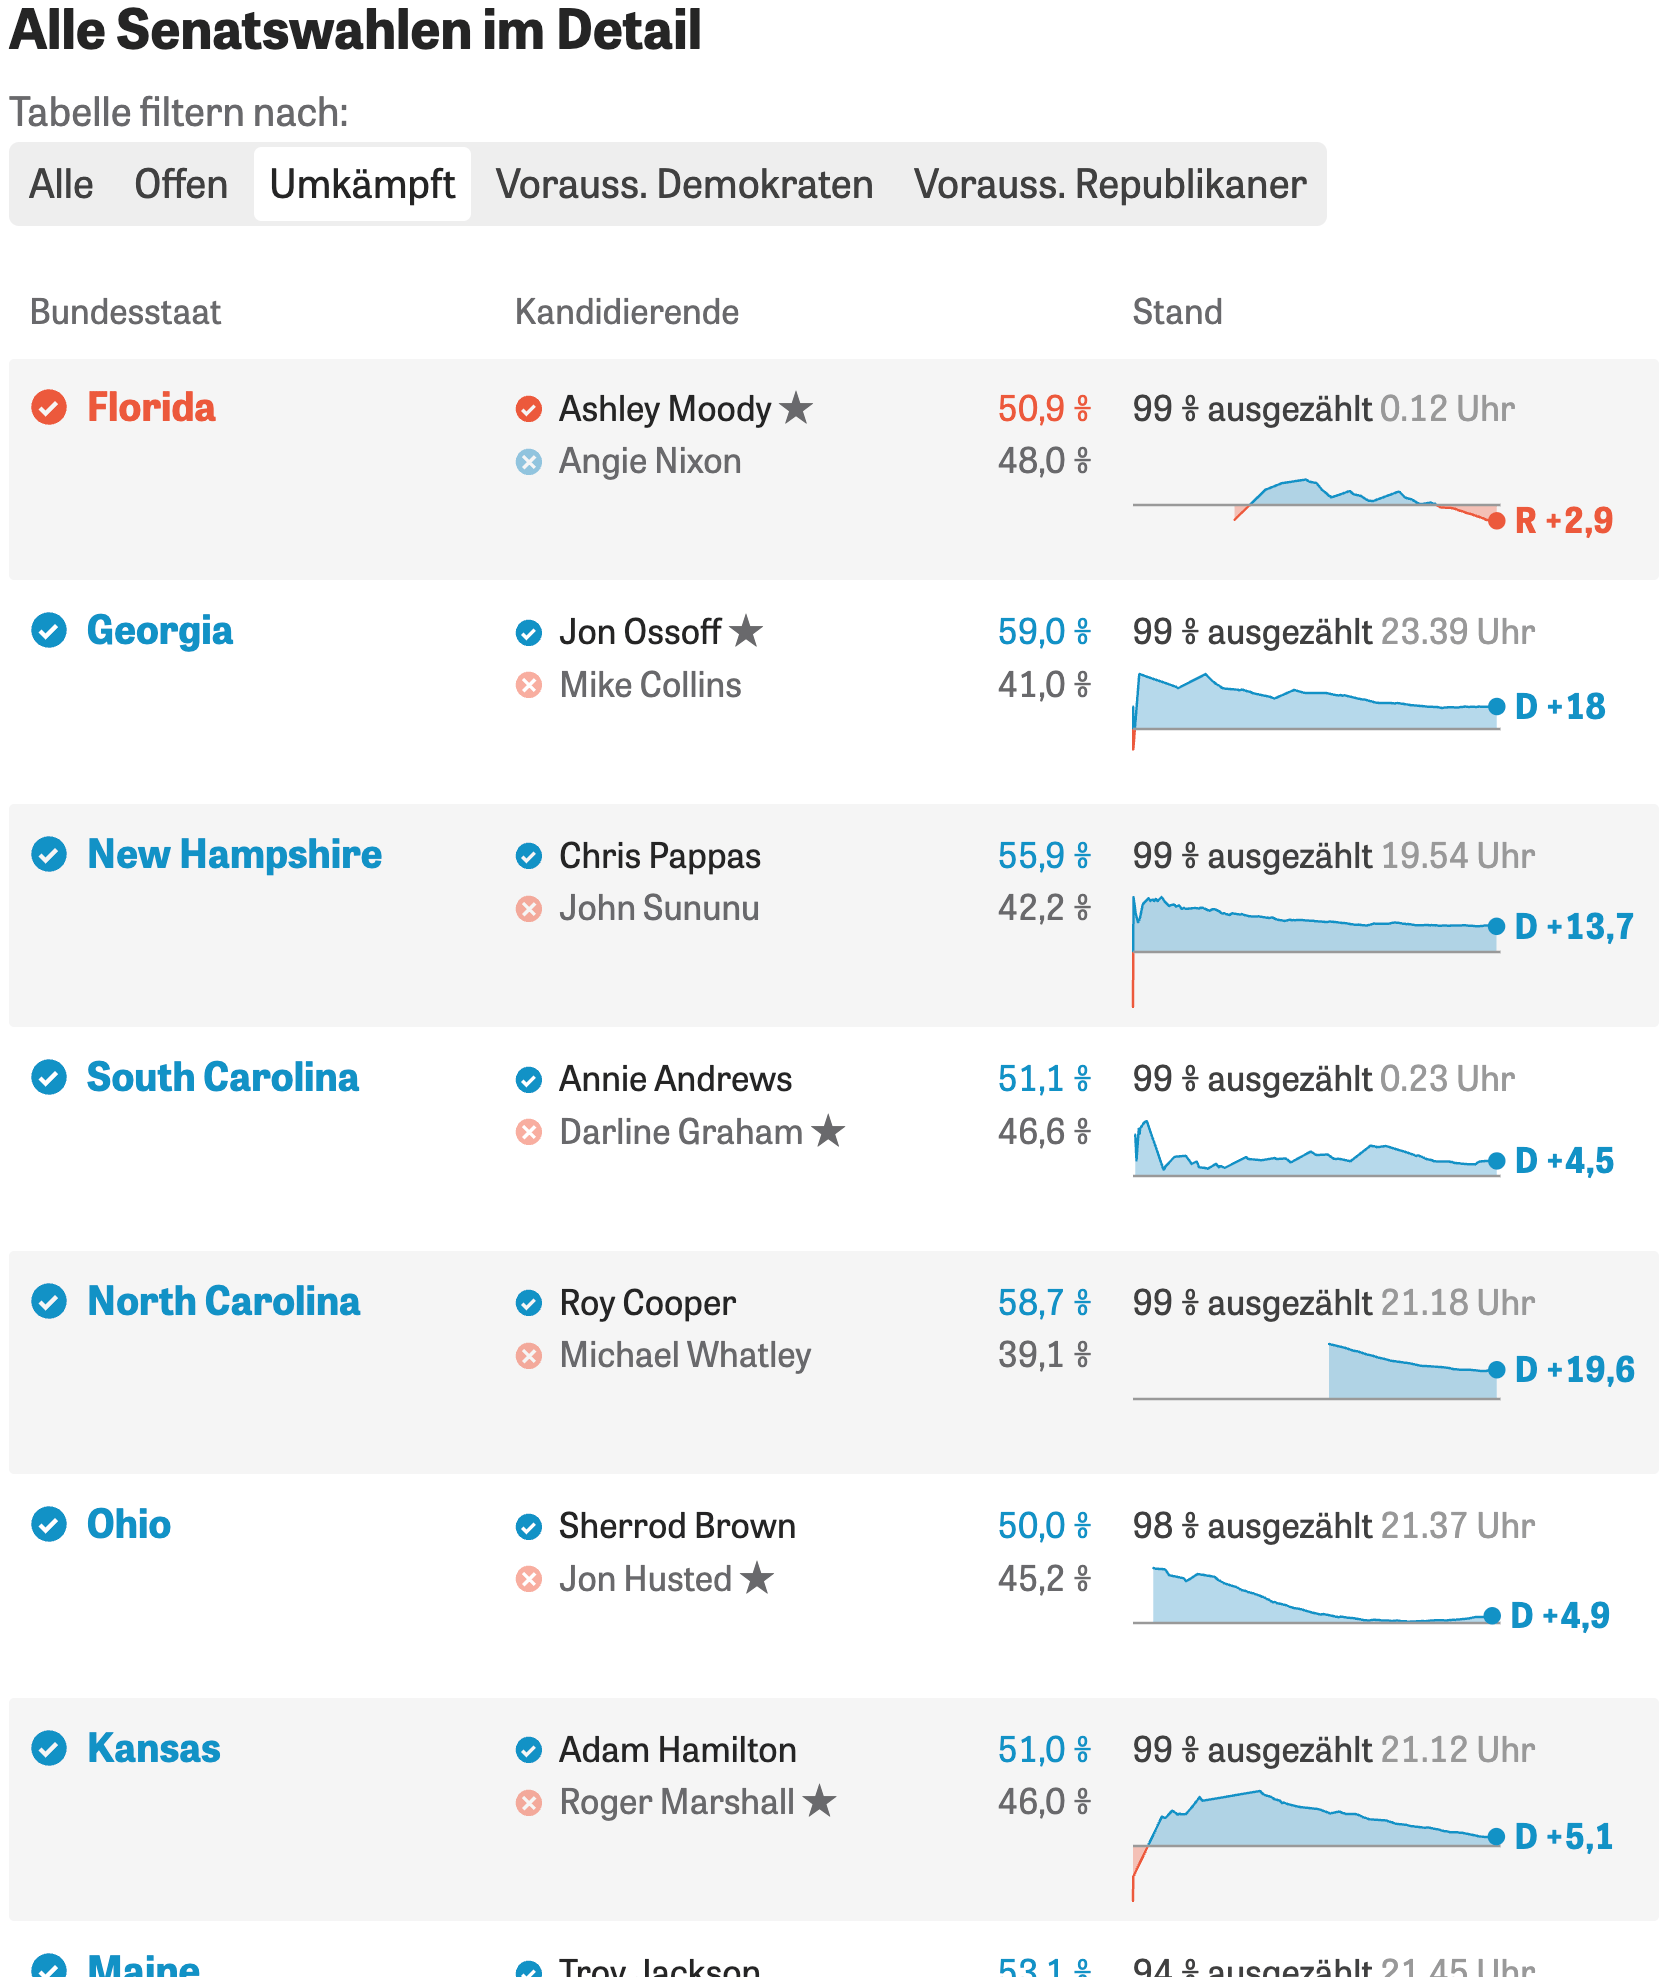
Die Zeit: <a href="https://www.zeit.de/politik/ausland/2026-11/midterms-us-kongresswahlen-ergebnisse-live"><strong>Die Ergebnisse der Midterms 2026</strong></a><strong> </strong>[<em>Chart title: All Senate elections in detail</em>], November 9
Die Zeit: Die Ergebnisse der Midterms 2026 [Chart title: All Senate elections in detail], November 9
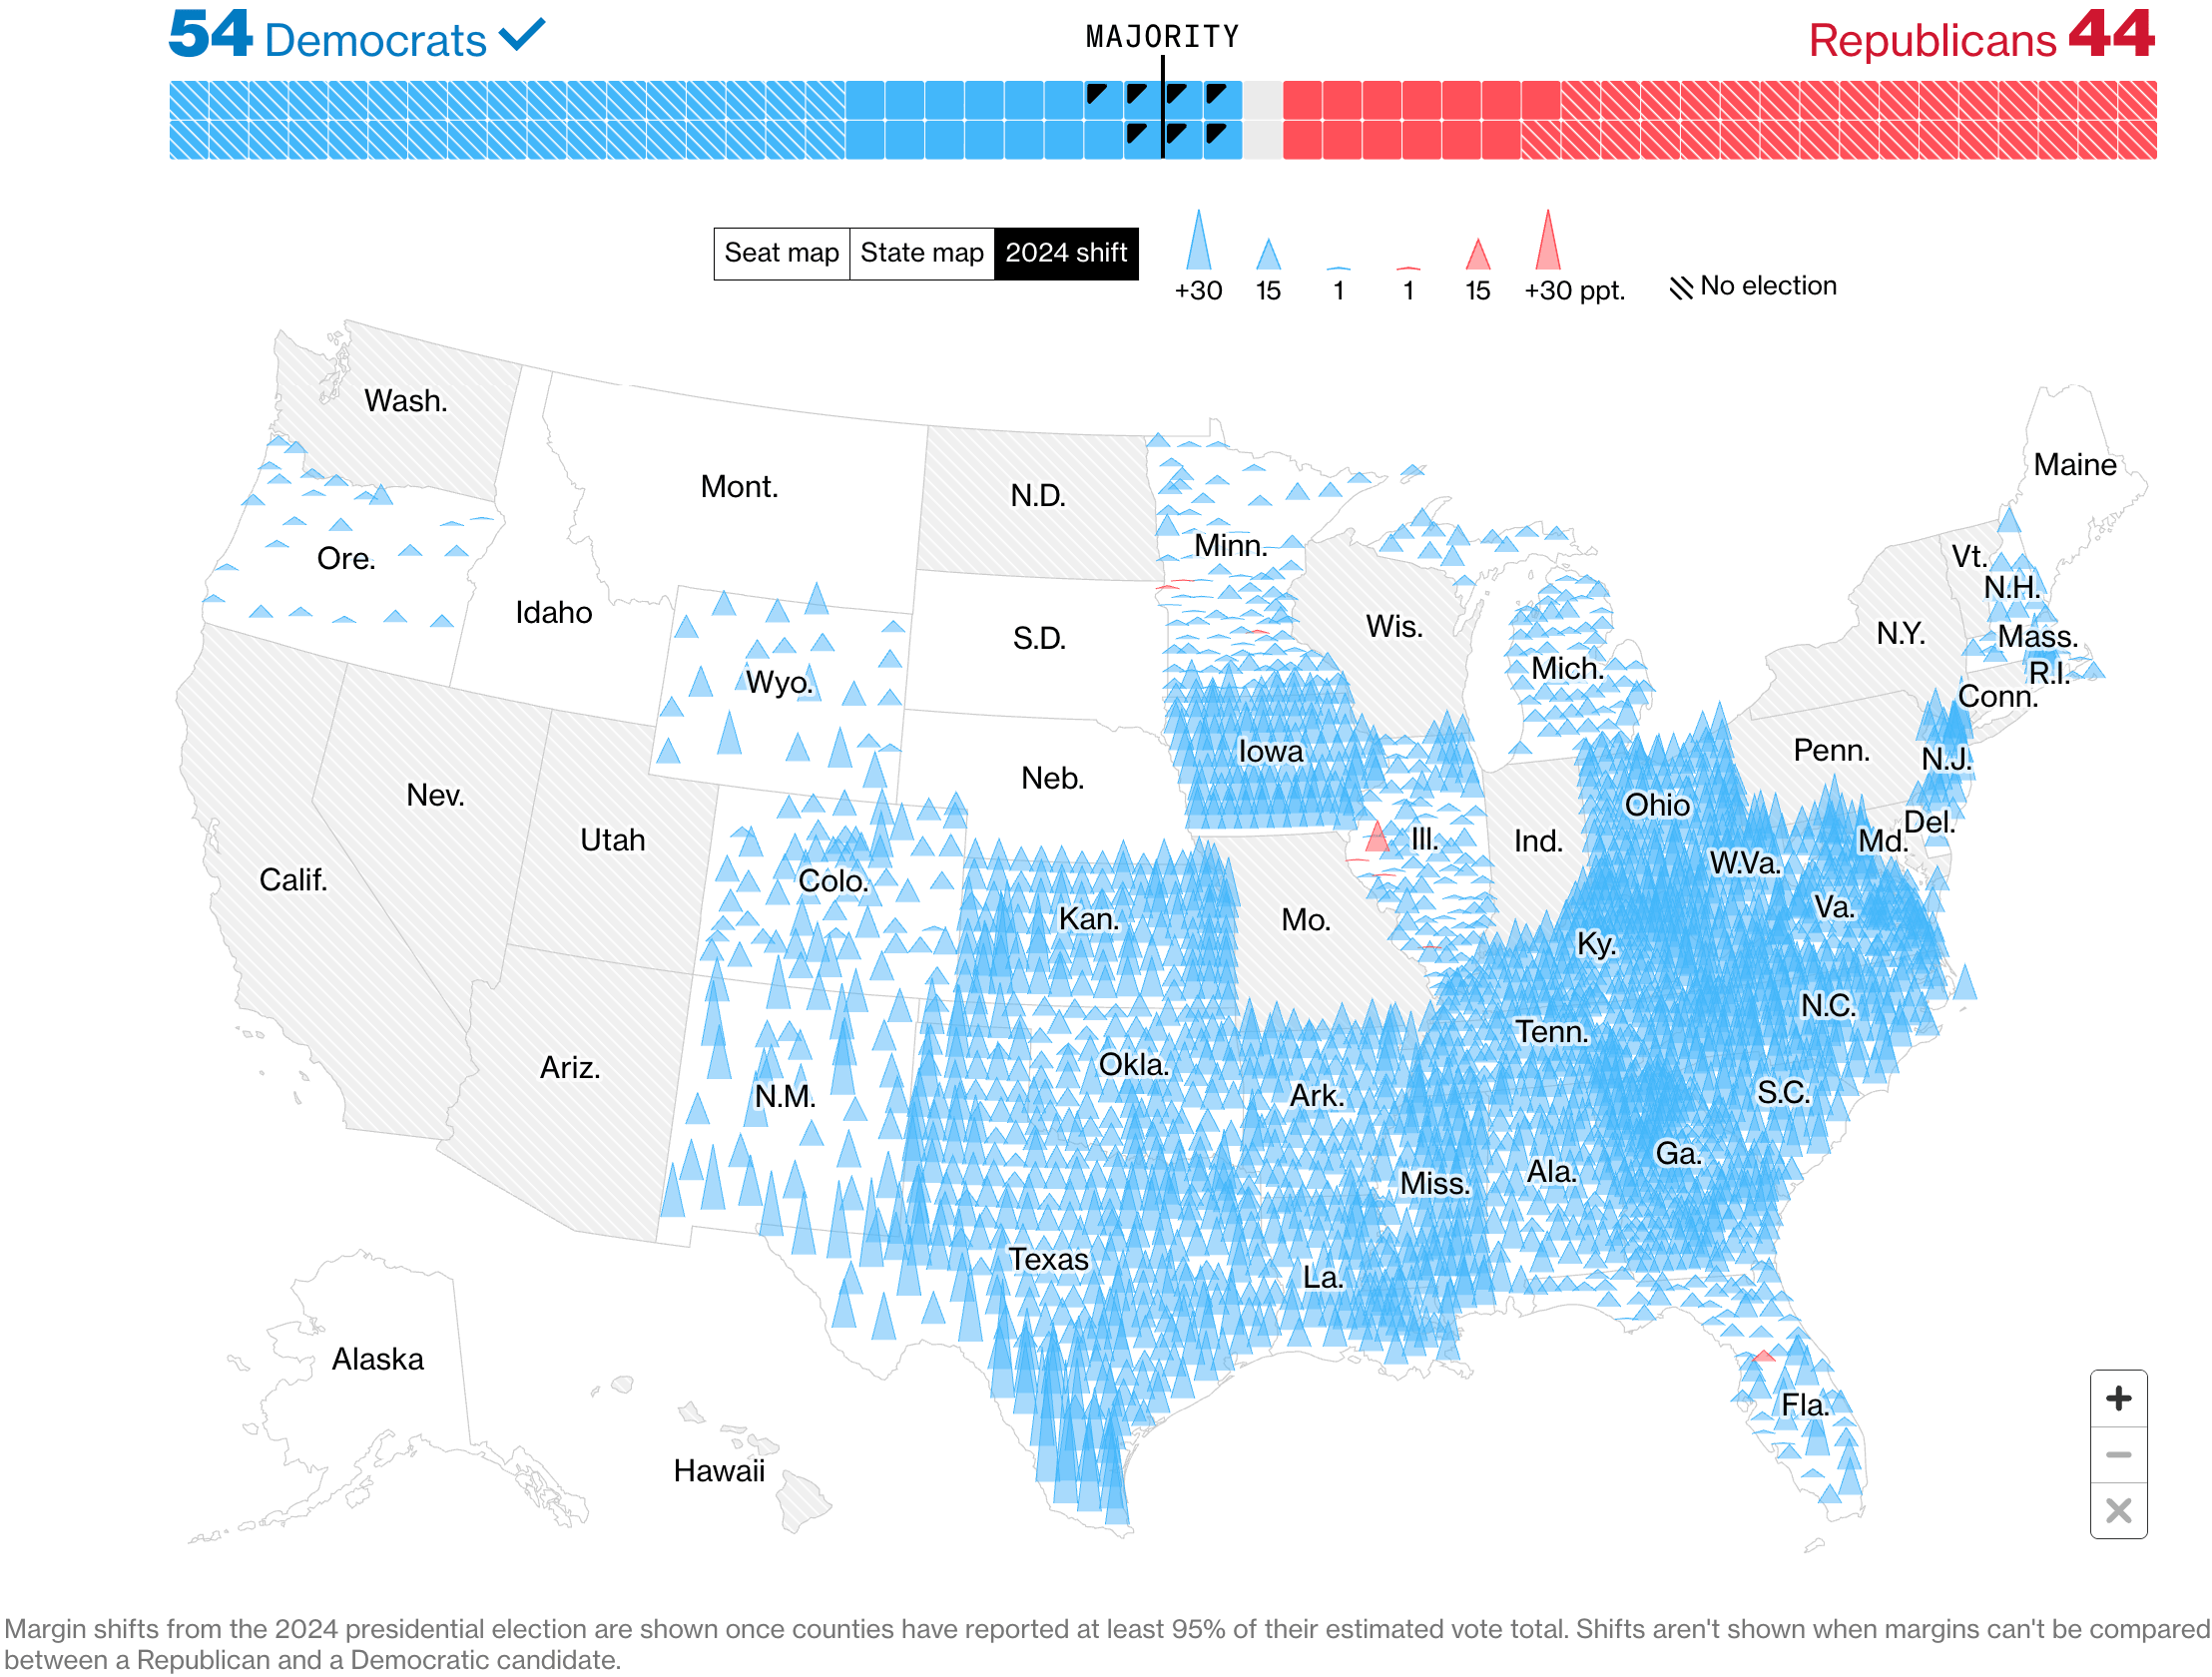
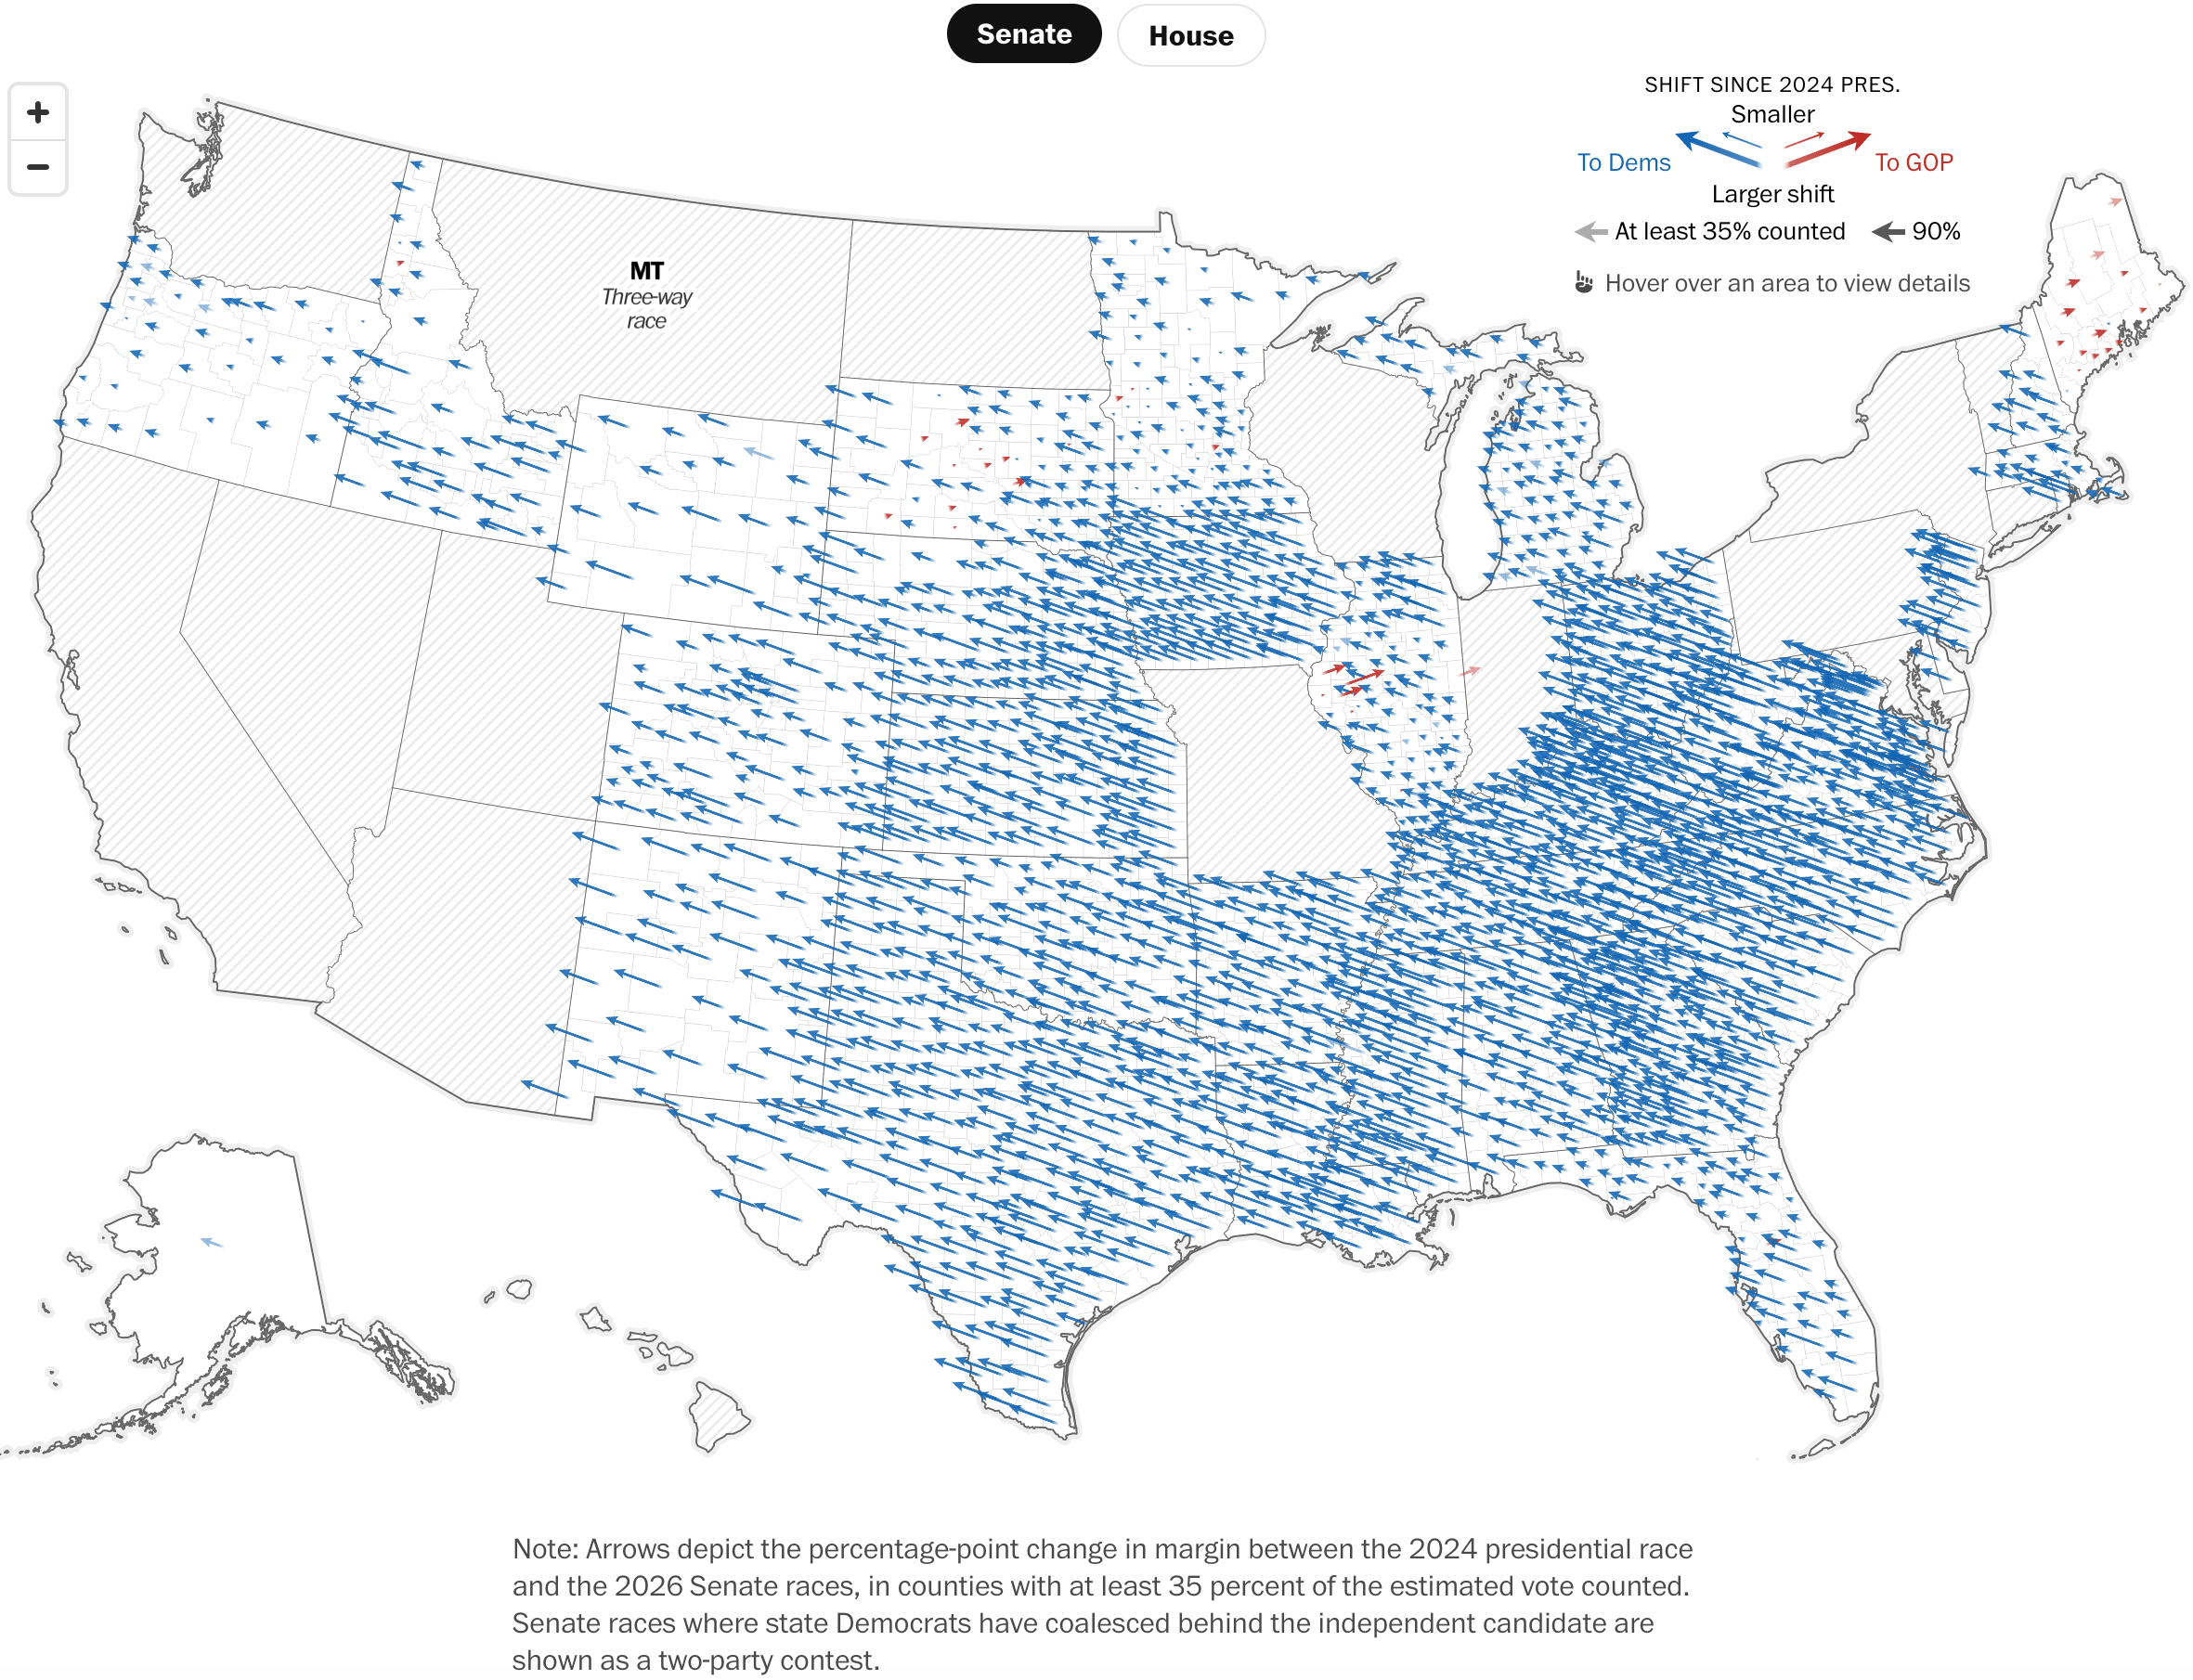
The Washington Post: <a href="https://www.washingtonpost.com/elections/2026/11/03/see-how-counties-are-shifting-2026-midterms/"><strong>Where voters shifted toward Democrats in the 2026 midterms</strong></a>, November 4
The Washington Post: Where voters shifted toward Democrats in the 2026 midterms, November 4
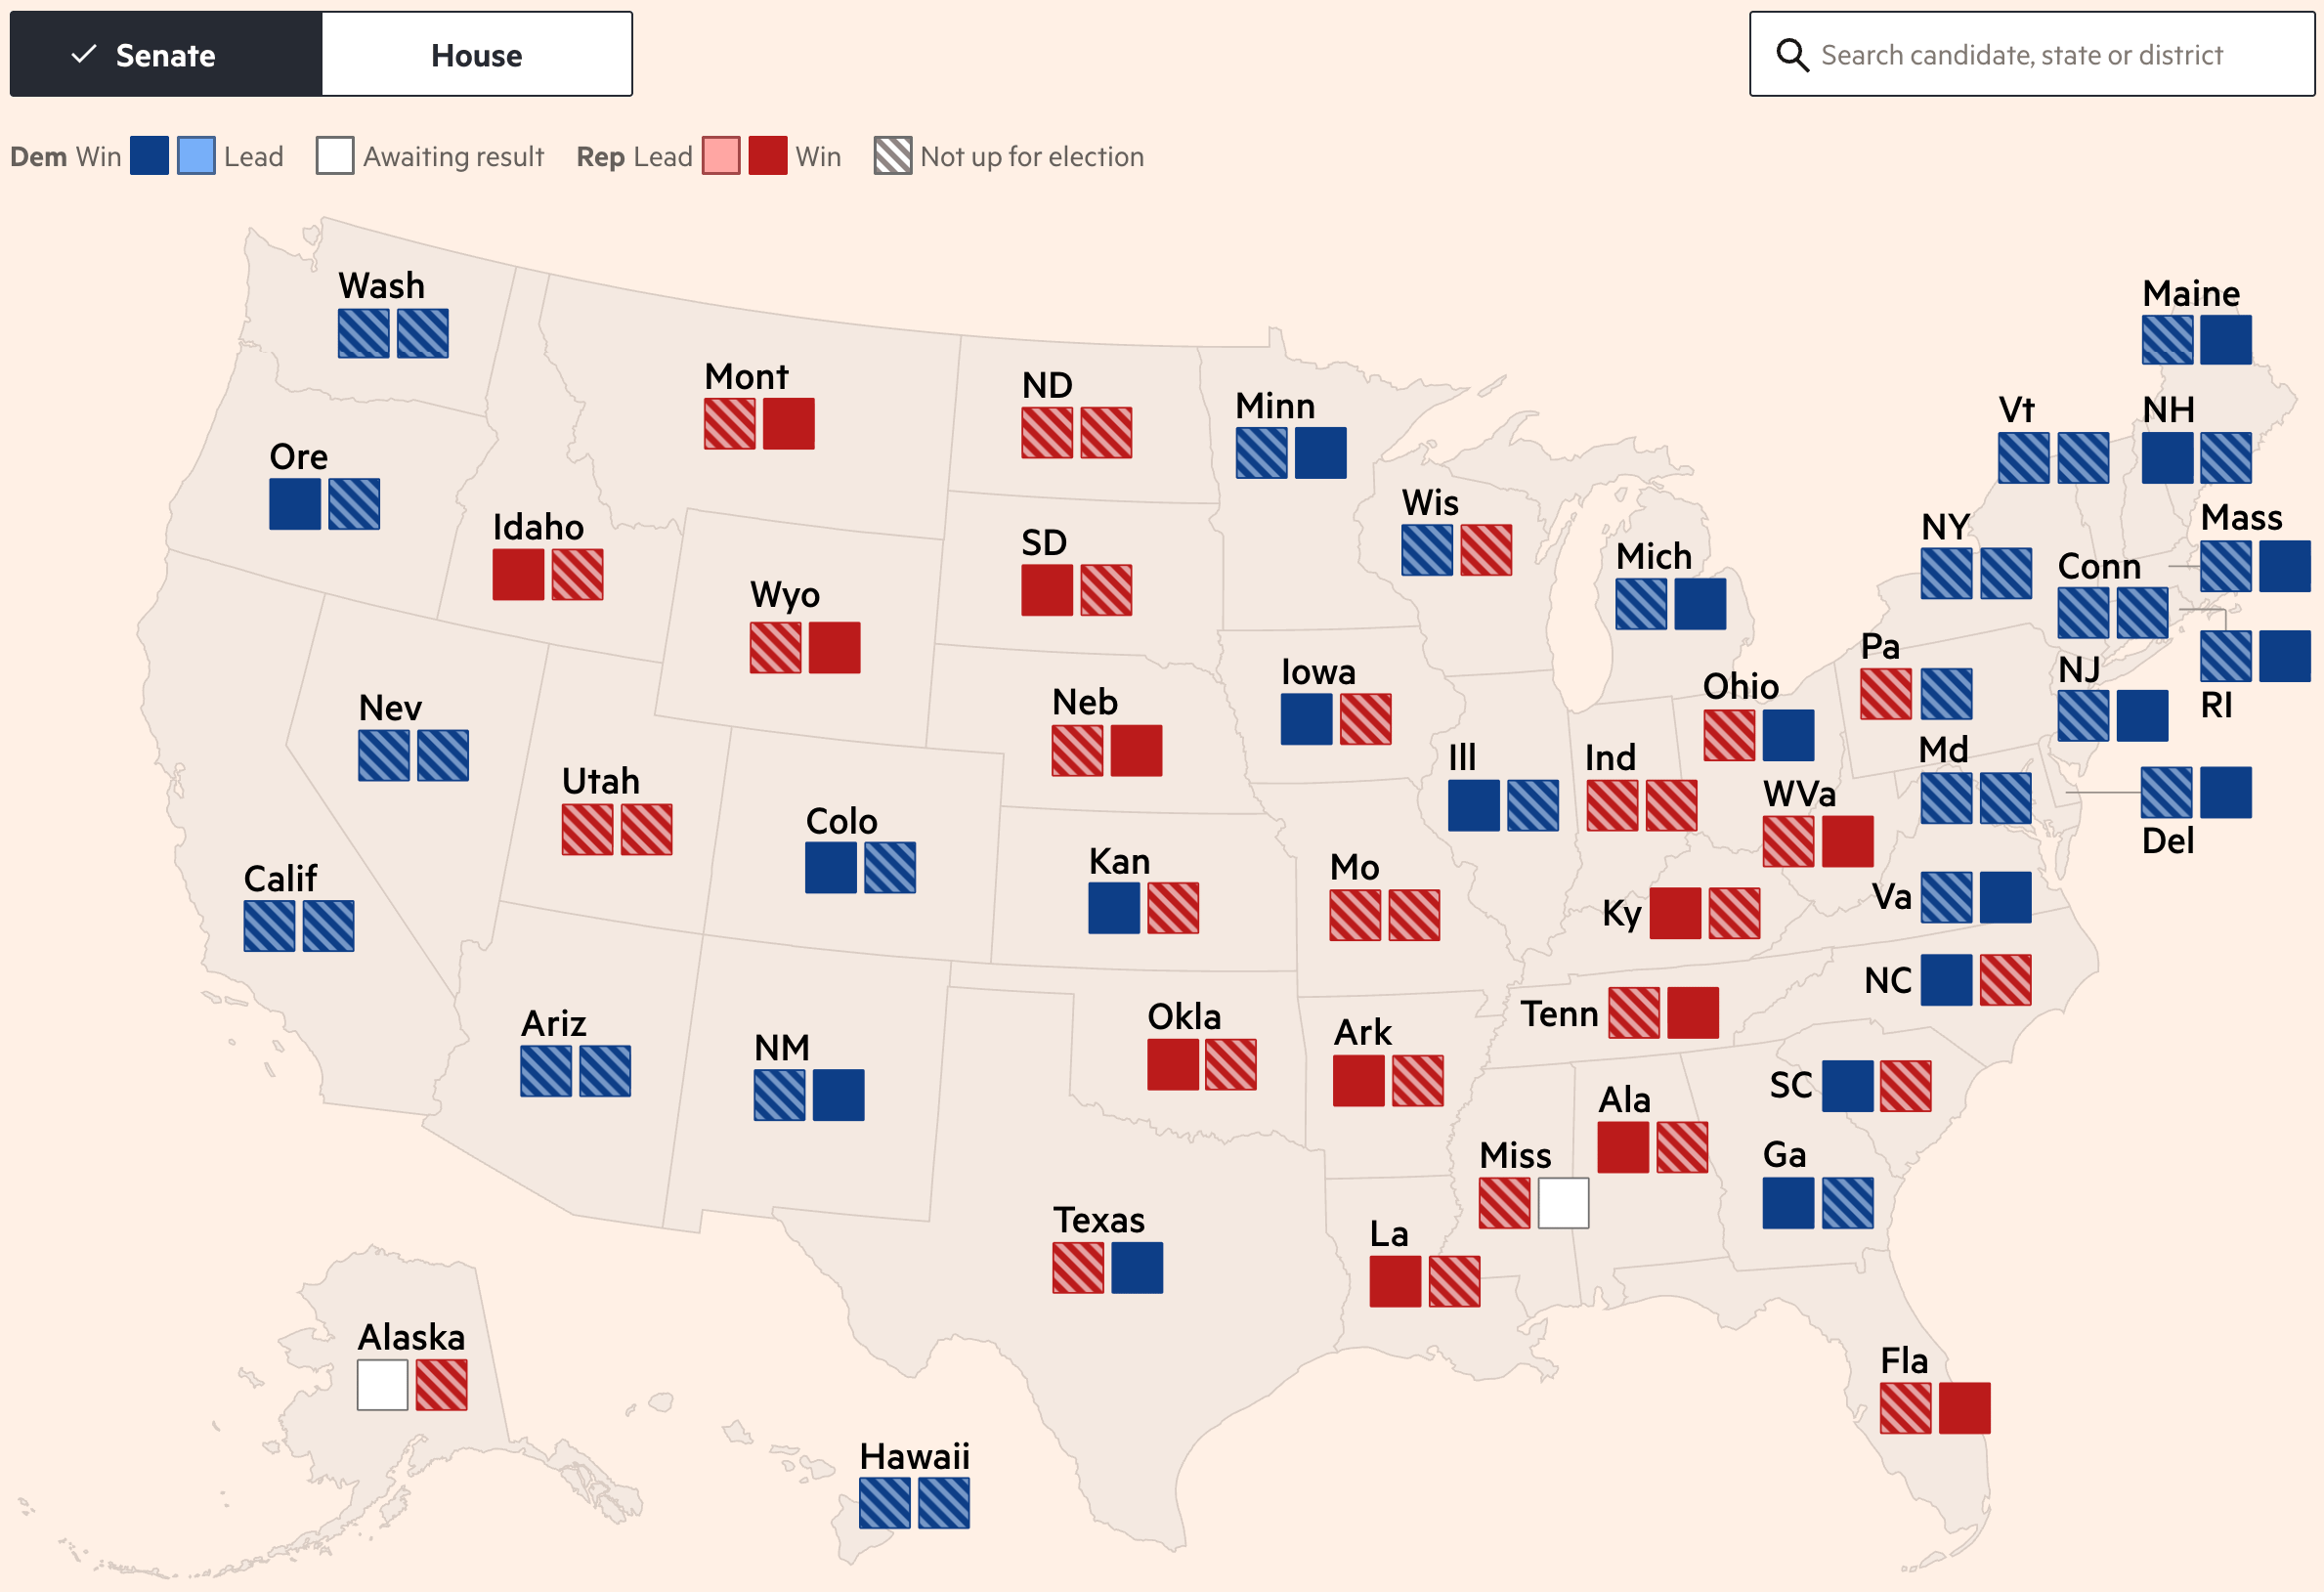
Bloomberg: <a href="https://www.bloomberg.com/graphics/2026-us-election-results/senate/"><strong>US Senate Election Results</strong></a>, November 3
Bloomberg: US Senate Election Results, November 3
Financial Times: <a href="https://www.ft.com/content/ca8ba515-592b-4c1d-a1d0-d8b2a94ccd30?accessToken=zwAAAaHA3bzCkdPKi6UVWStMHdOh0NiyqUzNMA.MEUCIBXy3ezkQTvvyxfJPjN08Vpf8_ckkuDQYQ-Qfa4eI4FTAiEAoQNwQiN6zM2voLlBhi0gPcBn3Cr8Ar_VnC02M7H0kLI&amp;segmentId=e95a9ae7-622c-6235-5f87-51e412b47e97&amp;shareId=47dd8bf2-ce42-4121-a3a7-cf577b570847&amp;shareType=enterprise&amp;syn-25a6b1a6=1"><strong>Live US midterm elections results tracker 2026</strong></a>, November 4
Financial Times: Live US midterm elections results tracker 2026, November 4
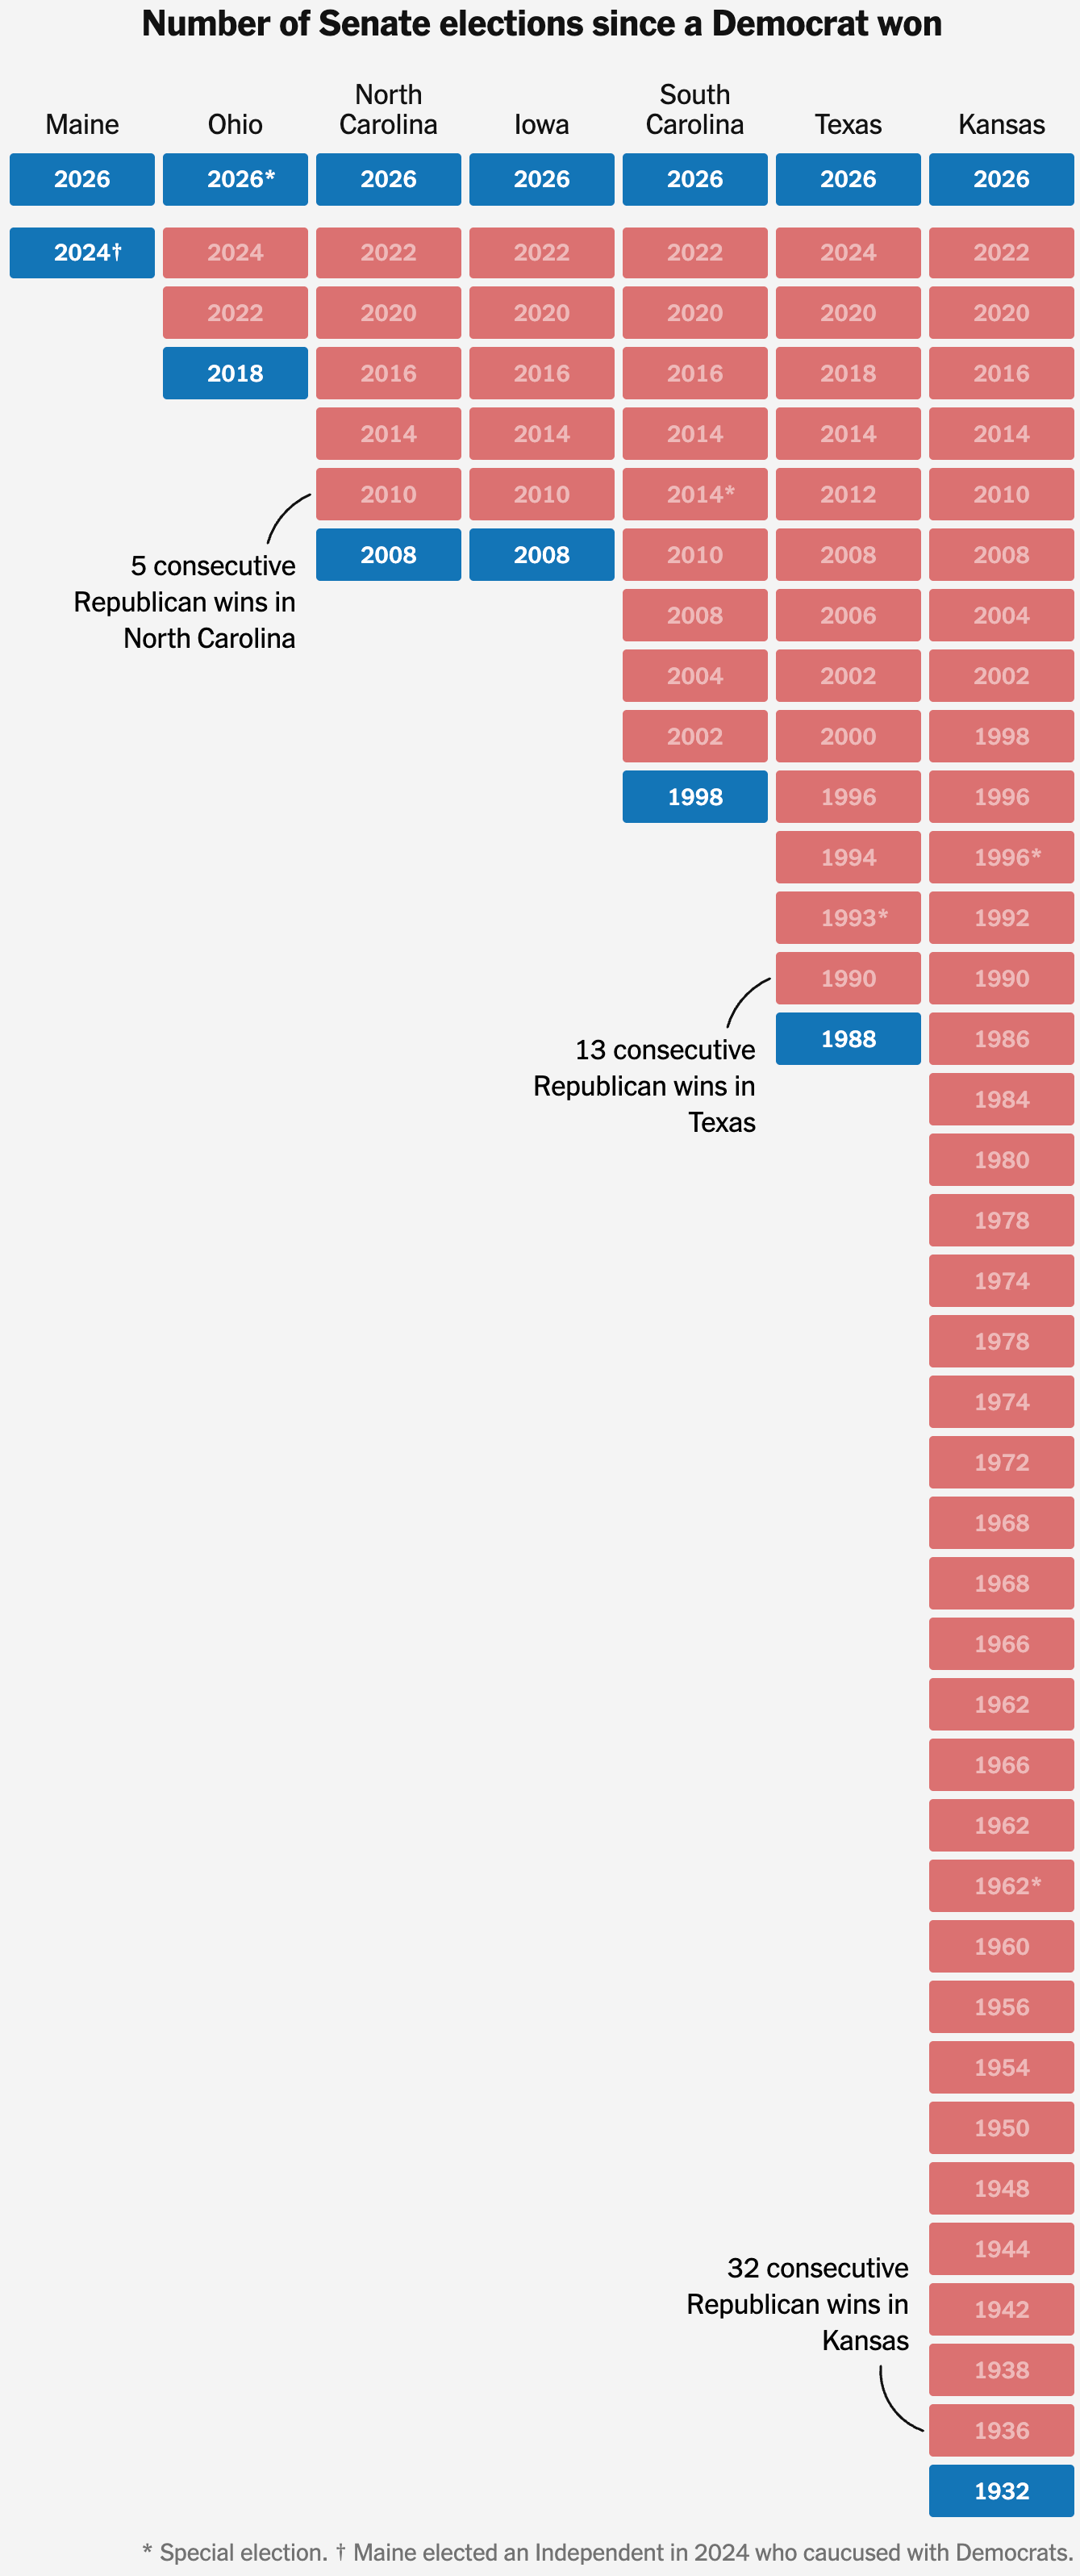
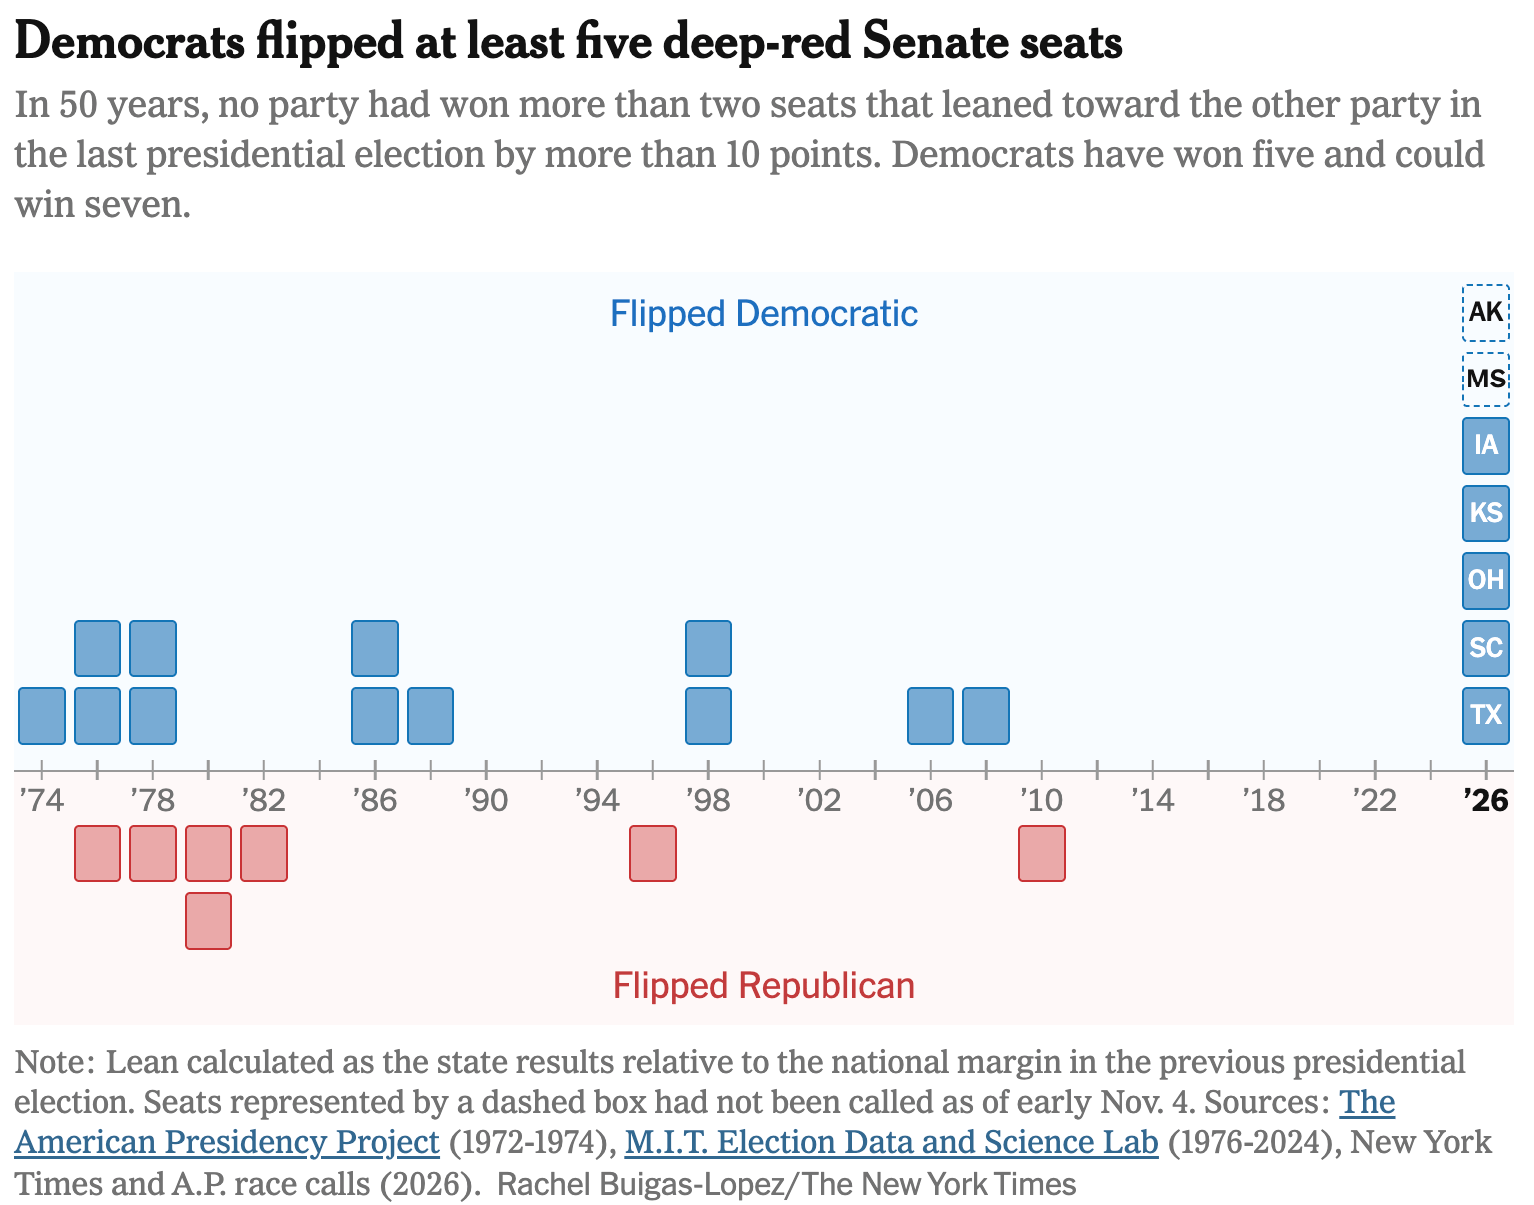
The New York Times: <a href="https://www.nytimes.com/interactive/2026/11/04/us/elections/midterms-senate-states.html"><strong>The 7 States That Flipped and Broke Republican Control of the Senate</strong></a>, November 4
The New York Times: The 7 States That Flipped and Broke Republican Control of the Senate, November 4
The New York Times: <a href="https://www.nytimes.com/2026/11/04/upshot/democrats-midterm-elections-trump-tsunami.html?unlocked_article_code=1.N1E.j4ZA.a_khRR5x2NkN&amp;smid=url-share"><strong>There’s No Modern Precedent for This Democratic Tsunami</strong></a>, November 4
The New York Times: There’s No Modern Precedent for This Democratic Tsunami, November 4
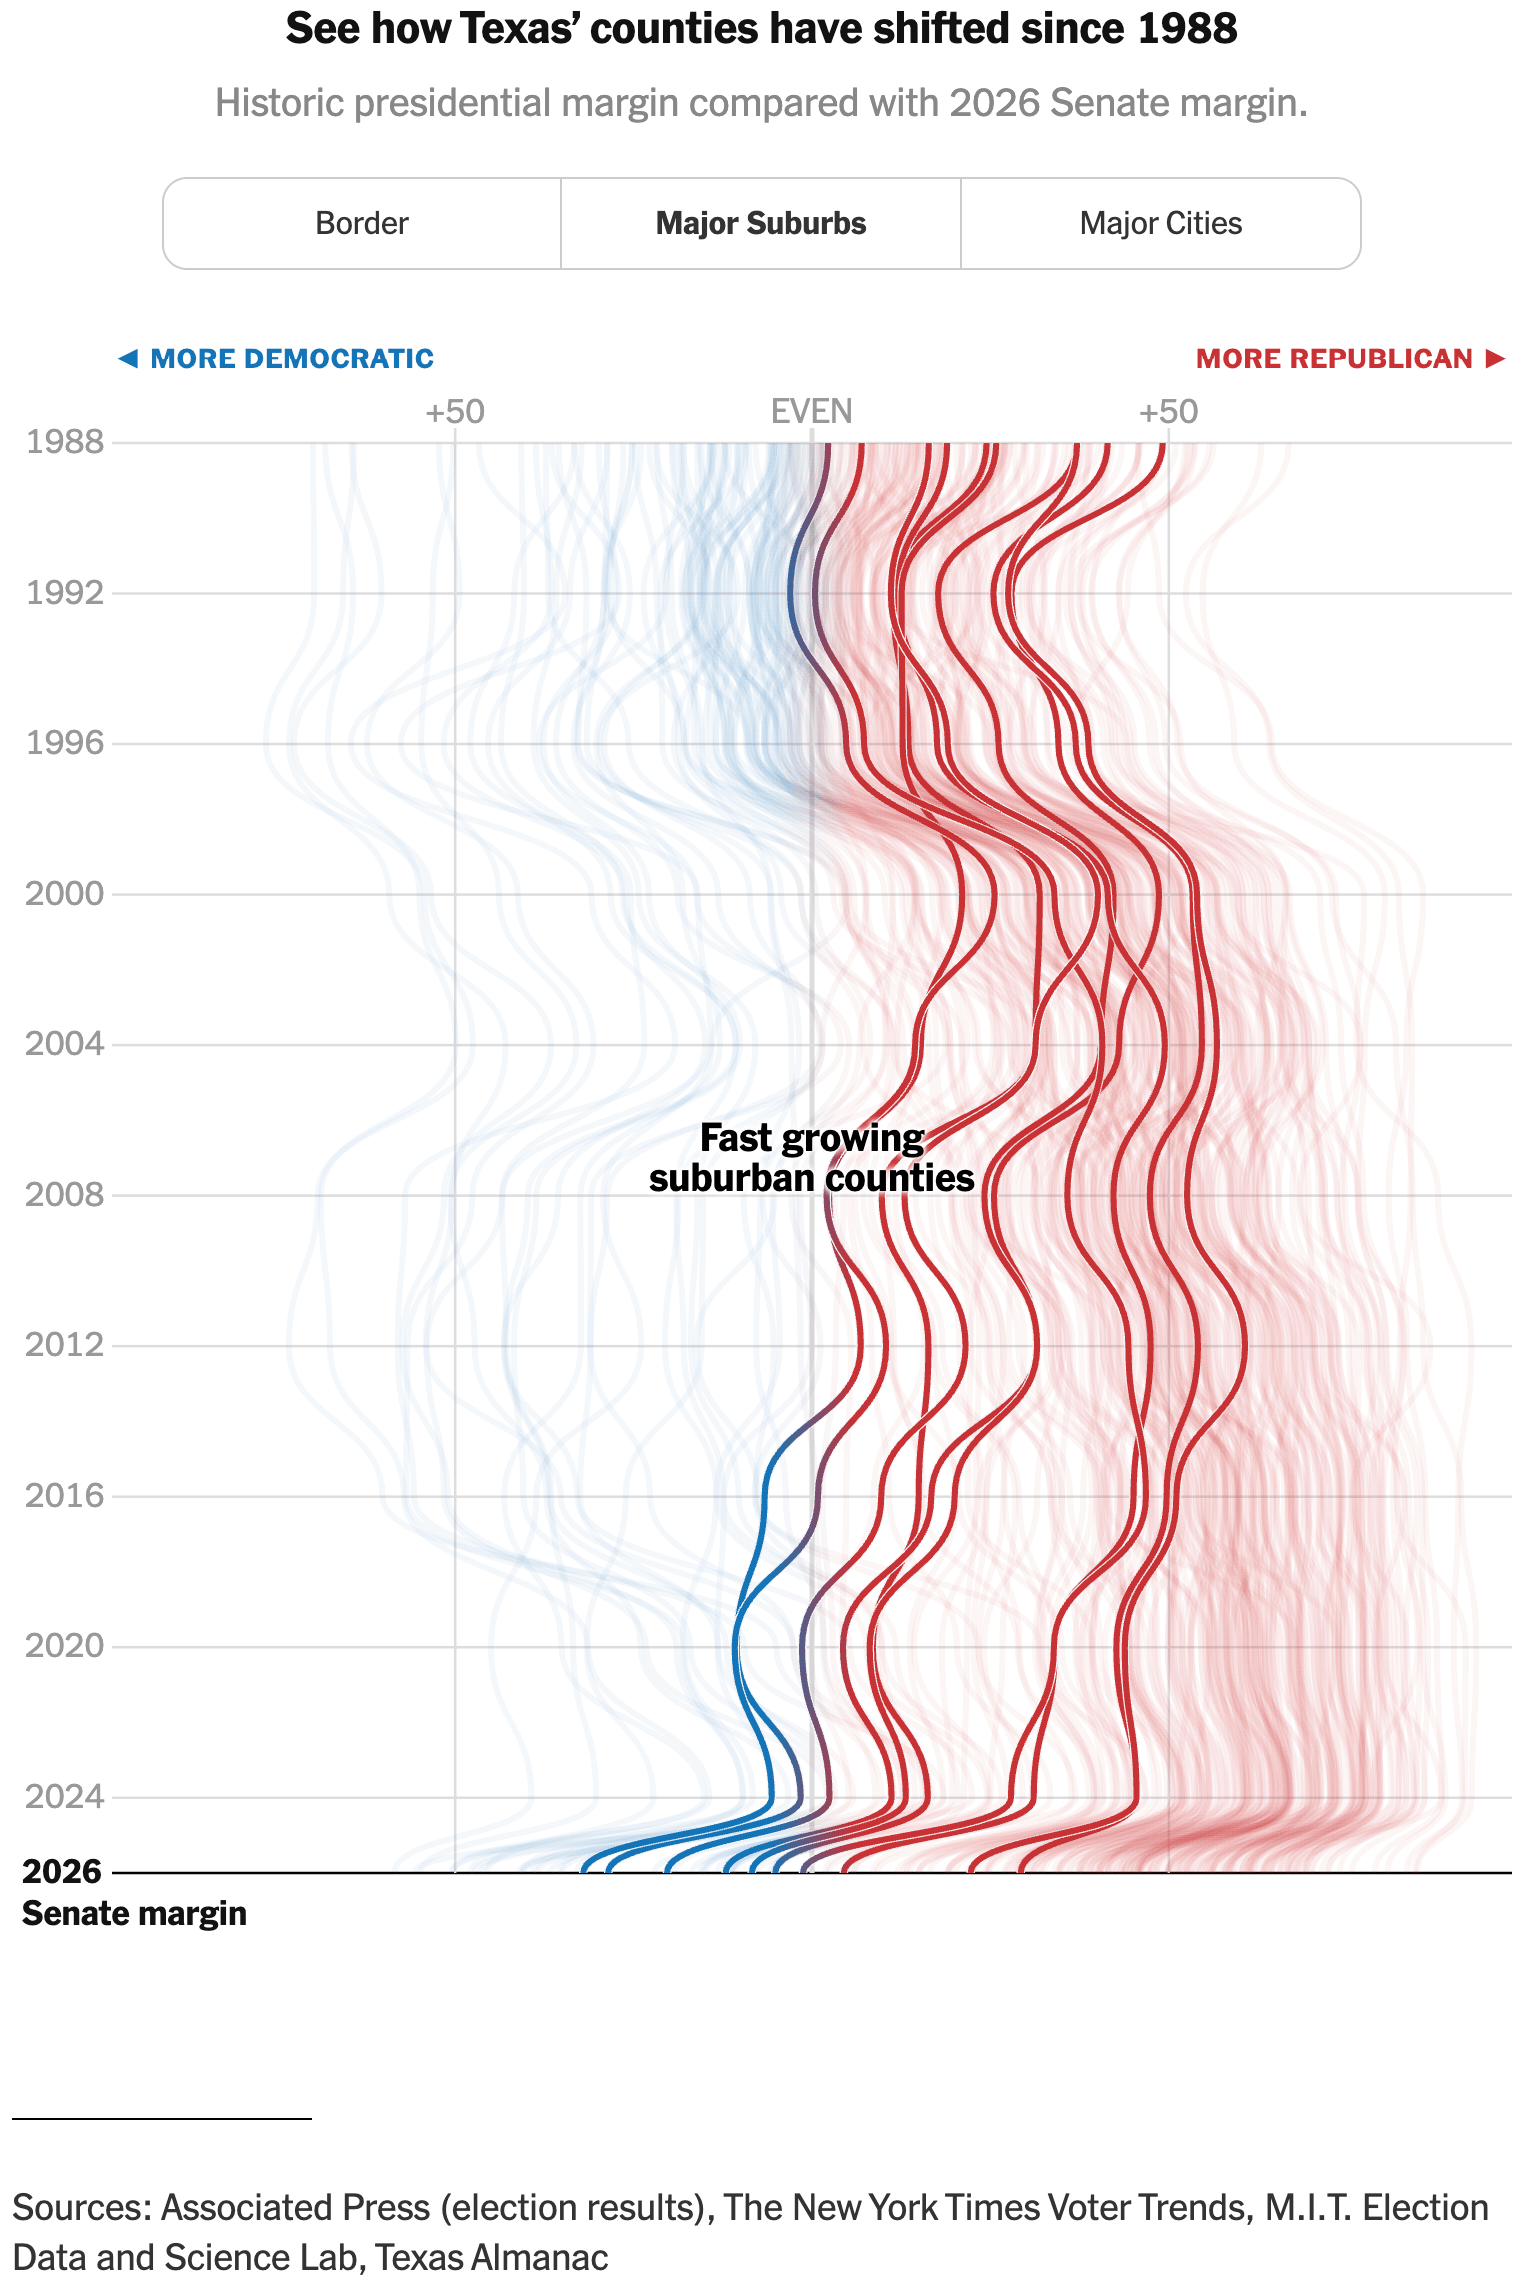
The New York Times: <a href="https://www.nytimes.com/interactive/2026/11/04/us/elections/texas-midterm-shift-democrats.html"><strong>How Democrats Turned Texas Blue</strong></a>, November 5
The New York Times: How Democrats Turned Texas Blue, November 5
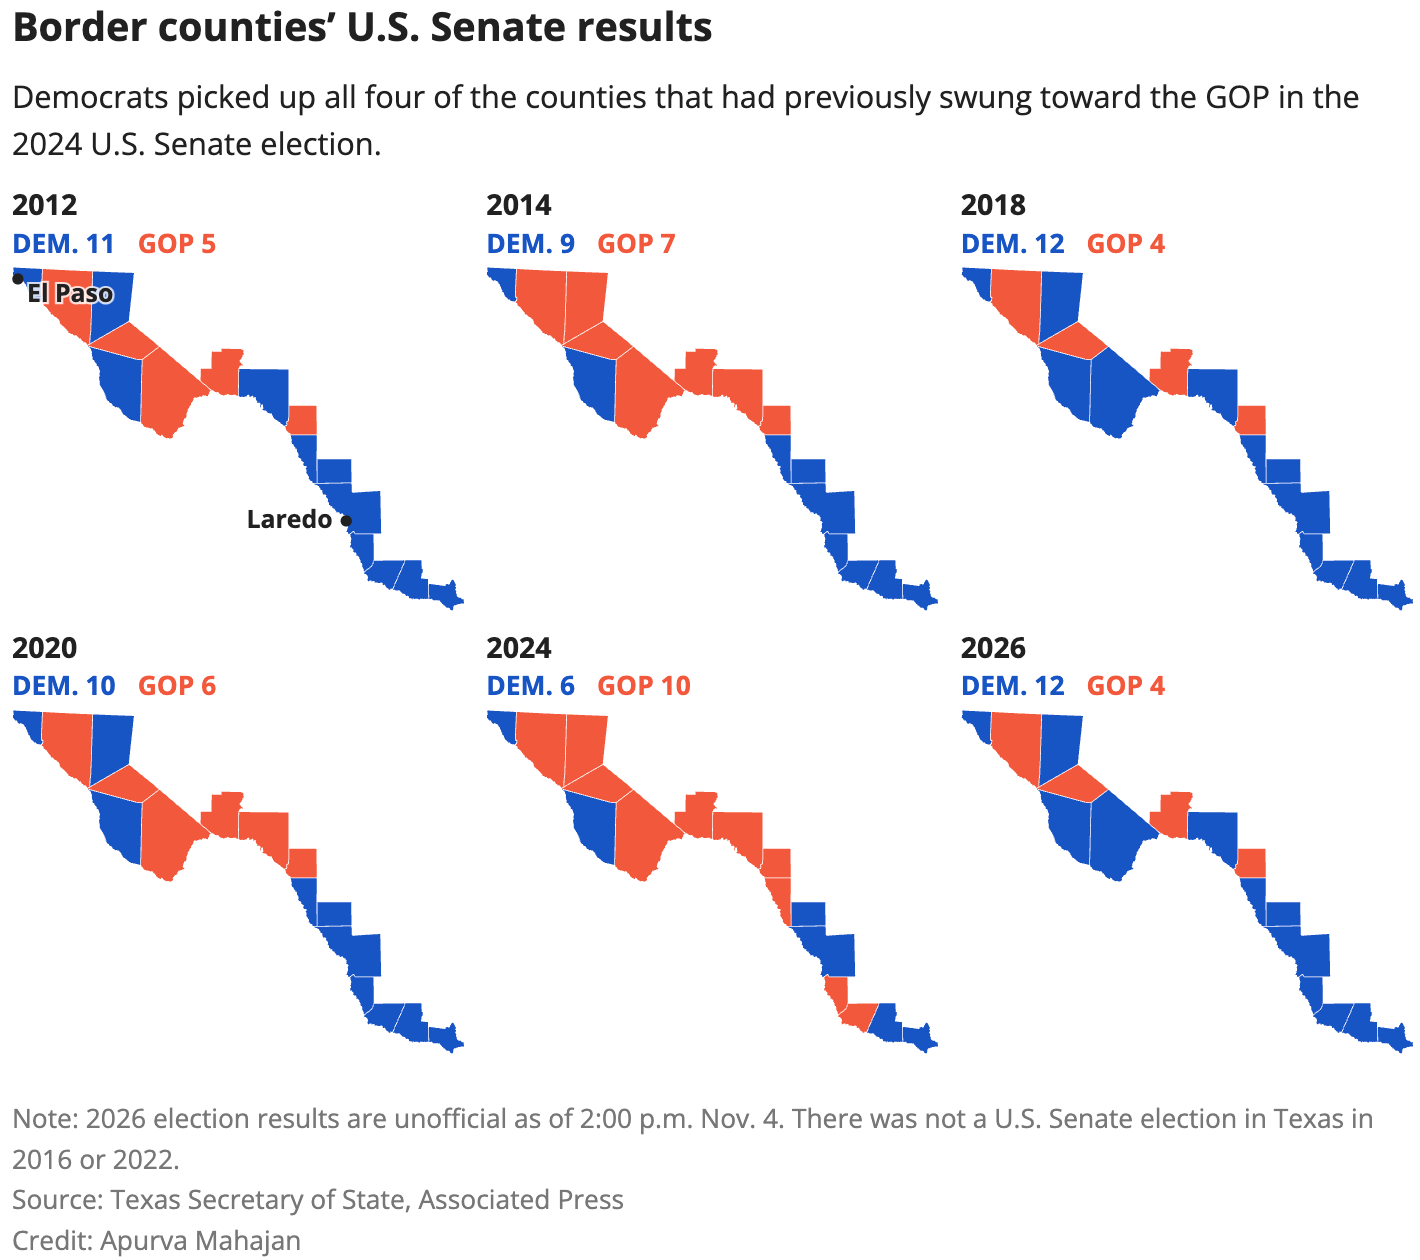
The Texas Tribune: <a href="https://www.texastribune.org/2026/11/04/texas-border-counties-voter-turnout/"><strong>After supporting Trump in 2024, Texas border counties fueled Democrats’ big night</strong></a>, November 4
The Texas Tribune: After supporting Trump in 2024, Texas border counties fueled Democrats’ big night, November 4
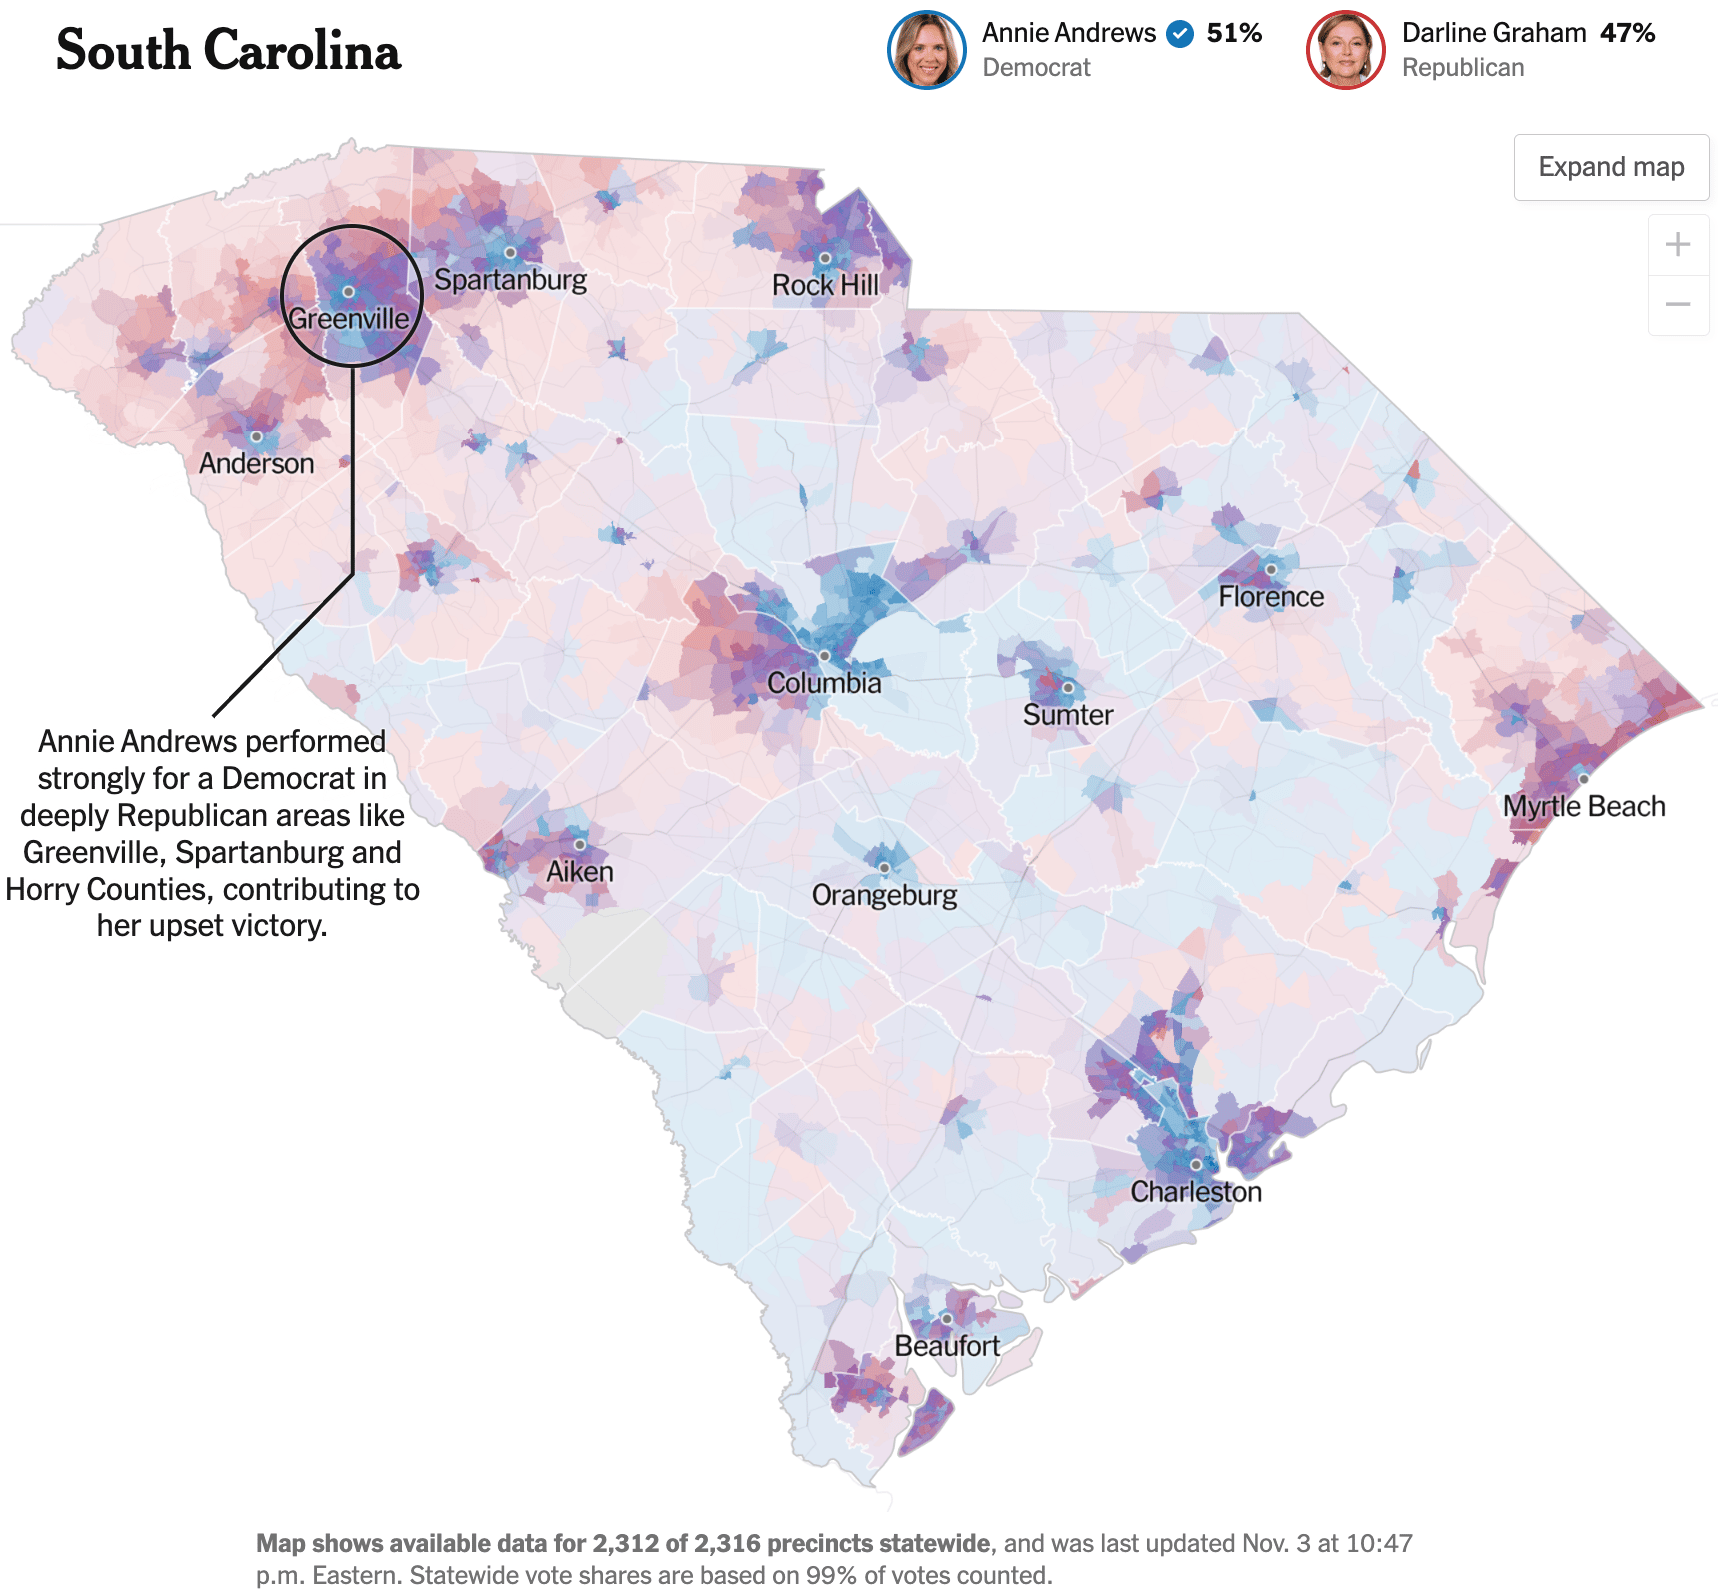
The New York Times: <a href="https://www.nytimes.com/interactive/2026/11/03/us/elections/results-senate-precinct-maps.html?unlocked_article_code=1.OFE.Q2h0.fEaIEe-7e6lE&amp;smid=url-share"><strong>Detailed Maps of the 2026 Senate Election Results</strong></a>, November 8 <span class="badge">Beautiful maps!</span>
The New York Times: Detailed Maps of the 2026 Senate Election Results, November 8 Beautiful maps!
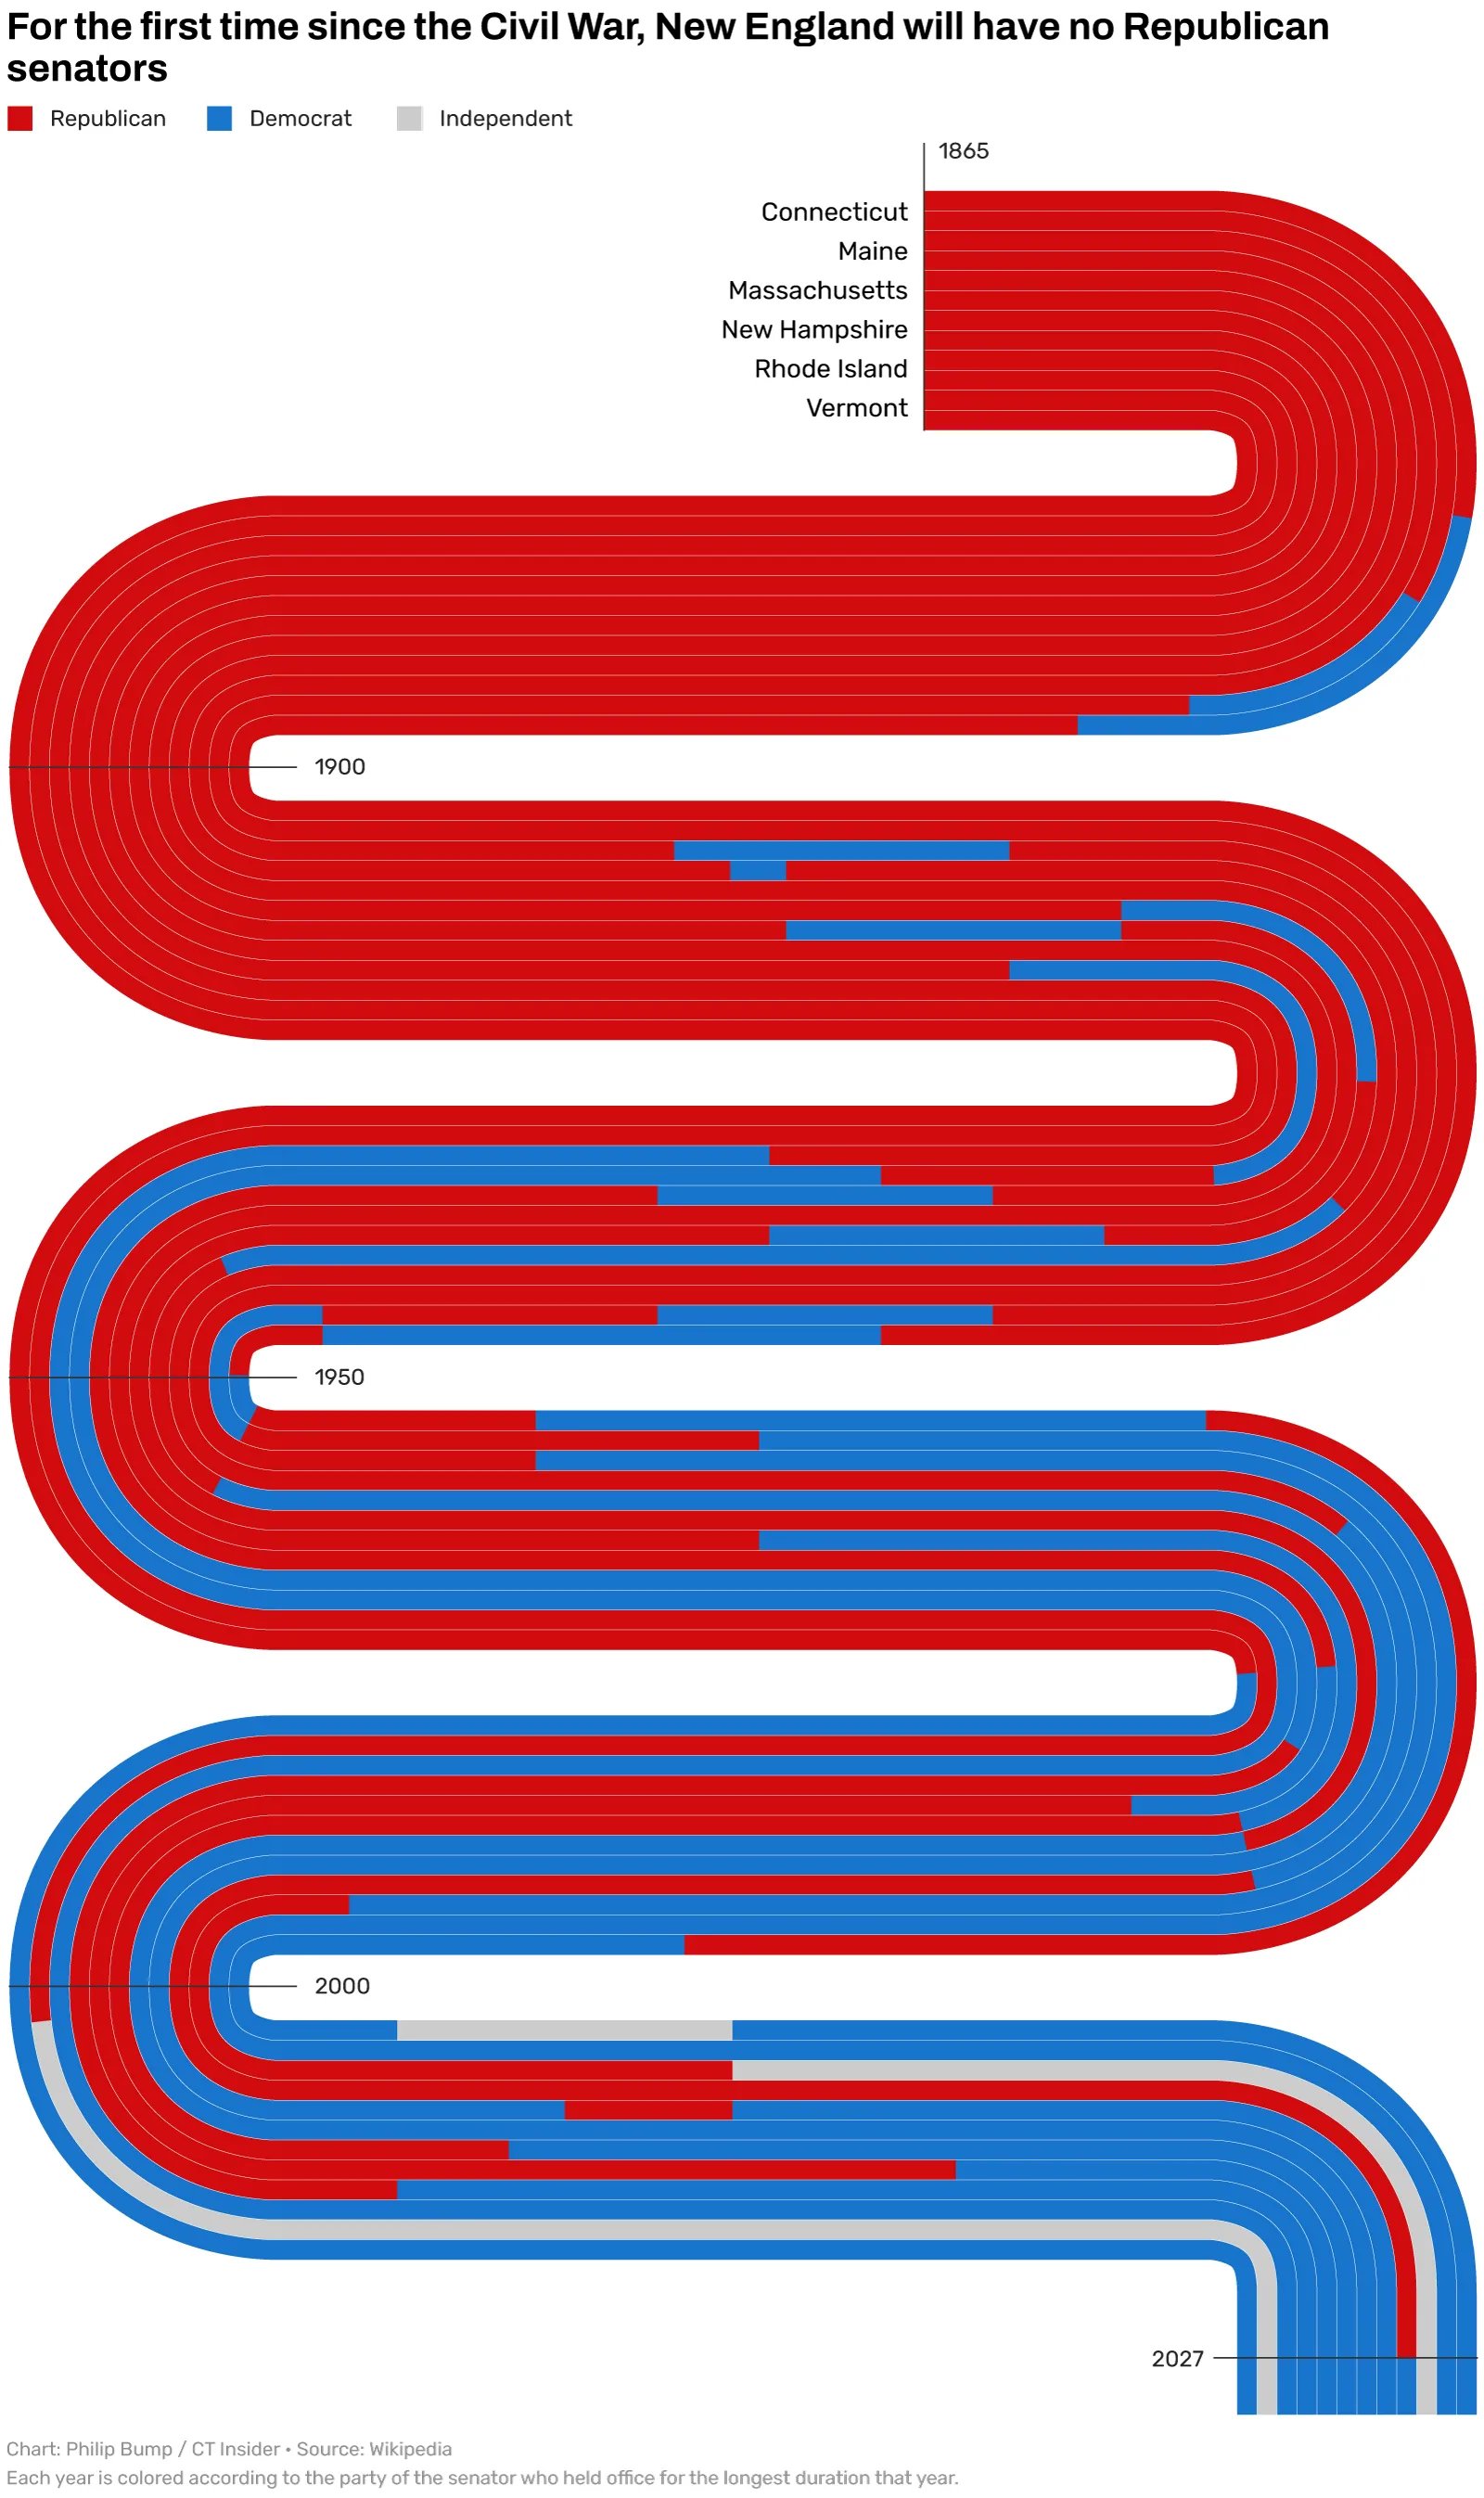
CT Insider: <a href="https://www.ctinsider.com/politics/article/new-england-no-republican-senators-22514273.php"><strong>For first time since the Civil War, New England will have no GOP senators: Philip Bump</strong></a>, November 5
CT Insider: For first time since the Civil War, New England will have no GOP senators: Philip Bump, November 5
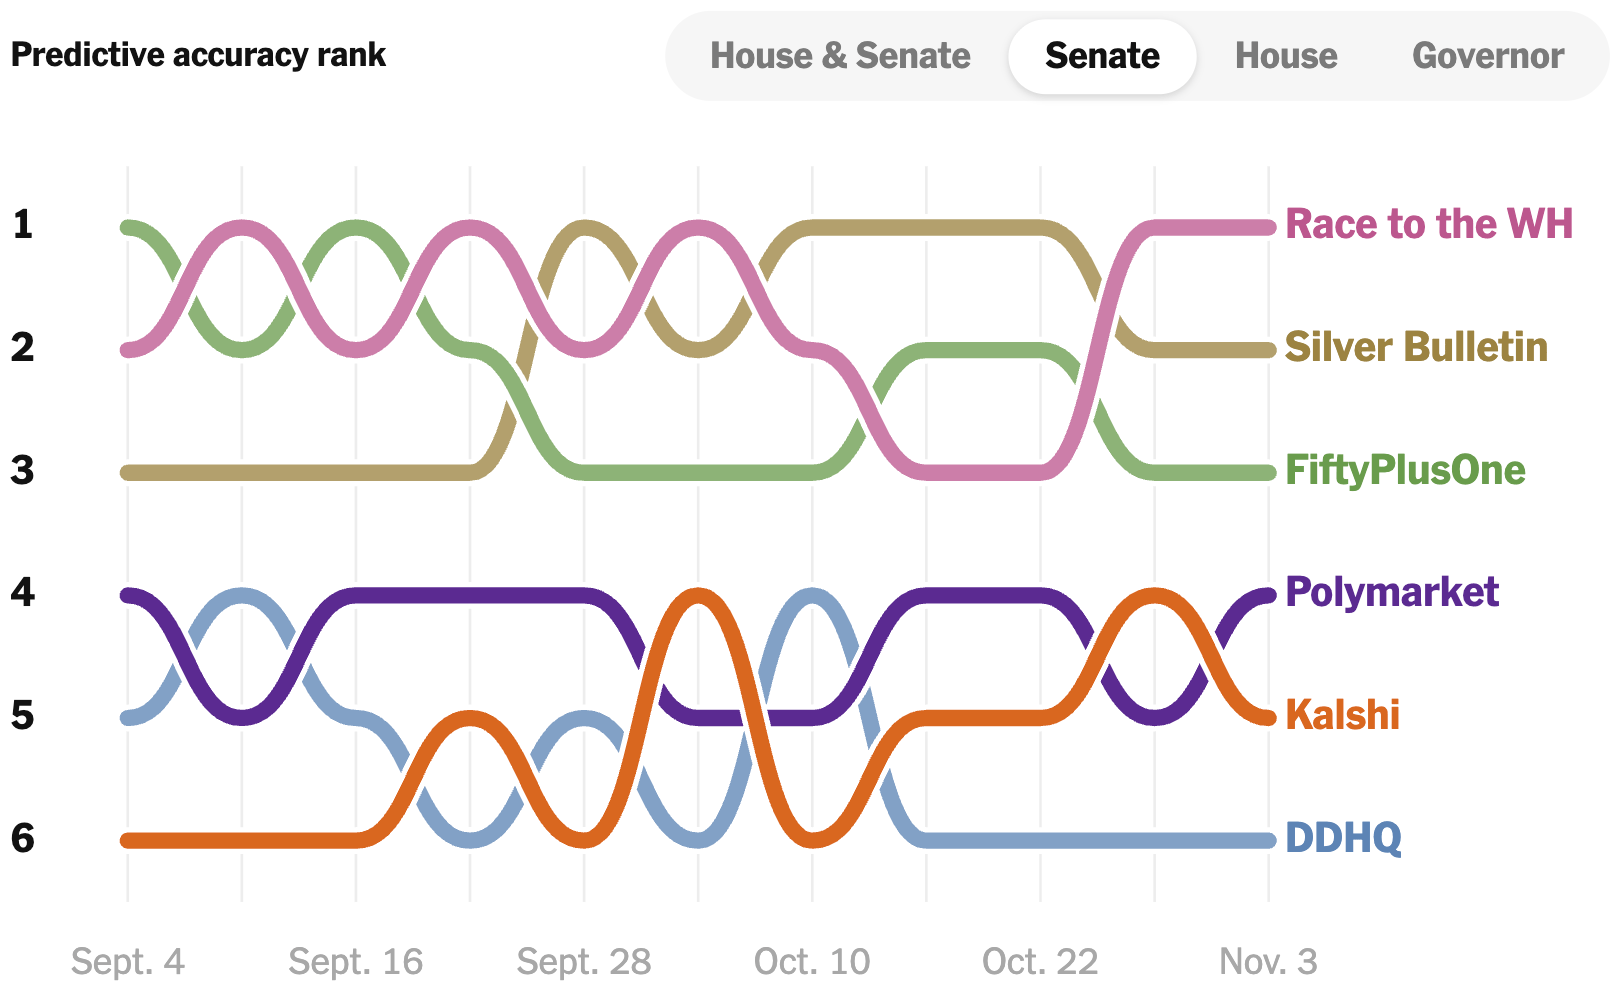
The New York Times: <a href="https://www.nytimes.com/interactive/2026/11/06/business/polymarket-kalshi-prediction-markets-midterm-elections-accuracy.html"><strong>How Accurate Were Prediction Markets at Picking Midterm Winners?</strong></a>, November 6
The New York Times: How Accurate Were Prediction Markets at Picking Midterm Winners?, November 6
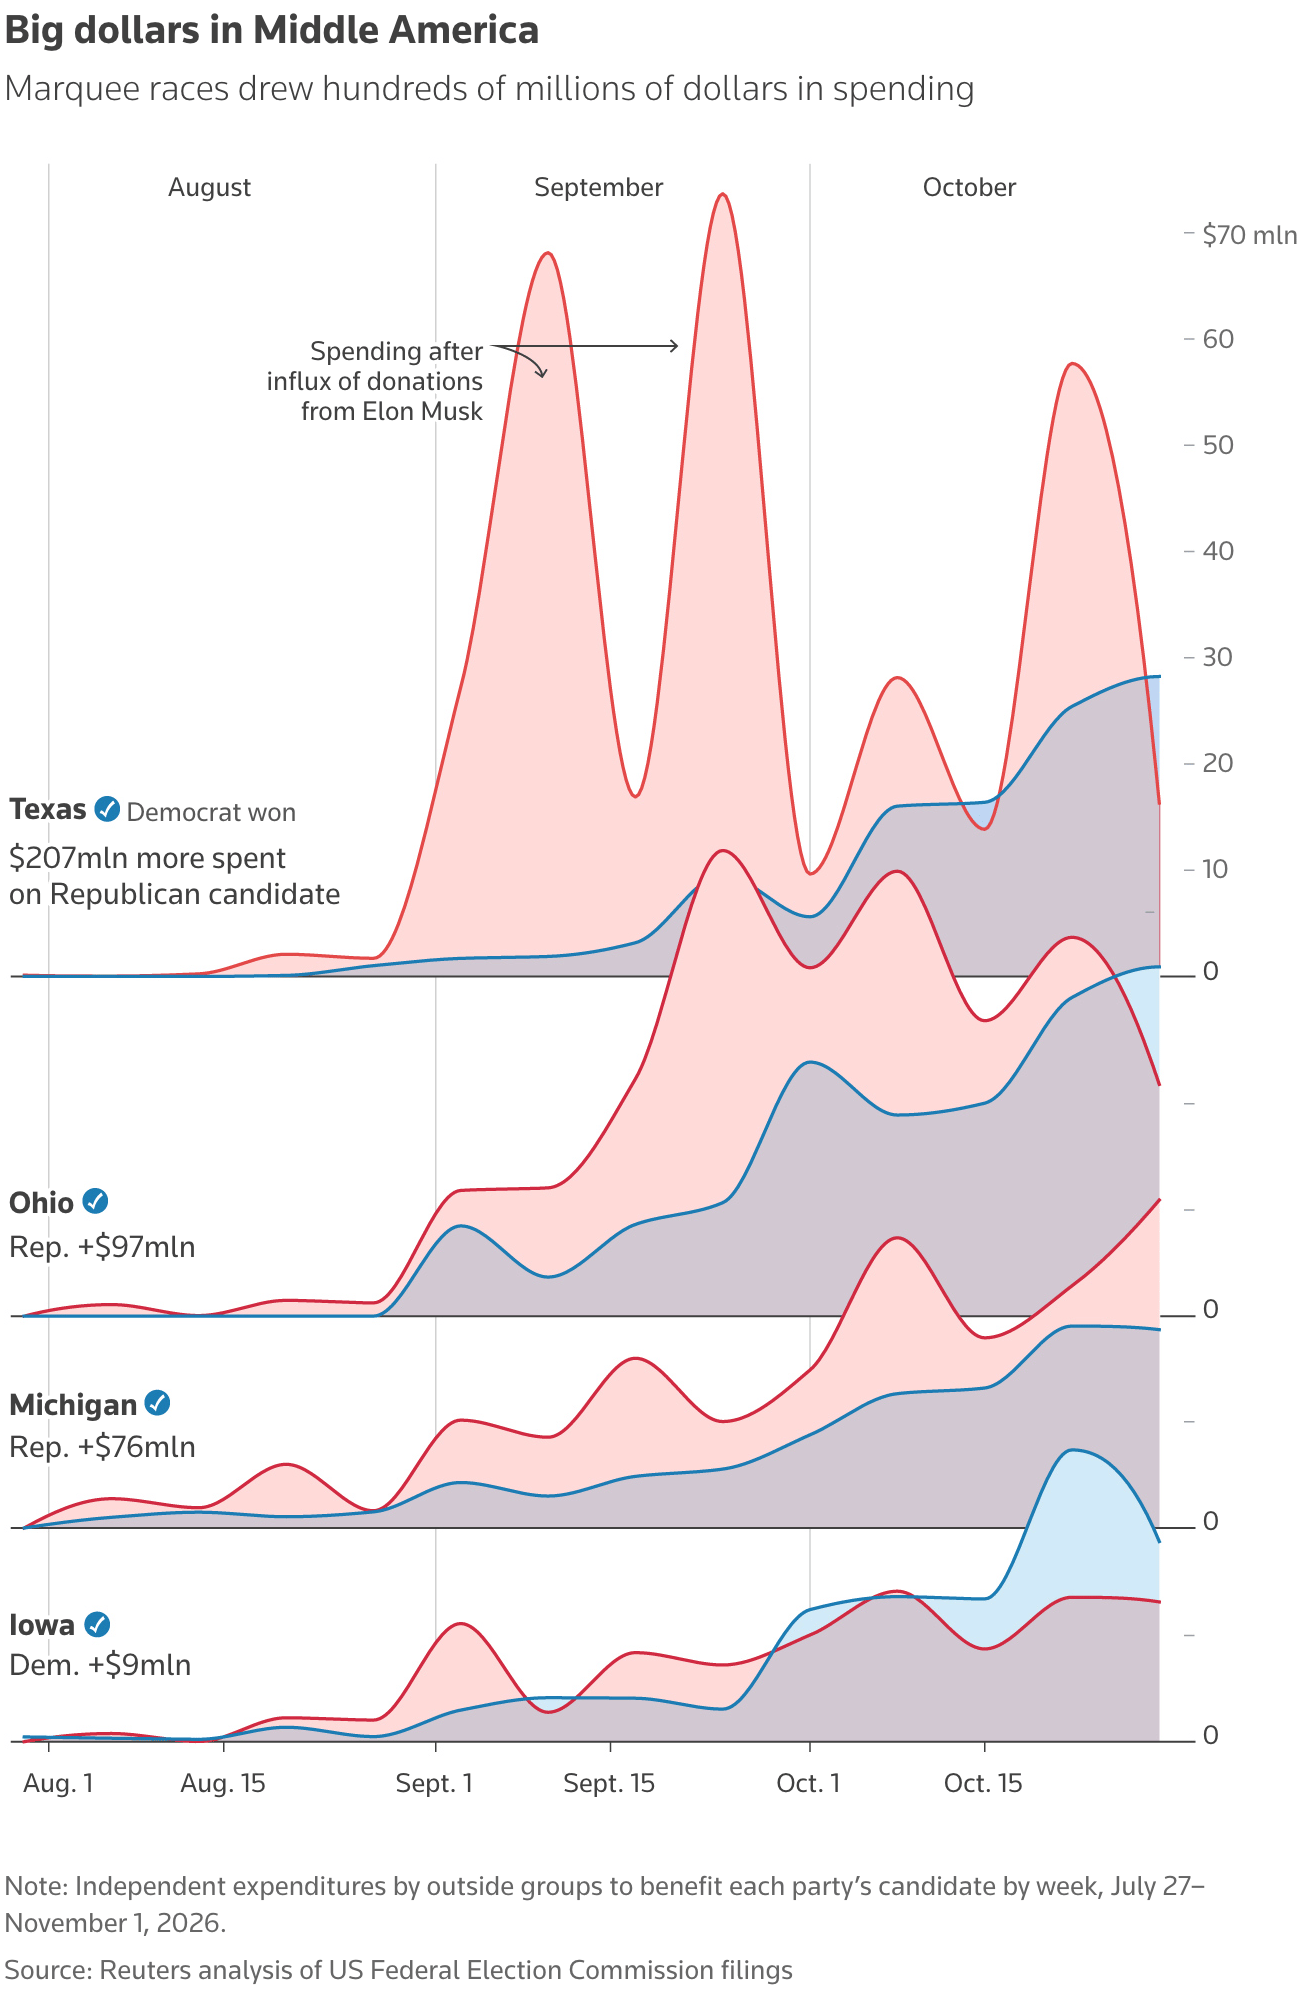
Reuters: <a href="https://www.reuters.com/graphics/US-ELECTIONS/GRAPHICS-BLOG/akpelkldzvr/2026-11-06/pac-spending/"><strong>How much does it cost to lose the Senate? More than $1 billion</strong></a>, November 6
Reuters: How much does it cost to lose the Senate? More than $1 billion, November 6

Turning to the results of the U.S. House elections, the Democrats secured their largest majority in almost two decades following a shift in votes.
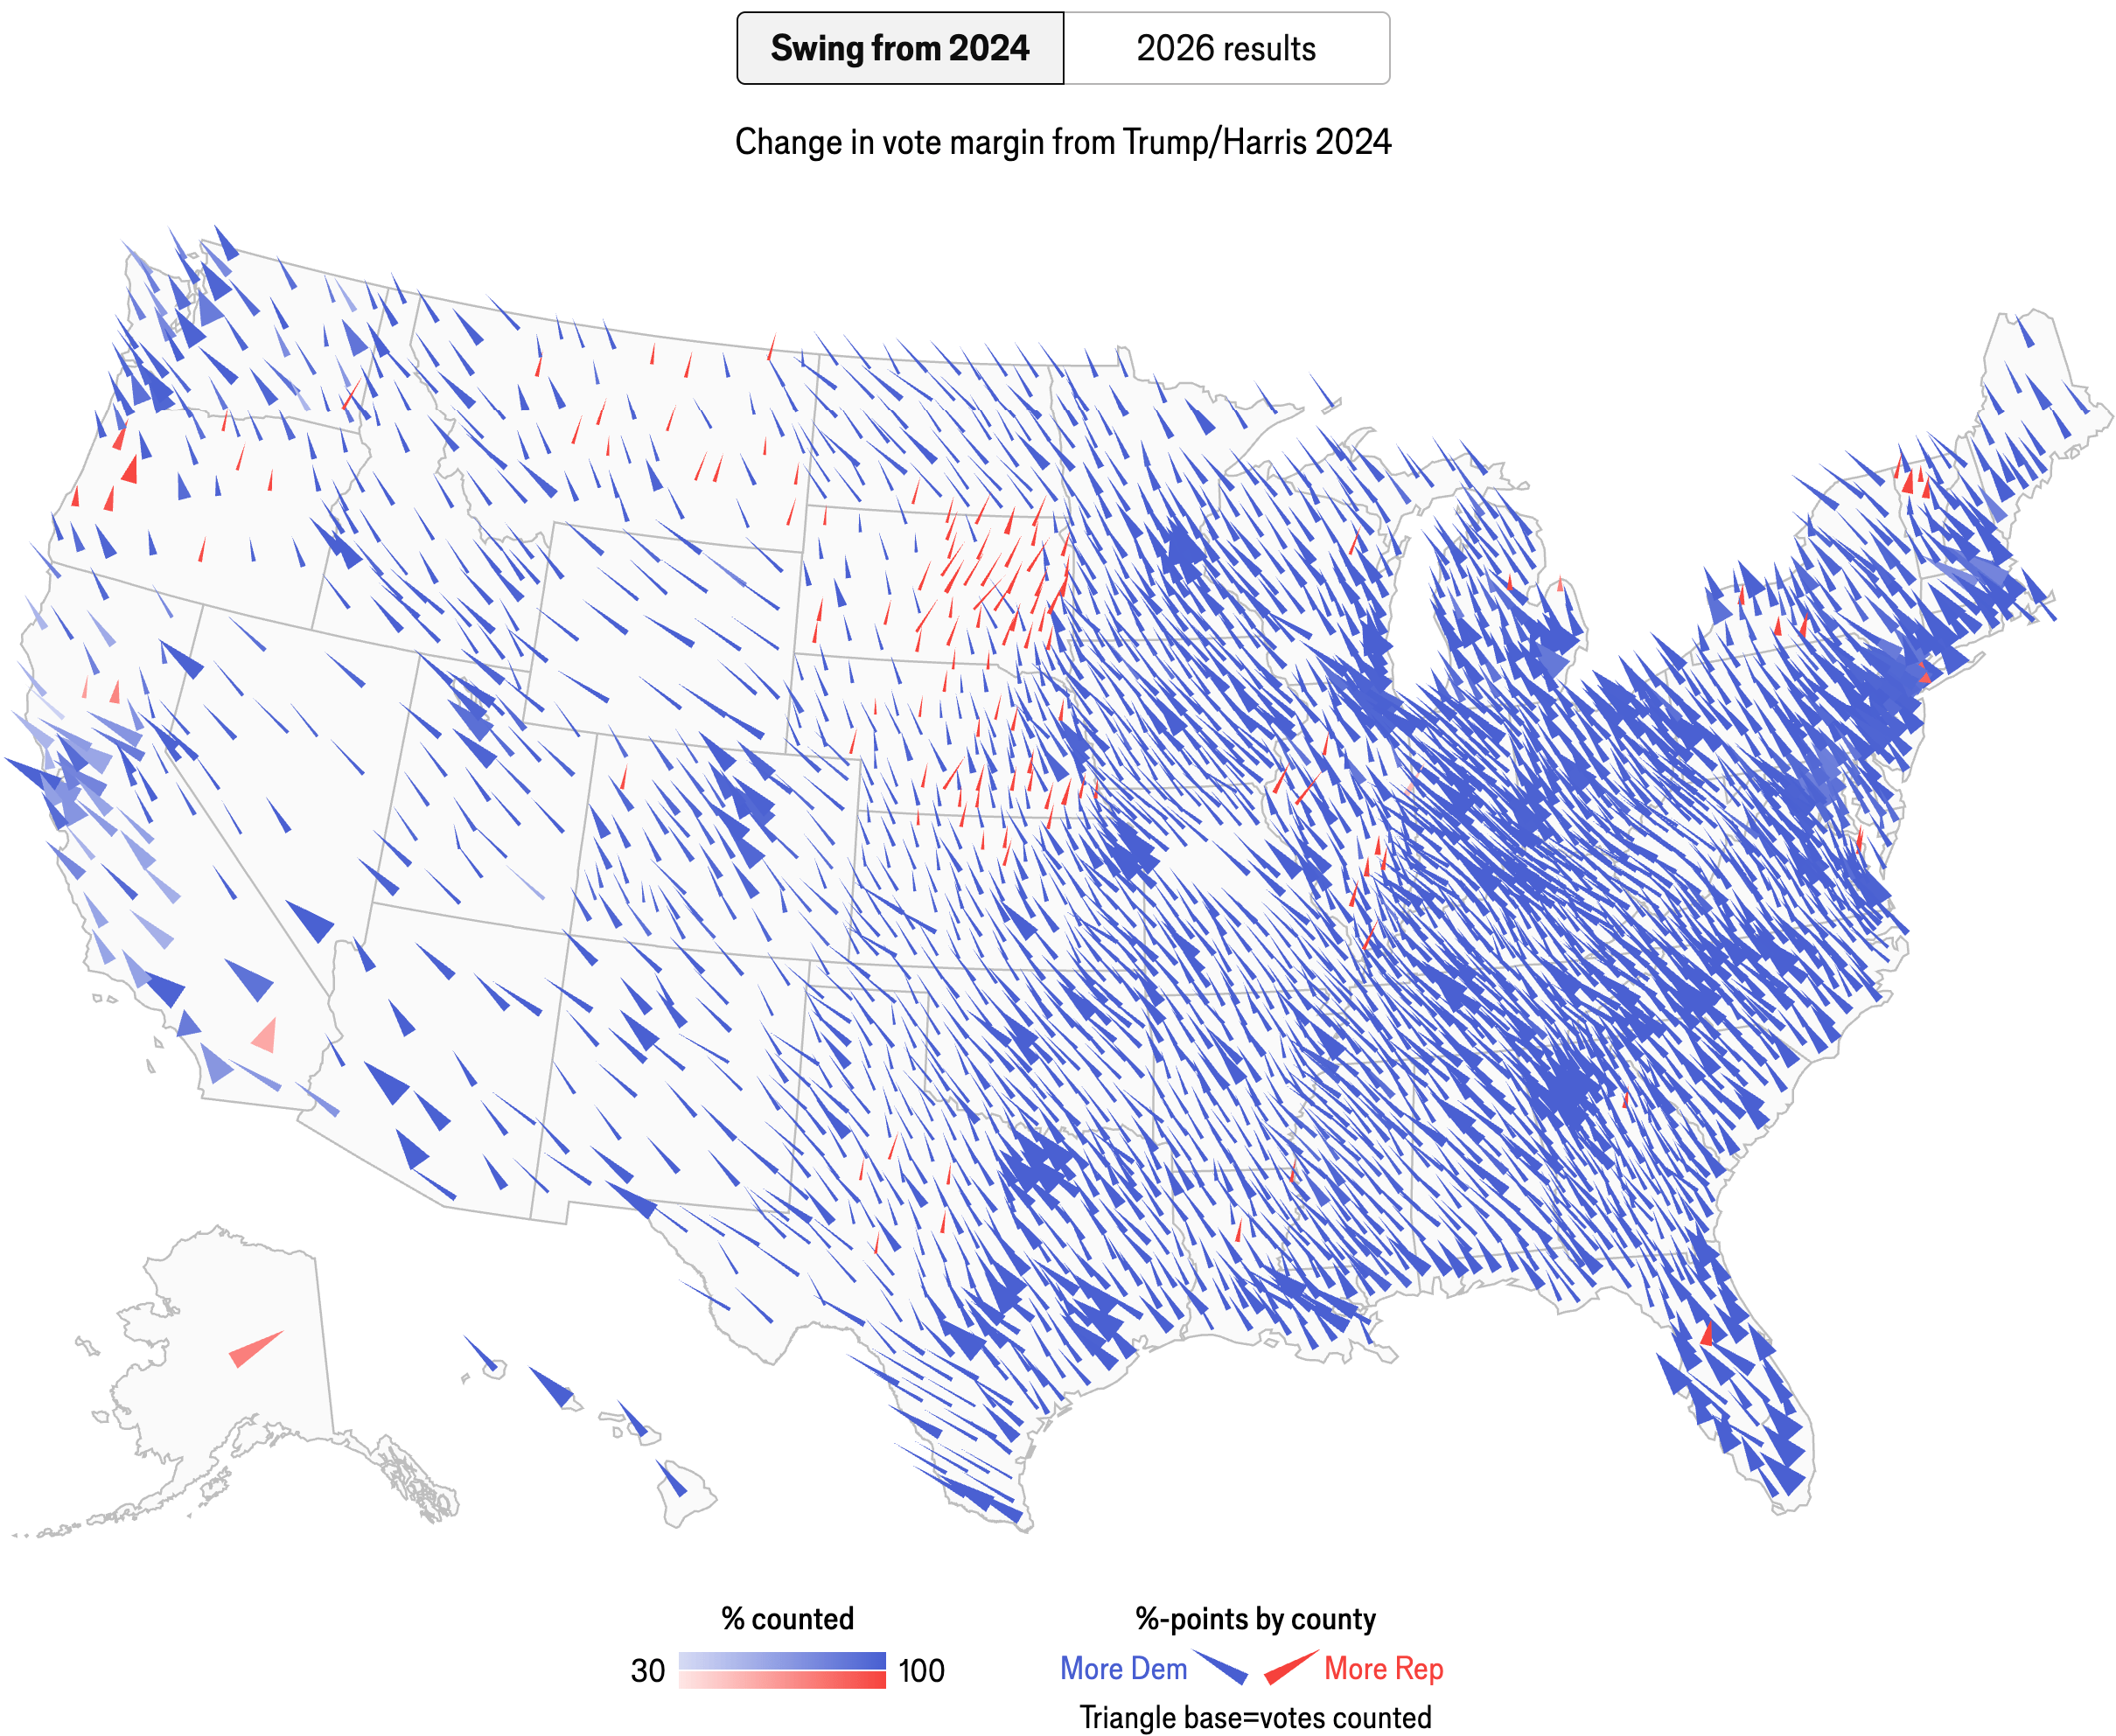
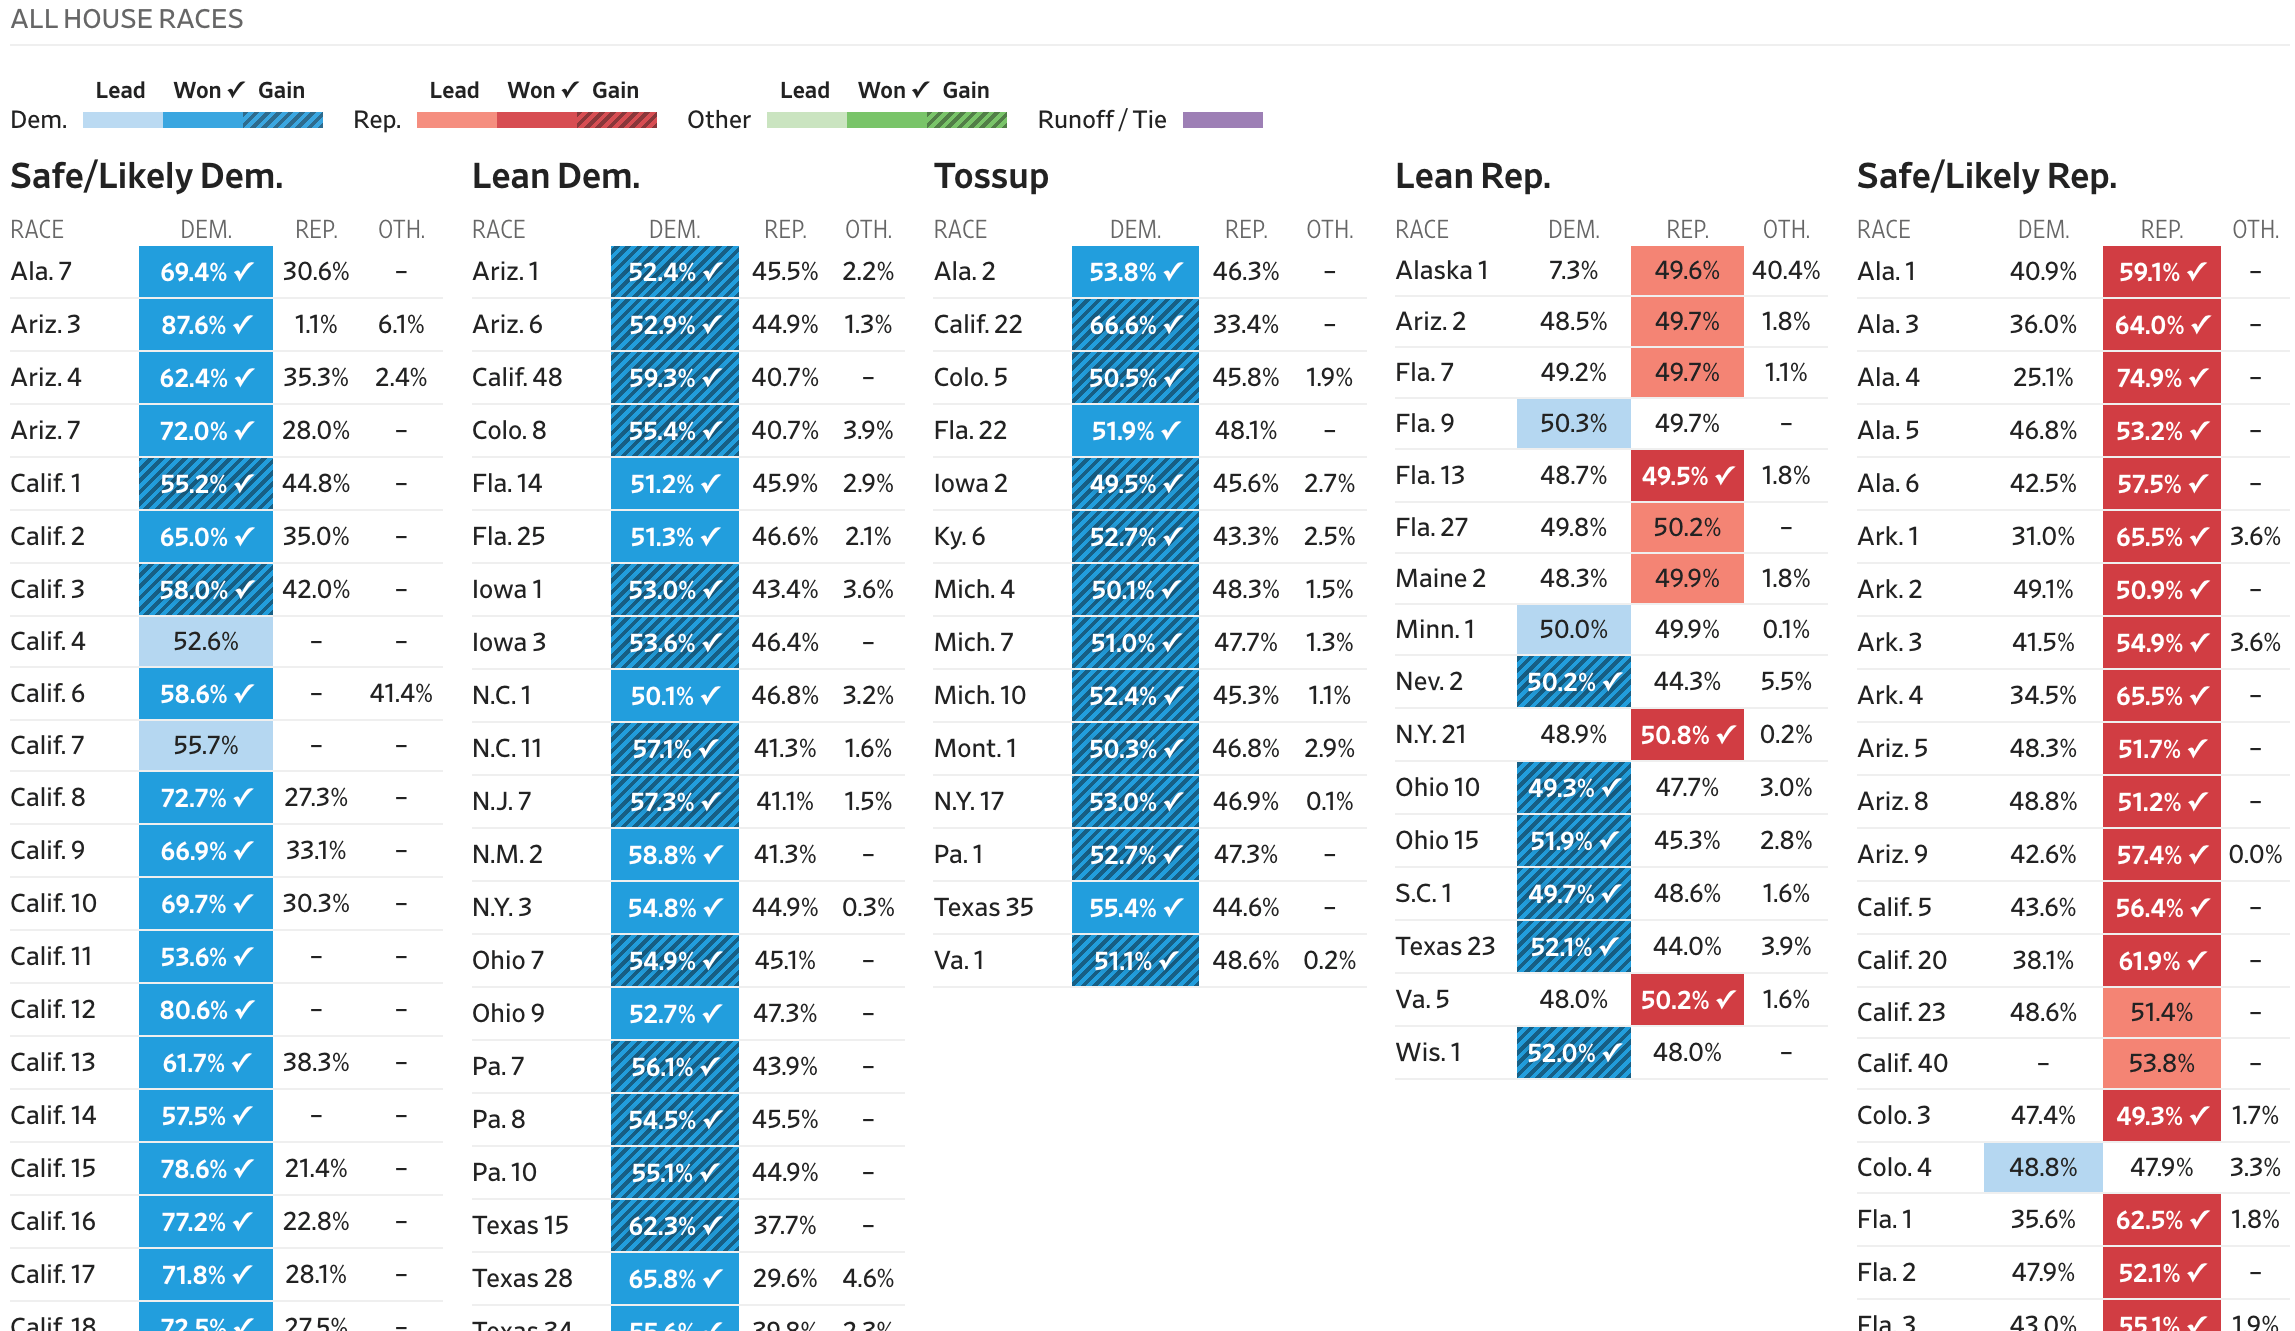
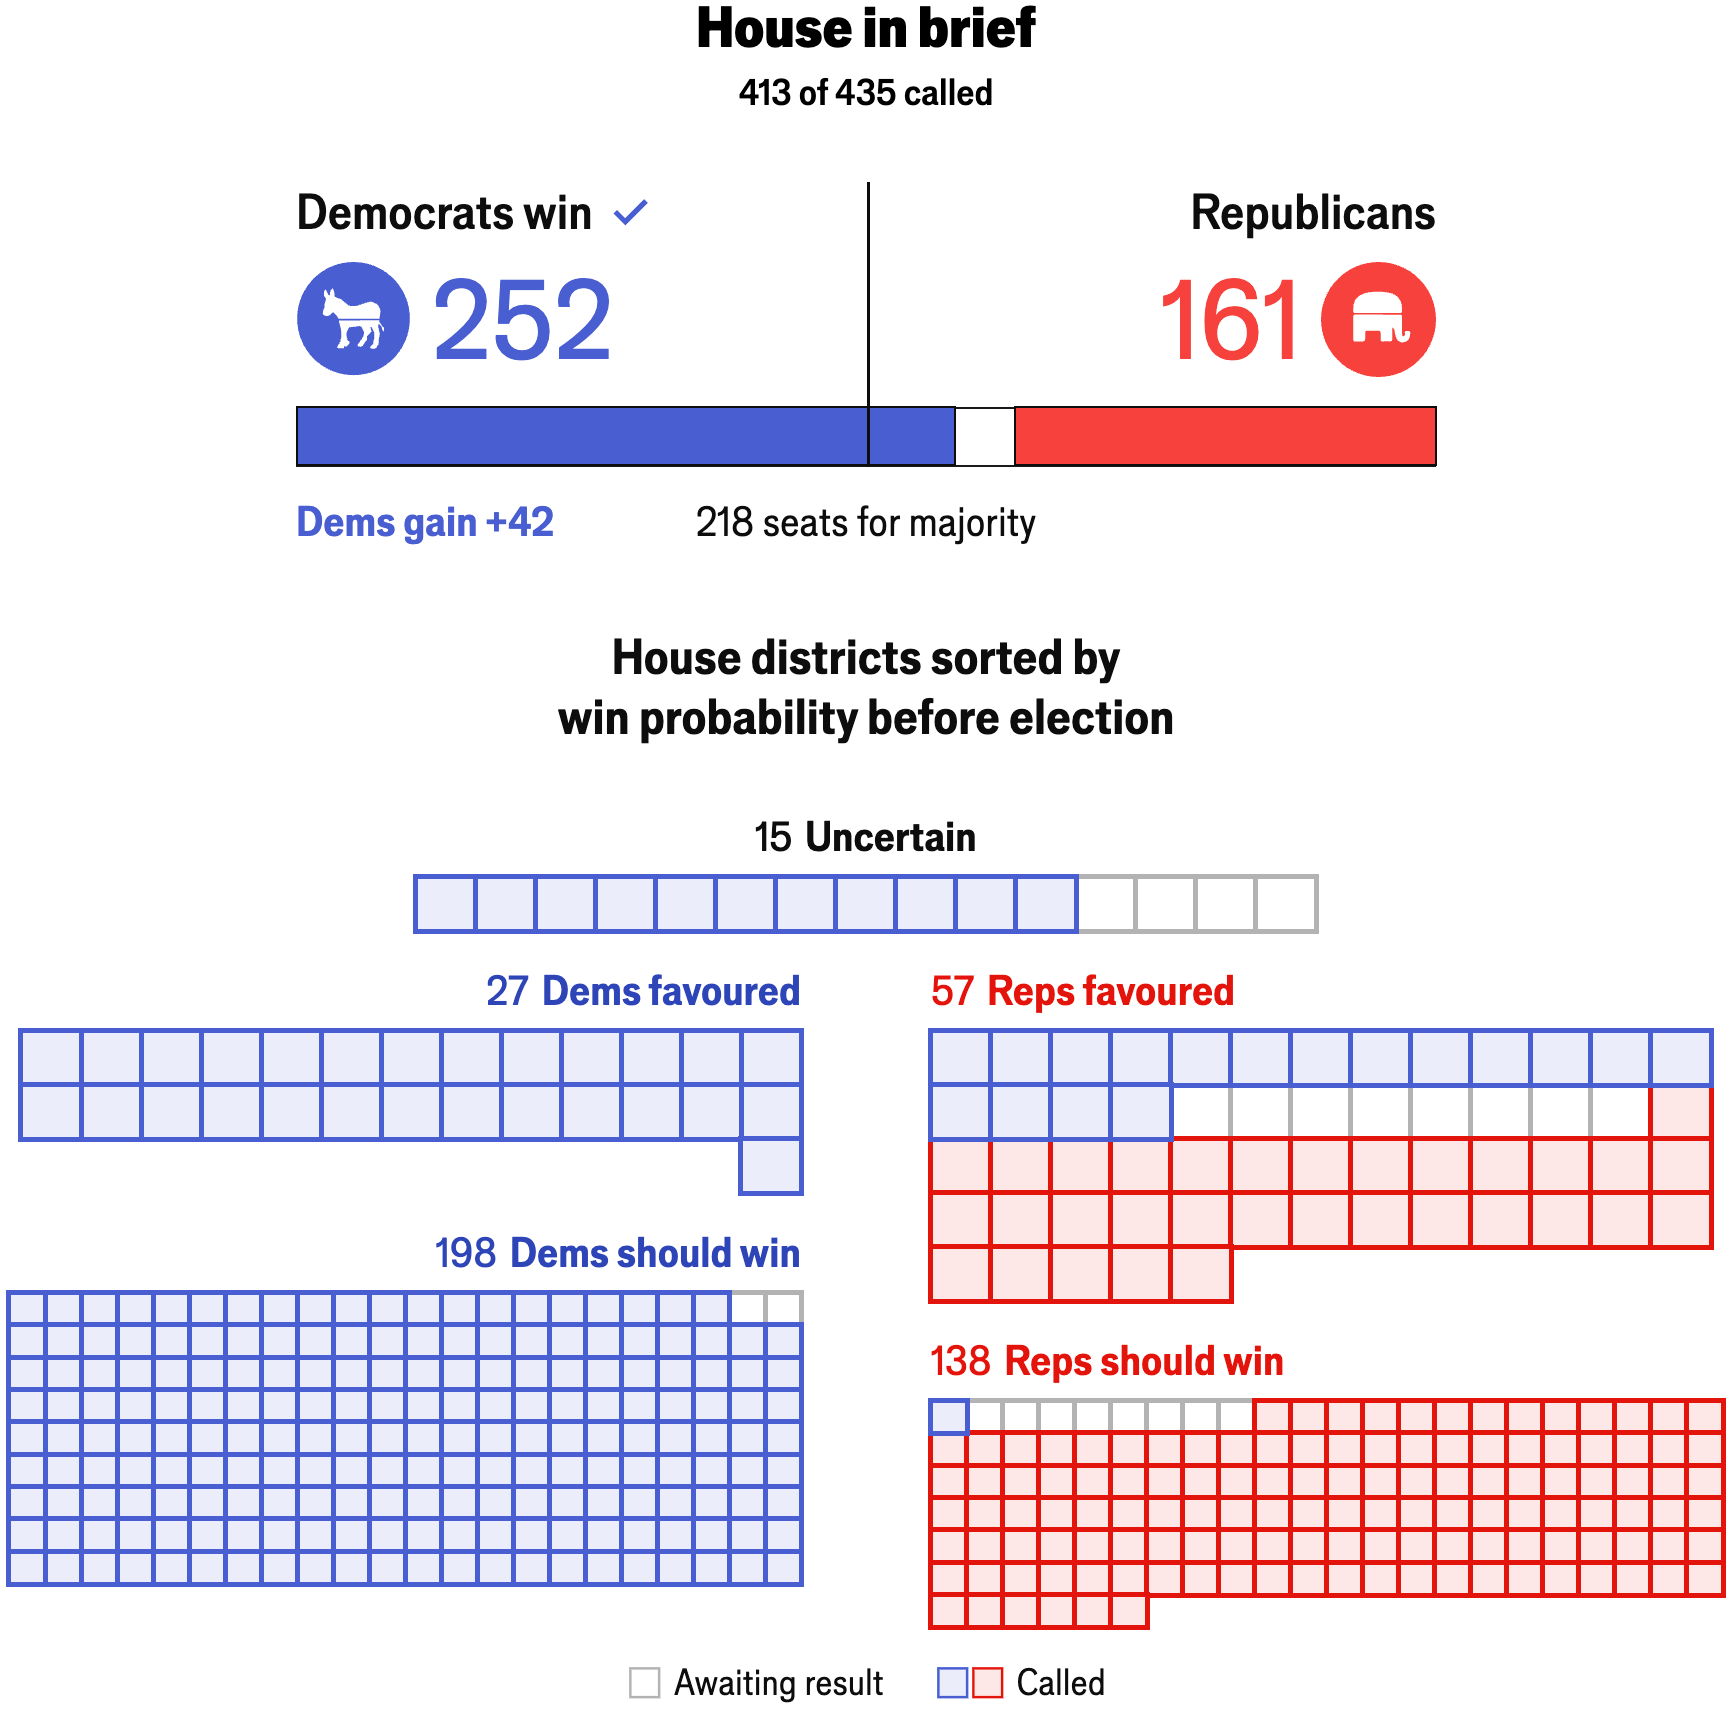
The Economist: <a href="https://www.economist.com/interactive/2026/us-midterms/results/house"><strong>Democrats won a resounding majority in the House</strong></a>, November 9
The Economist: Democrats won a resounding majority in the House, November 9
The Wall Street Journal: <a href="https://www.wsj.com/election/2026/general/house"><strong>House Election 2026: Live Midterm Results</strong></a>, November 9
The Wall Street Journal: House Election 2026: Live Midterm Results, November 9
The Economist: <a href="https://www.economist.com/interactive/2026/us-midterms/results/summary"><strong>Live results for the US midterms 2026</strong></a>, November 9
The Economist: Live results for the US midterms 2026, November 9
The Economist: <a href="https://www.economist.com/interactive/graphic-detail/2026/11/04/the-democrats-extraordinary-triumph-explained"><strong>The Democrats’ extraordinary triumph</strong></a>, explained, November 4
The Economist: The Democrats’ extraordinary triumph, explained, November 4
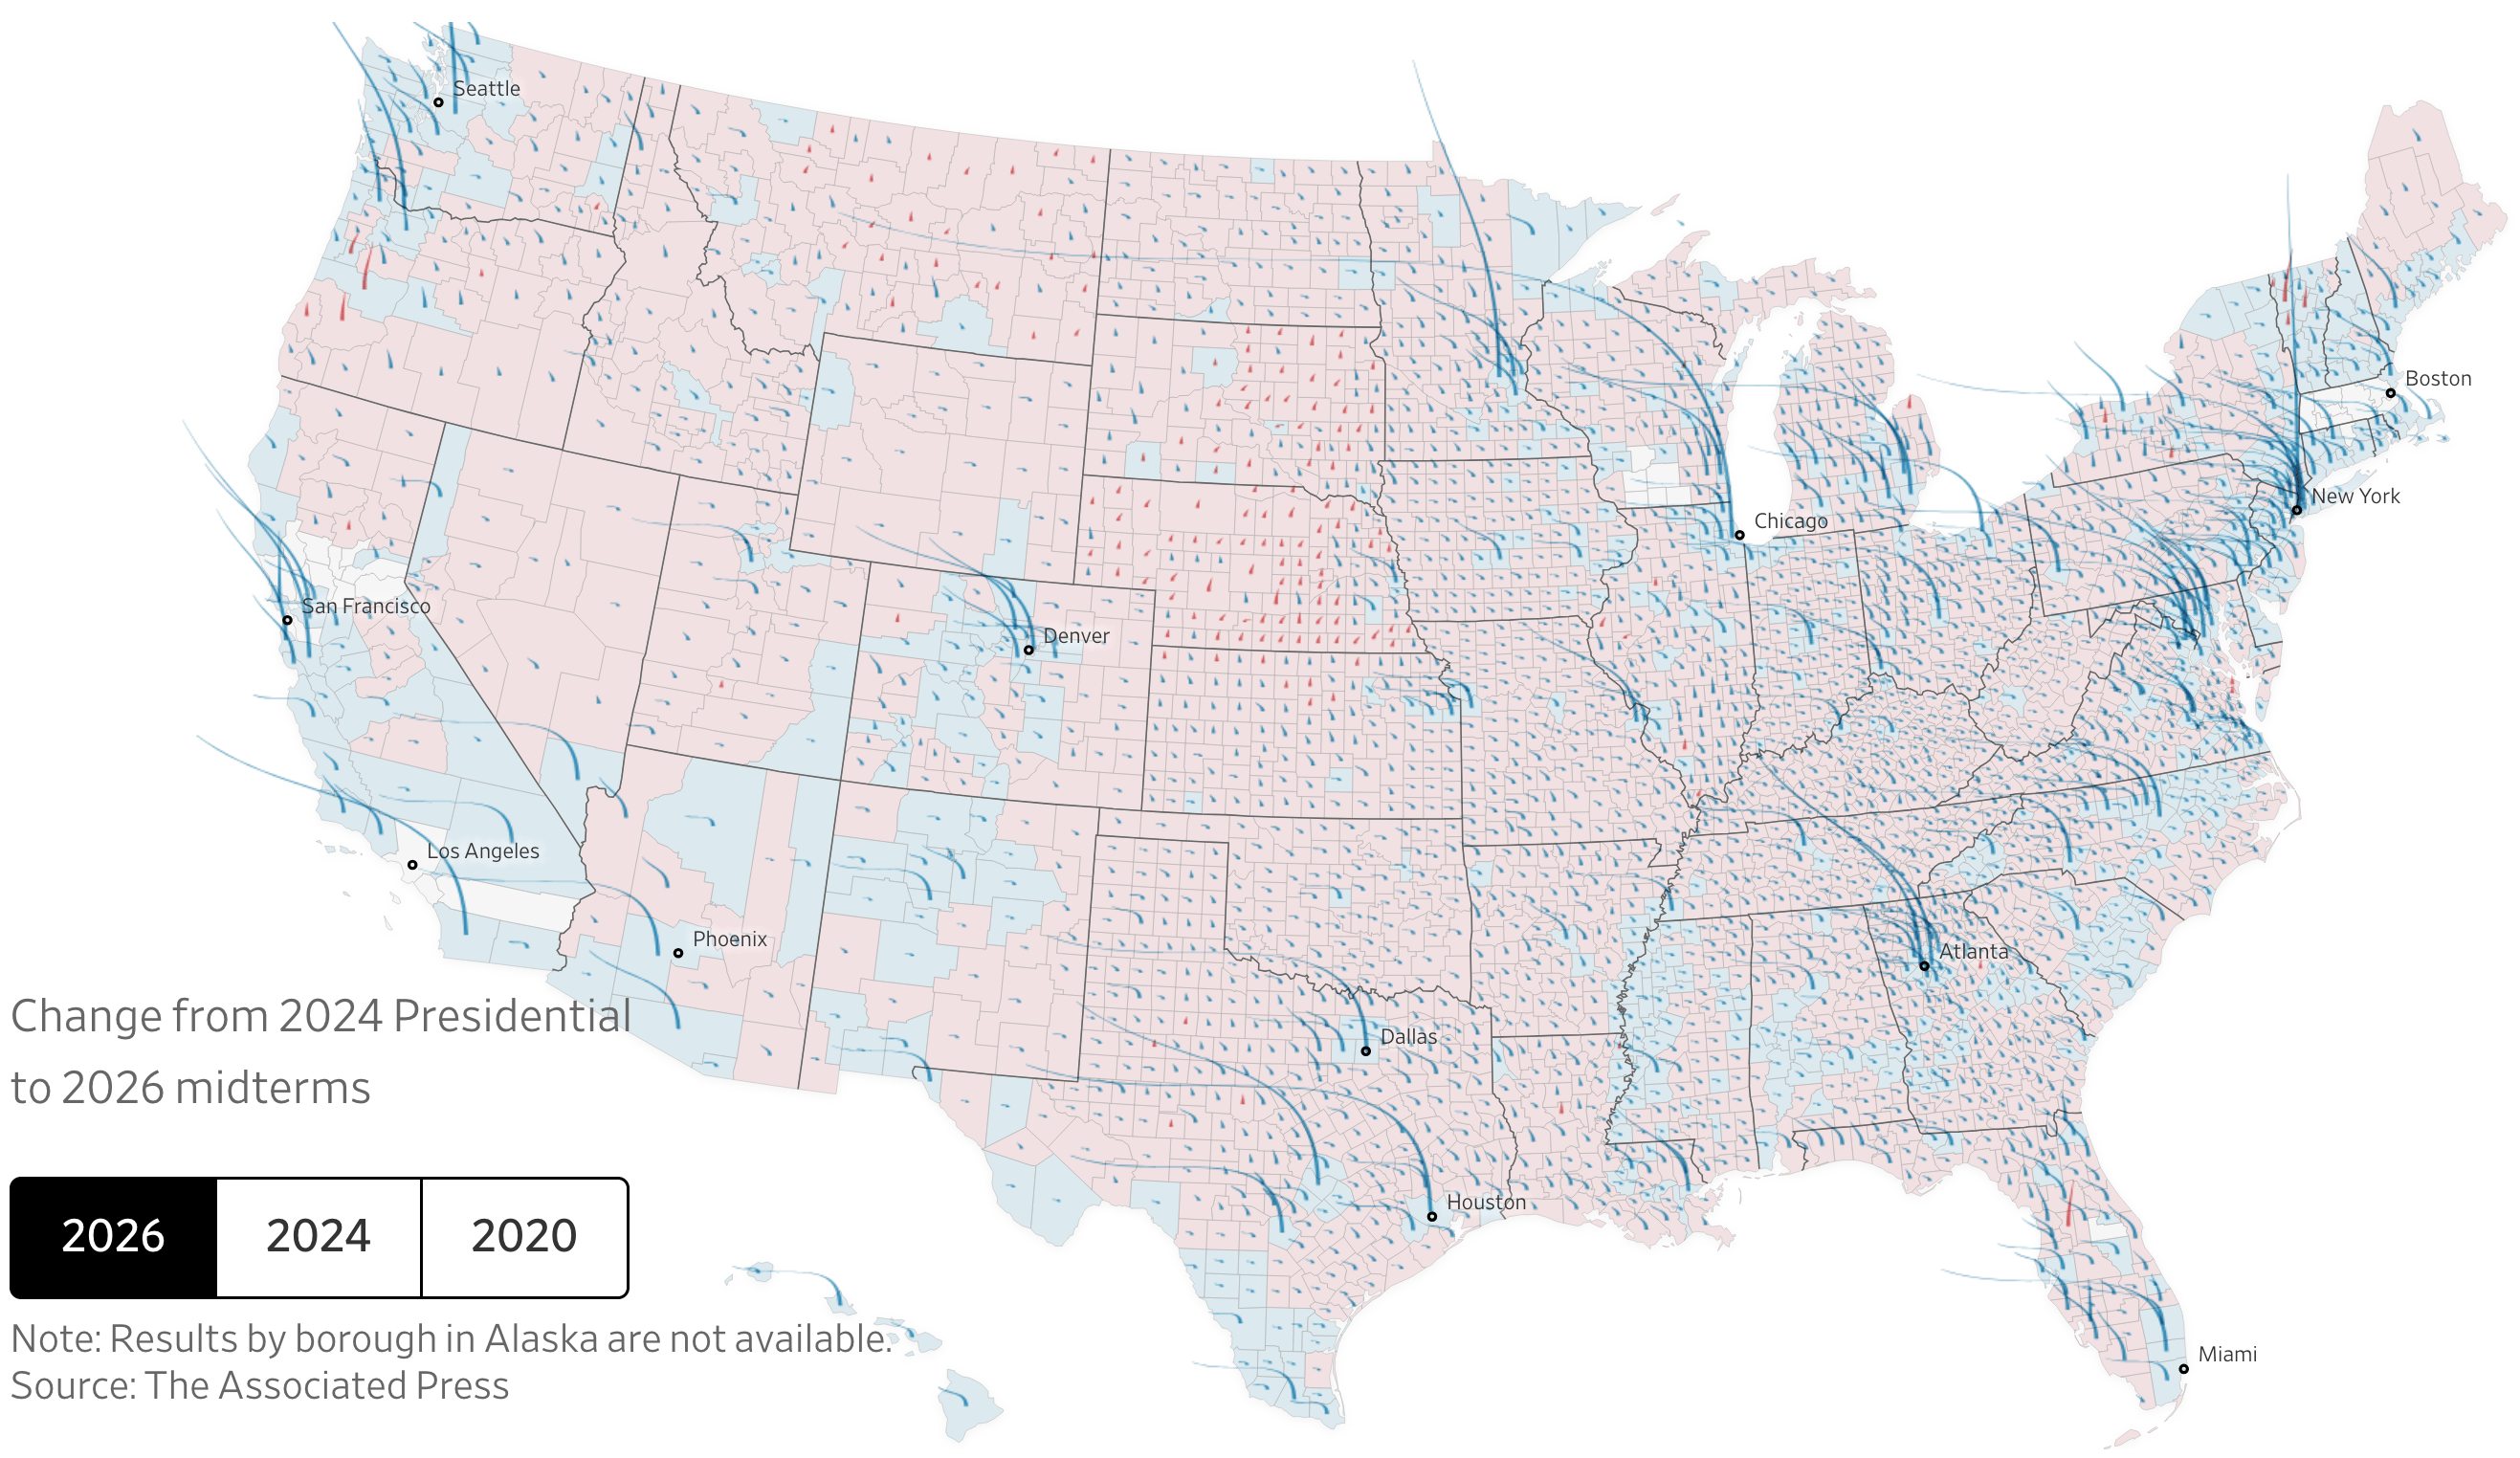
The Wall Street Journal: <a href="https://www.wsj.com/articles/a-county-by-county-look-at-how-the-blue-wave-touched-nearly-every-part-of-america-e1dd346c?st=rDvTsC&amp;reflink=desktopwebshare_permalink"><strong>A County-by-County Look at How the Blue Wave Touched Nearly Every Part of America</strong></a>, November 6 <span class="badge">fun swing effect</span>
The Wall Street Journal: A County-by-County Look at How the Blue Wave Touched Nearly Every Part of America, November 6 fun swing effect

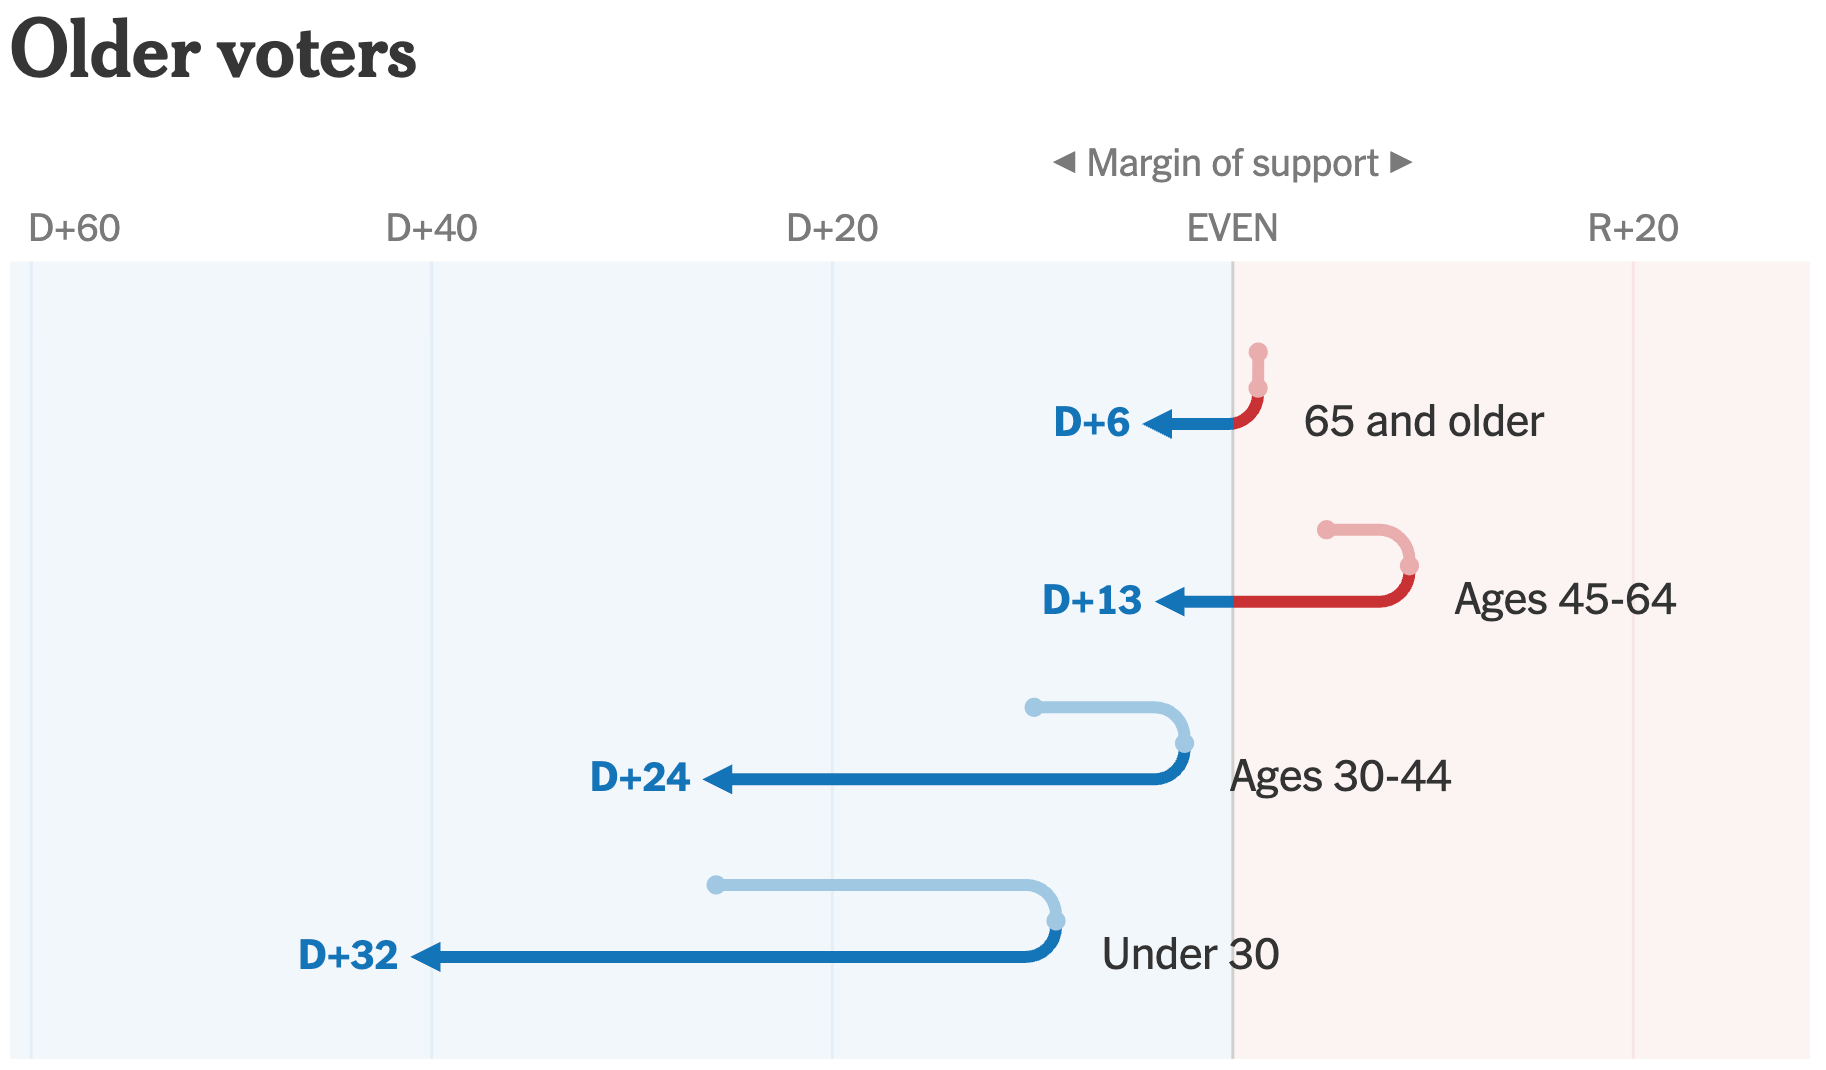
Focusing on voter demographics, many major demographic groups shifted to the left, contributing to the Democrats' victory.
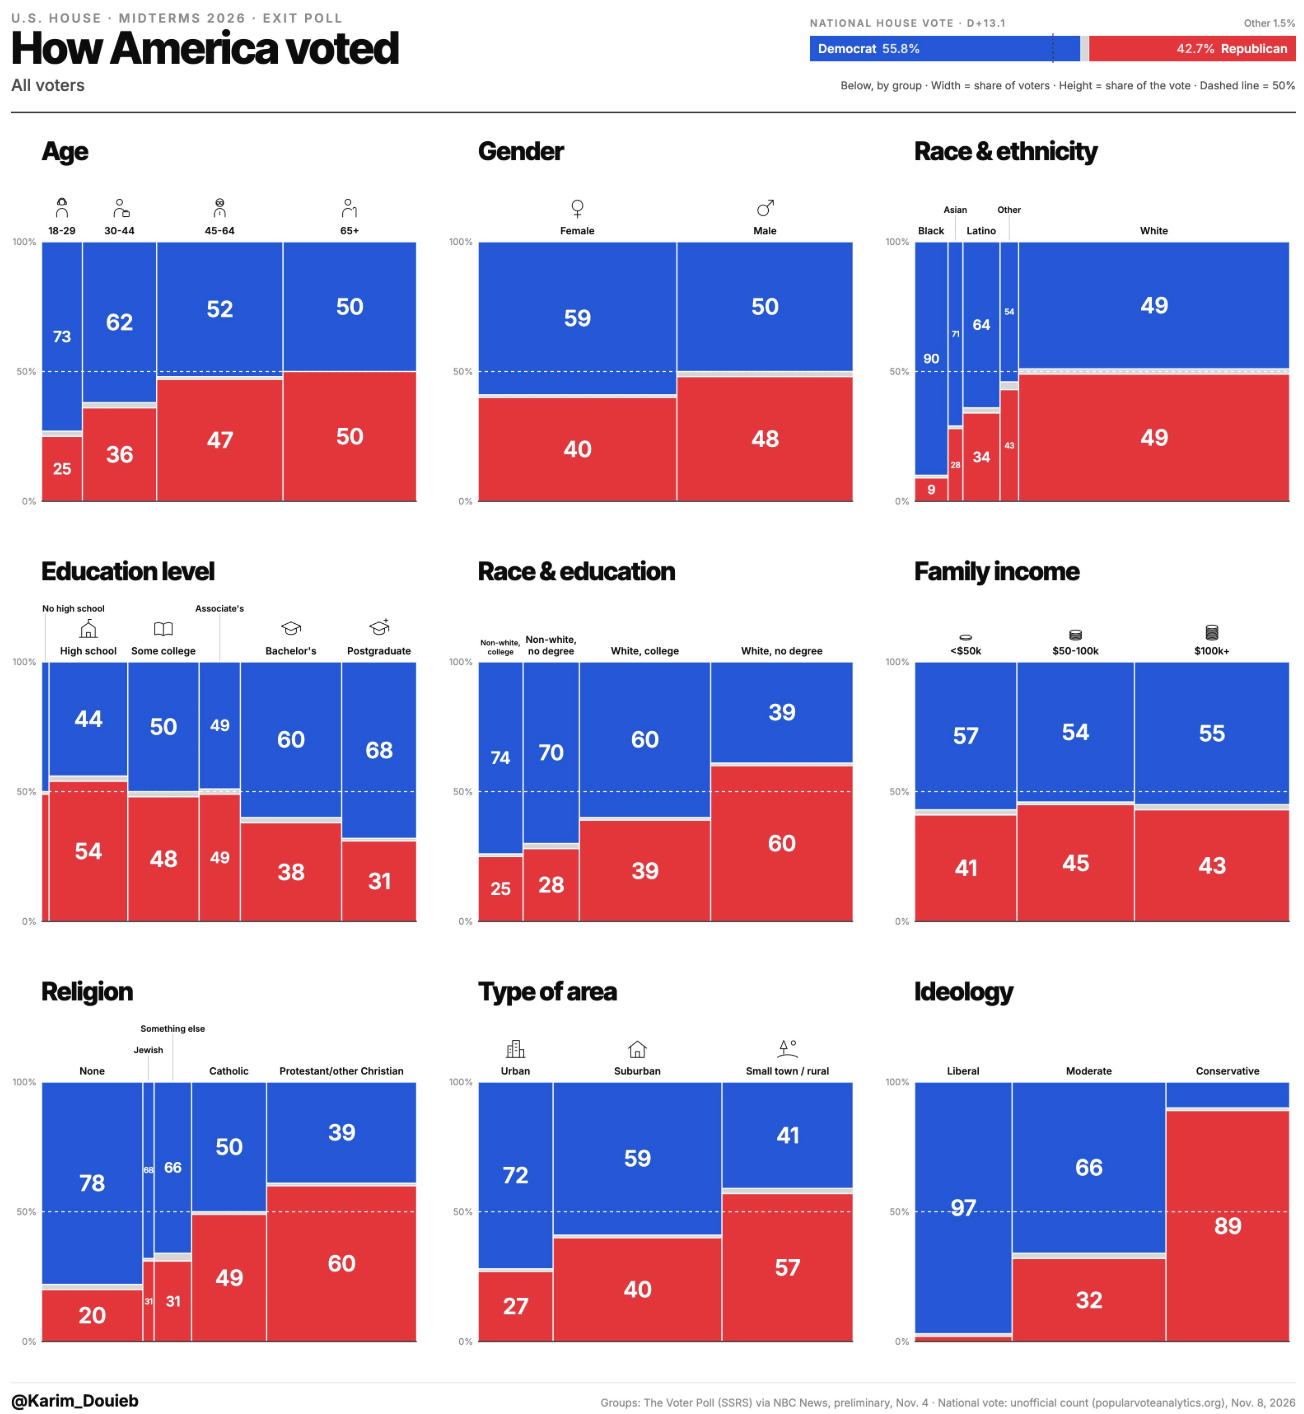
Karim Douïeb: "How America voted in the 2026 midterms?," November 9 (<a href="https://x.com/karim_douieb/status/2119808721996112289"><strong>X</strong></a>)
Karim Douïeb: "How America voted in the 2026 midterms?," November 9 (X)
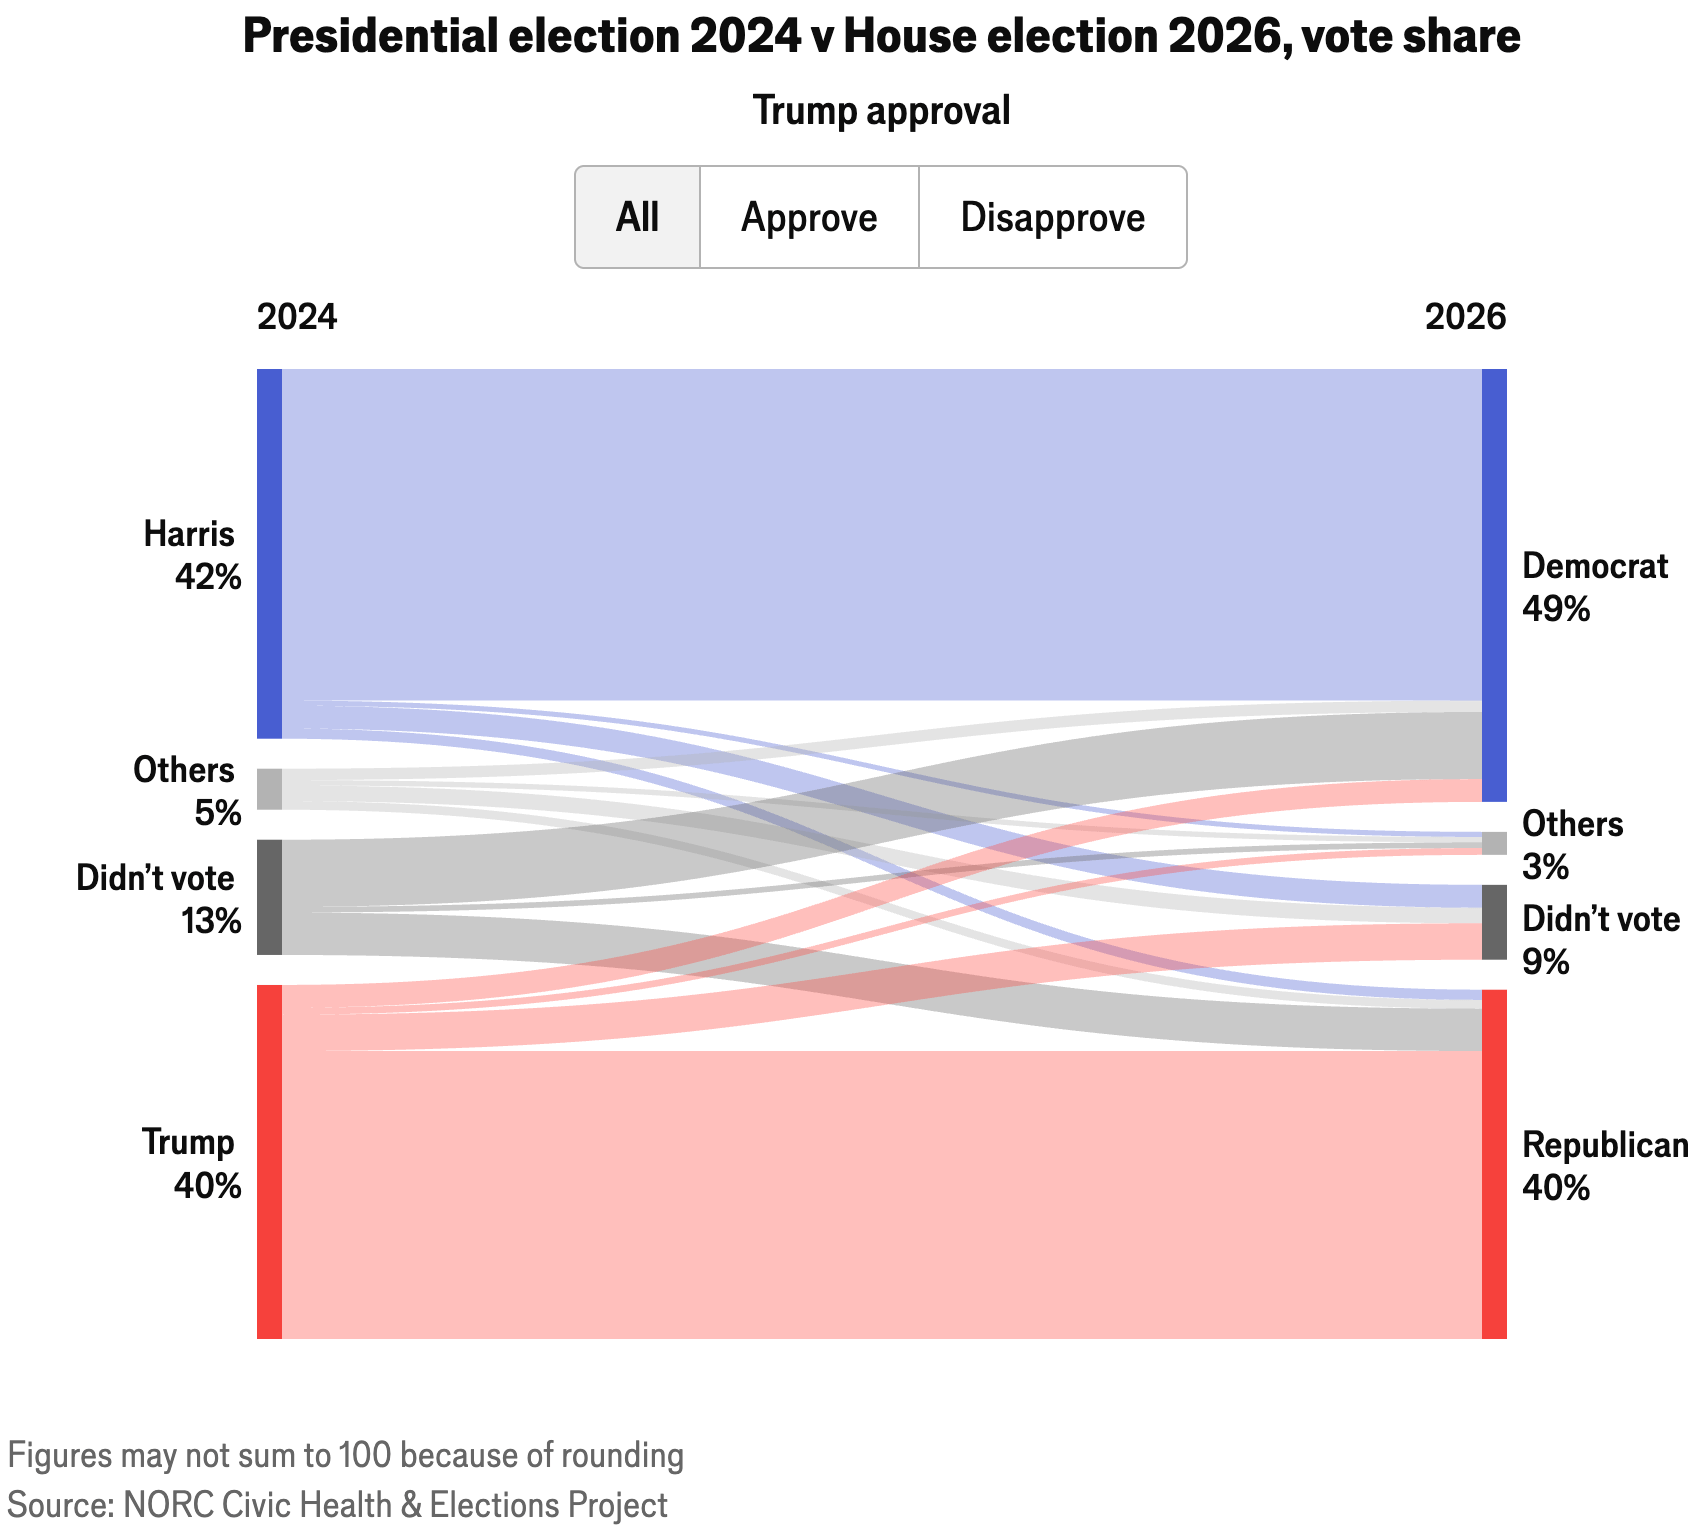
The New York Times: <a href="https://www.nytimes.com/interactive/2026/11/04/us/elections/midterms-swing-voters-democrats.html"><strong>Every Major Demographic Group Swung Left Amid Trump Backlash</strong></a>, November 4
The New York Times: Every Major Demographic Group Swung Left Amid Trump Backlash, November 4
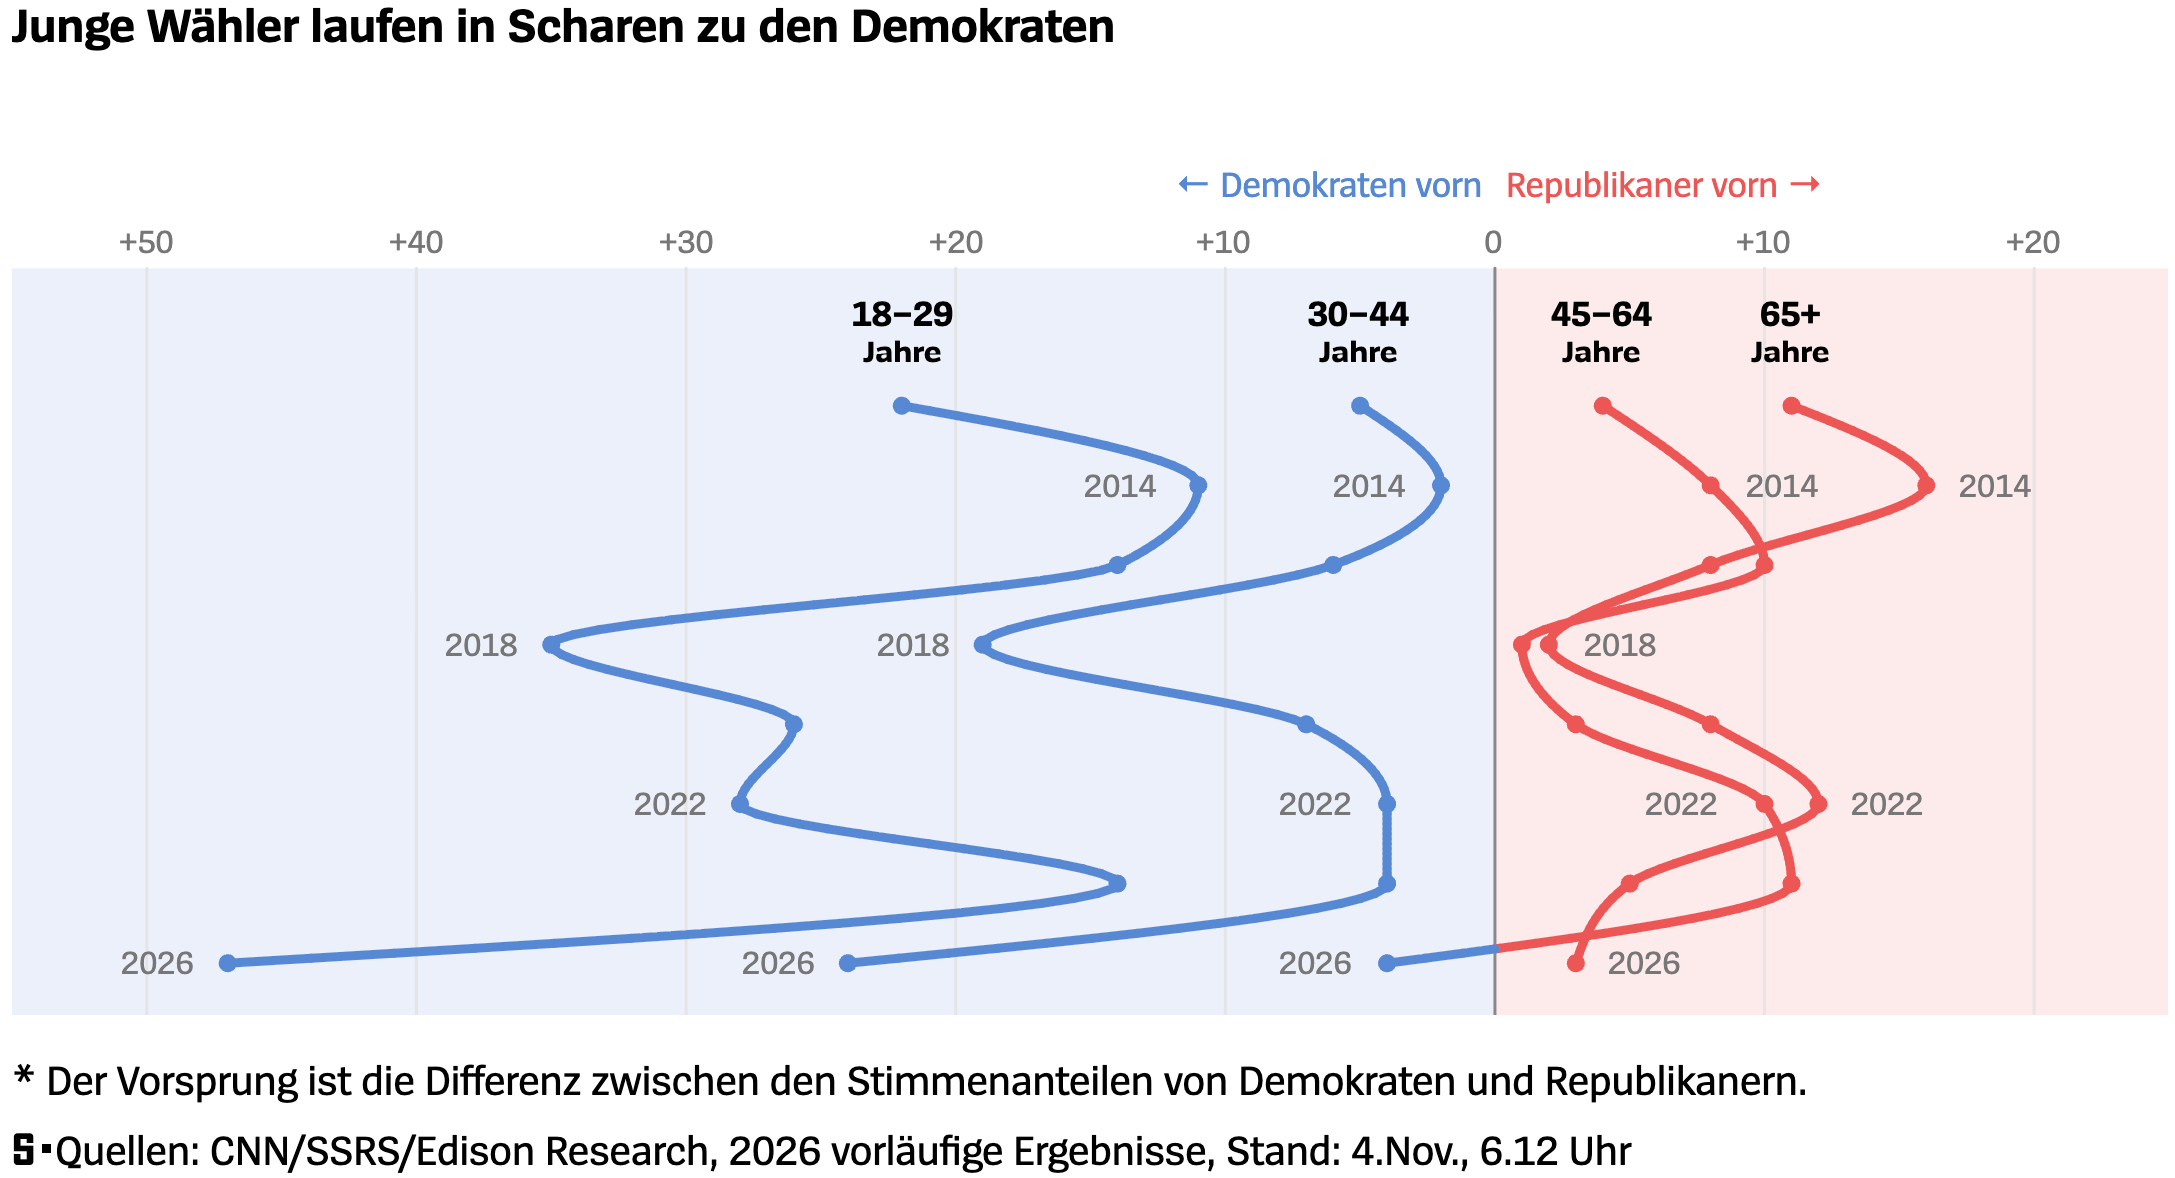
Der Spiegel: <a href="https://www.spiegel.de/ausland/us-midterms-2026-so-historisch-ist-der-triumph-der-demokraten-a-1e8c8d65-2f59-4e86-b485-16a2d7e01a71"><strong>Diese Wahl ist schon jetzt historisch. Aus diesen vier Gründen </strong></a>[<em>Chart title: Young voters are flocking to the Democrats</em>], November 4
Der Spiegel: Diese Wahl ist schon jetzt historisch. Aus diesen vier Gründen [Chart title: Young voters are flocking to the Democrats], November 4
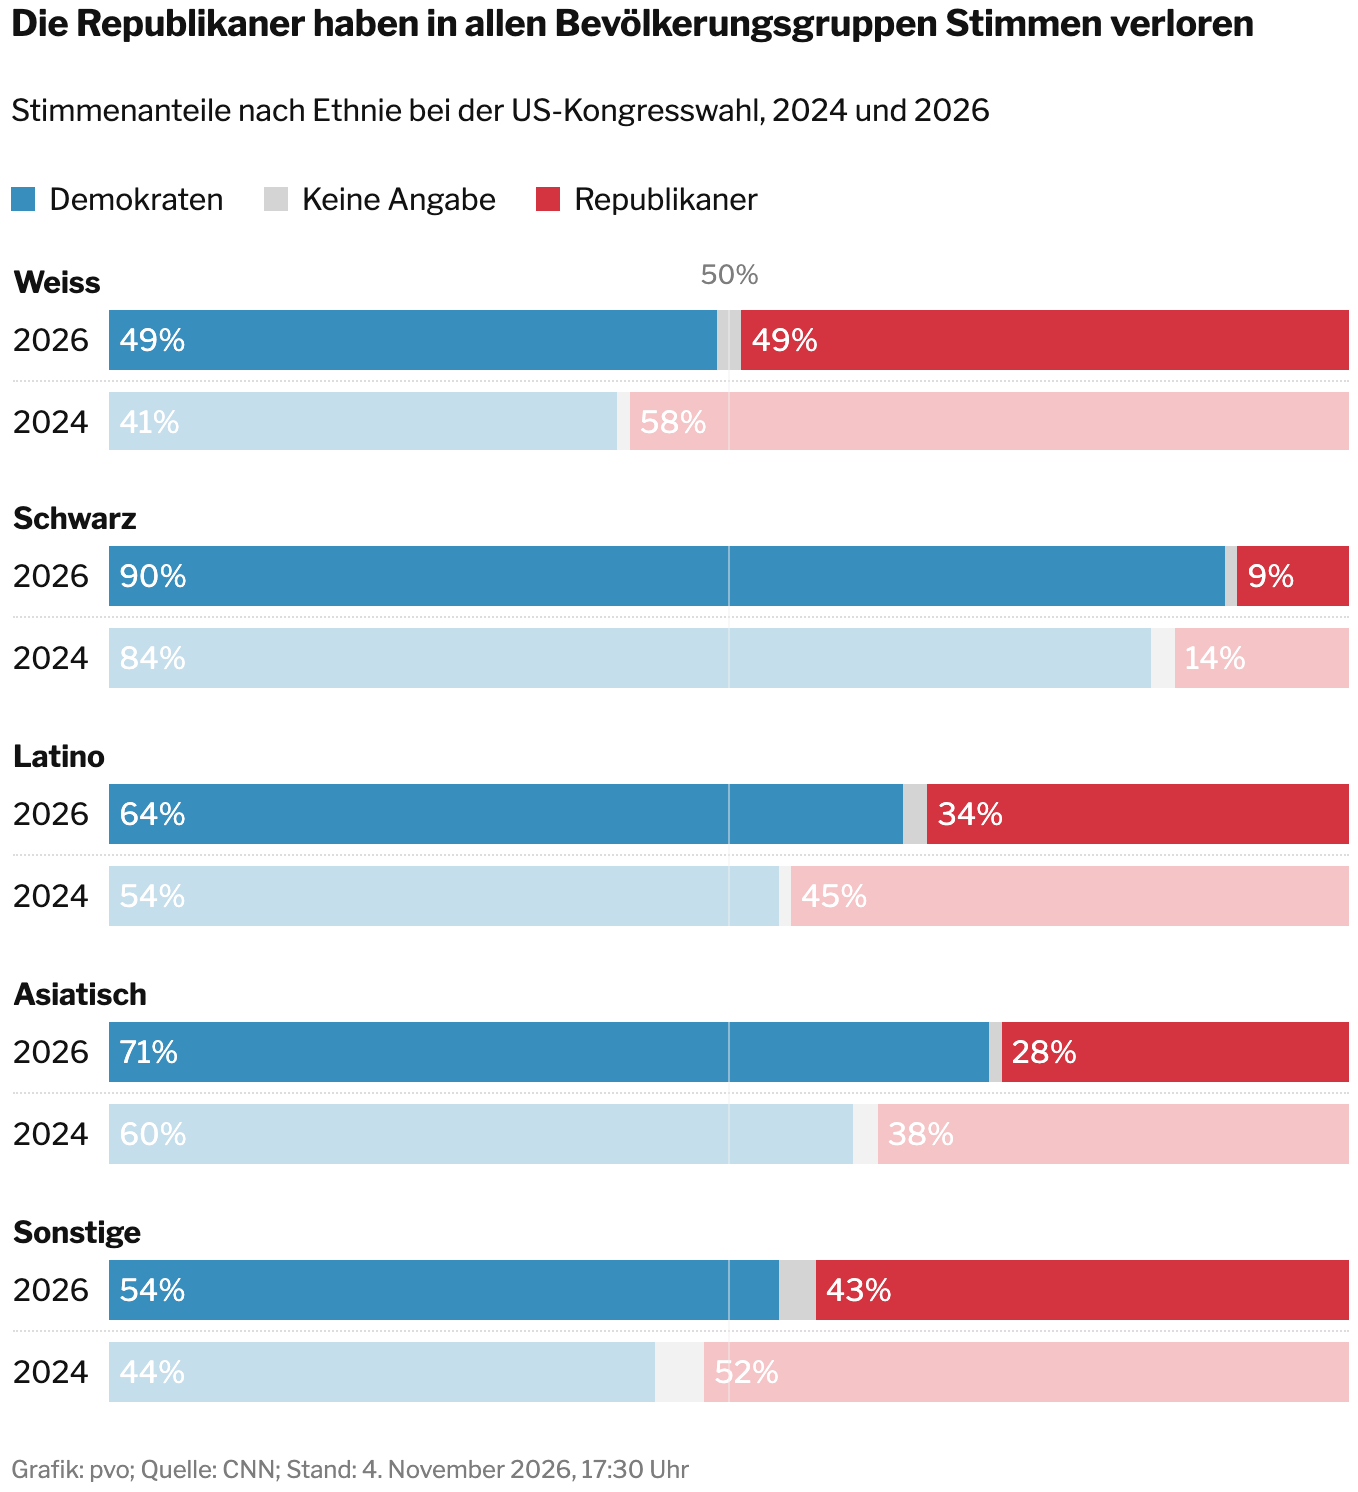
Tages-Anzeiger: <a href="https://www.tagesanzeiger.ch/midterms-diese-waehlergruppen-kosteten-trump-die-mehrheit-224661257958"><strong>Diese Wählergruppen haben Trump abgestraft – und das sind die Gründe</strong></a> [<em>Chart title: The Republicans have lost votes across all demographic groups</em>], November 5
Tages-Anzeiger: Diese Wählergruppen haben Trump abgestraft – und das sind die Gründe [Chart title: The Republicans have lost votes across all demographic groups], November 5
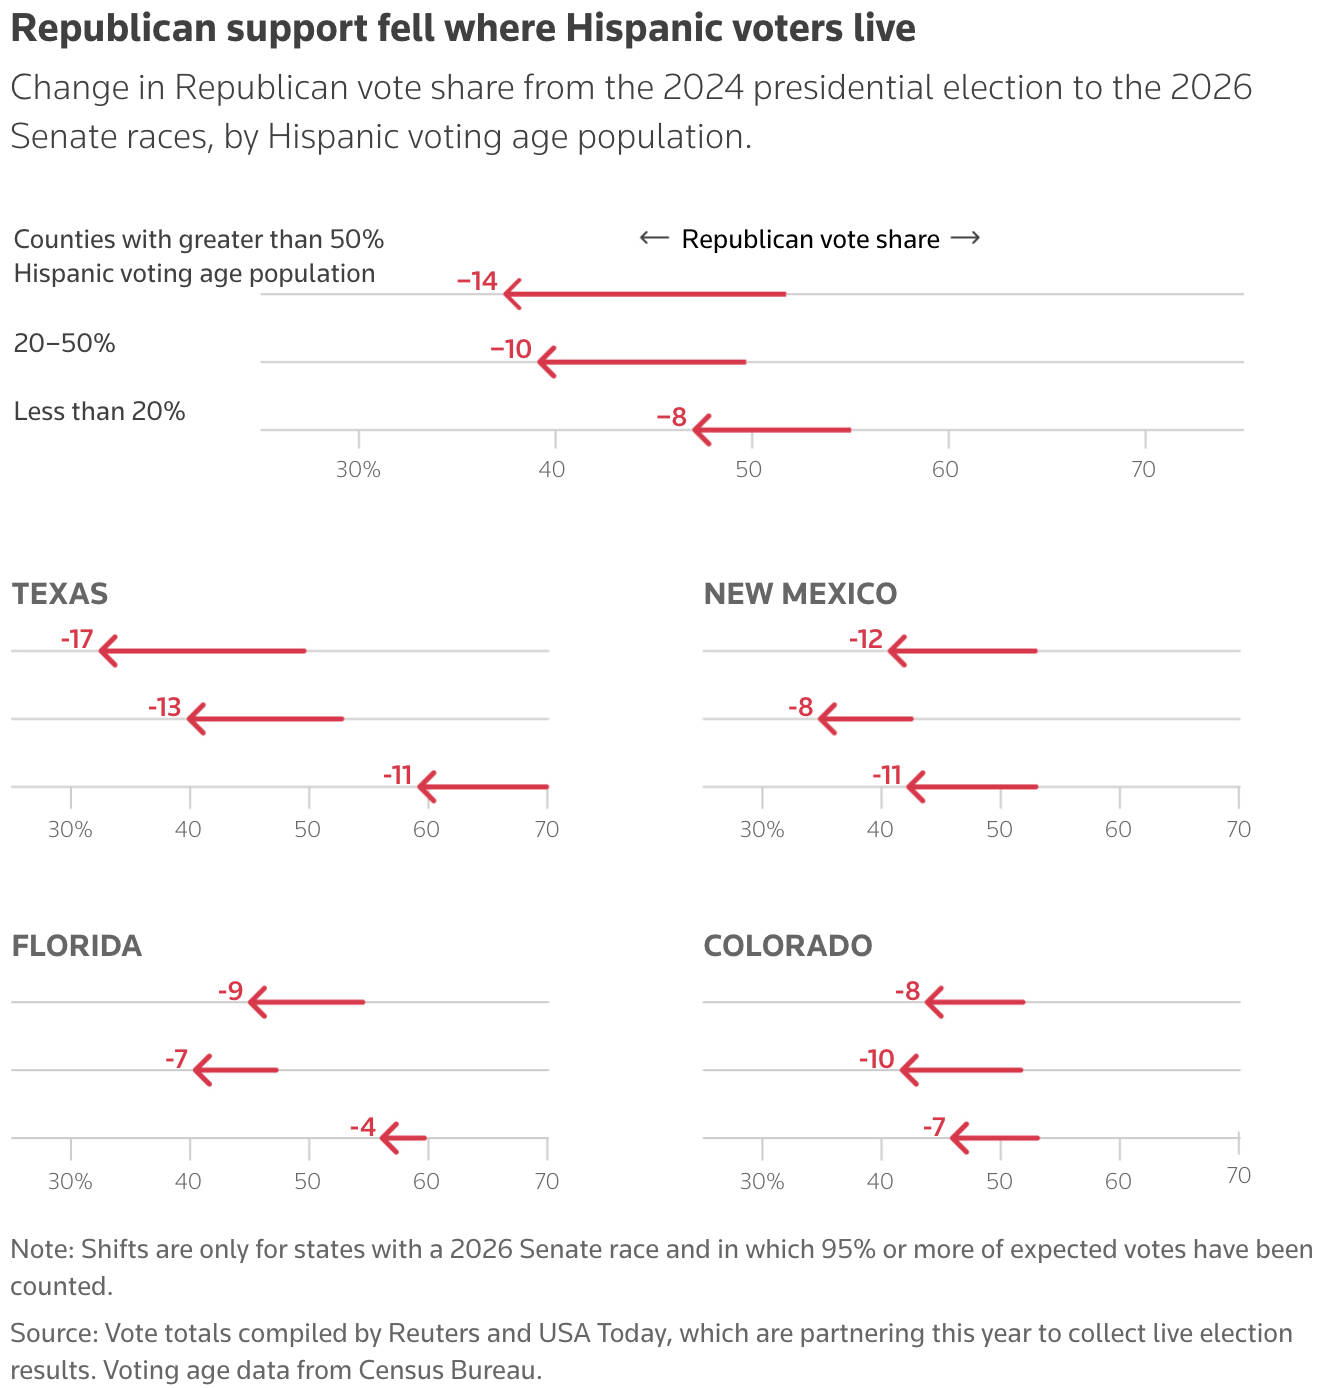
Reuters: <a href="https://www.reuters.com/graphics/US-ELECTIONS/GRAPHICS-BLOG/akpelkldzvr/2026-11-05/latino-results/"><strong>Latinos drive Democratic gains in Republican strongholds</strong></a>, November 5
Reuters: Latinos drive Democratic gains in Republican strongholds, November 5
The Washington Post: The voting groups that powered the Democratic sweep, November 4

Moving on to the subject of bikes, as cities move towards becoming more bicycle-friendly, take a look at a planning tool for bike networks in European cities.
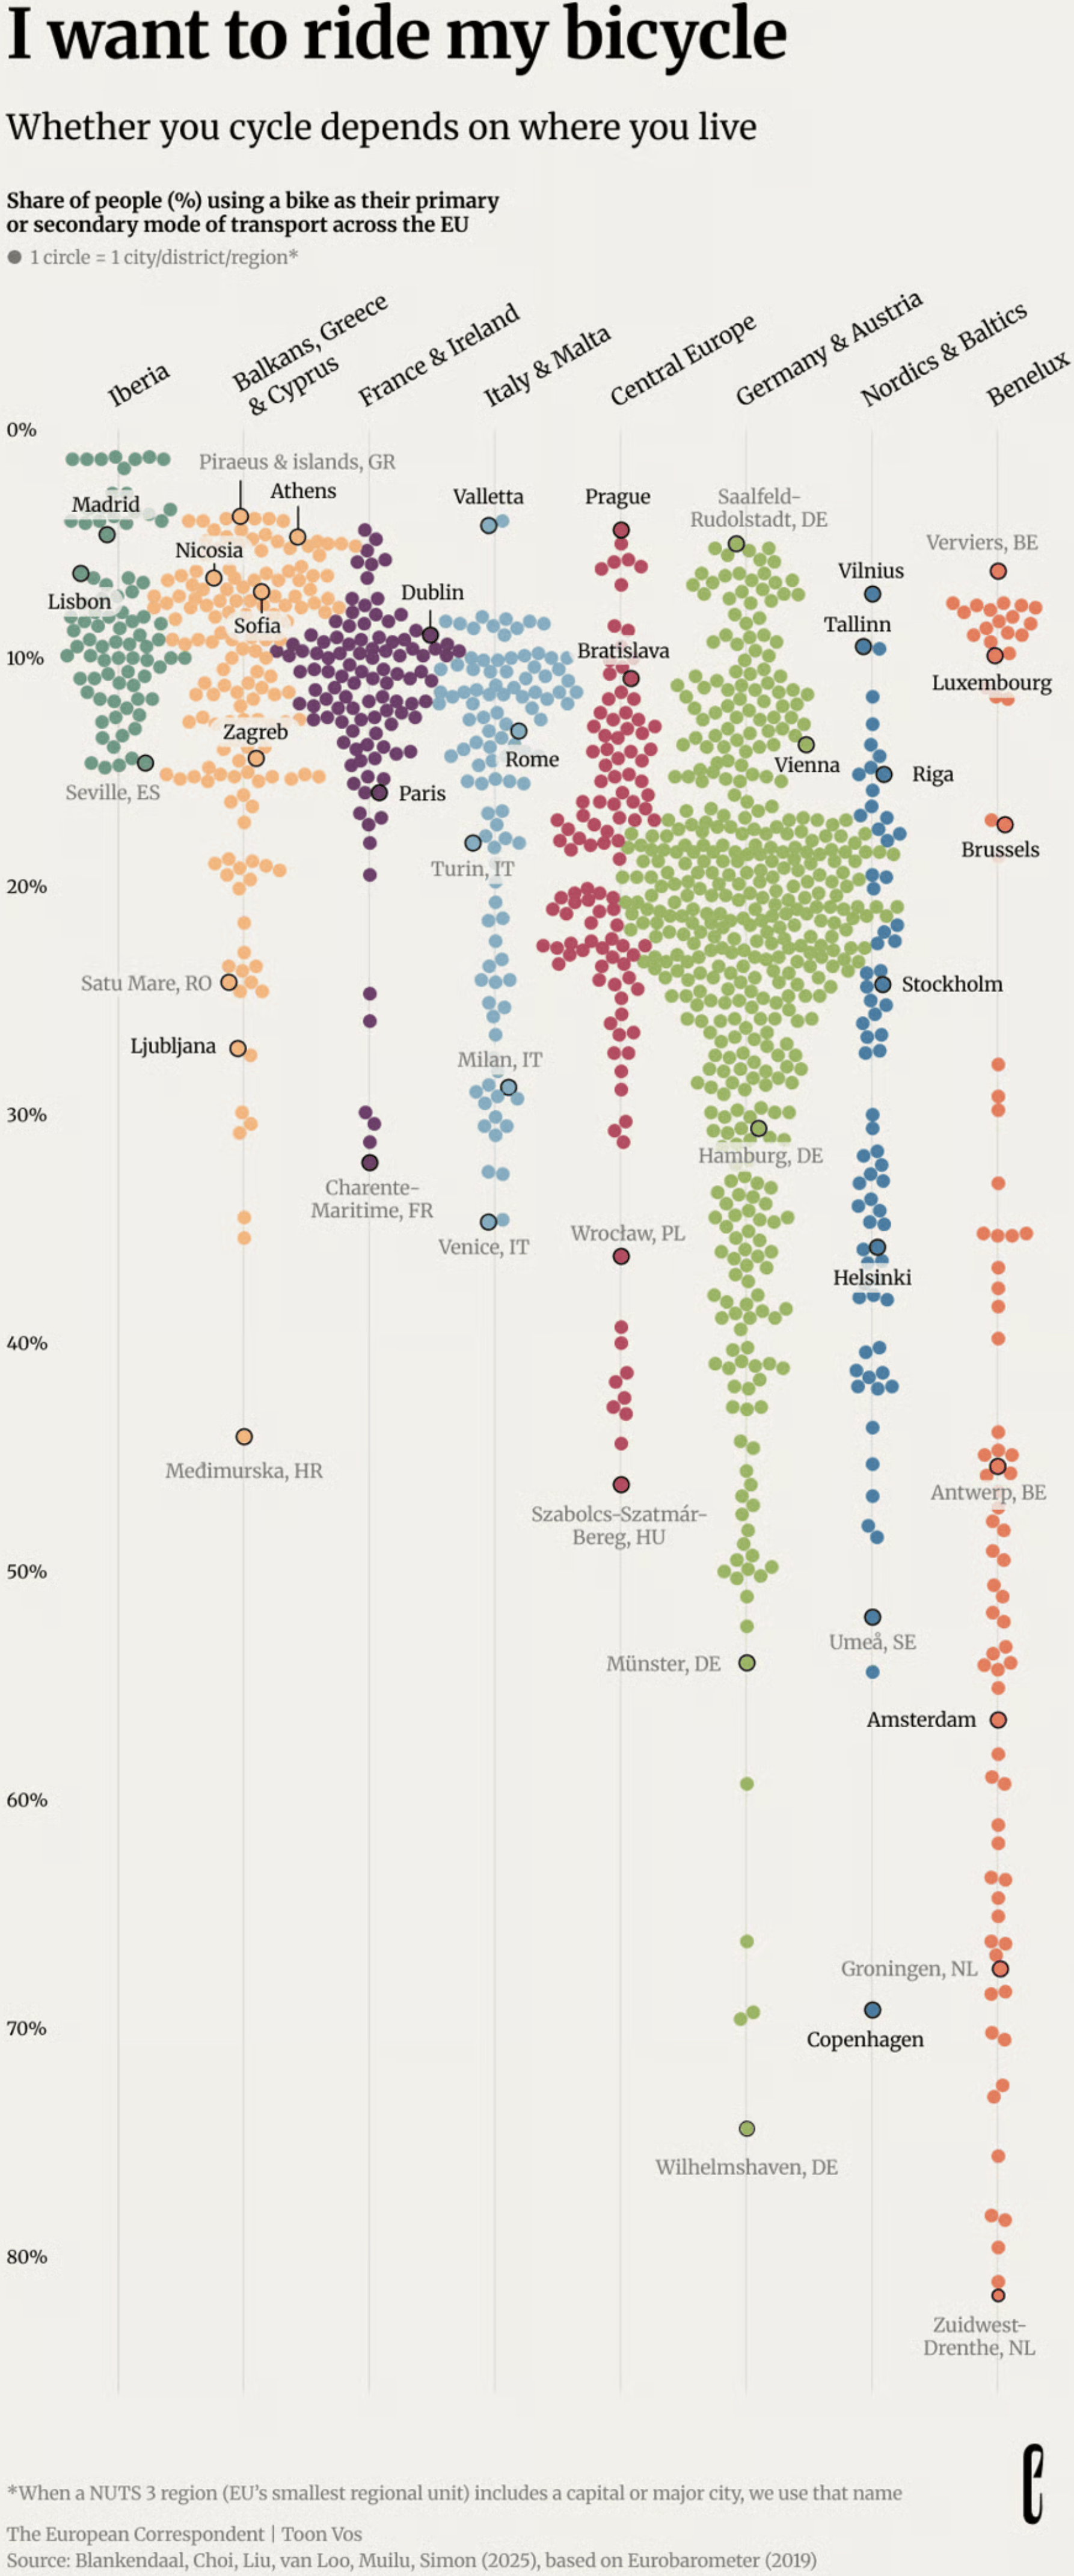
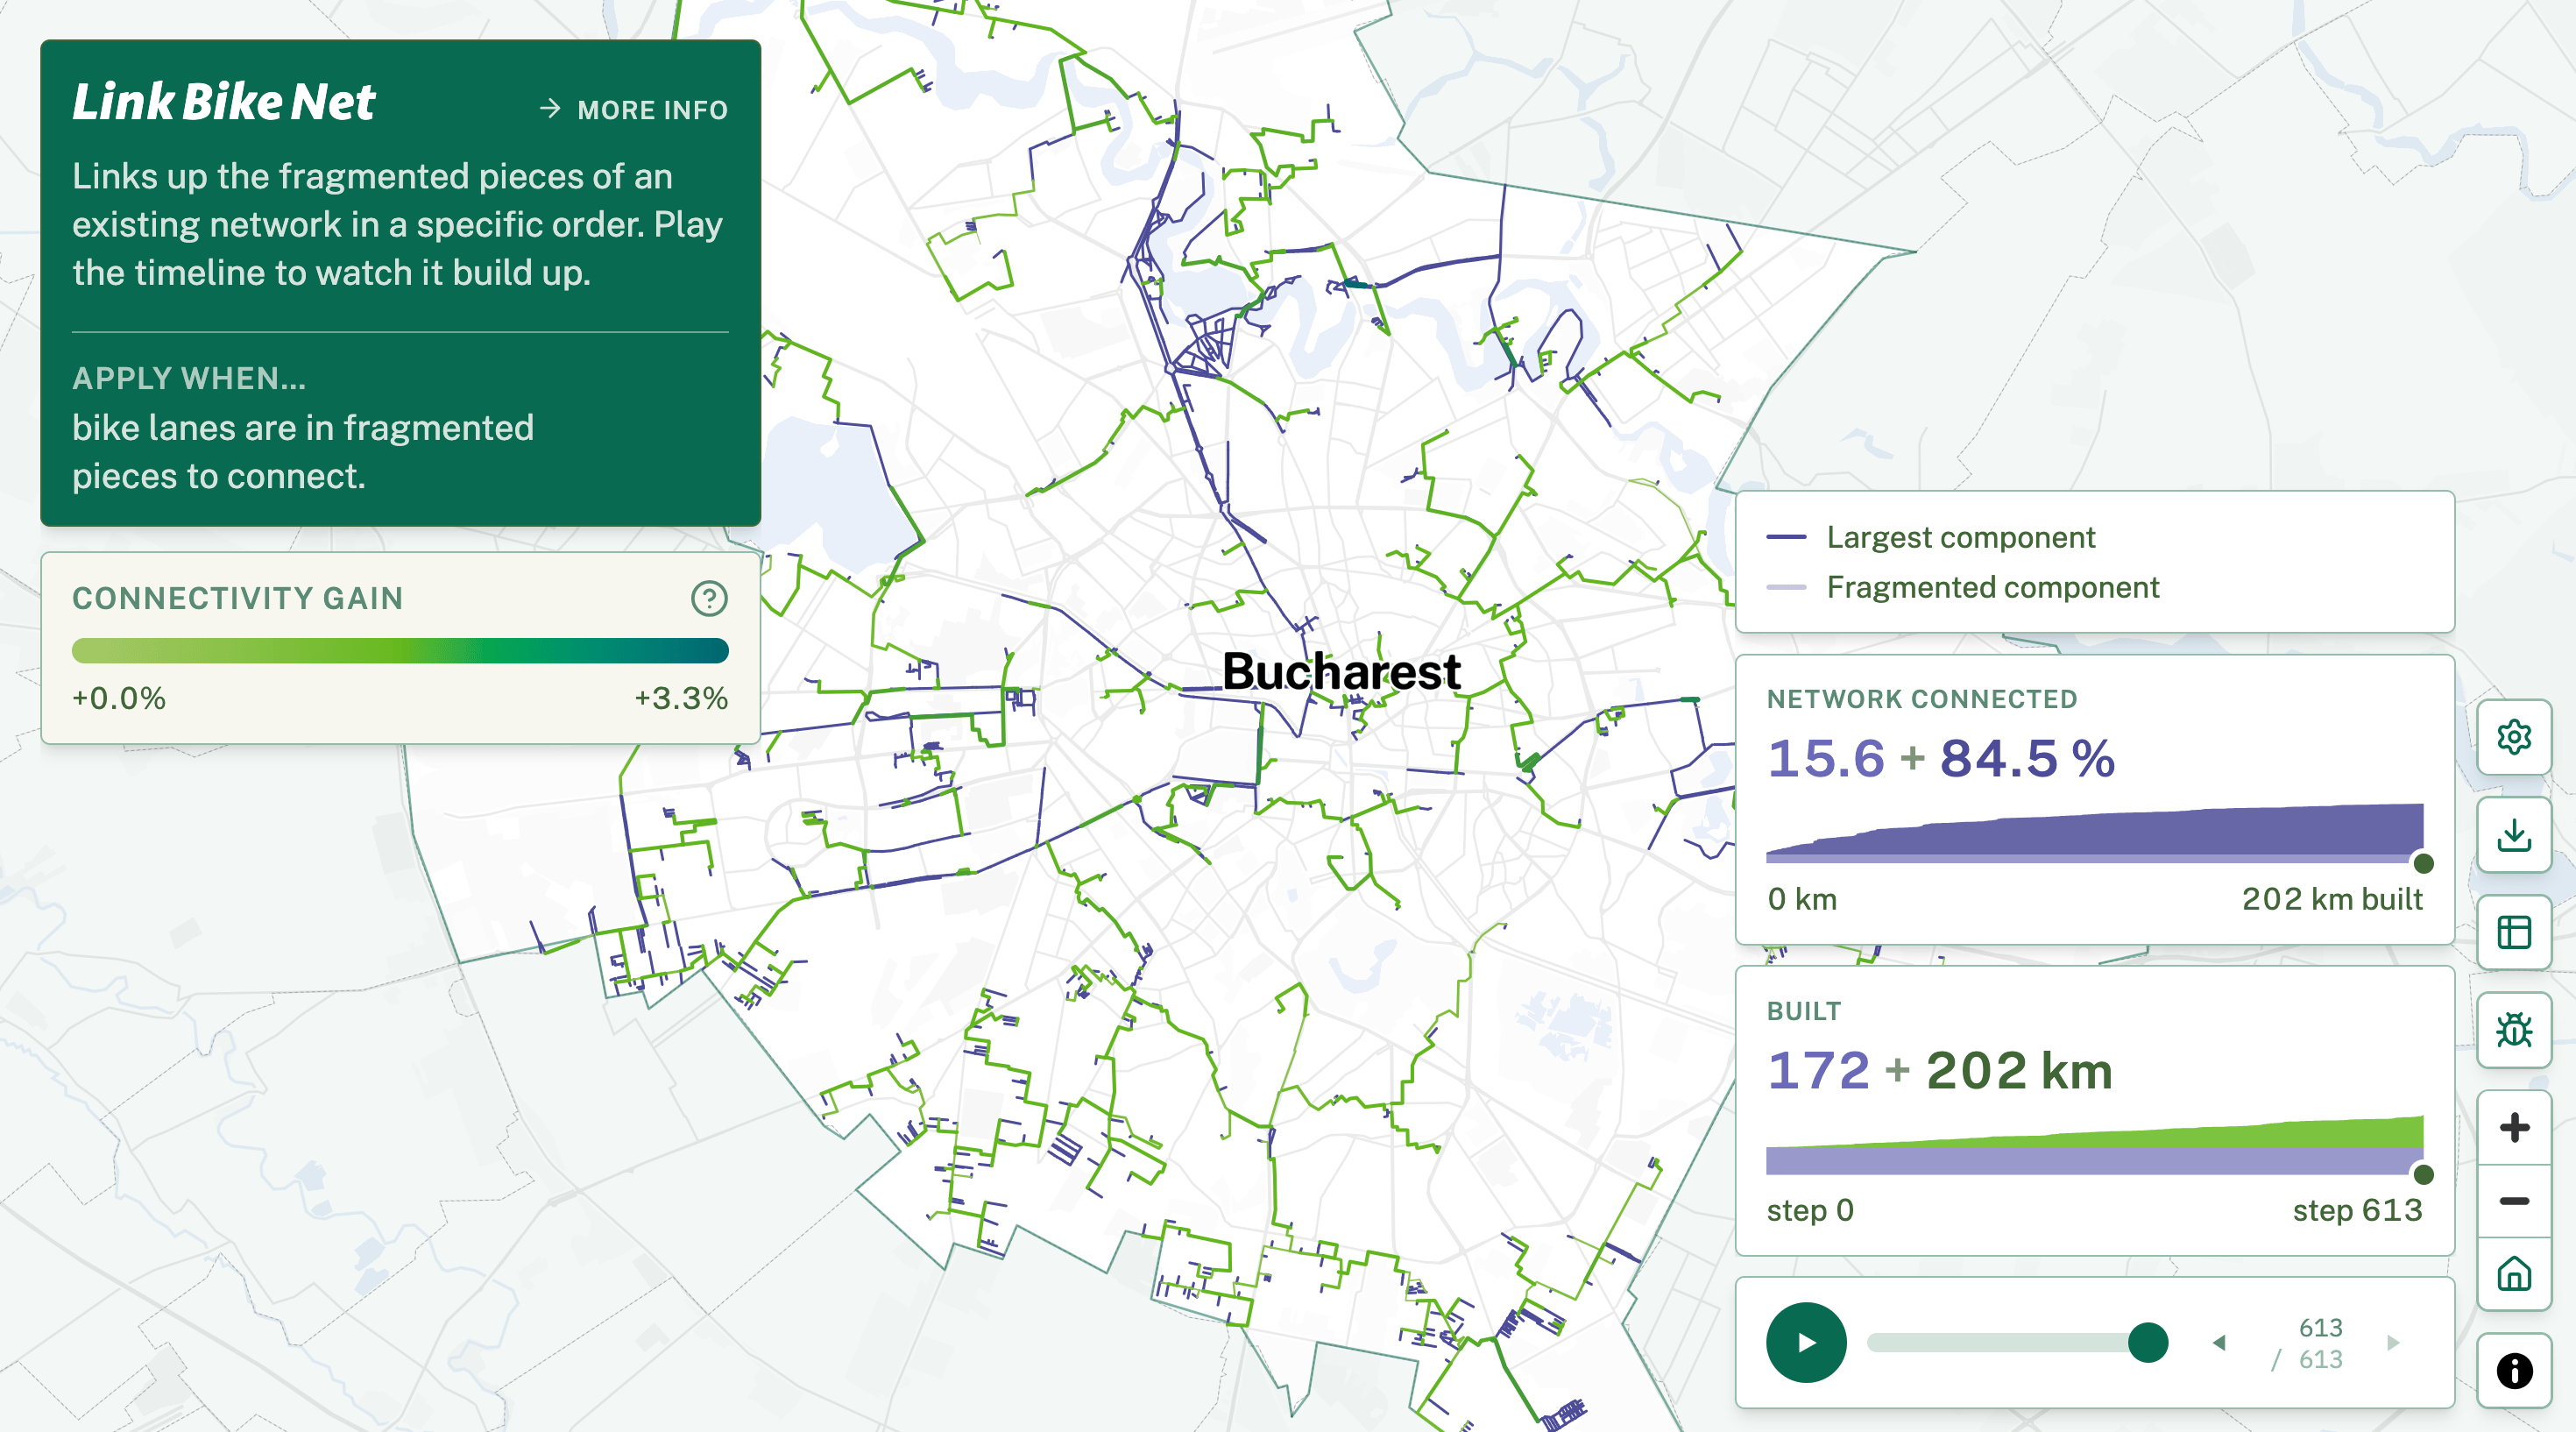
The European Correspondent: <a href="https://europeancorrespondent.com/en/r/what-it-takes-to-get-europe-on-a-bike"><strong>What it takes to get Europe on a bike</strong></a>, November 6
The European Correspondent: What it takes to get Europe on a bike, November 6
Moritz Stefaner: "✨ Just launched! ✨ Can open-source data tools accelerate the green transition of European cities? [...]showcases five algorithms to improve bike network planning, in order to grow, link and fix existing infrastructure [...]," November 9 (<a href="https://www.linkedin.com/posts/moritzstefaner_just-launched-can-open-source-data-ugcPost-7525168039265468416-0-JR/?utm_source=share&amp;utm_medium=member_desktop&amp;rcm=ACoAAEk-01sBCowJ89EcV5BWcY4FwVC0aeG9xj0"><strong>LinkedIn</strong></a>, <a href="https://bikenetkit.org/"><strong>project website</strong></a>)
Moritz Stefaner: "✨ Just launched! ✨ Can open-source data tools accelerate the green transition of European cities? [...]showcases five algorithms to improve bike network planning, in order to grow, link and fix existing infrastructure [...]," November 9 (LinkedIn, project website)

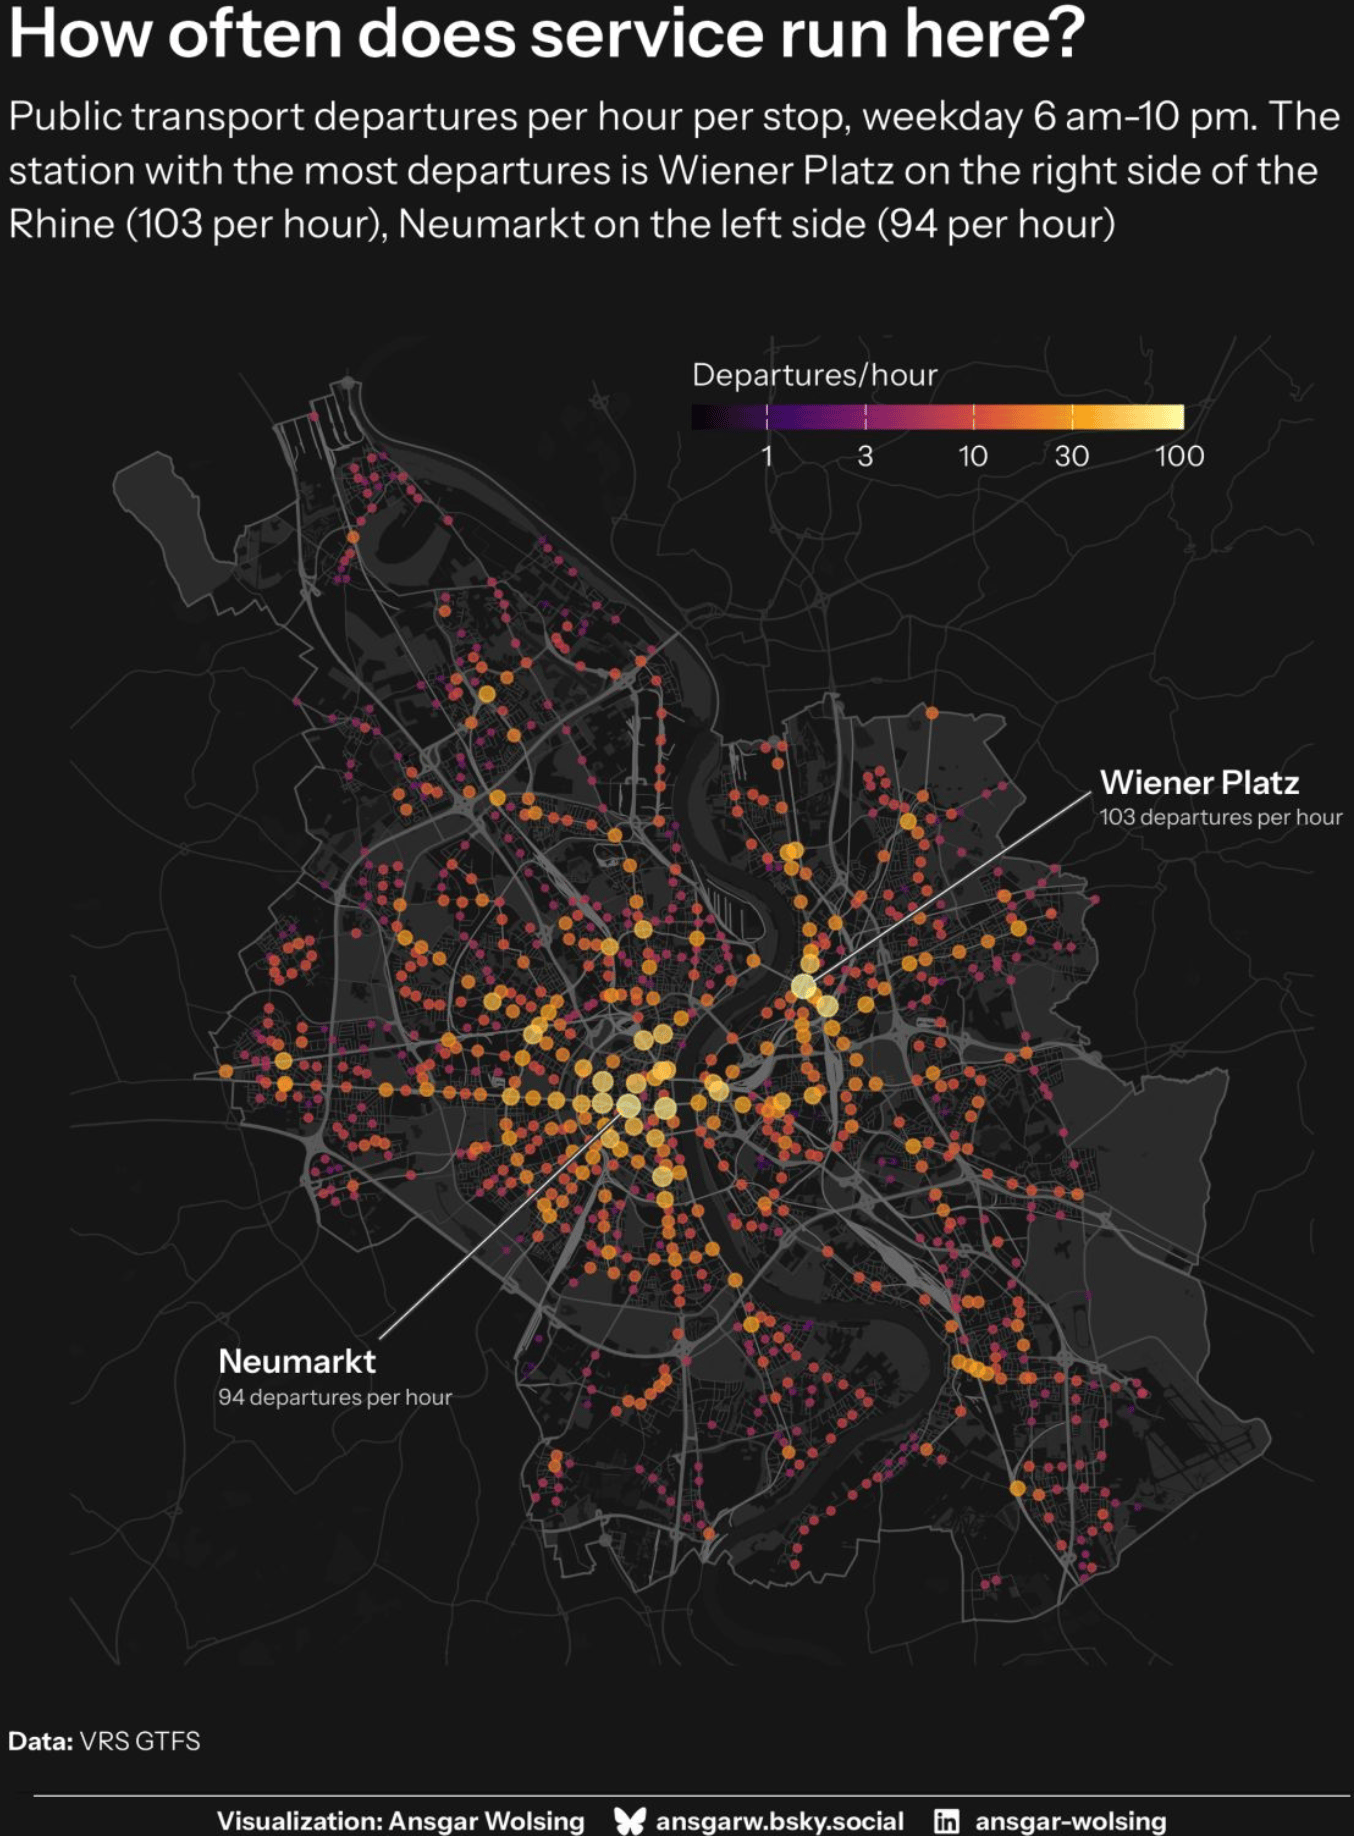
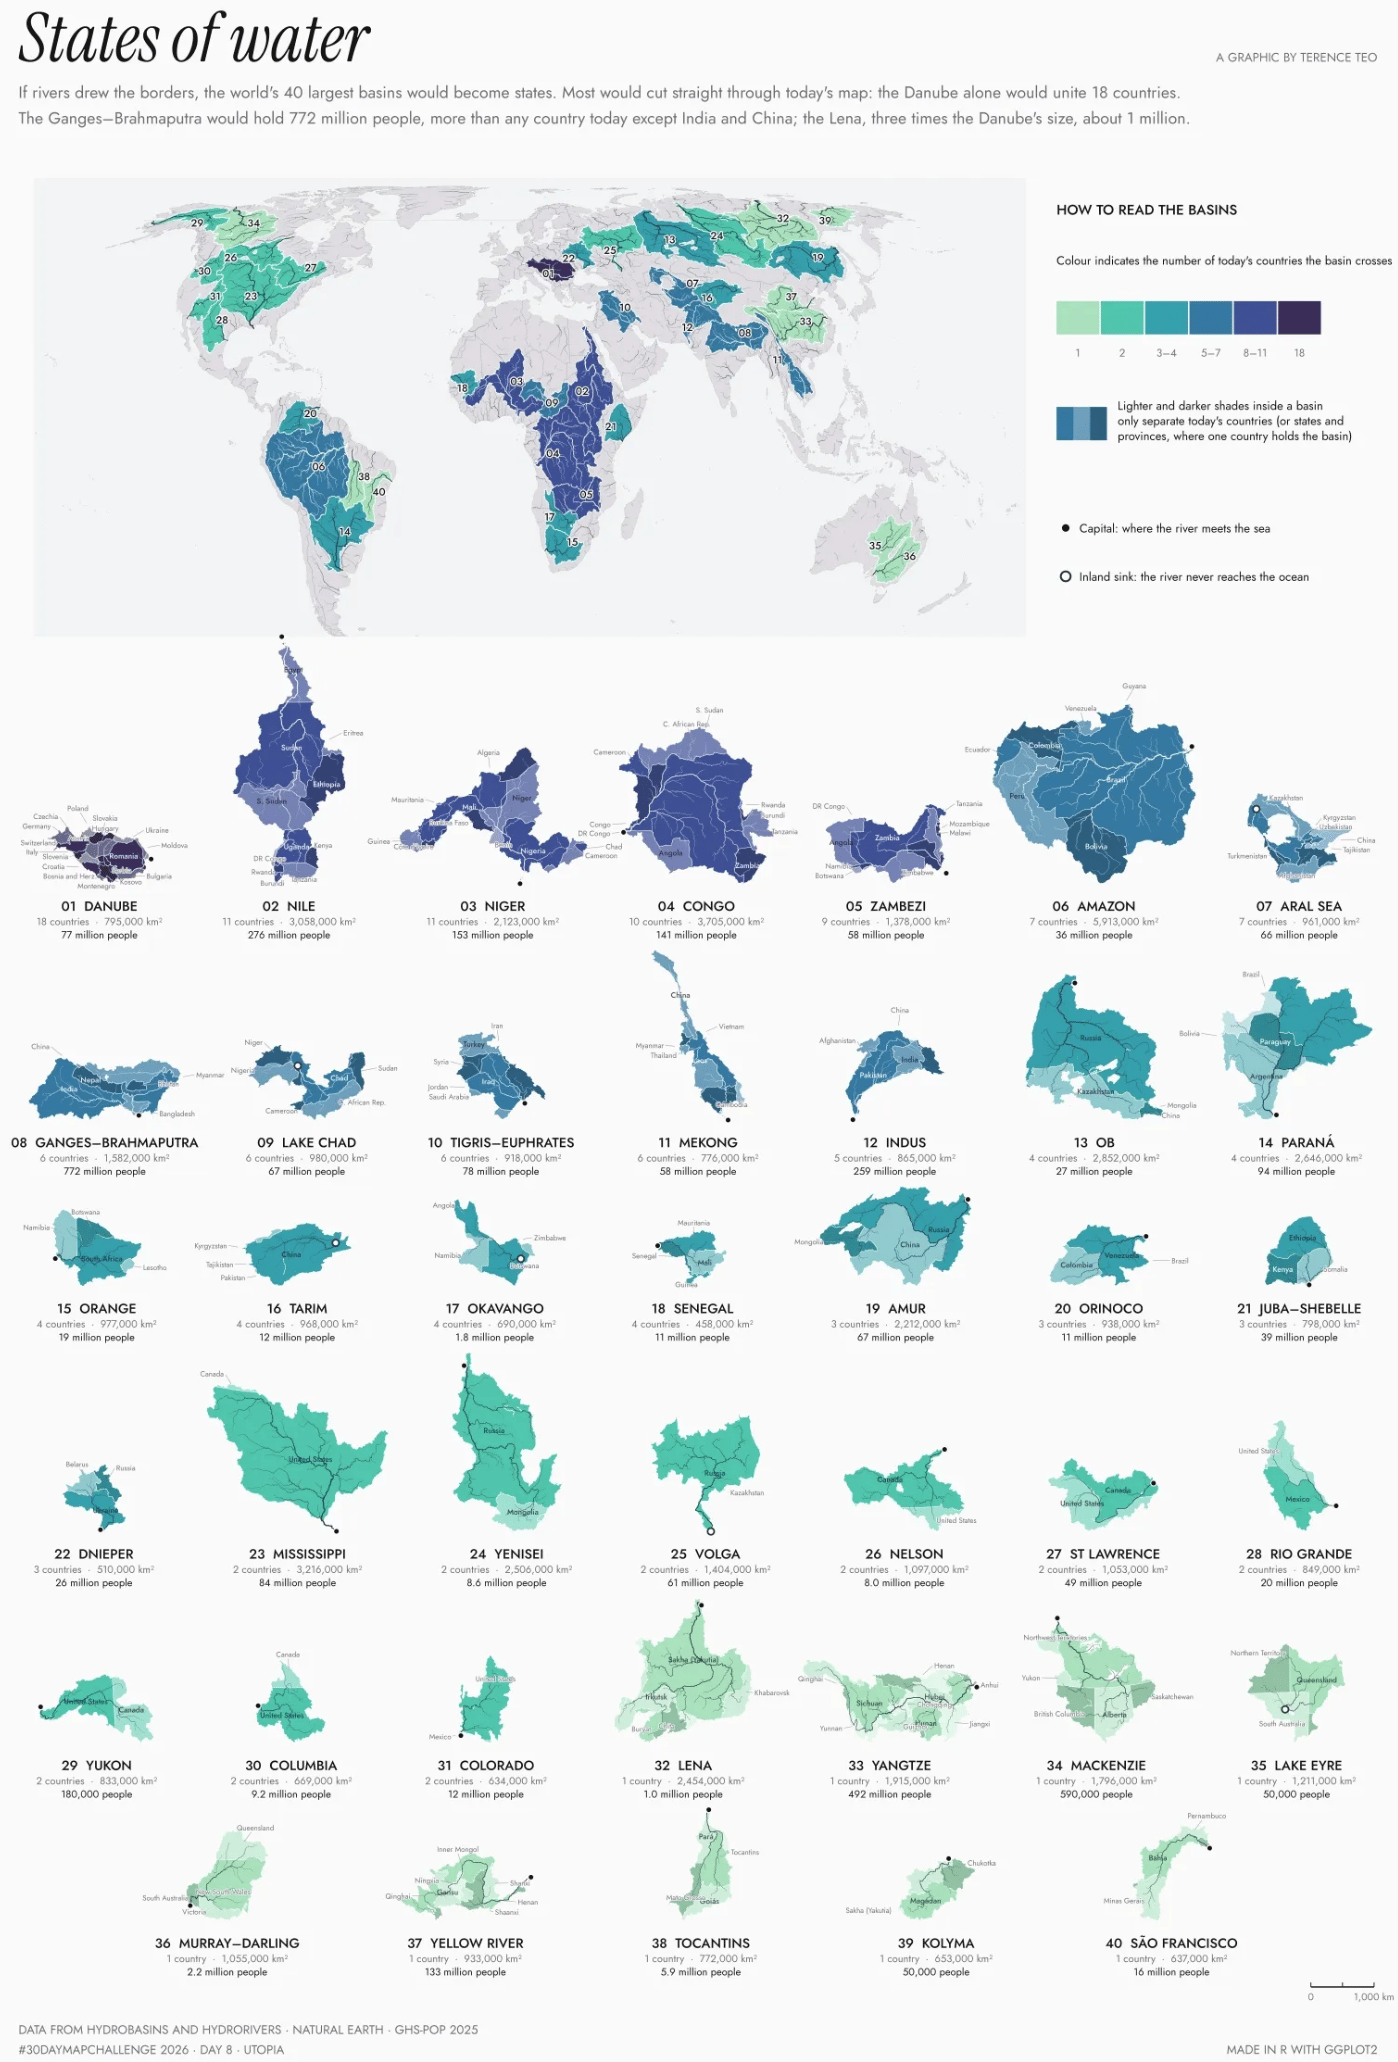
We present a new selection of visualisations from the #30daymapchallenge, covering Paris' population density, the 40 largest river basins, Frankfurt's building shadows, and Cologne's public transport network.

Victor Charbonnier: “Salut tout le monde ! 👩‍🏫&nbsp;Pour ce quatrième jour du #30DayMapChallenge, le thème est « Clusters » ! 🦠&nbsp;Je vous propose de découvrir la densité commerciale de Paris à travers cette carte, réalisée à partir des données de la BDCOM 2023, produite par l’APUR. La mise en relief en 3D a quant à elle été réalisée sur Blender 3D […] [Hey everyone! 👩‍🏫&nbsp;For this fourth day of the #30DayMapChallenge, the theme is "Clusters"! 🦠&nbsp;I invite you to discover the commercial density of Paris through this map, made from data from the BDCOM 2023, produced by the APUR. The 3D highlighting was done in Blender 3D […]], November 4 (<a href="https://www.linkedin.com/posts/victor-charbonnier-530388230_30daymapchallenge-map-carte-share-7523527052239601665-1A17/?utm_source=share&amp;utm_medium=member_desktop&amp;rcm=ACoAAEk-01sBCowJ89EcV5BWcY4FwVC0aeG9xj0"><strong>LinkedIn</strong></a>)
Victor Charbonnier: “Salut tout le monde ! 👩‍🏫 Pour ce quatrième jour du #30DayMapChallenge, le thème est « Clusters » ! 🦠 Je vous propose de découvrir la densité commerciale de Paris à travers cette carte, réalisée à partir des données de la BDCOM 2023, produite par l’APUR. La mise en relief en 3D a quant à elle été réalisée sur Blender 3D […] [Hey everyone! 👩‍🏫 For this fourth day of the #30DayMapChallenge, the theme is "Clusters"! 🦠 I invite you to discover the commercial density of Paris through this map, made from data from the BDCOM 2023, produced by the APUR. The 3D highlighting was done in Blender 3D […]], November 4 (LinkedIn)
terence: "Day 8 #30DayMapChallenge · Utopia. What if every border followed a watershed, the line that decides which river a raindrop ends up in? Then the Danube alone would cover 18 of today's countries, and the Ganges–Brahmaputra would hold 772 million people," November 9 (<a href="https://bsky.app/profile/tterence.bsky.social/post/3mztveozxlc2k"><strong>Bluesky</strong></a>)
terence: "Day 8 #30DayMapChallenge · Utopia. What if every border followed a watershed, the line that decides which river a raindrop ends up in? Then the Danube alone would cover 18 of today's countries, and the Ganges–Brahmaputra would hold 772 million people," November 9 (Bluesky)
Baris Parlatangiller: "🗺️ #30DayMapChallenge 2026 | Day 5: Senses – Sight Who gets the sun next to a Frankfurt tower? [...] The video plays 21 June in about 10 seconds. The shadows of all 1,843 Frankfurt buildings of 30 m and more sweep across the city, and the blue shows how much direct sun each spot loses to them over the day. On a summer day, 4.1 km² of streets and rooftops lose 3+ hours of direct sun to these buildings, 12.3 km² lose at least one hour, In December it is even more: low sun, long shadows [...], November 5 (LinkedIn, project website)
Ansgar Wolsing: "How often does service run here? Central Cologne has access to frequent public transit, while peripheral districts face longer waiting times and fewer direct links. Public transport departures per hour per stop on a weekday 6 am-10 pm. Wiener Platz is the station with the most departures, located on the right side of the Rhine (103 stops per hour), Neumarkt on the left side (94) [...]," November 9 (<a href="https://www.linkedin.com/posts/ansgar-wolsing_30daymapchallenge-ggplot2-kaemln-share-7525619363530354688-_osB/?utm_source=share&amp;utm_medium=member_desktop&amp;rcm=ACoAAEk-01sBCowJ89EcV5BWcY4FwVC0aeG9xj0"><strong>LinkedIn</strong></a>)
Ansgar Wolsing: "How often does service run here? Central Cologne has access to frequent public transit, while peripheral districts face longer waiting times and fewer direct links. Public transport departures per hour per stop on a weekday 6 am-10 pm. Wiener Platz is the station with the most departures, located on the right side of the Rhine (103 stops per hour), Neumarkt on the left side (94) [...]," November 9 (LinkedIn)

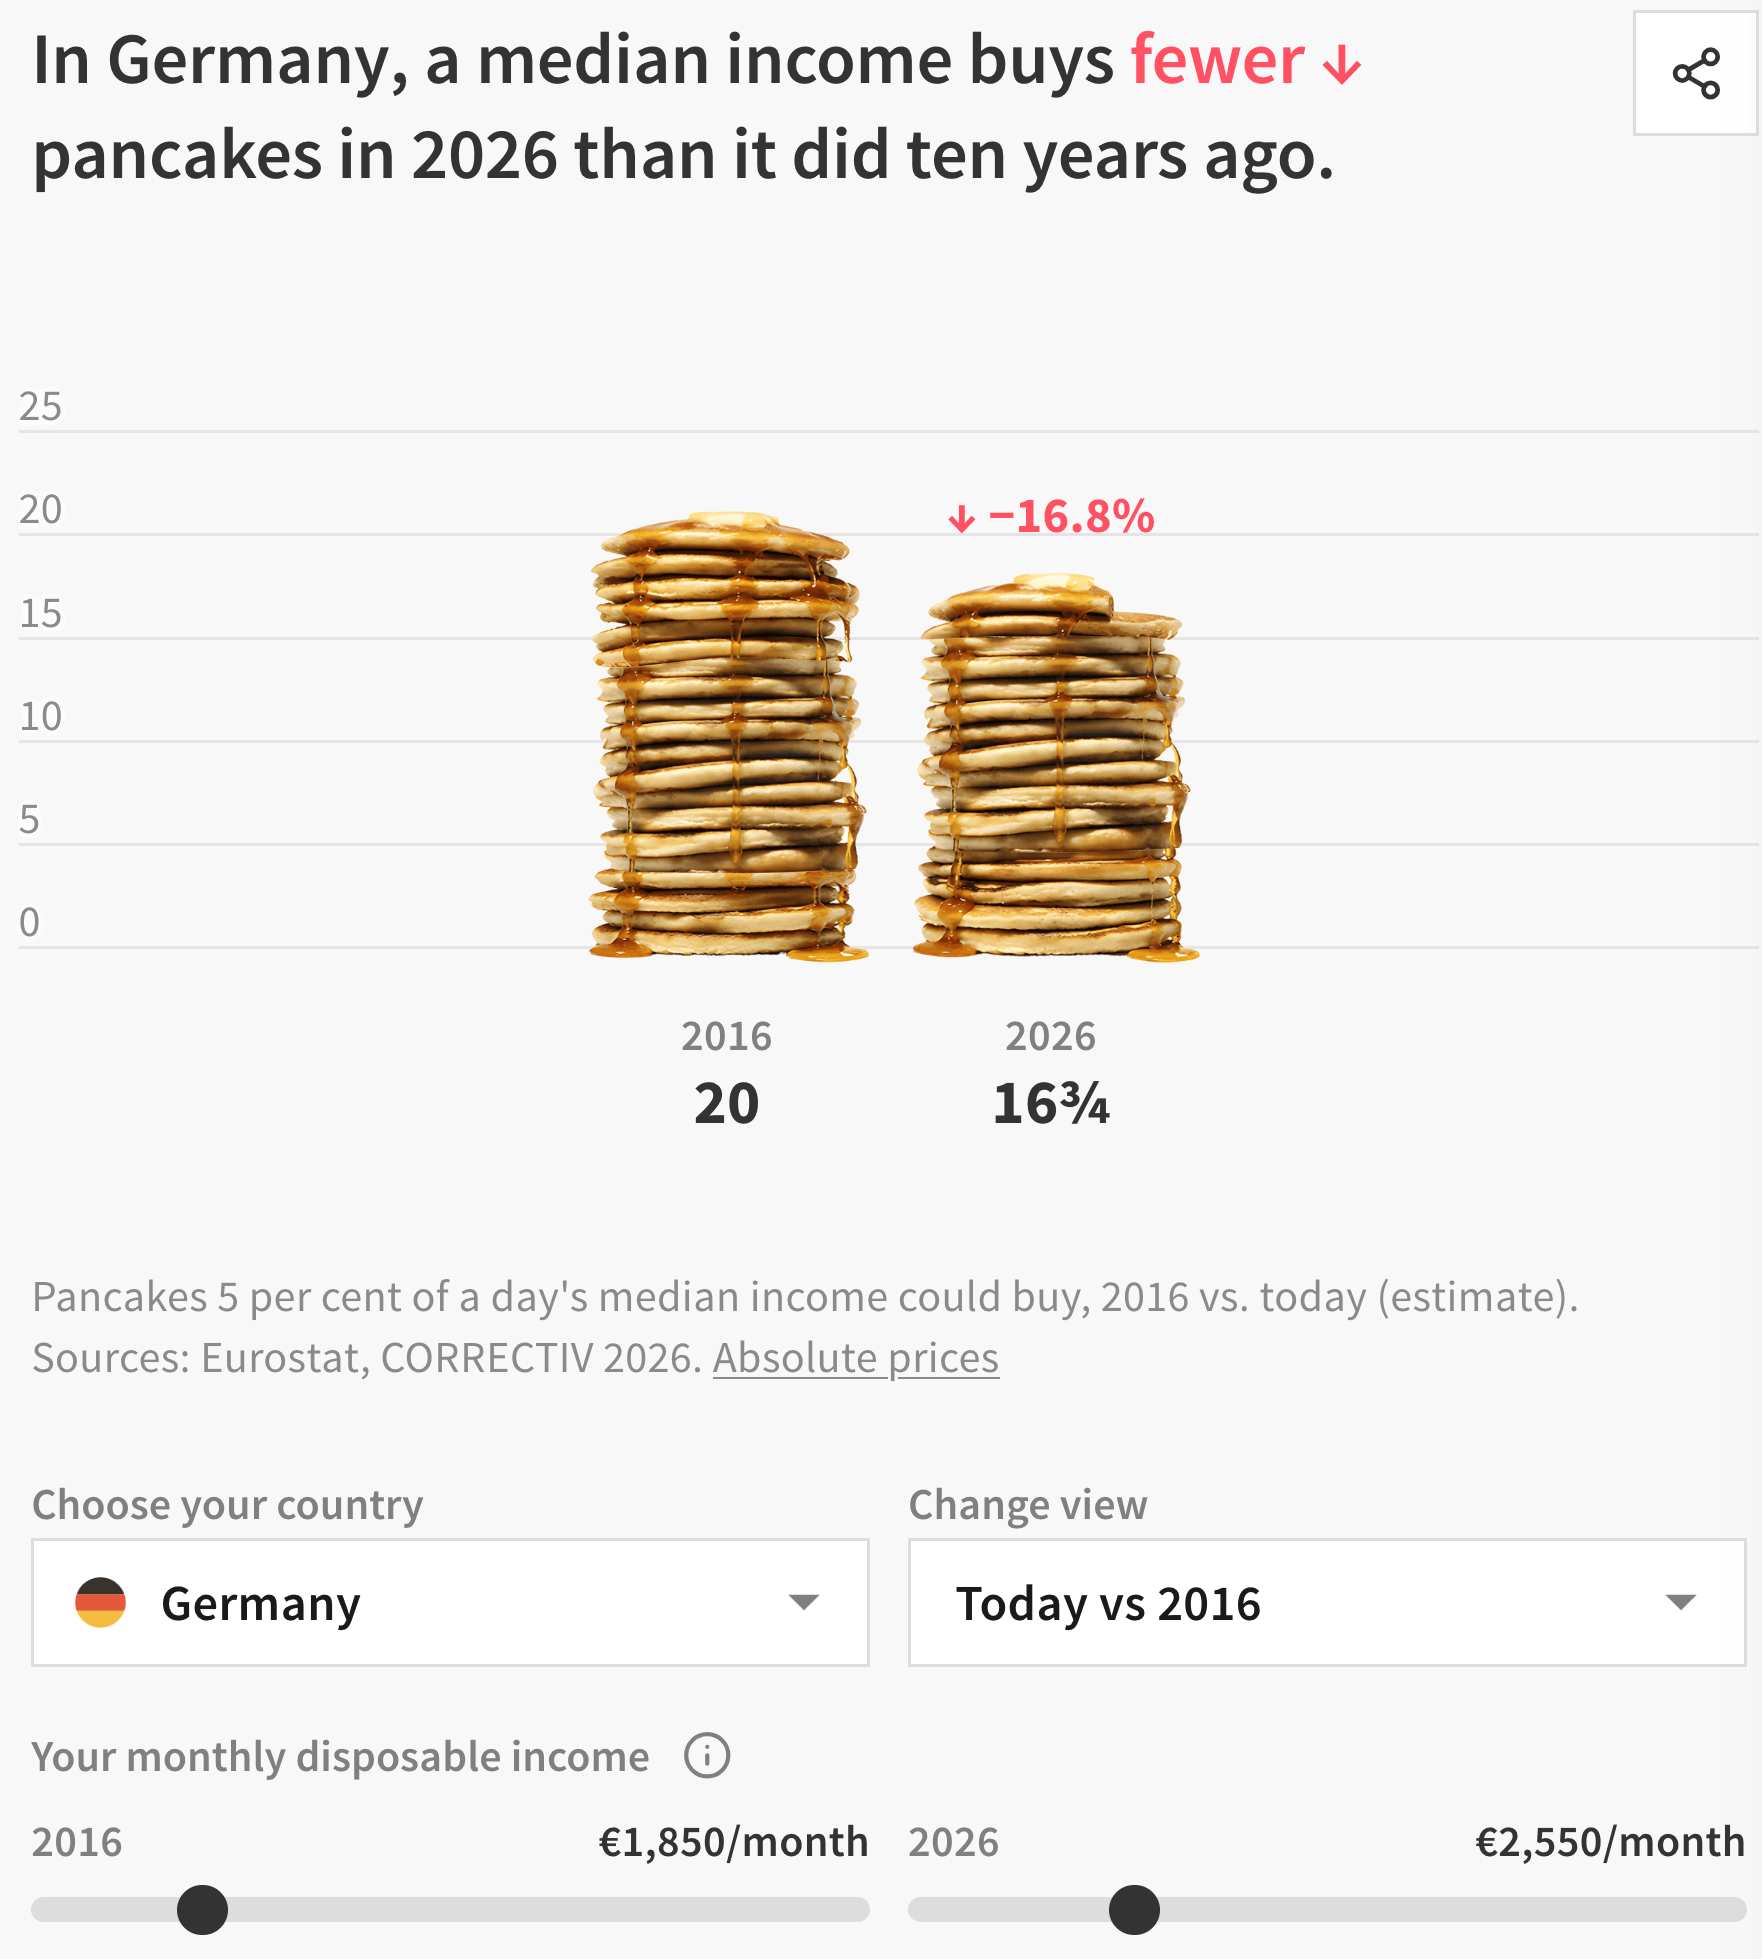
As grocery prices continue to rise, comparisons between the U.S. and Germany reveal interesting differences. Check out the Pancake Index to explore the affordability of pancakes in relation to rising prices.
Die Zeit: So viel kostet Ihr Einkauf in den USA [Chart title: This is how much your shopping trip in the USA will cost], November 5
Correctiv: <a href="https://correctiv.org/en/europe/2026/11/10/pancake-index/"><strong>The Pancake Index</strong></a>, November 10 <span class="badge">Check out the interactive tool!</span>
Correctiv: The Pancake Index, November 10 Check out the interactive tool!

We end this Dispatch with some other interesting topics: the struggling efforts to clean up the Ganges River, rocket launches, and a 2026 Visualising Climate-inspired data viz!
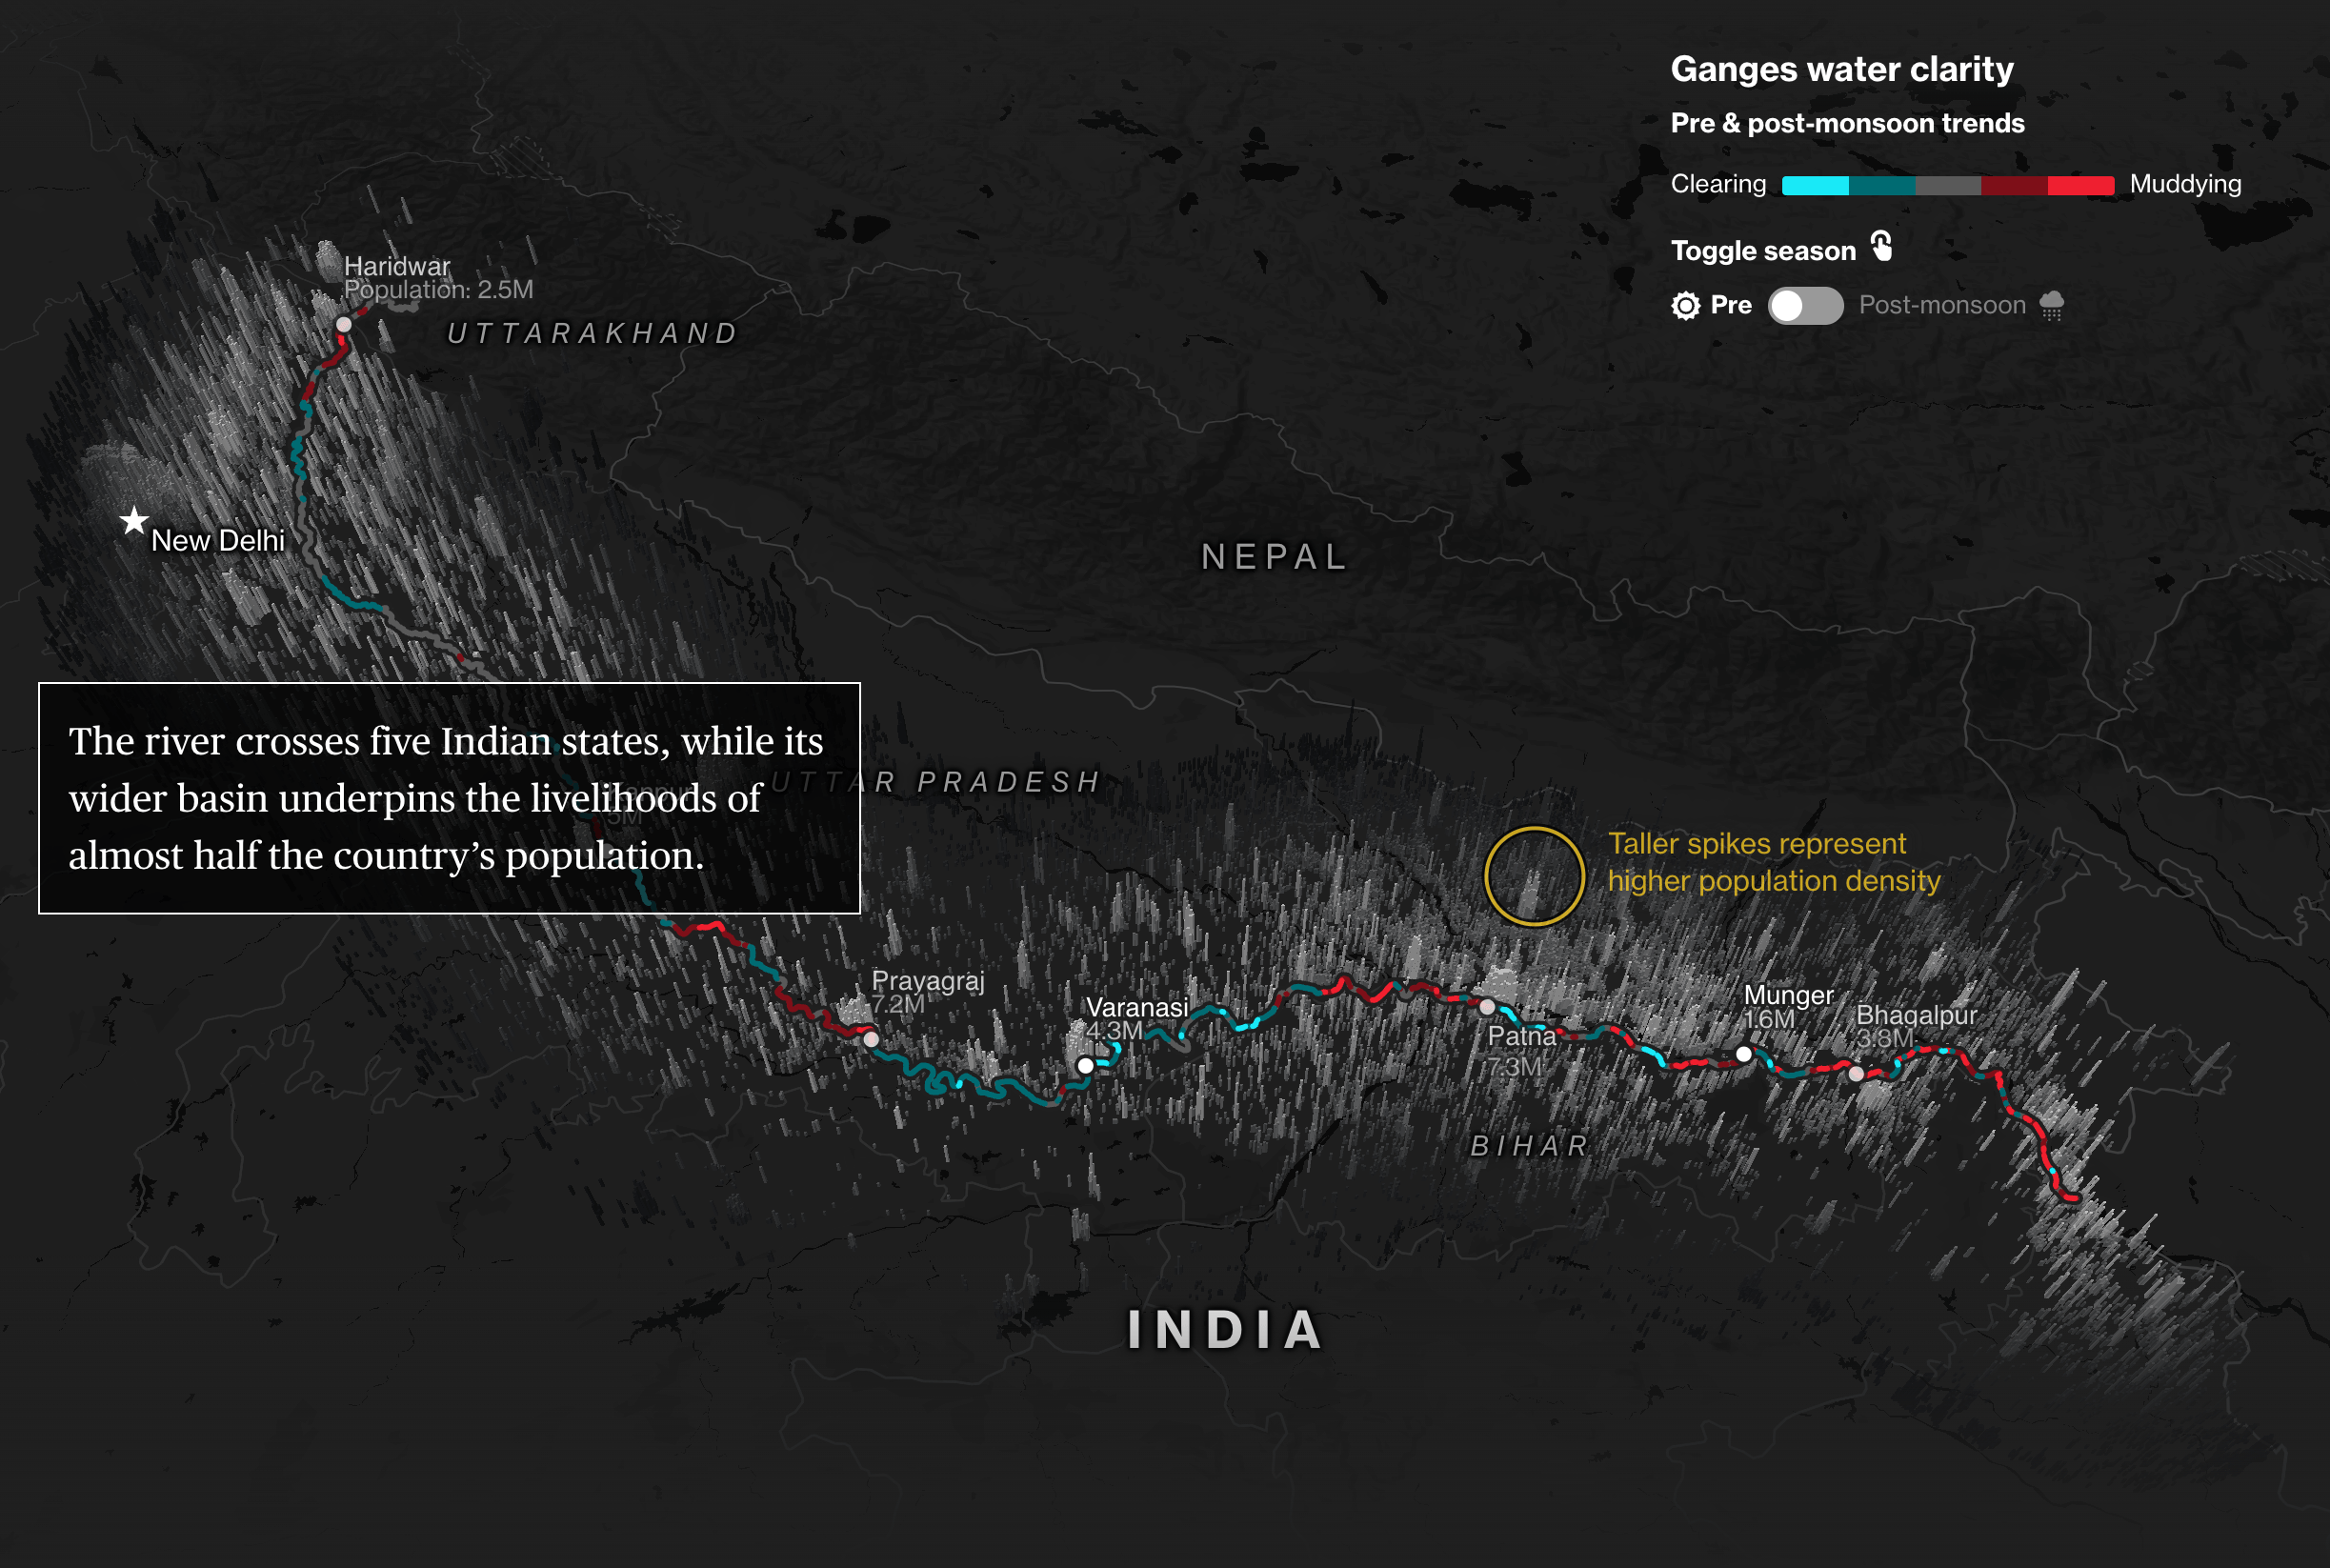
Bloomberg: <a href="https://www.bloomberg.com/graphics/2026-ganges-water-pollution/?srnd=phx-graphics-v2"><strong>Modi’s $4.5 Billion Ganges Cleanup Is Struggling to Tame Pollution</strong></a>, November 6 <span class="badge">Smooth transitions</span>
Bloomberg: Modi’s $4.5 Billion Ganges Cleanup Is Struggling to Tame Pollution, November 6 Smooth transitions
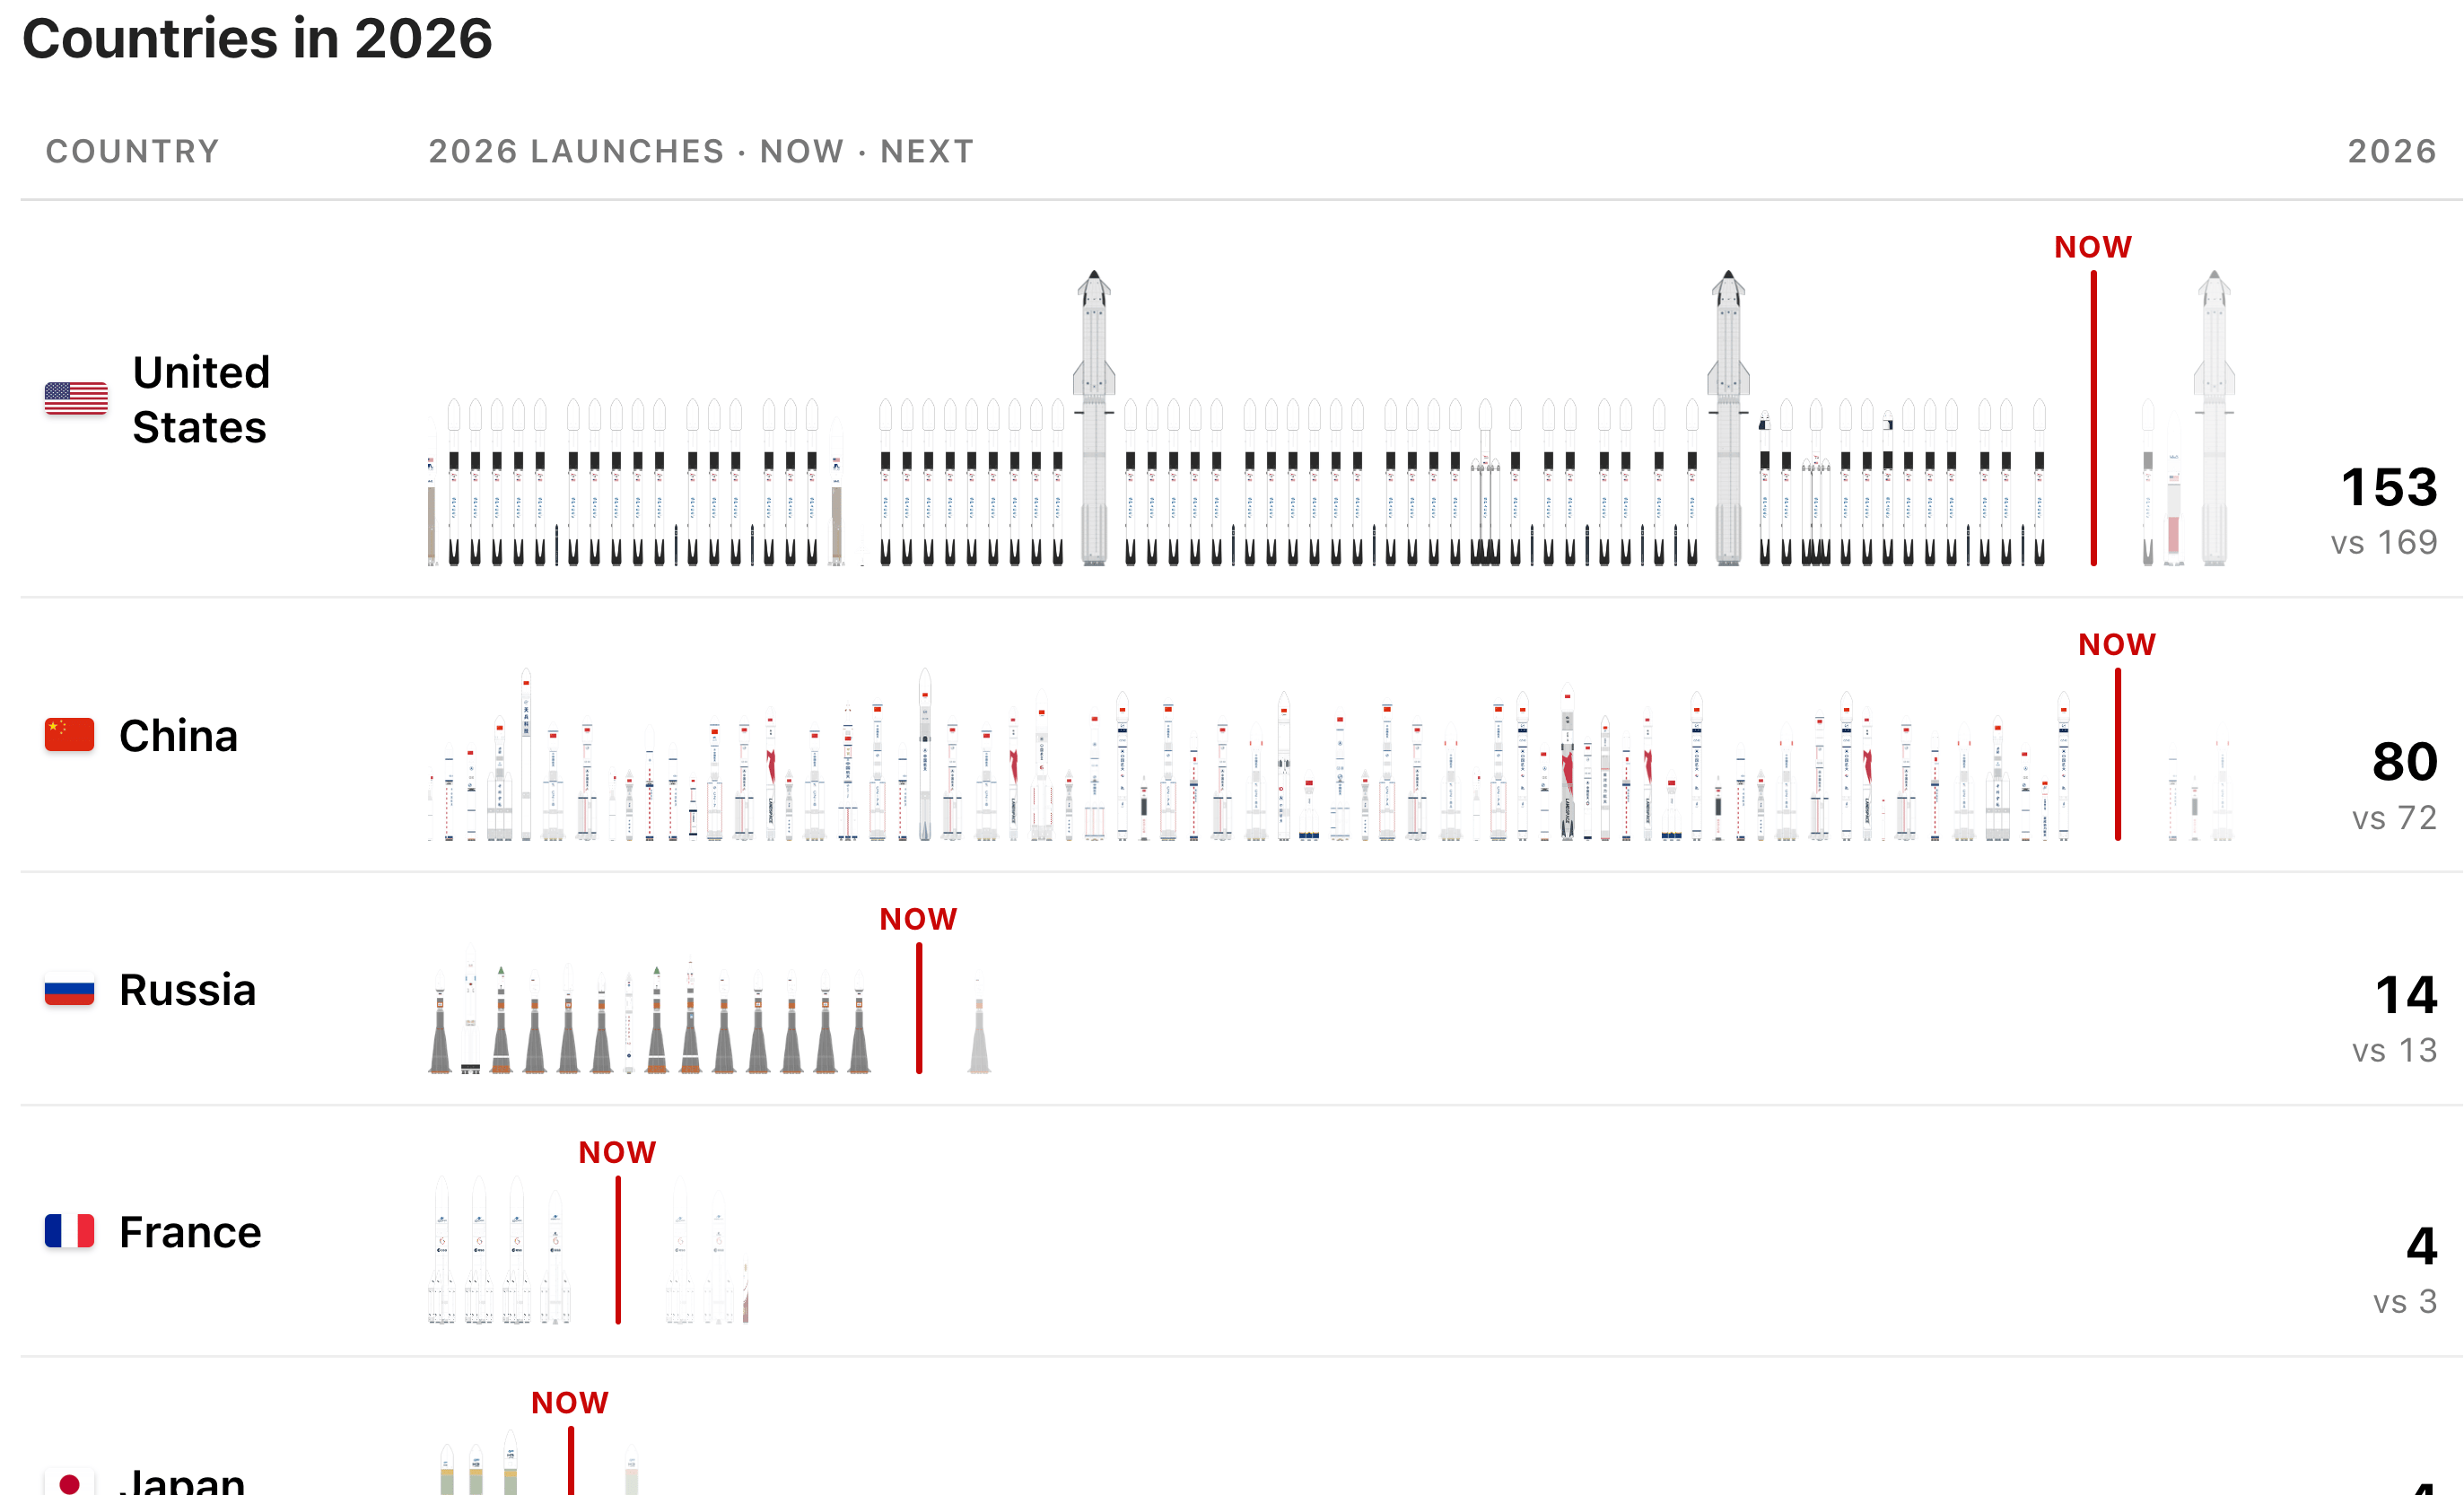
Flight Atlas: <a href="https://www.flightatlas.org/rocket-launches-by-country"><strong>Rocket Launches by Country</strong></a>, November 10
Flight Atlas: Rocket Launches by Country, November 10
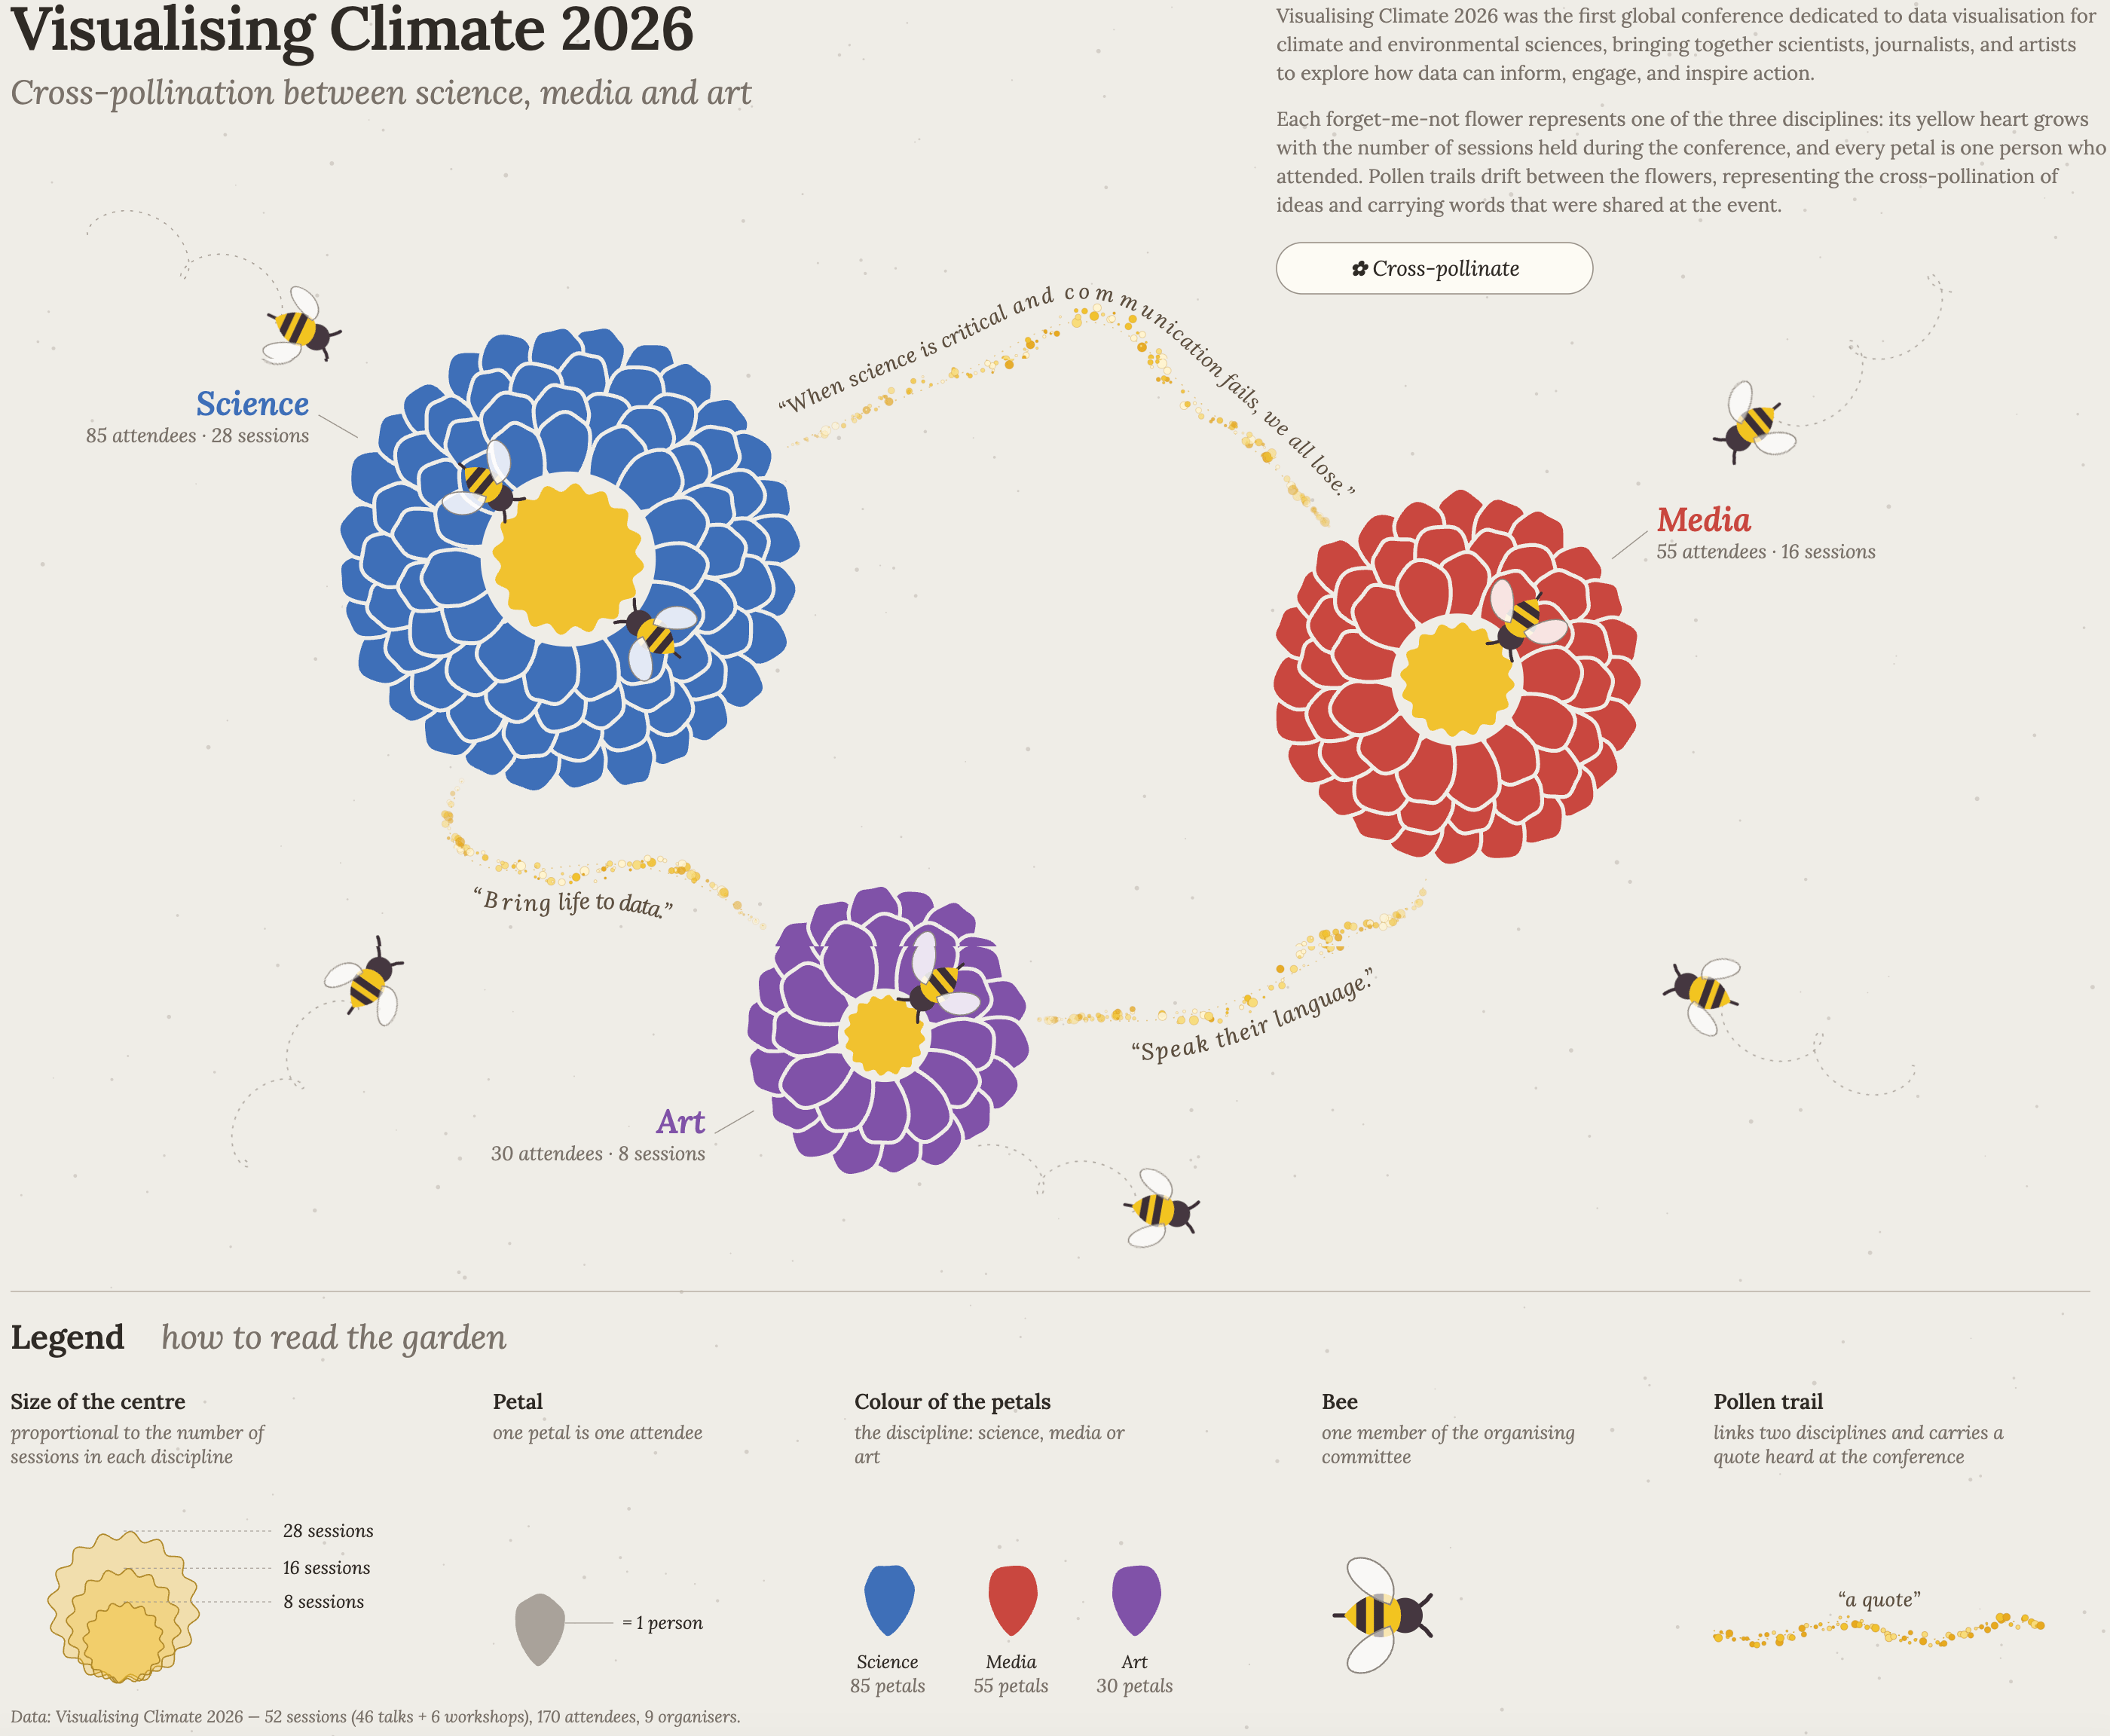
Viviana Graziano: "Feeling inspired by Visualising Climate, I found the courage to give something completely new a try: creating my very first non-plot data visualisation! The numbers are rough estimates, as the goal wasn't to build a rigorous data representation. I wanted to bring to life an image that took shape in my mind when Anna Lombardi so brilliantly introduced the metaphor of cross-pollination, while capturing a little of the magic and wonder of these days [...]," November 8 (<a href="https://www.linkedin.com/posts/vivianagraziano_feeling-inspired-by-visualising-climate-ugcPost-7525117462867030016-EMGv/?utm_source=share&amp;utm_medium=member_desktop&amp;rcm=ACoAAEk-01sBCowJ89EcV5BWcY4FwVC0aeG9xj0"><strong>LinkedIn</strong></a>, <a href="https://vivianagrz.github.io/forget-me-not/"><strong>project website</strong></a>)
Viviana Graziano: "Feeling inspired by Visualising Climate, I found the courage to give something completely new a try: creating my very first non-plot data visualisation! The numbers are rough estimates, as the goal wasn't to build a rigorous data representation. I wanted to bring to life an image that took shape in my mind when Anna Lombardi so brilliantly introduced the metaphor of cross-pollination, while capturing a little of the magic and wonder of these days [...]," November 8 (LinkedIn, project website)

What else we found interesting

NPR: How climate change transforms the colors of our world, November 8
The Pudding: lo-pi radio, November 4 Turn up the sound!
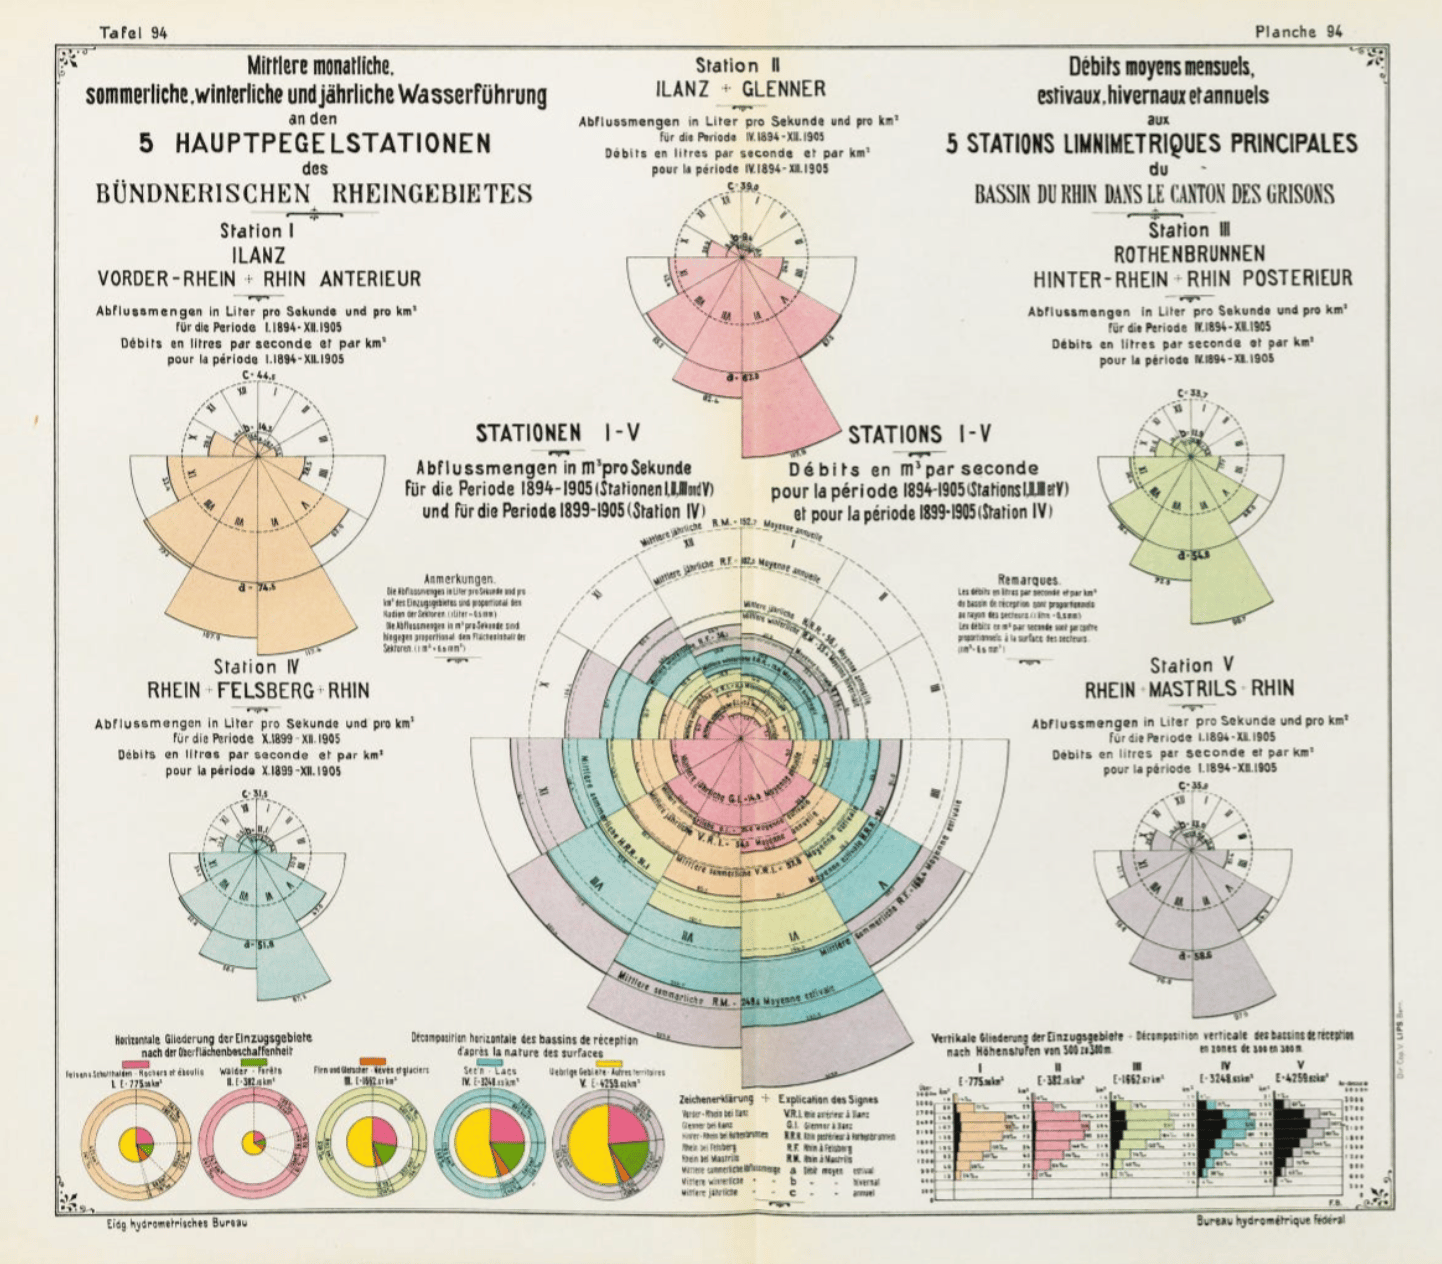
Cabinet of Infographic Curiosities: <a href="https://attilabatorfy.substack.com/p/swiss-water-affairs"><strong>Swiss water affairs</strong></a>, November 9
Cabinet of Infographic Curiosities: Swiss water affairs, November 9
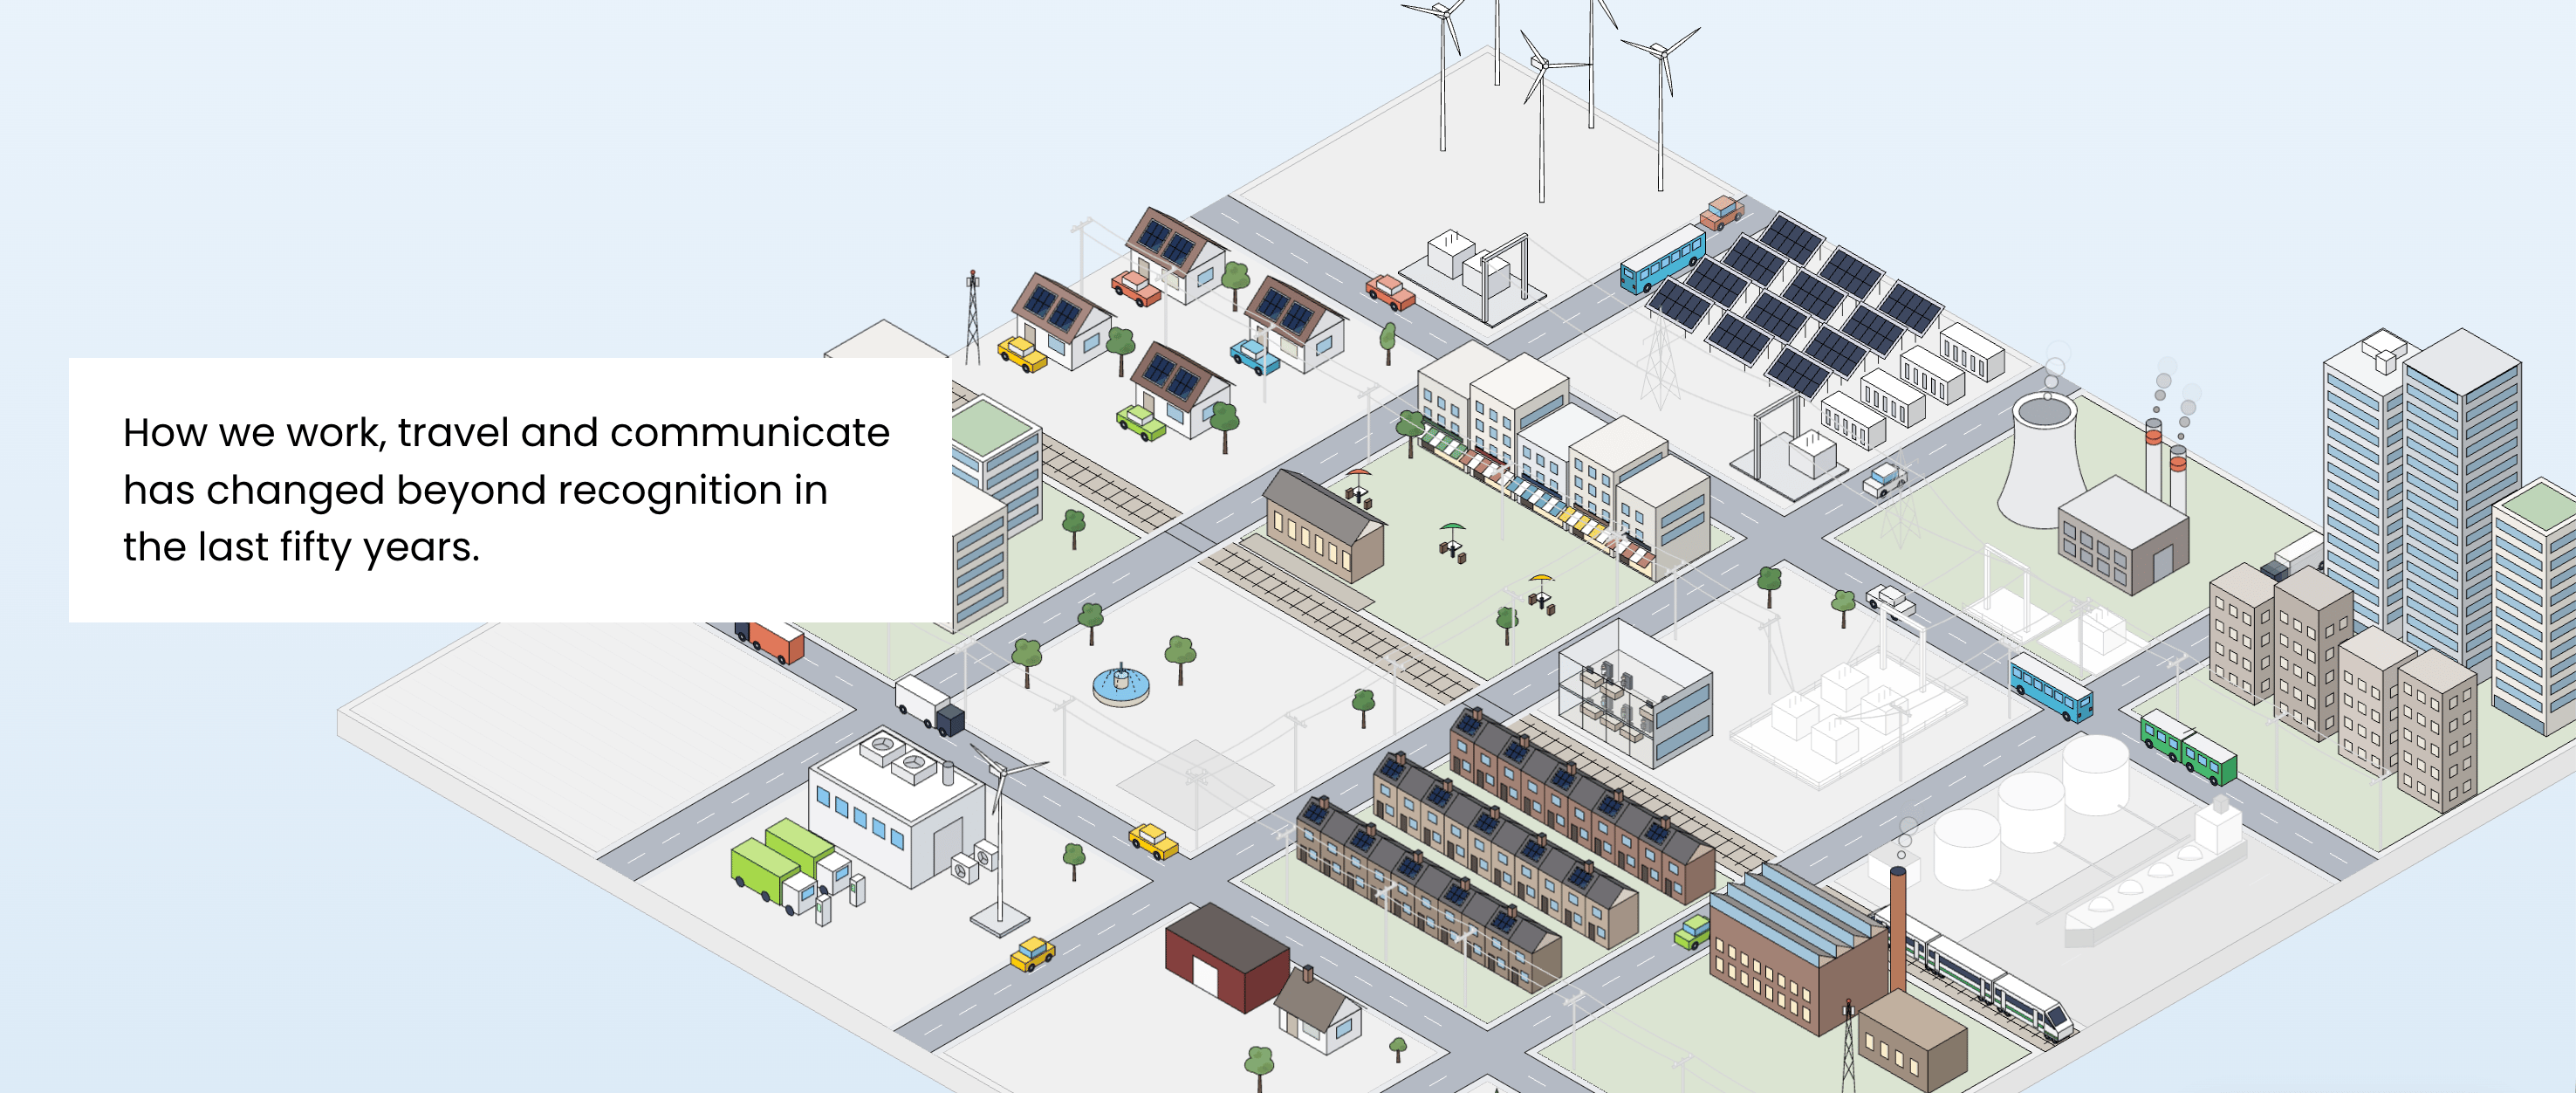
Ember Energy: <a href="https://ember-energy.org/latest-insights/building-a-grid-for-the-age-of-power/"><strong>Building a grid for the age of power</strong></a>, November 9
Ember Energy: Building a grid for the age of power, November 9

Applications are open for…


Help us make the Data Vis Dispatch better! Let us know which newsletters, blogs, or social media accounts we should follow to learn about interesting projects, especially from less-covered parts of the world (Asia, South America, Africa). And if you’ve published something new in the last week, we’d love to see it. Write to us at blog@datawrapper.de. (Please note that we don't have the capacity to respond to obviously AI-generated requests.) Want to make sure you never miss a Dispatch? Sign up for our Data Vis Dispatch newsletter.


Portrait of Michelle Otiji

Michelle Otiji (she/her) is a working student on Datawrapper’s communications team. She creates the Data Vis Dispatch to keep data visualization enthusiasts up to date on exciting new projects. Michelle studies interface design in Potsdam.

Sign up to our newsletters to get notified about everything new on our blog.