Data Vis Dispatch, November 3: Midterm elections, Halloween candies, and the #30DayMapChallenge

Welcome back to the 269th edition of Data Vis Dispatch! Every week, we’ll be publishing a collection of the best small and large data visualizations we find, especially from news organizations — to celebrate data journalism, data visualization, simple charts, elaborate maps, and their creators.
Recurring topics this week include the midterm elections, the worst Halloween candies, and the #30DayMapChallenge.
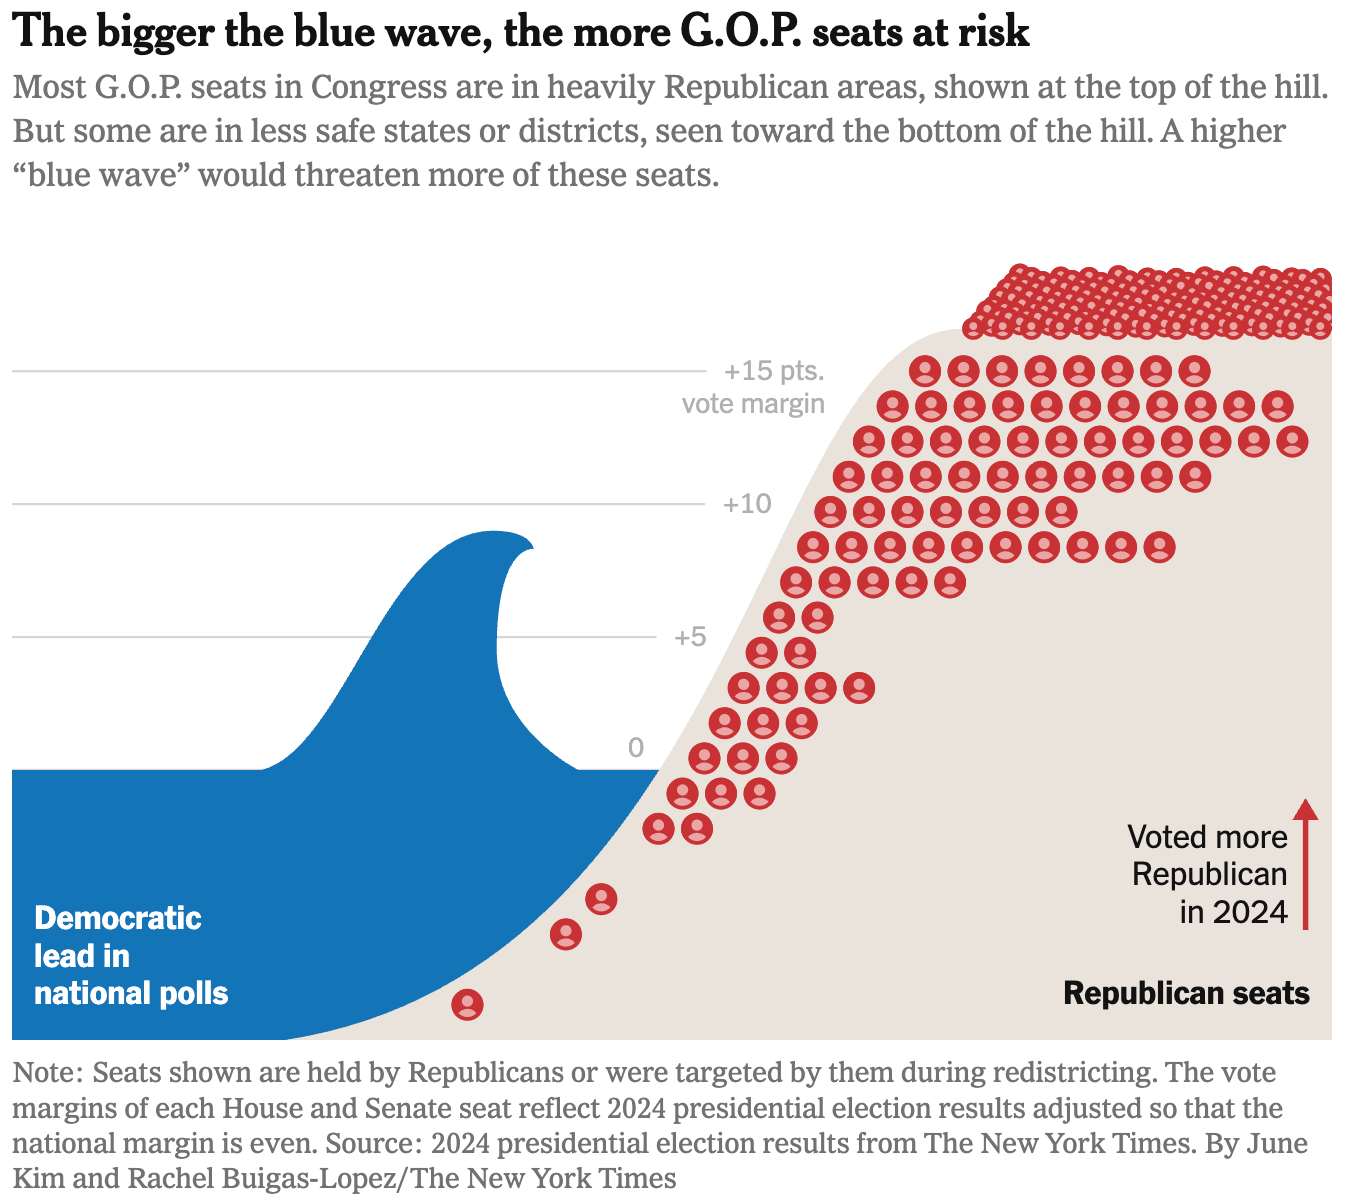
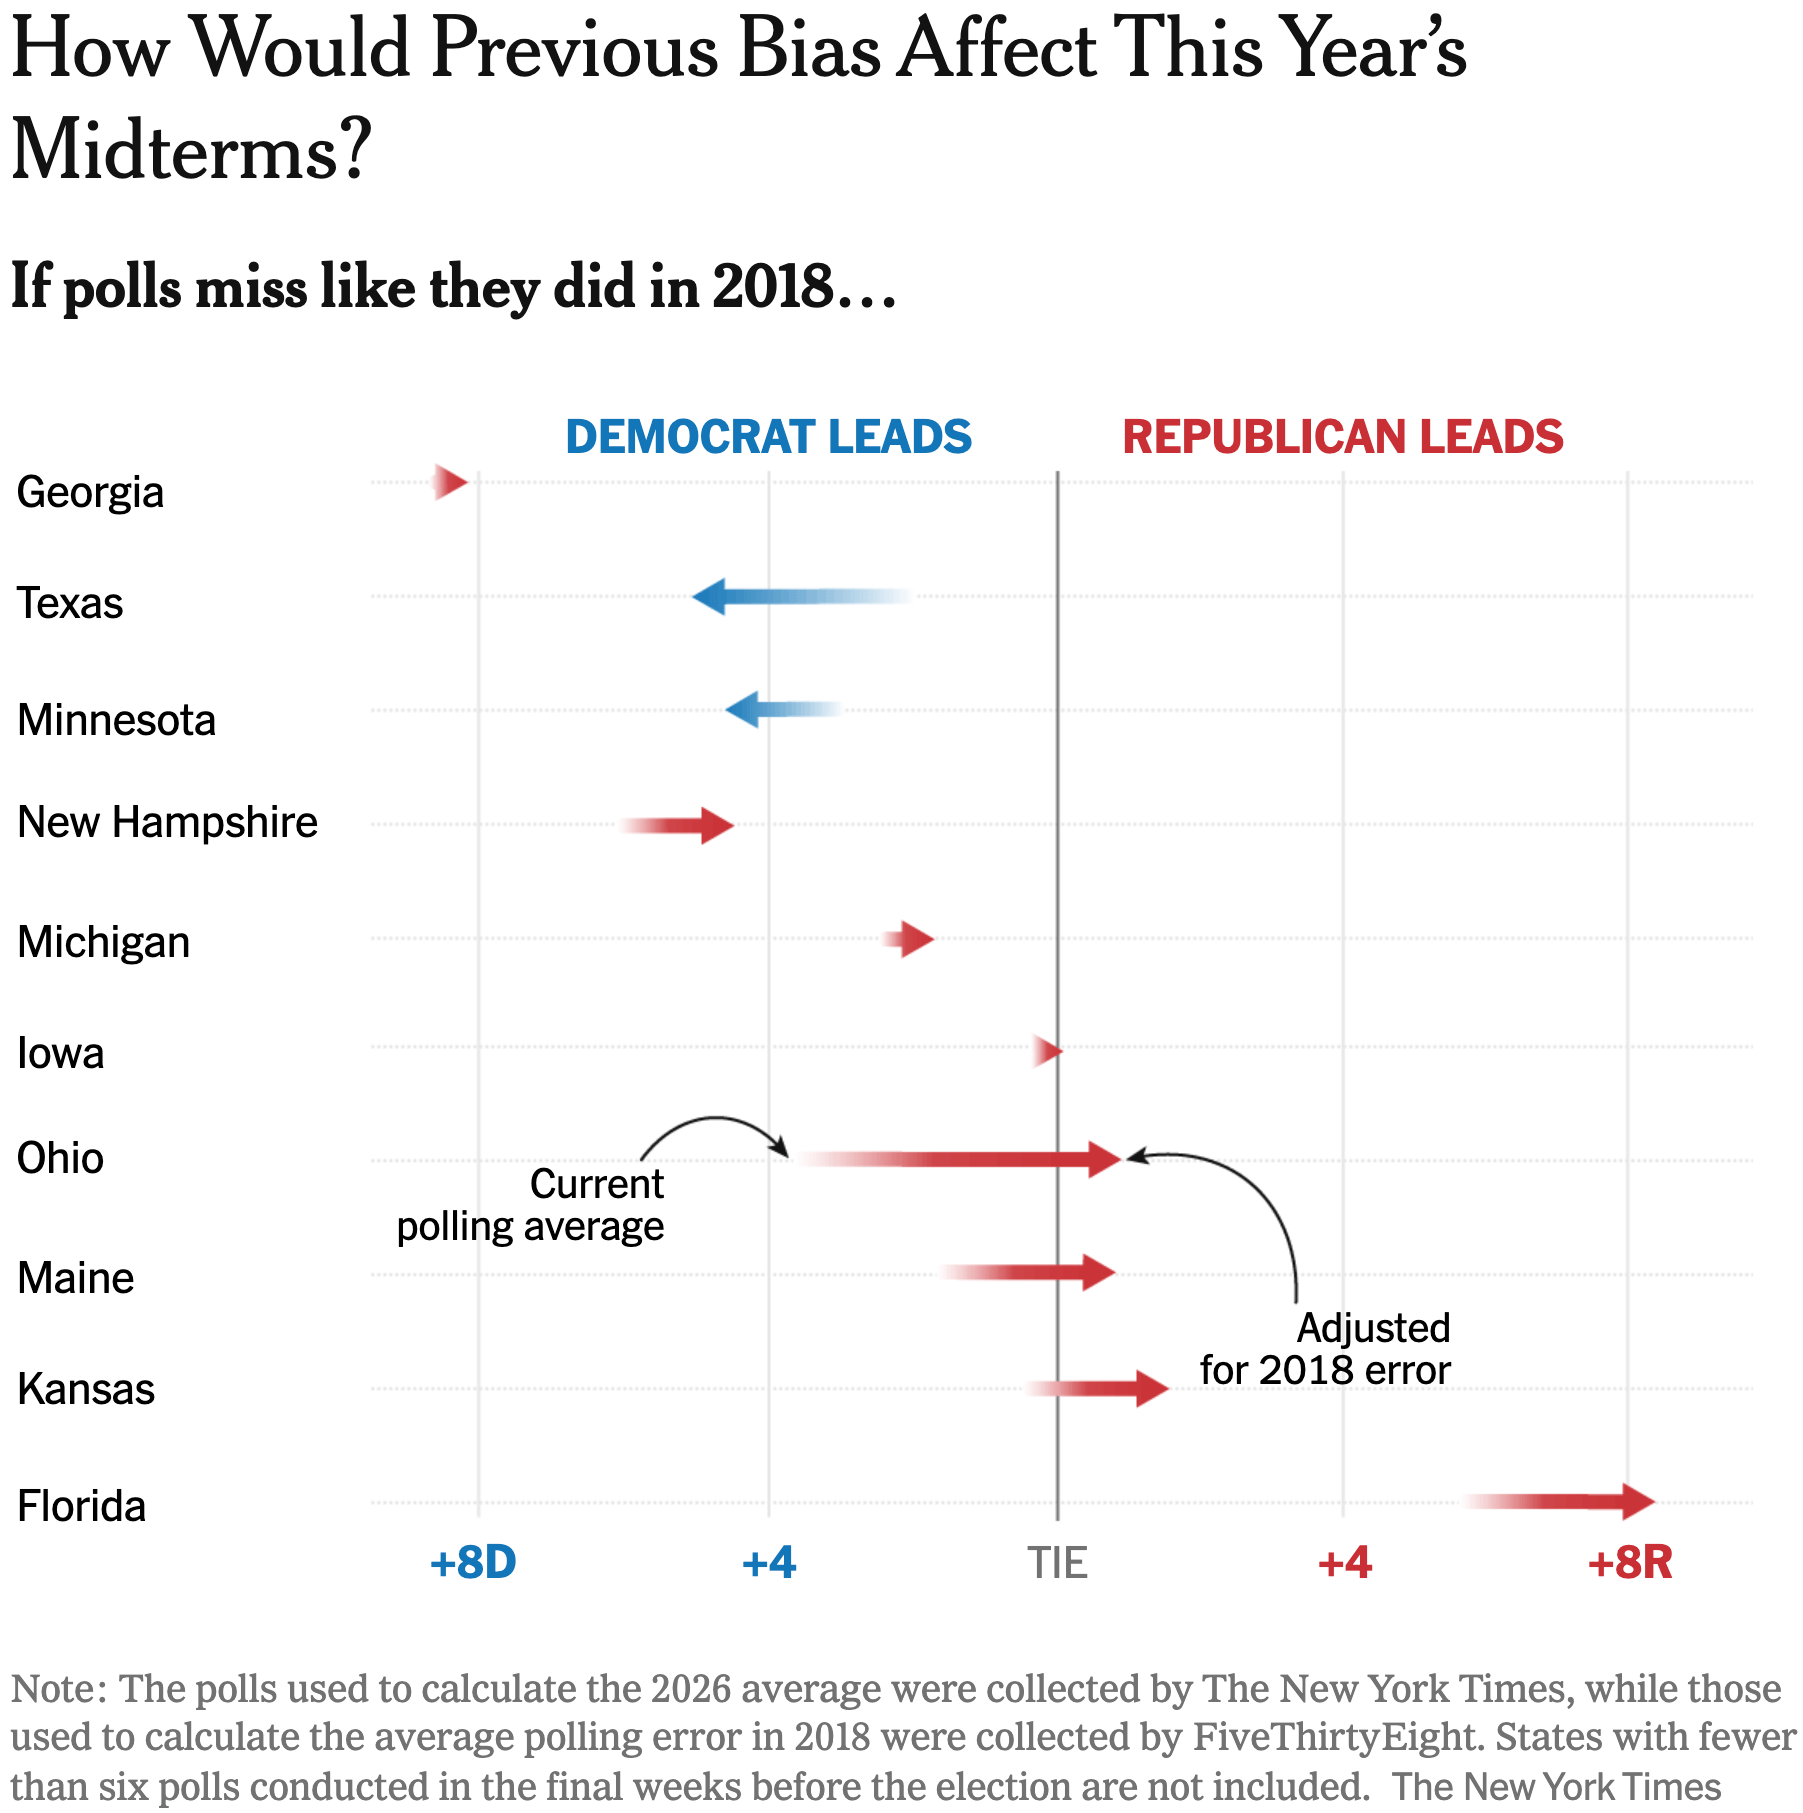
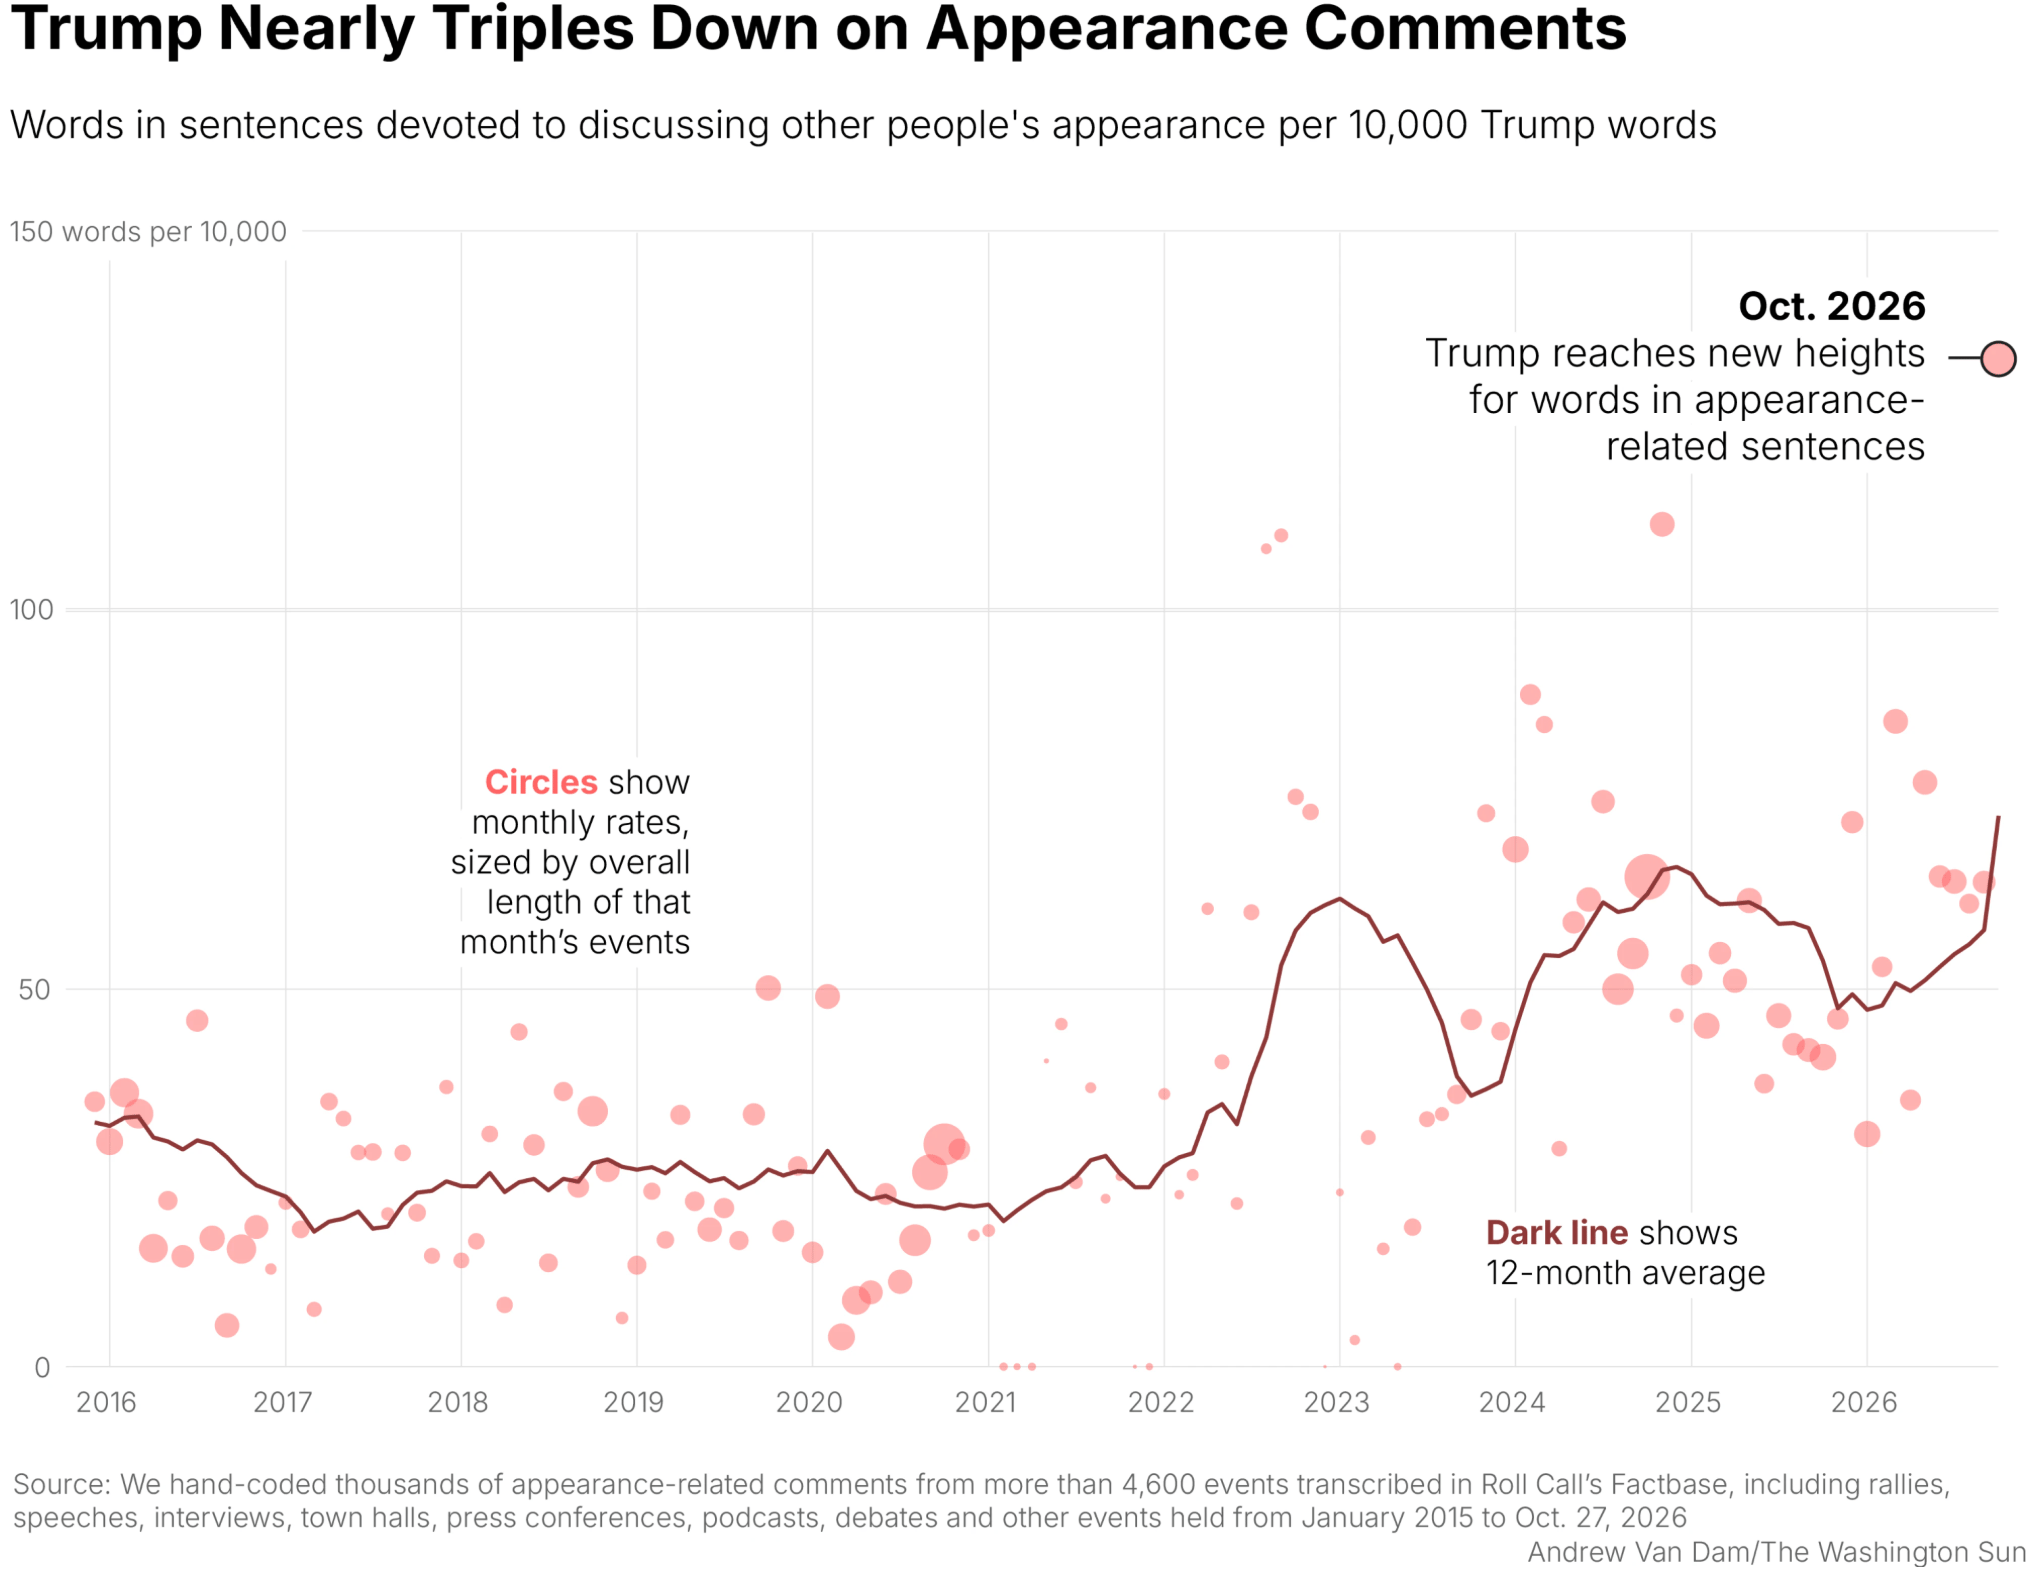
This week, we're kicking things off with the long-awaited U.S. midterm elections. From possible outcome scenarios and polling bias to vote shifts and standout midterm quotes, check out the various visualisations covering the topic. Furthermore, this campaign has seen an increase in Trump's comments about people’s physical appearance.


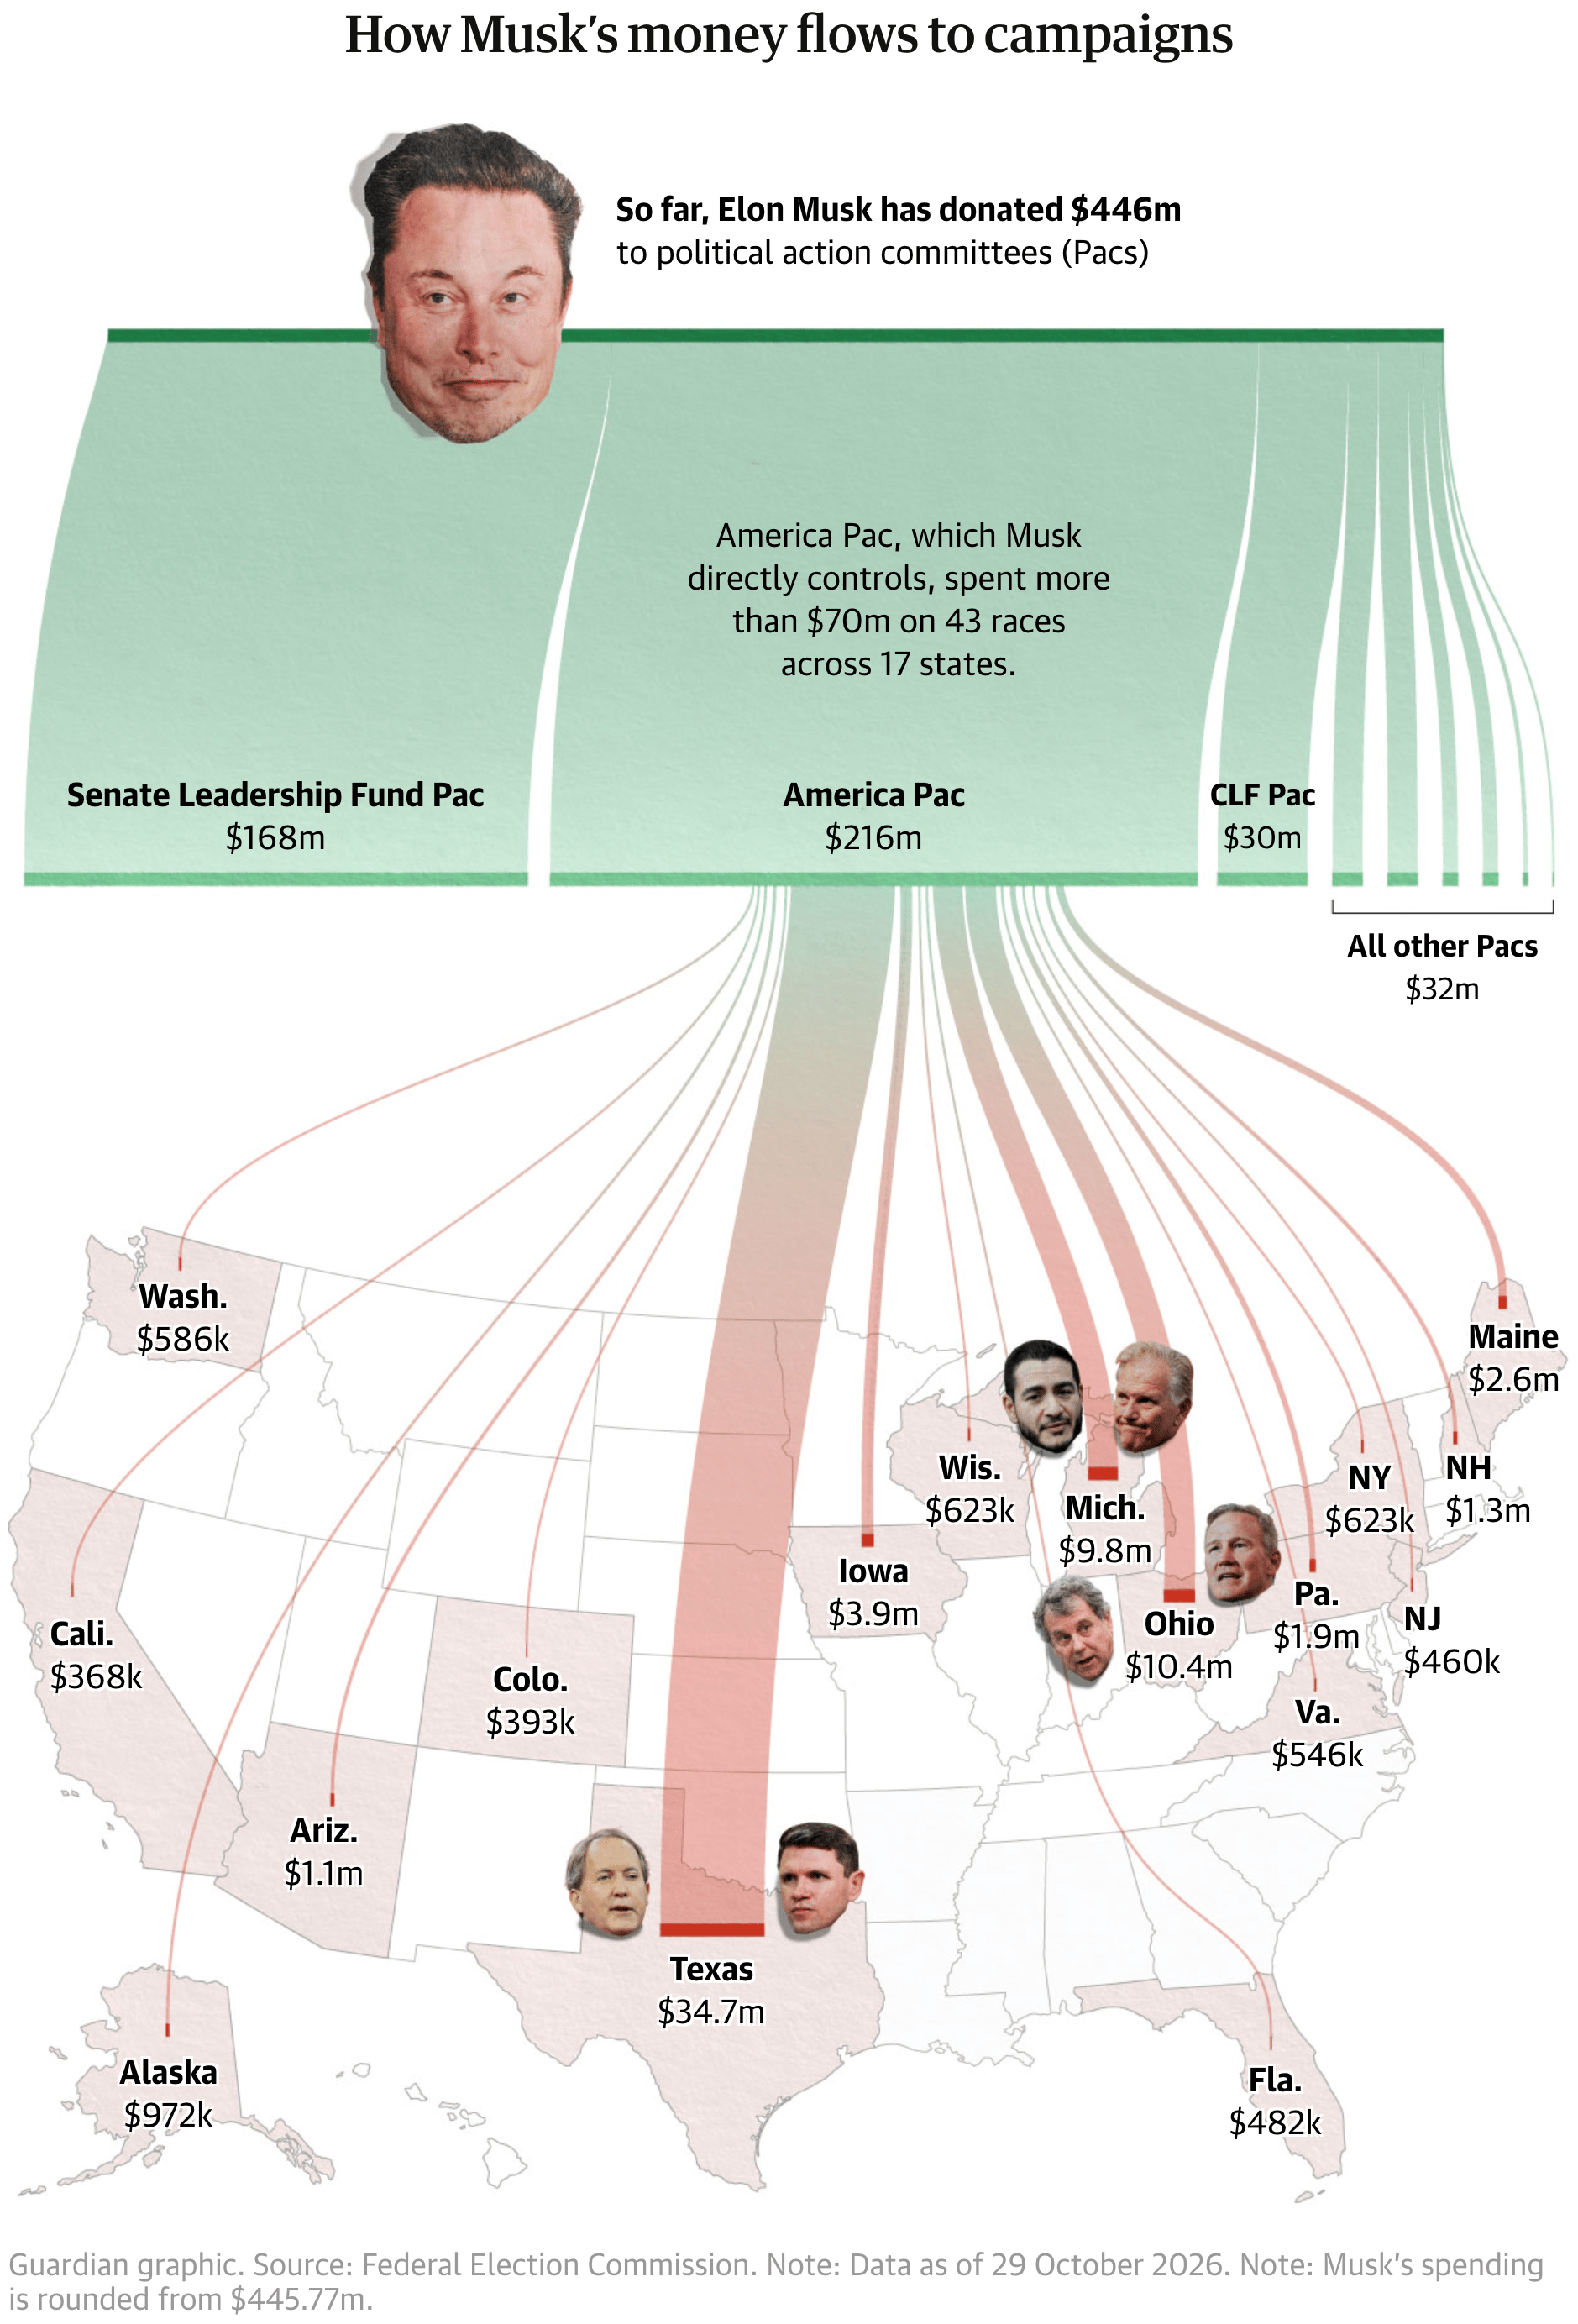
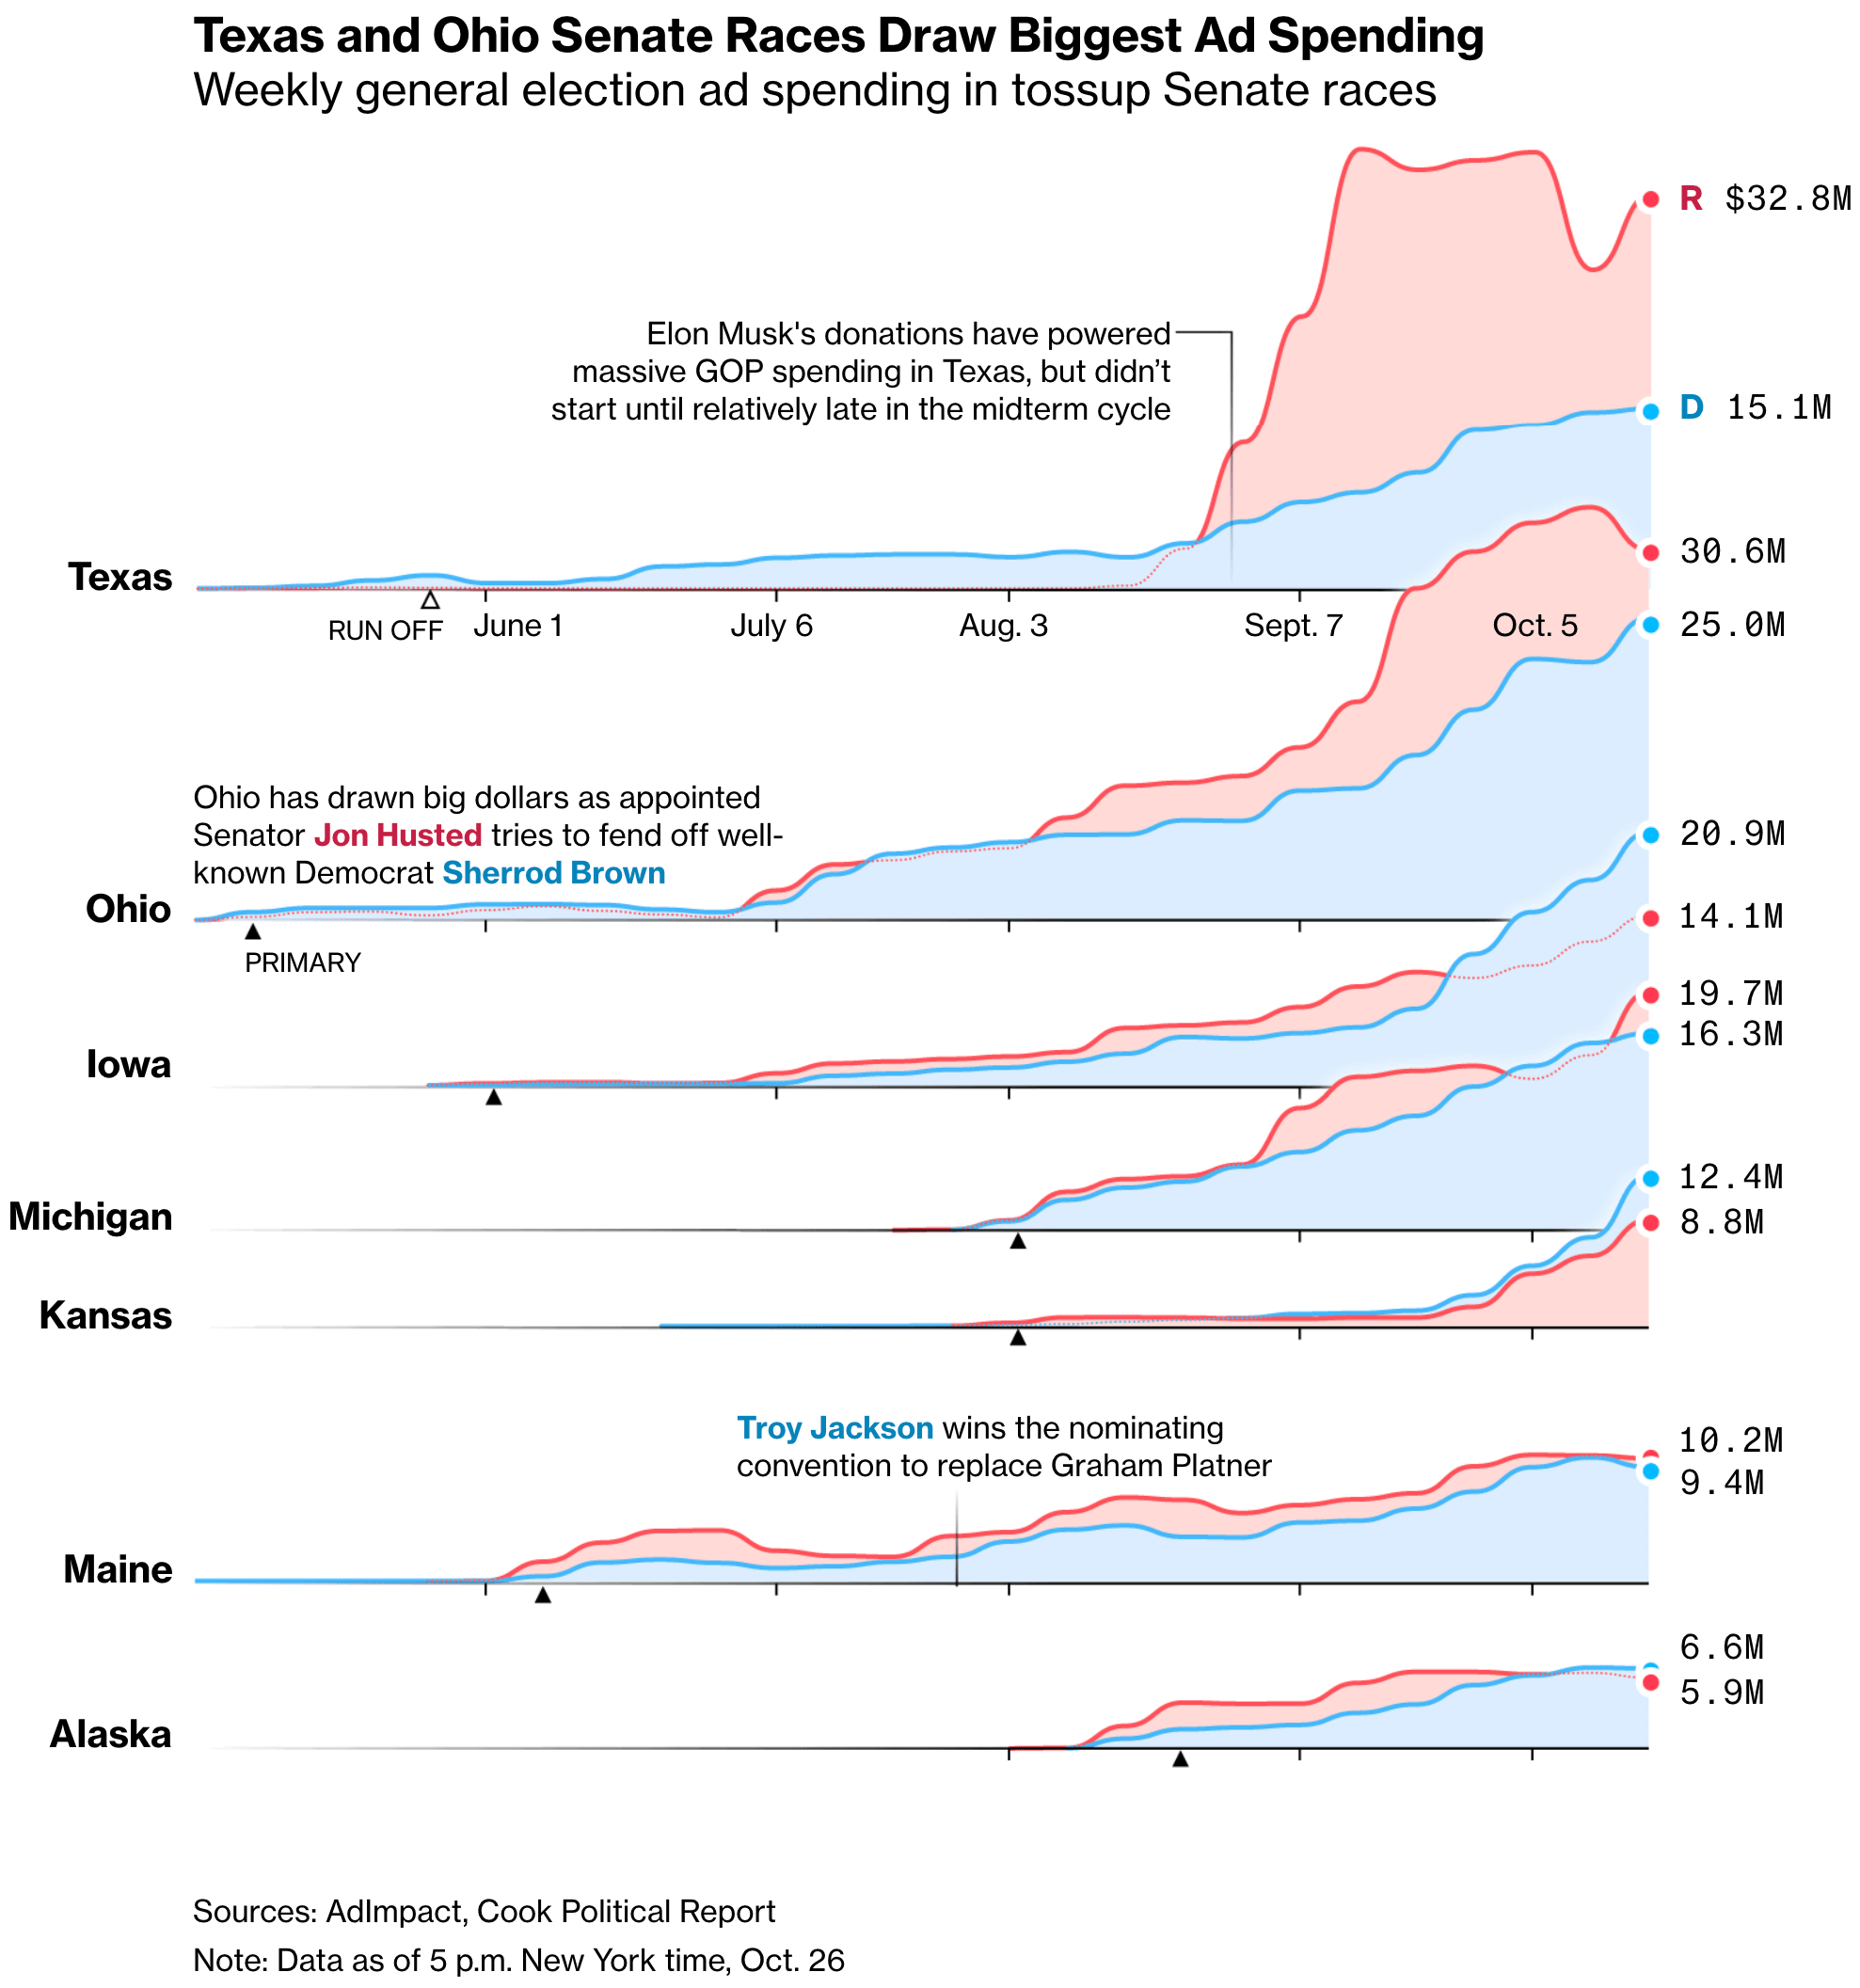
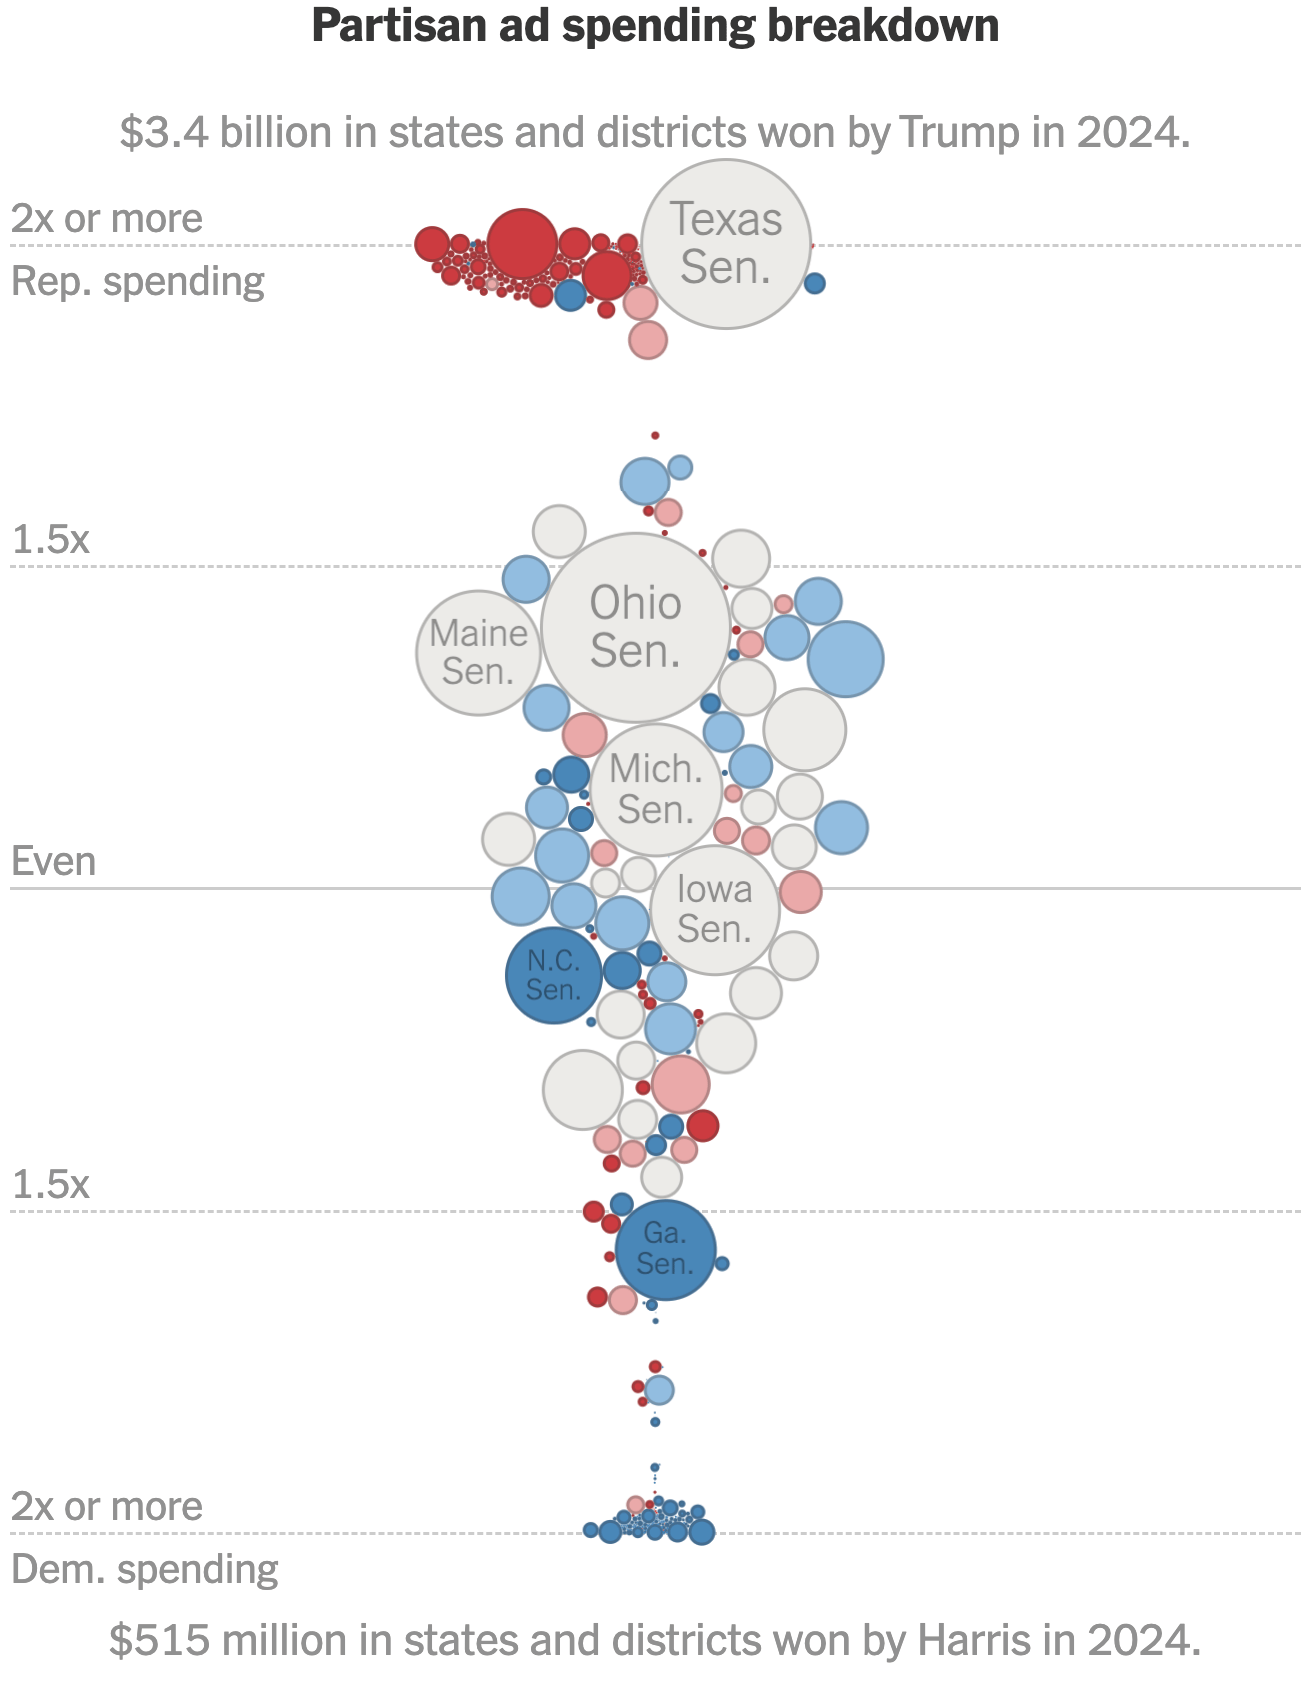
On a similar note, Elon Musk has spent vast sums on donations throughout this election campaign, while advertising spending has also skyrocketed. Ads opposing data centres have become more common on social media.

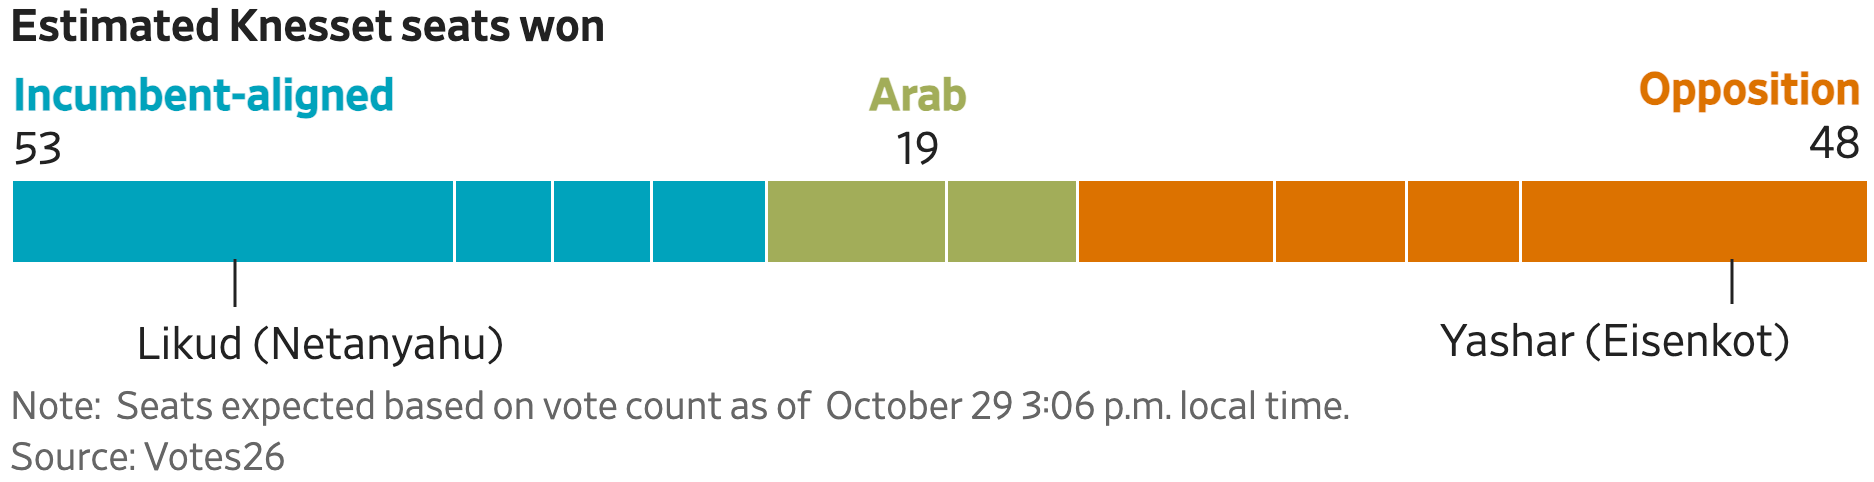
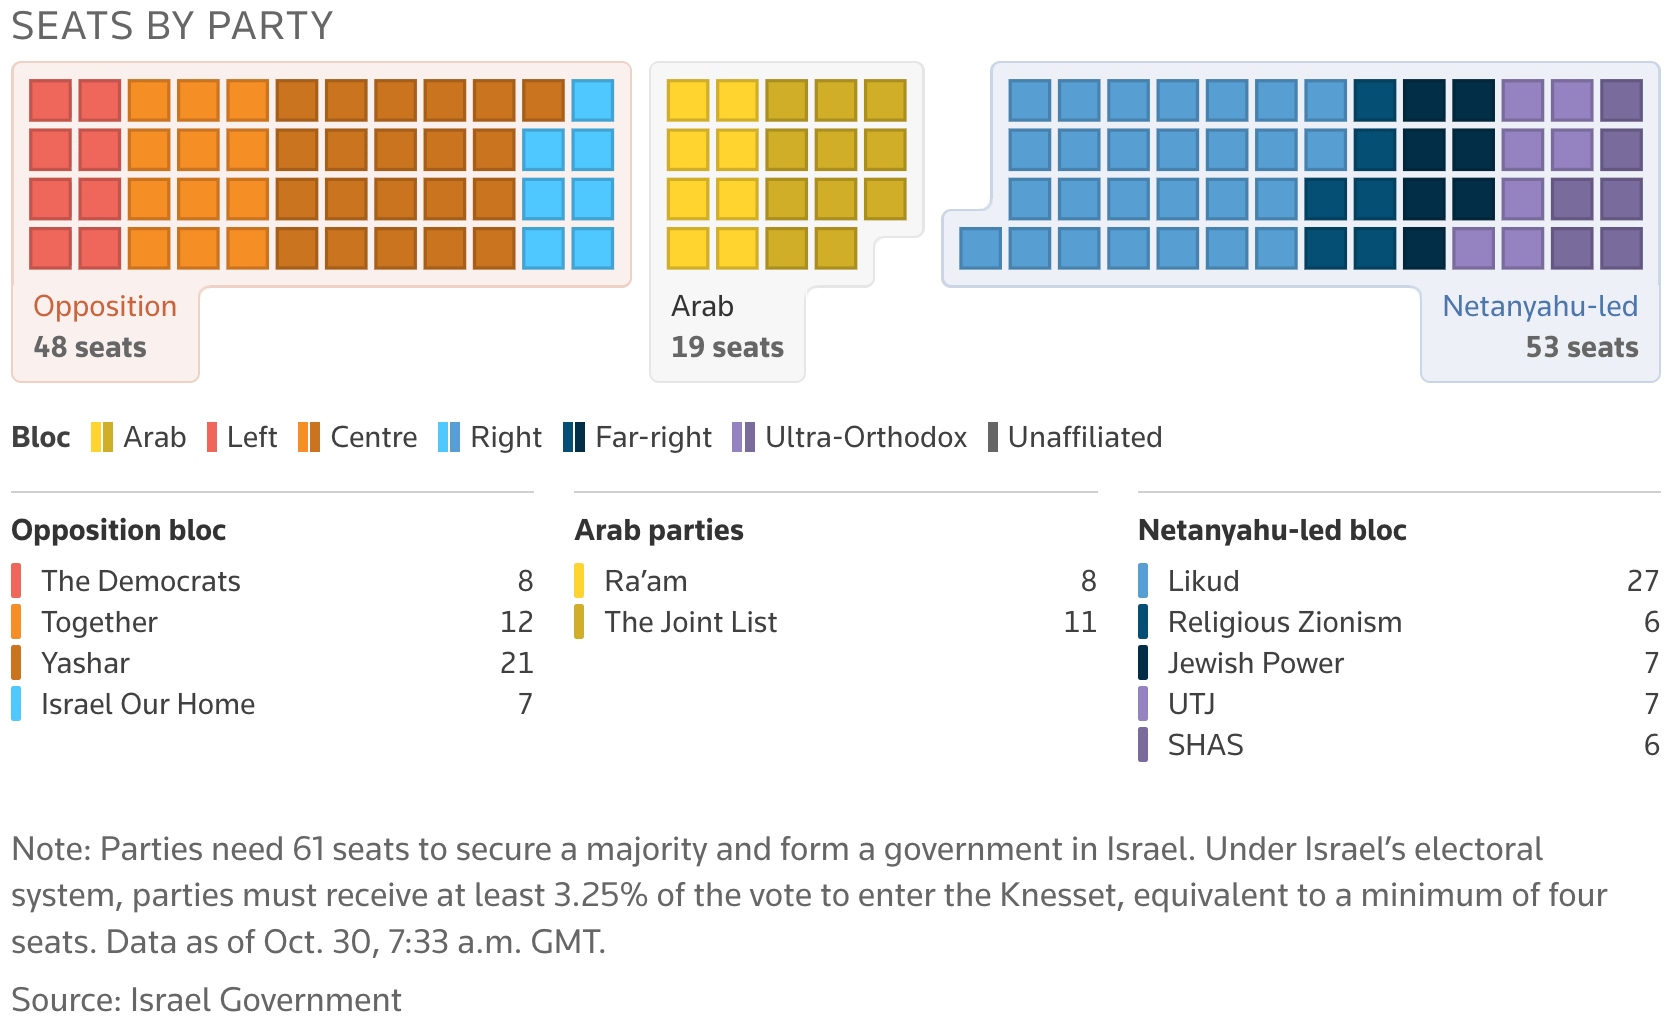
Following Israel's general election, the country now faces political uncertainty, as neither the Netanyahu-led bloc nor the Opposition bloc was able to secure the 61-seat majority required to form a government.

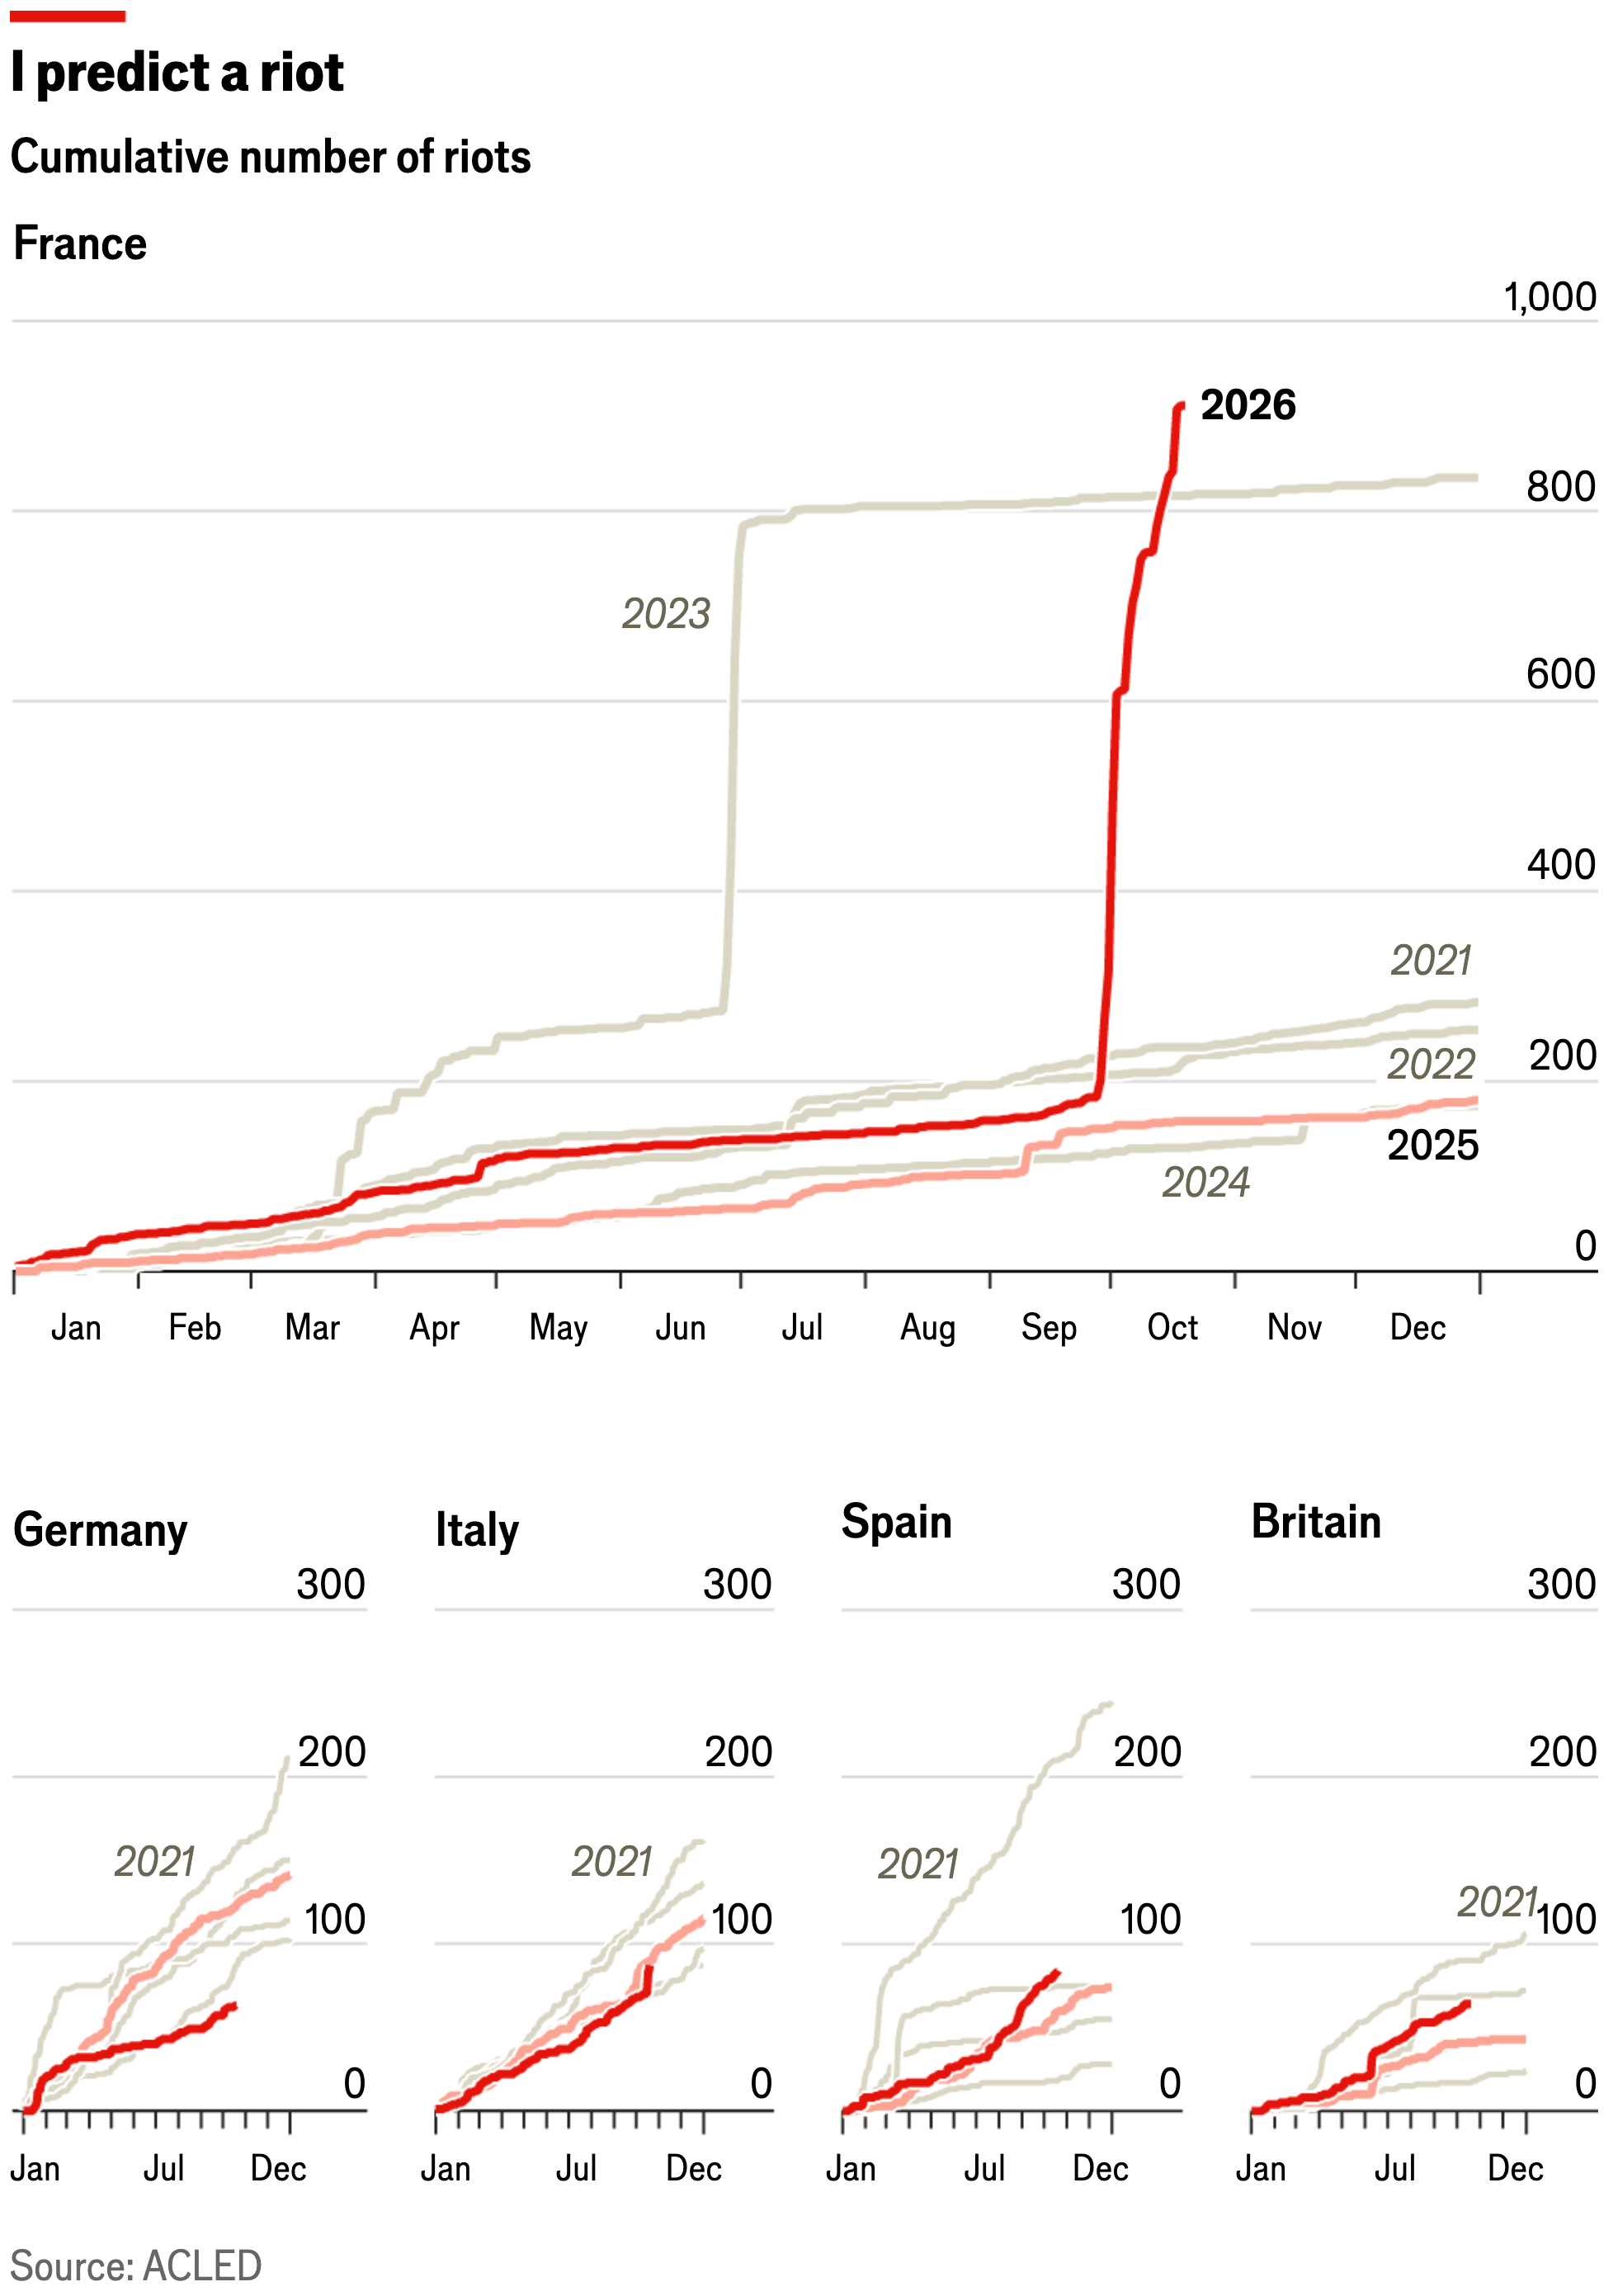
Demonstrations and riots have spread throughout Europe over the past few weeks, with the majority of tear gas being used against protesters occurring in France.

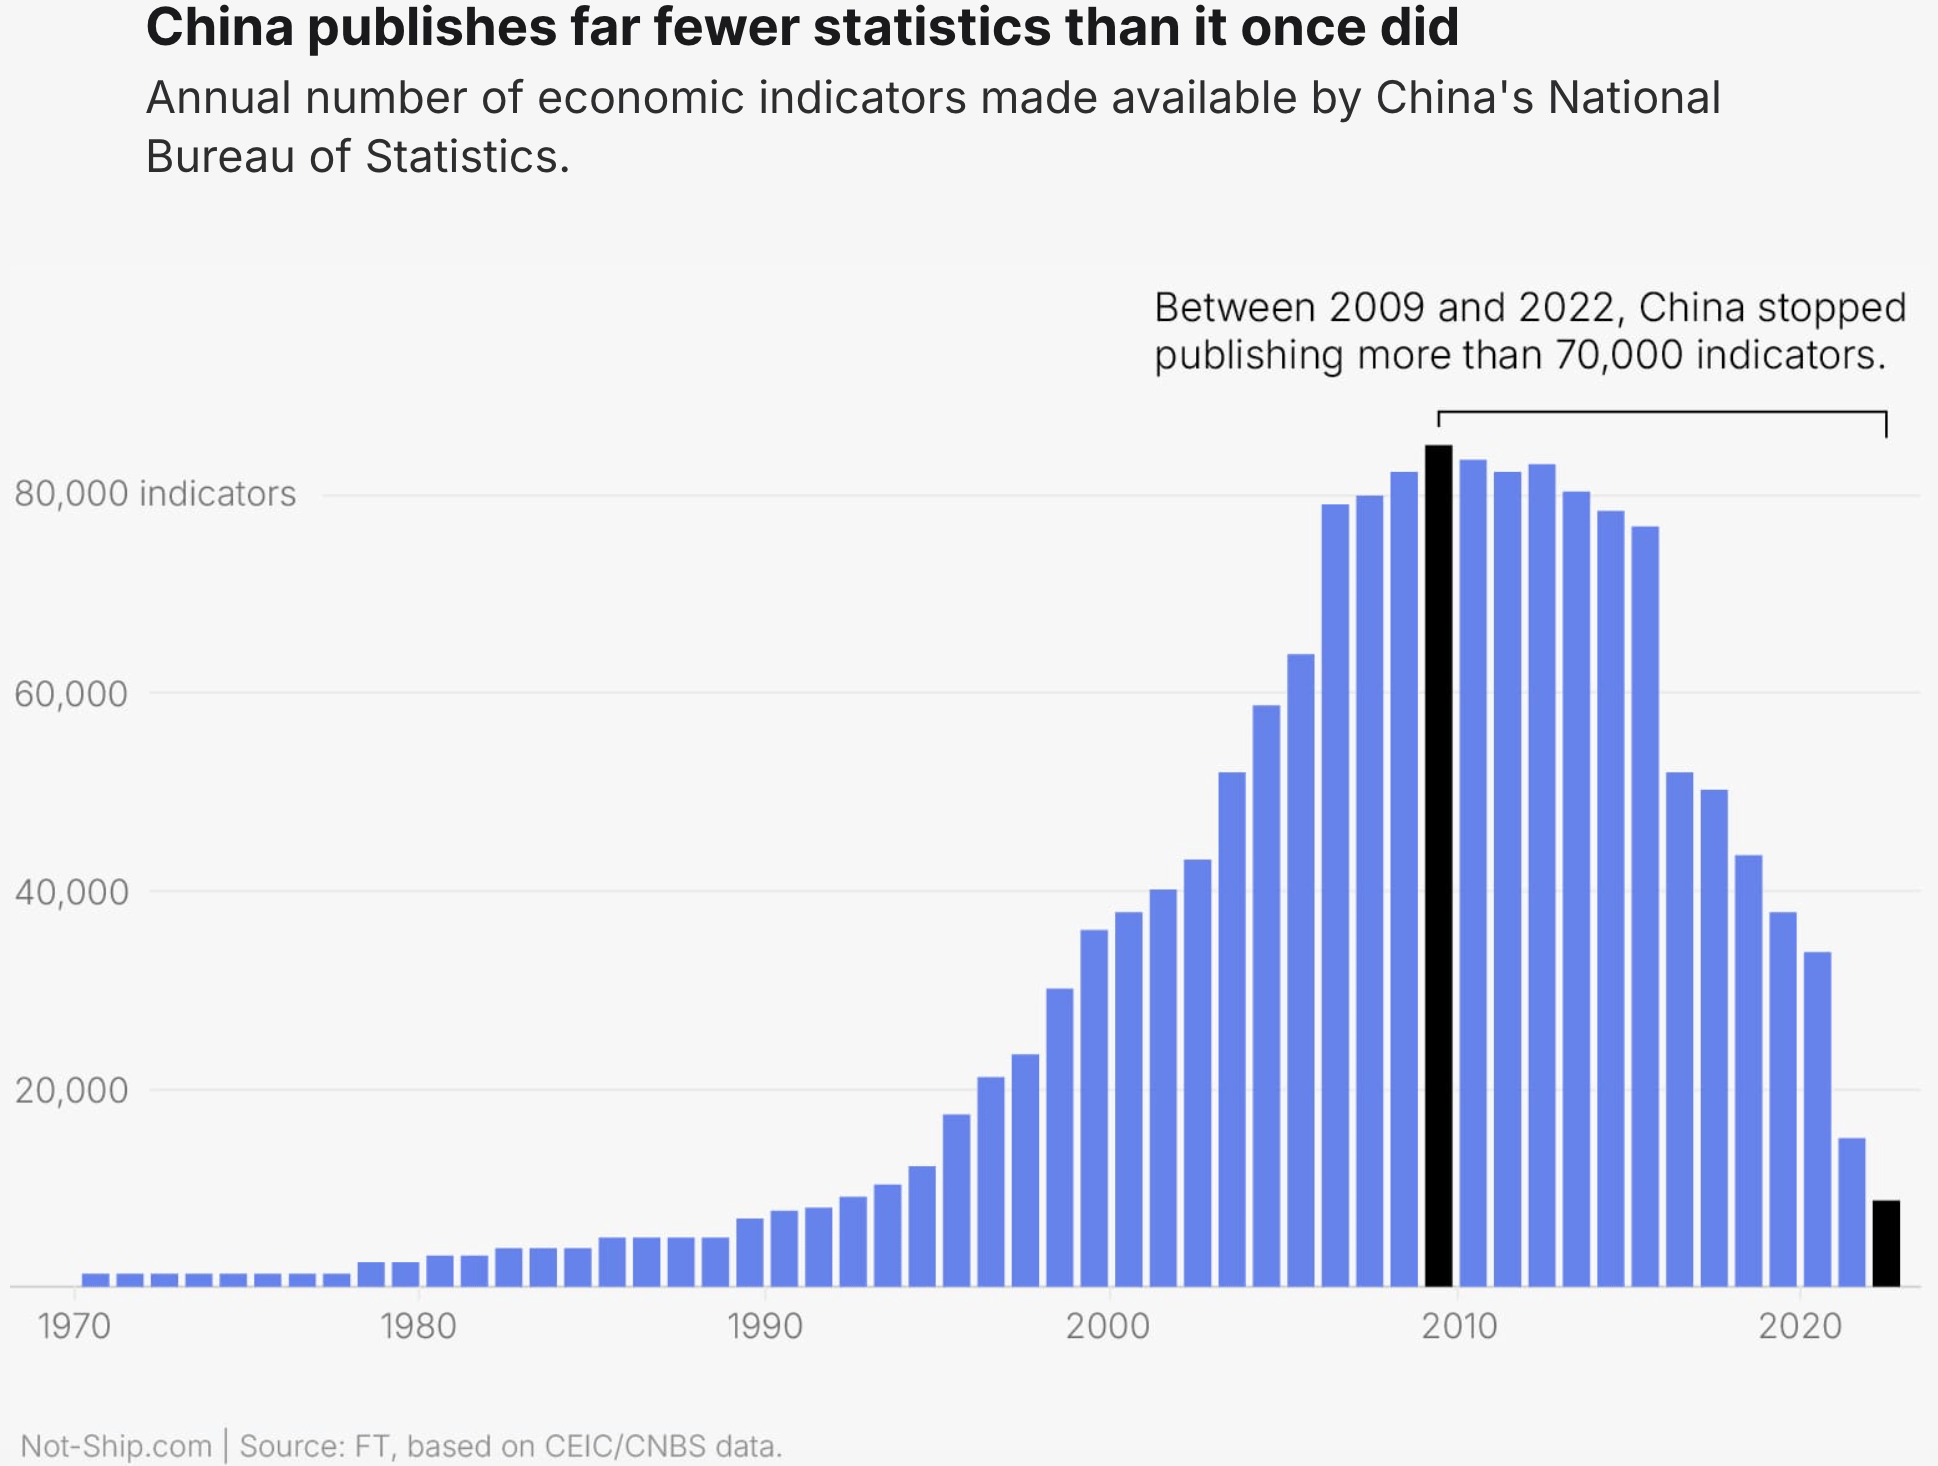
China has accelerated the mapping of waters near Taiwan, while the country's energy equipment is powering the AI boom. Additionally, thousands of economic statistics are no longer being published.


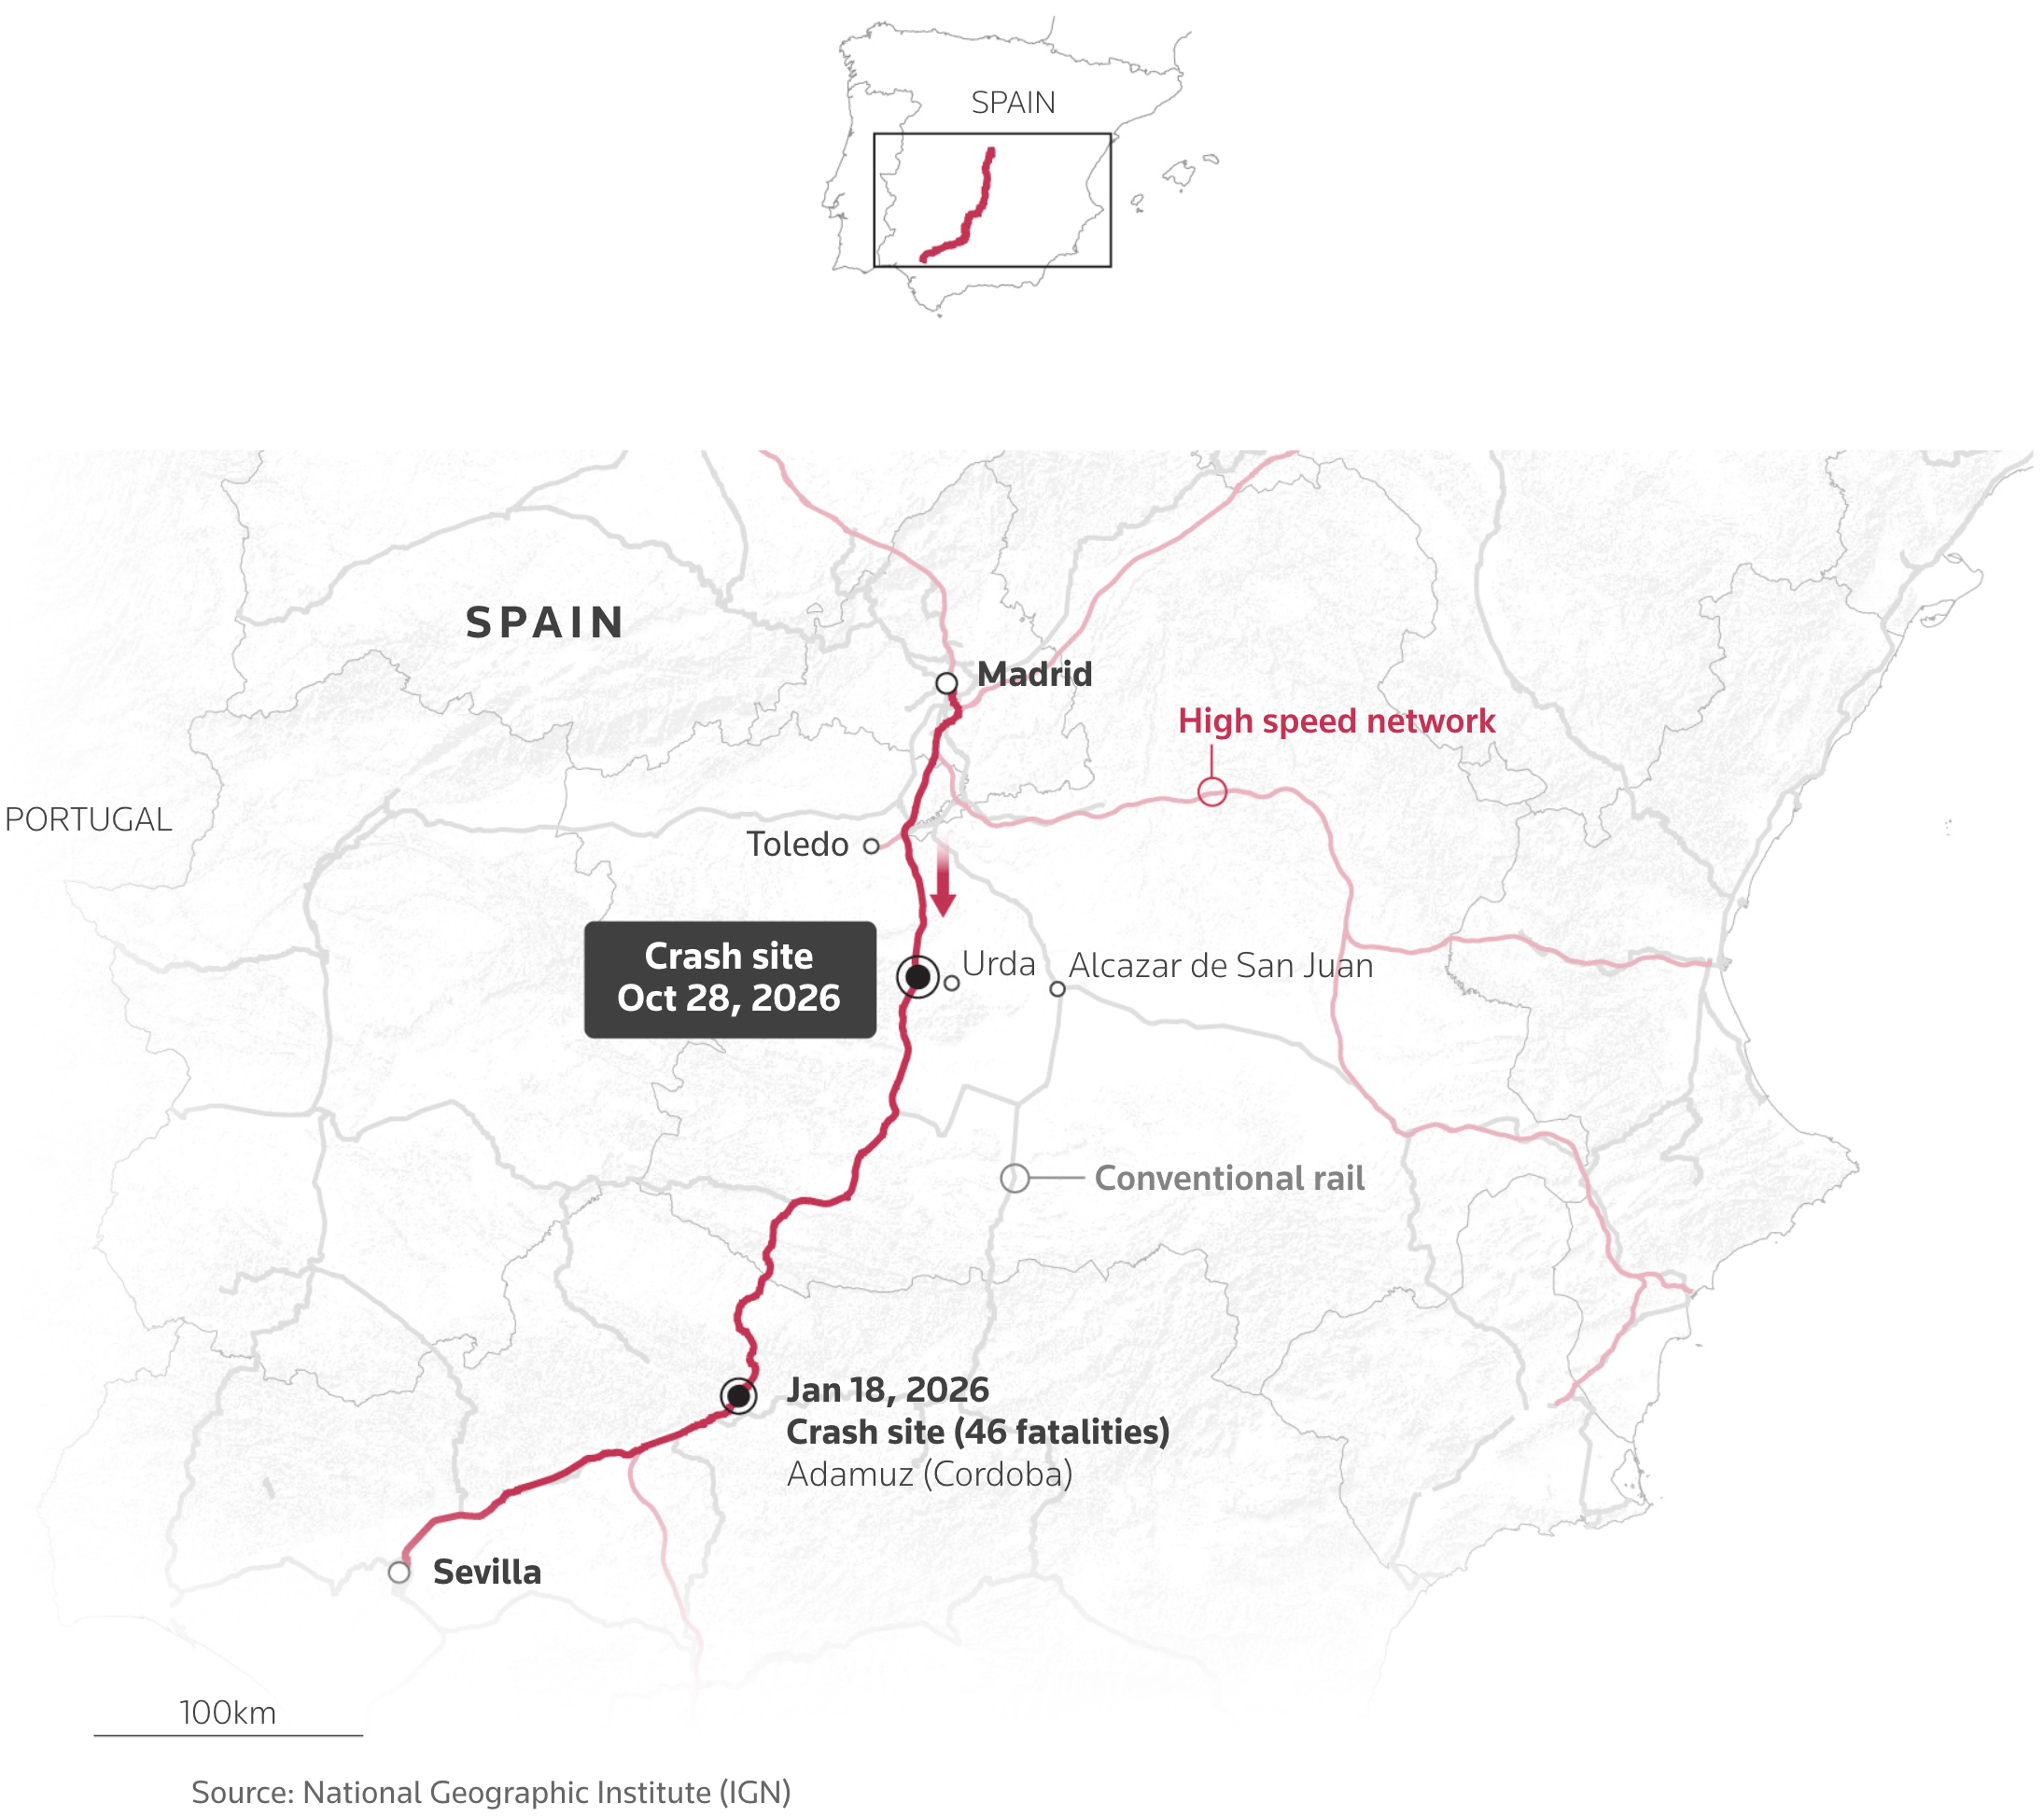
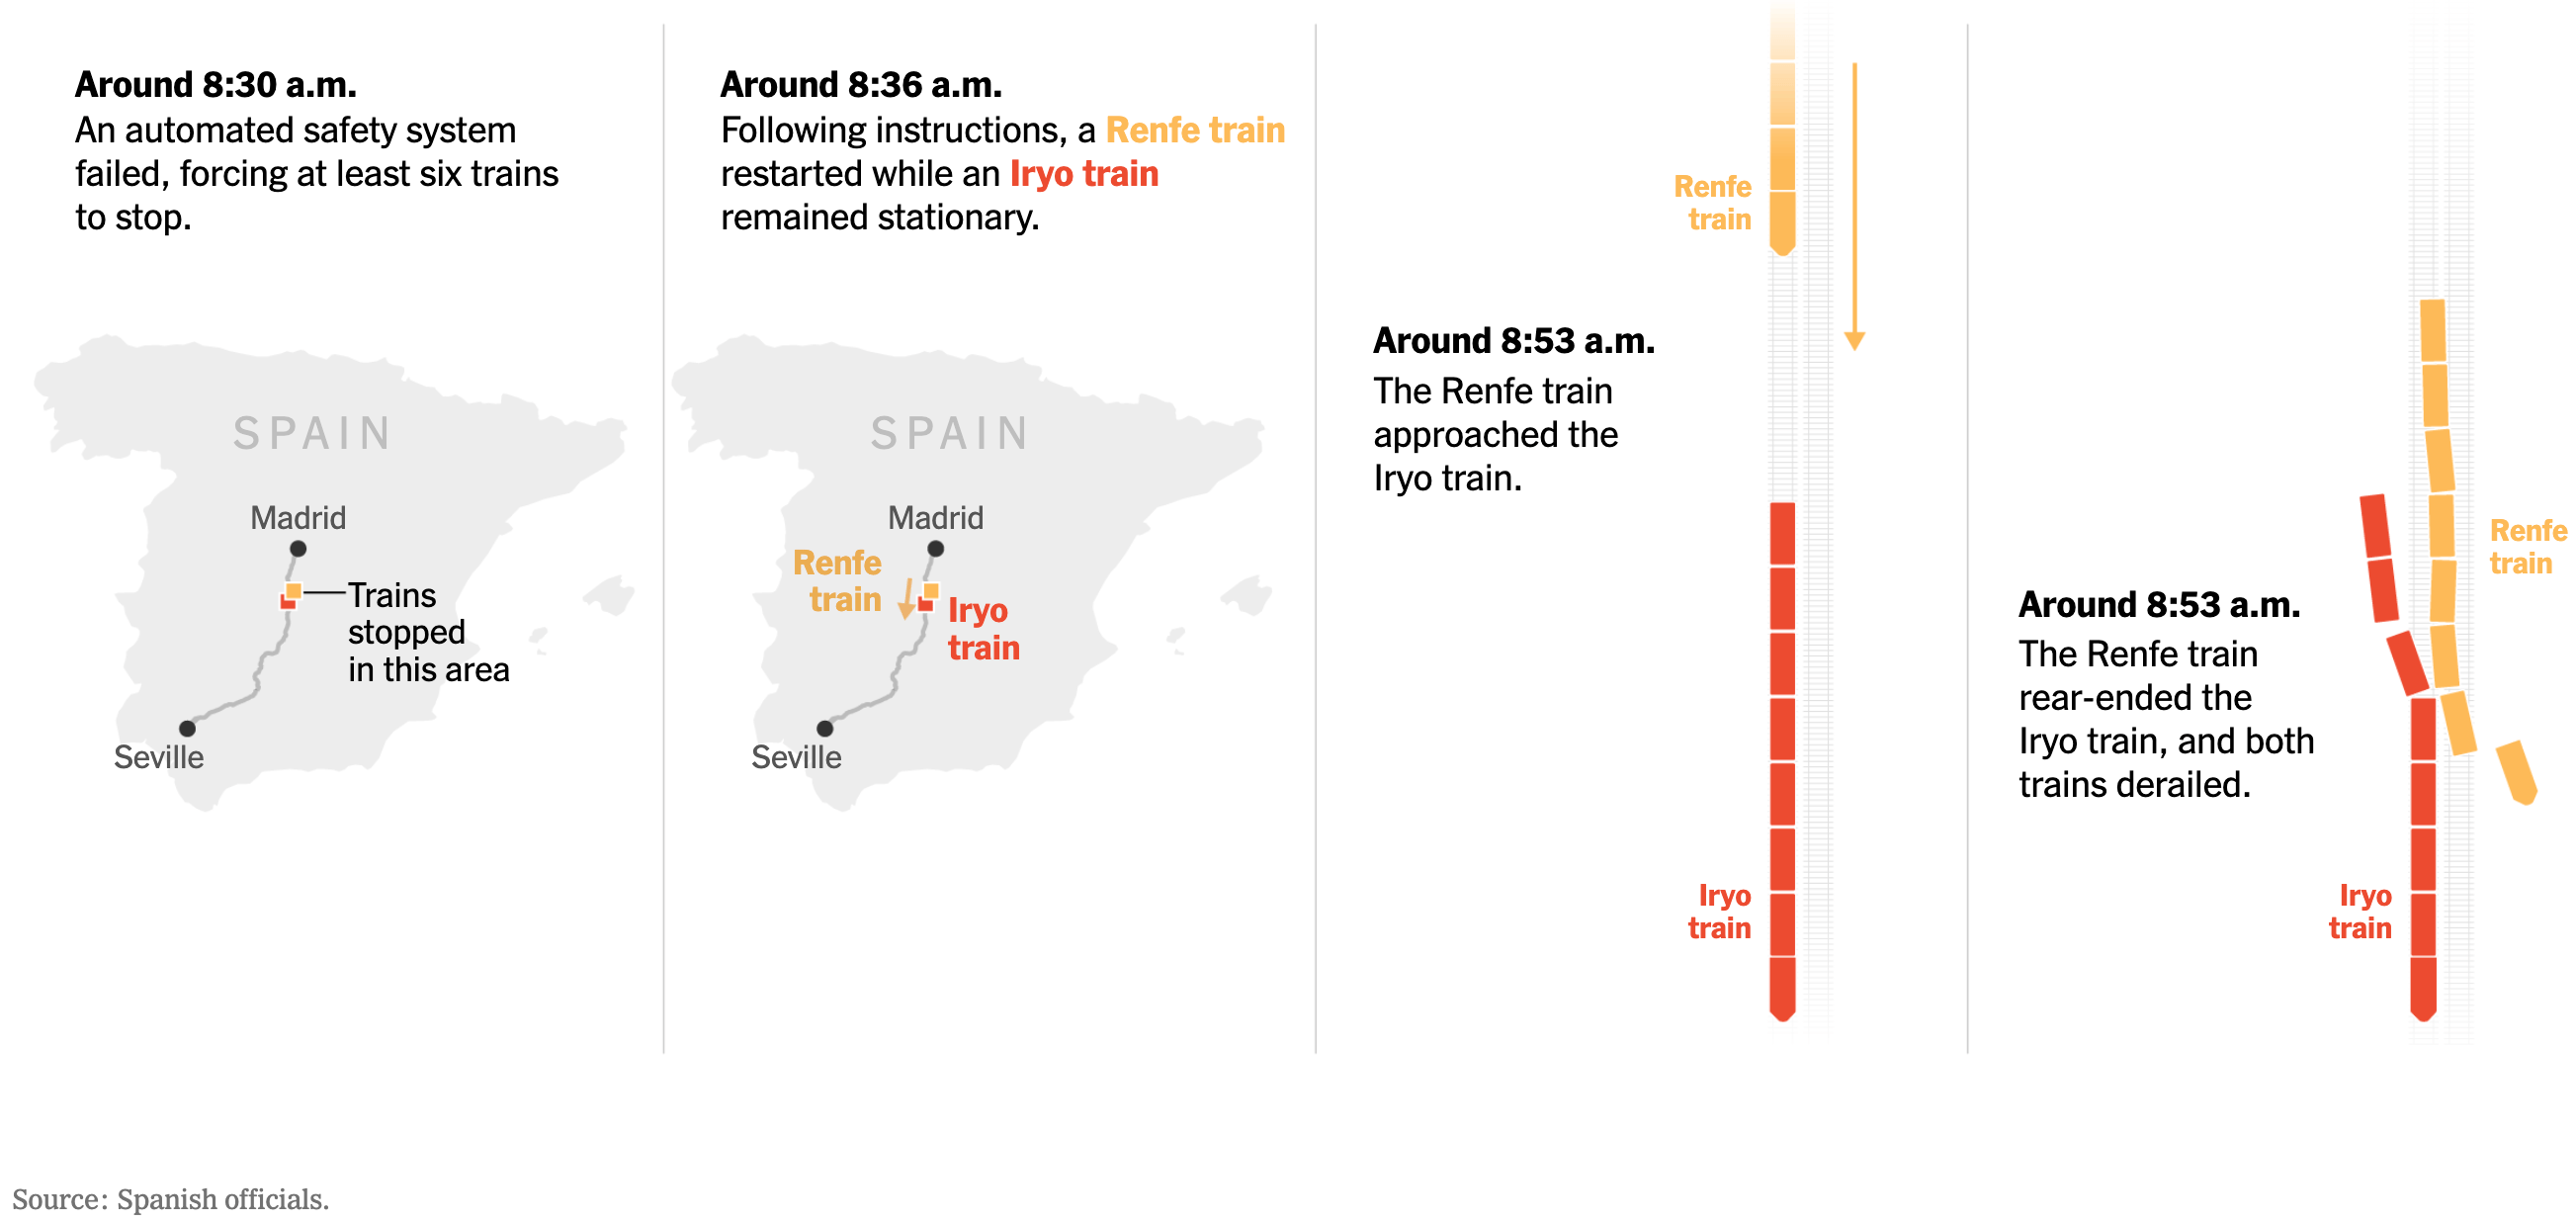
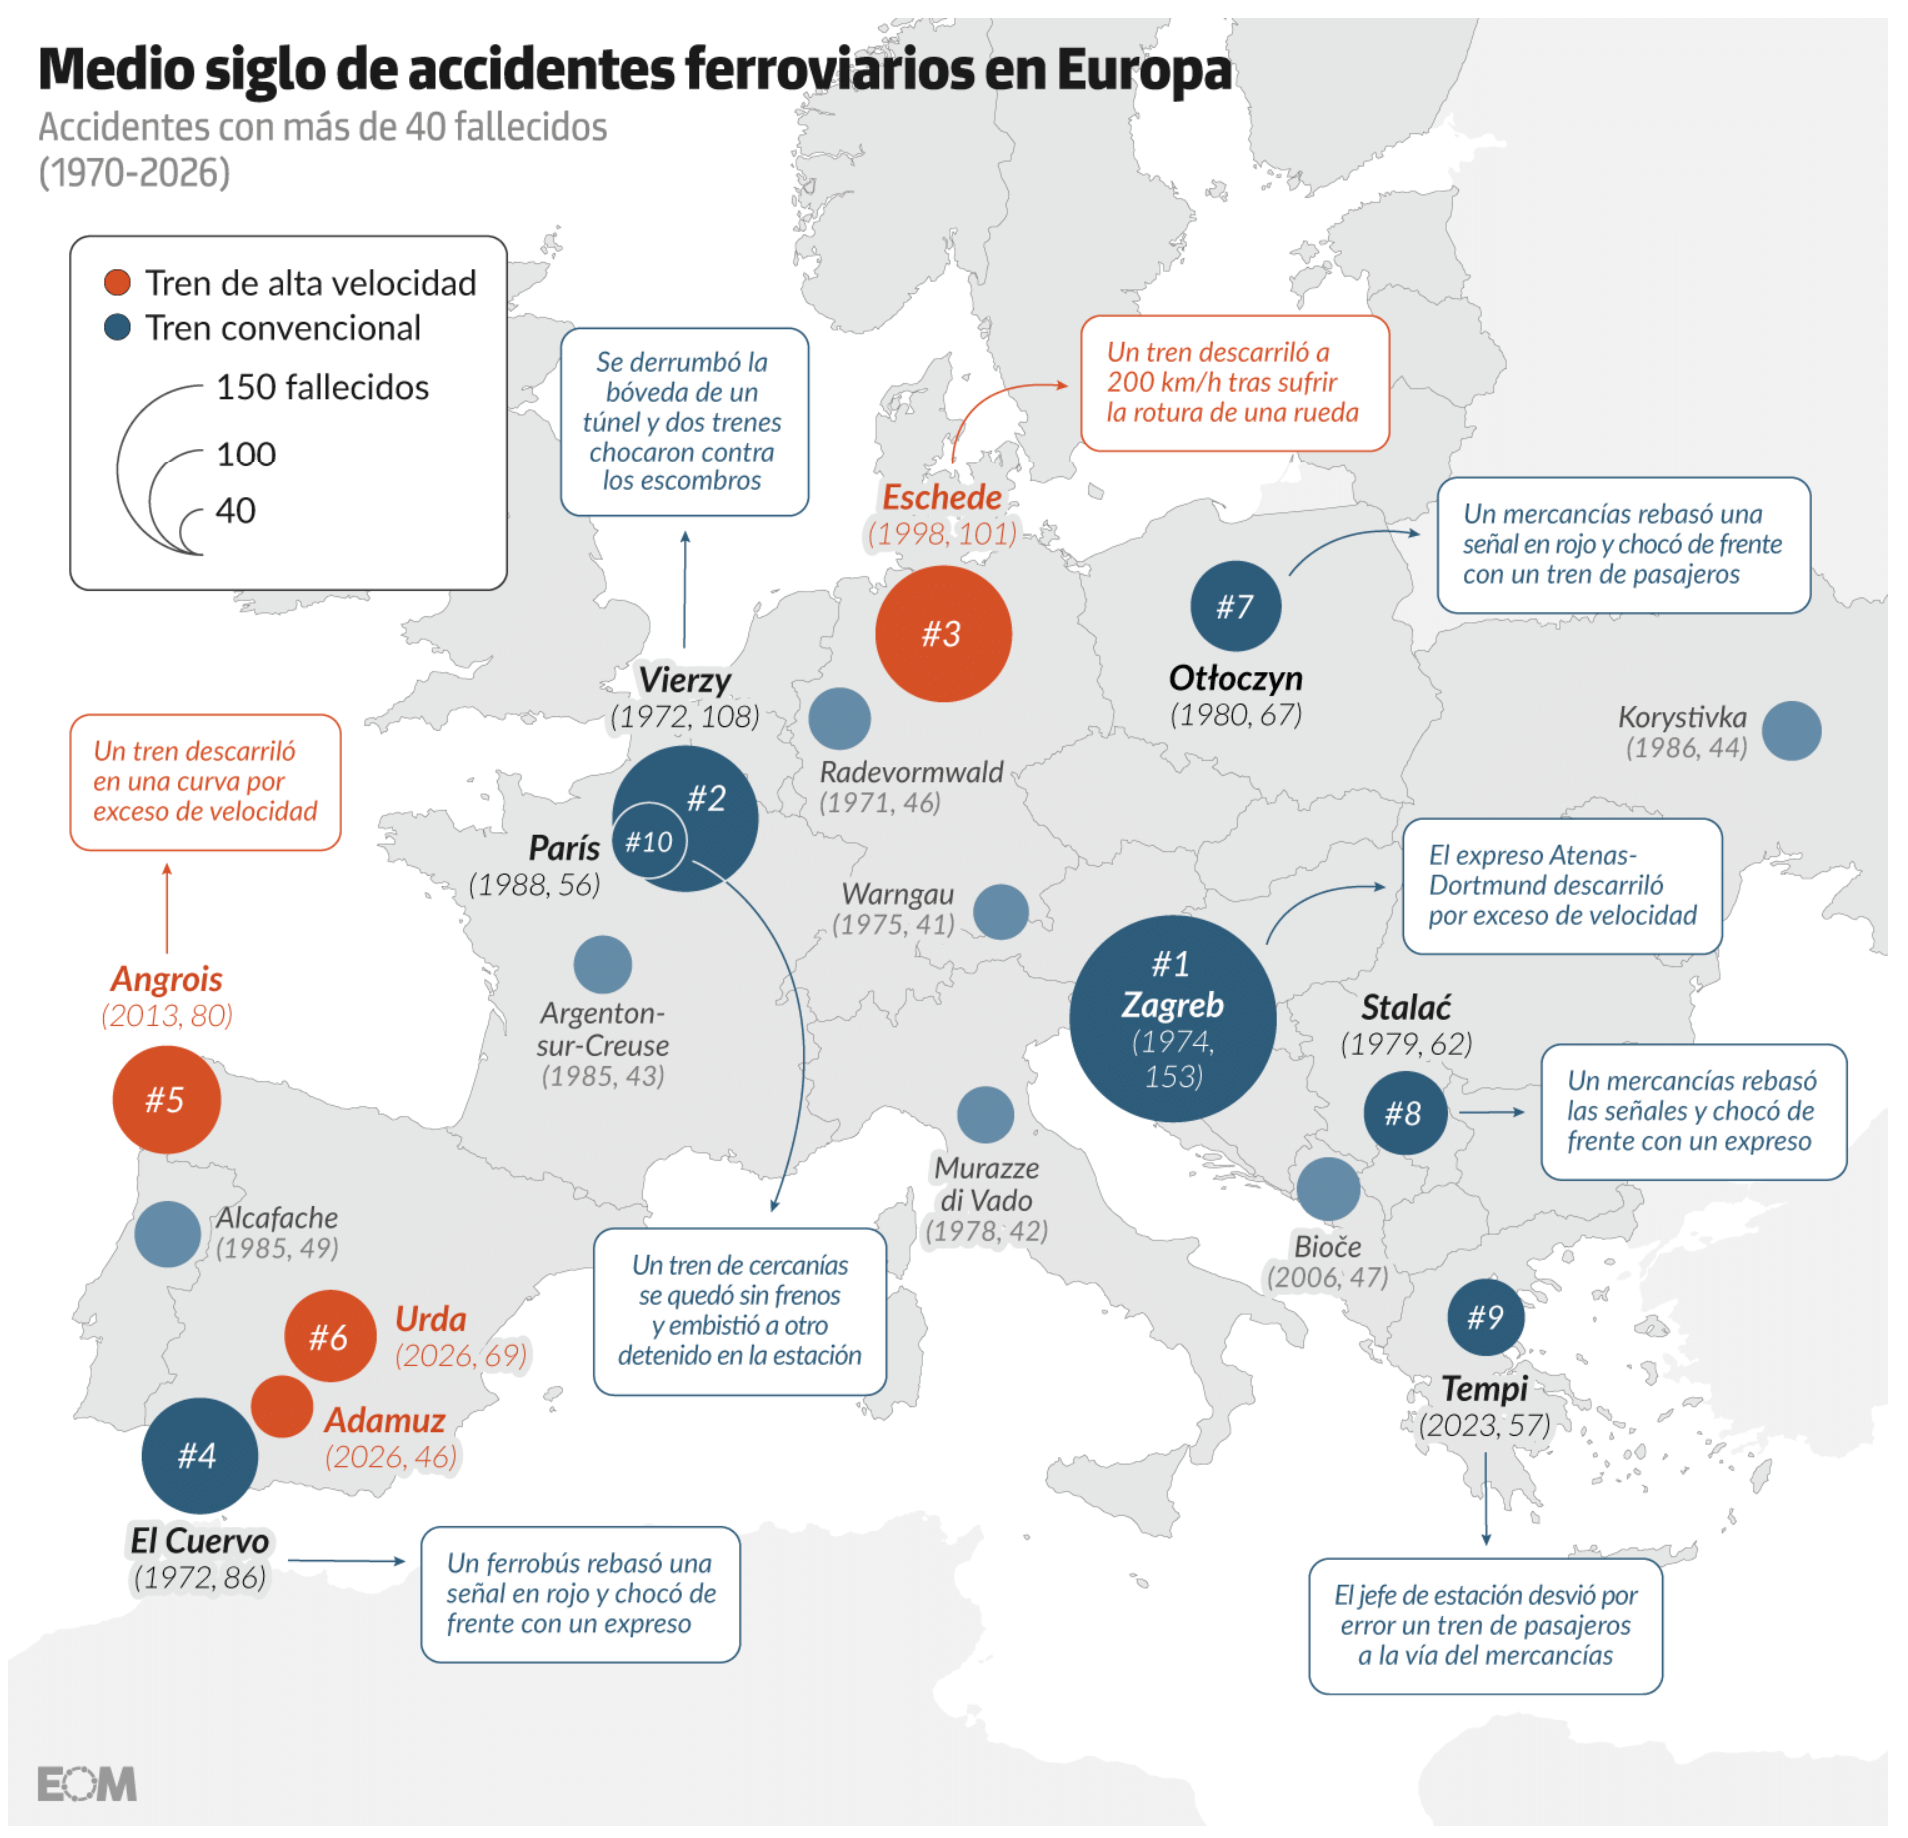
Last week, a train collision occurred south of Madrid, involving a high-speed train that struck the rear of a stationary train.

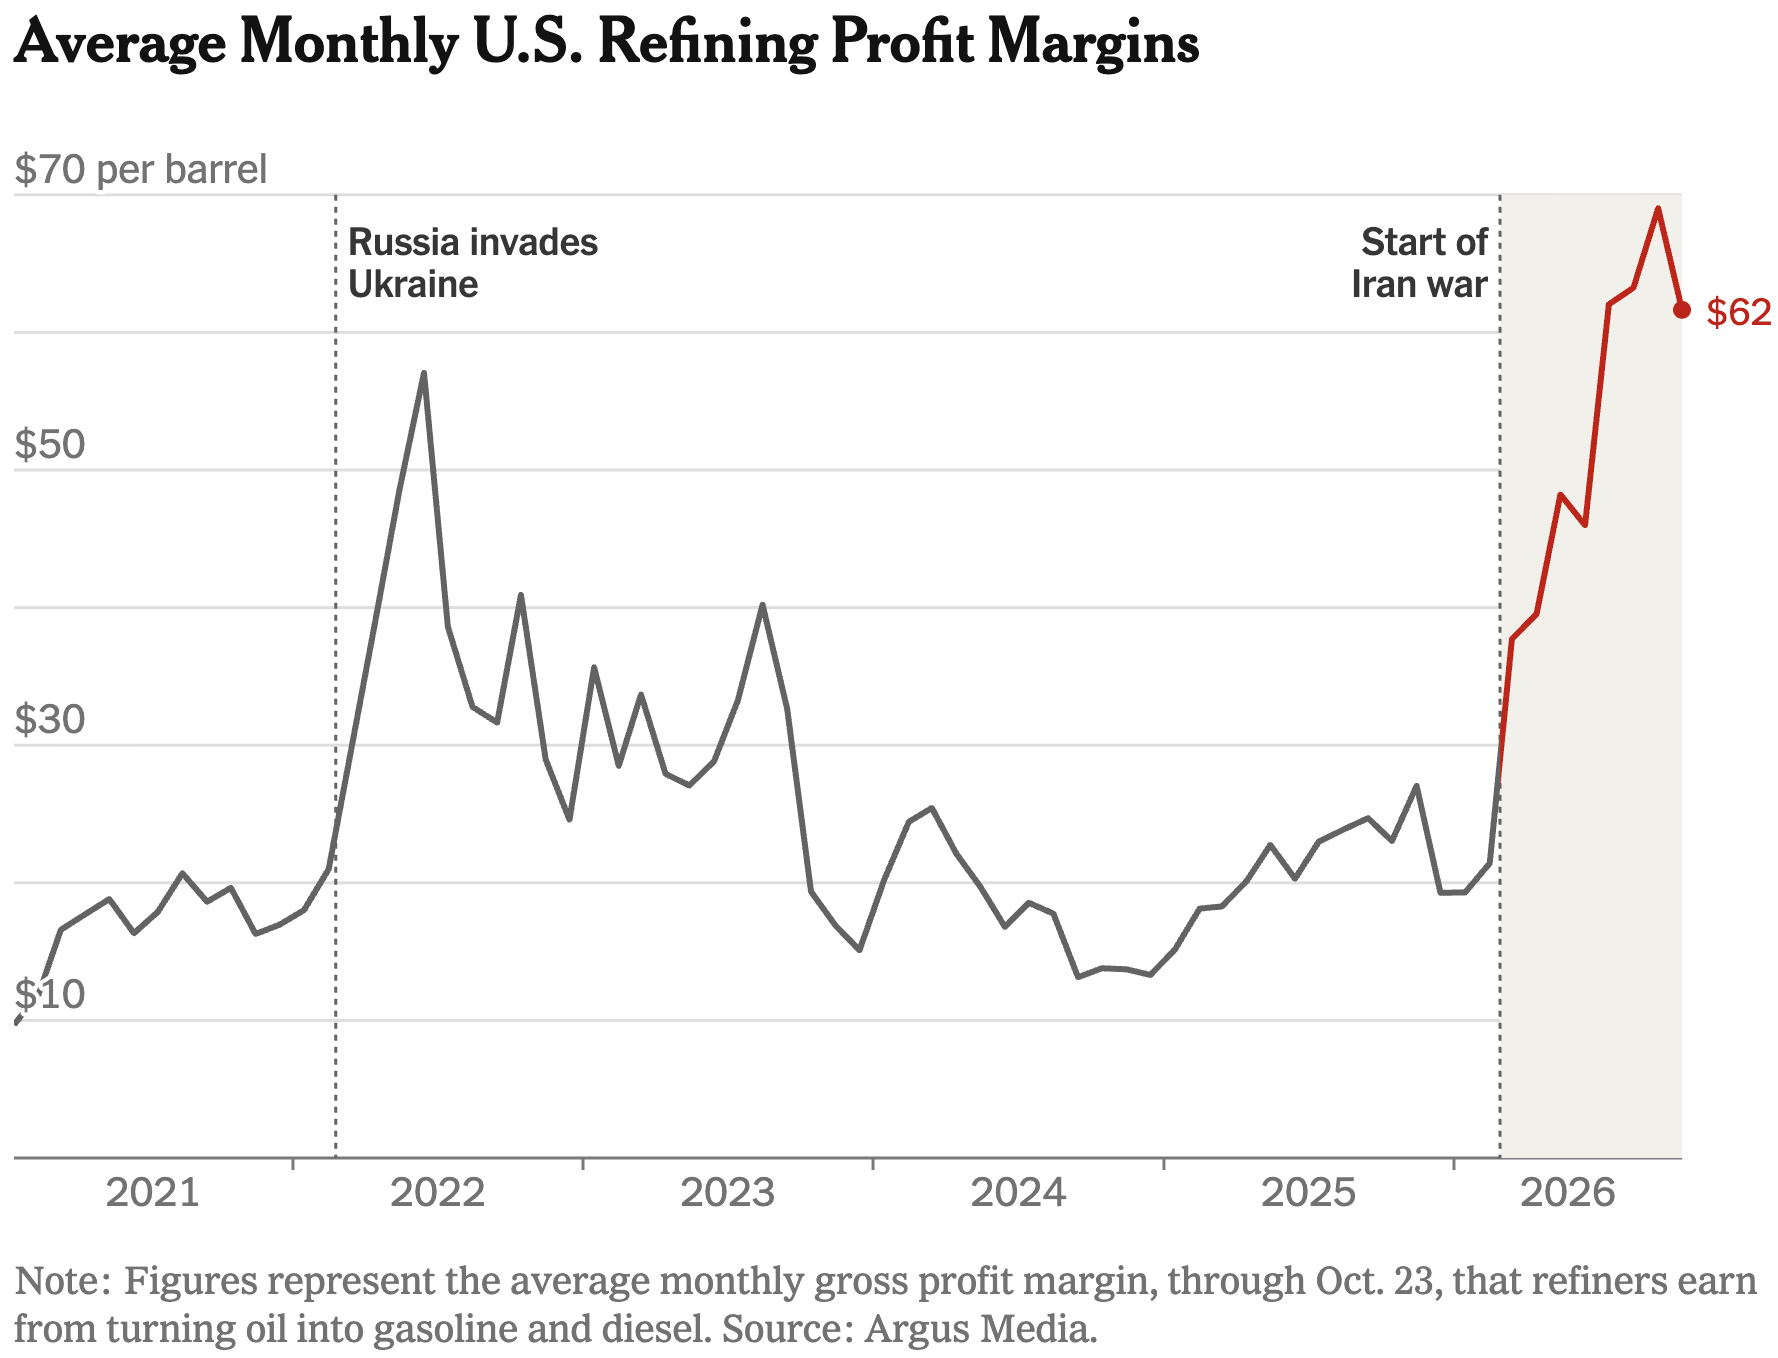
On the topic of war, while Russian strikes on Ukraine have intensified recently, the U.S. oil industry has reported billions of dollars in profits.

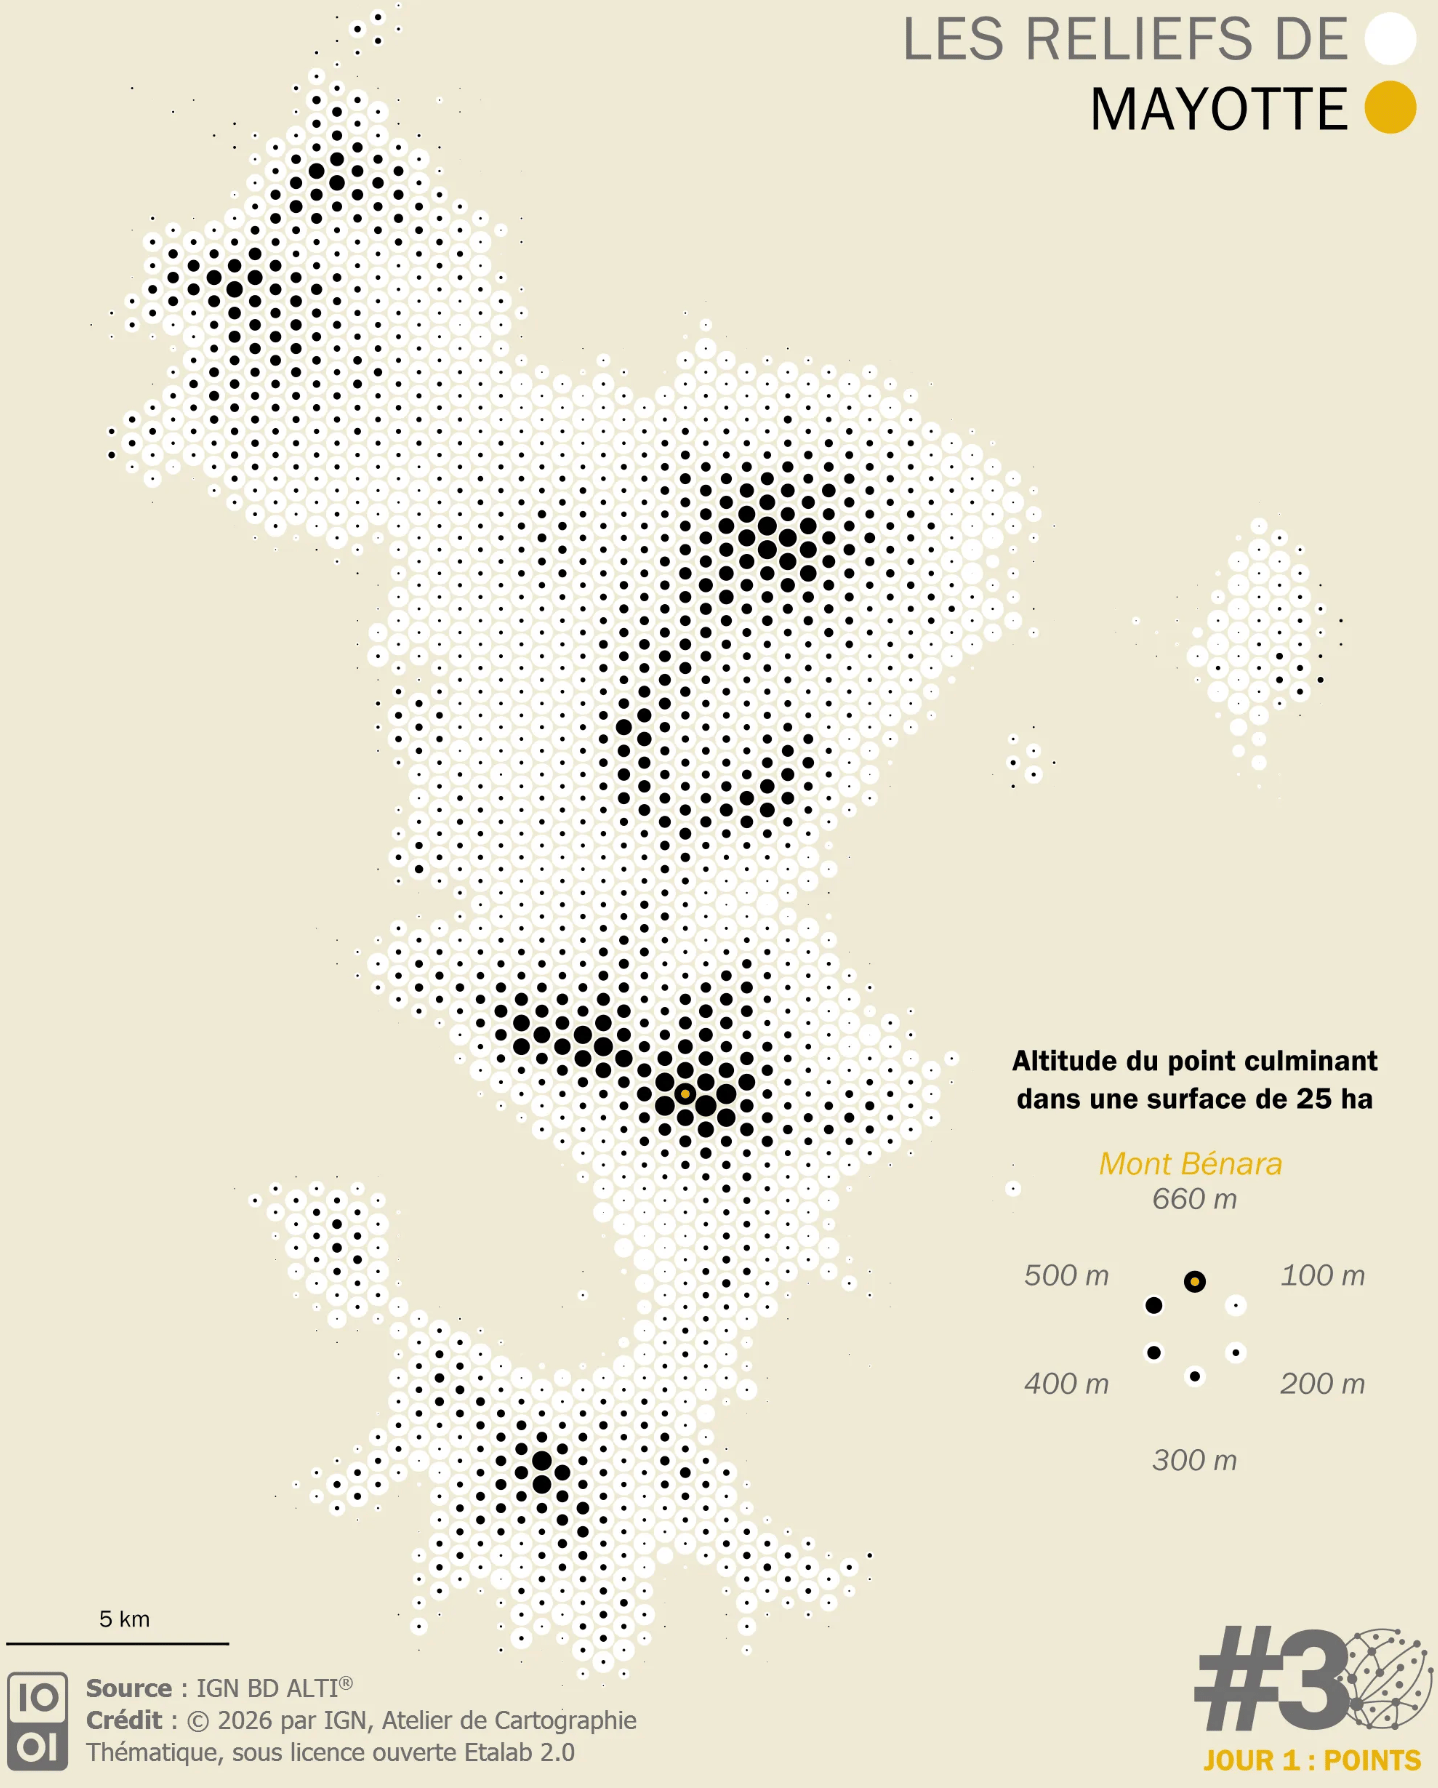
The start of November means it's time for this year's #30daymapchallenge! Check out the first batch of selected visualizations covering the terrain of Mayotte, street tree colors, a 3D map of the Matterhorn, and an interactive tool to explore Berlin's trees.

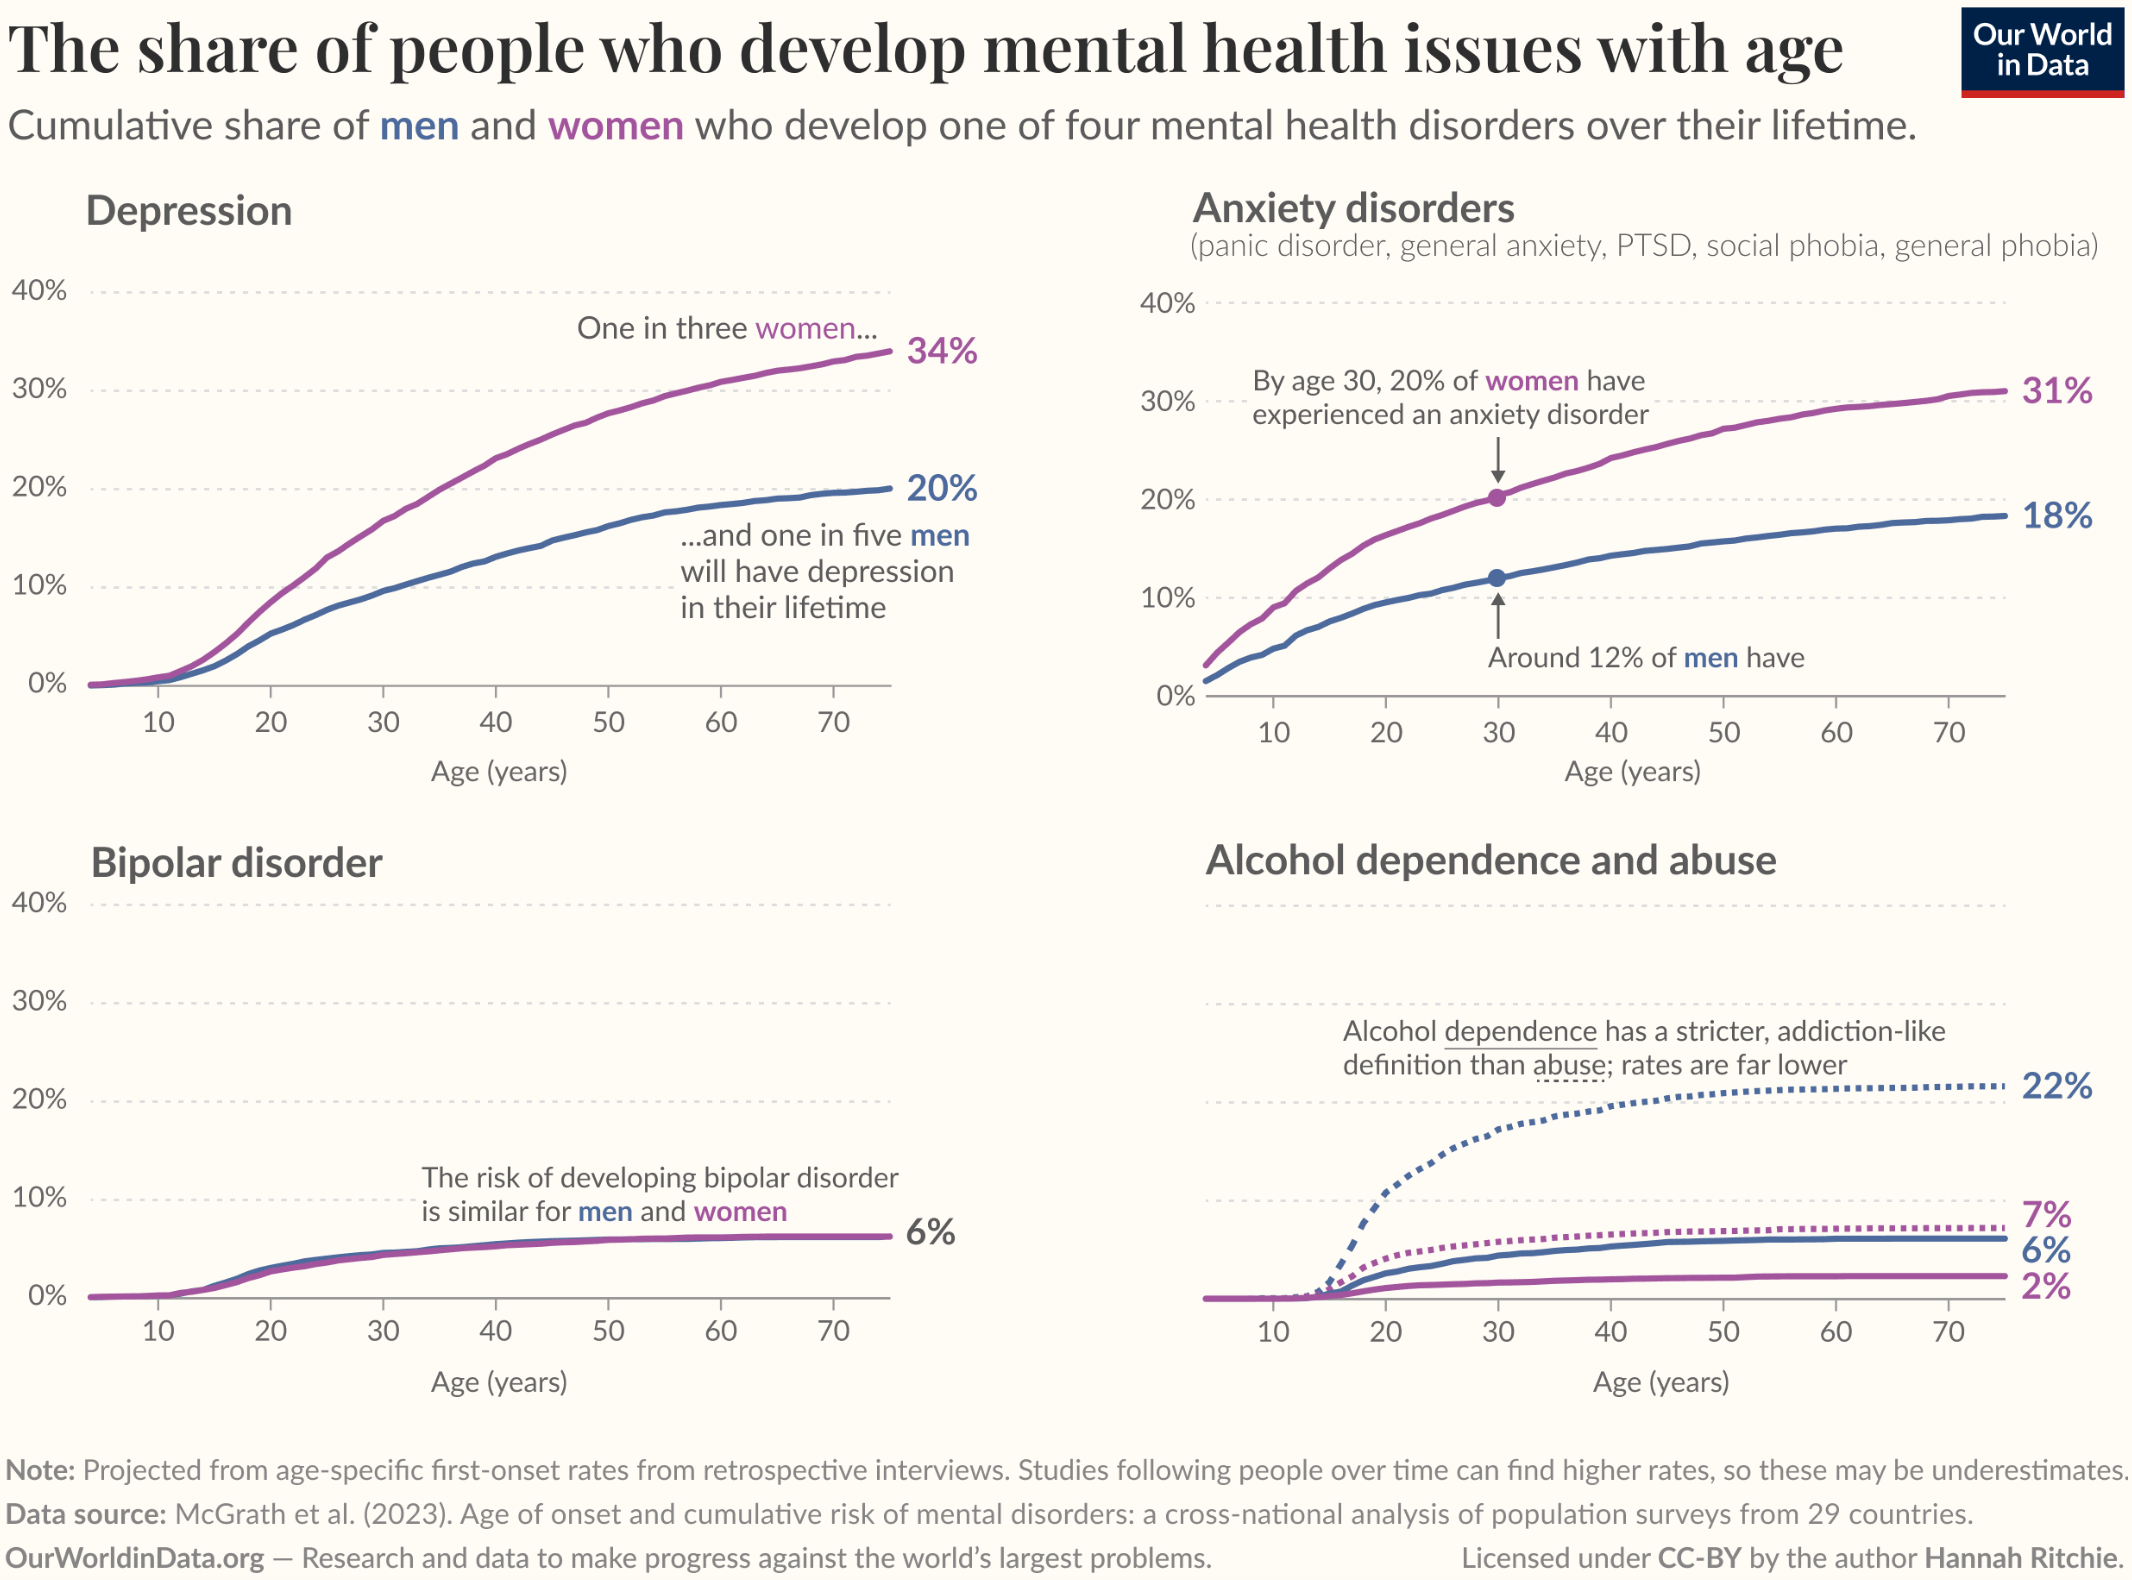
Moving on to health, increasing HPV vaccination rates could prevent thousands of cervical cancer cases every year, and the age at which mental health issues can develop varies. Meanwhile, premiums under the Affordable Care Act (ACA) are increasing significantly.


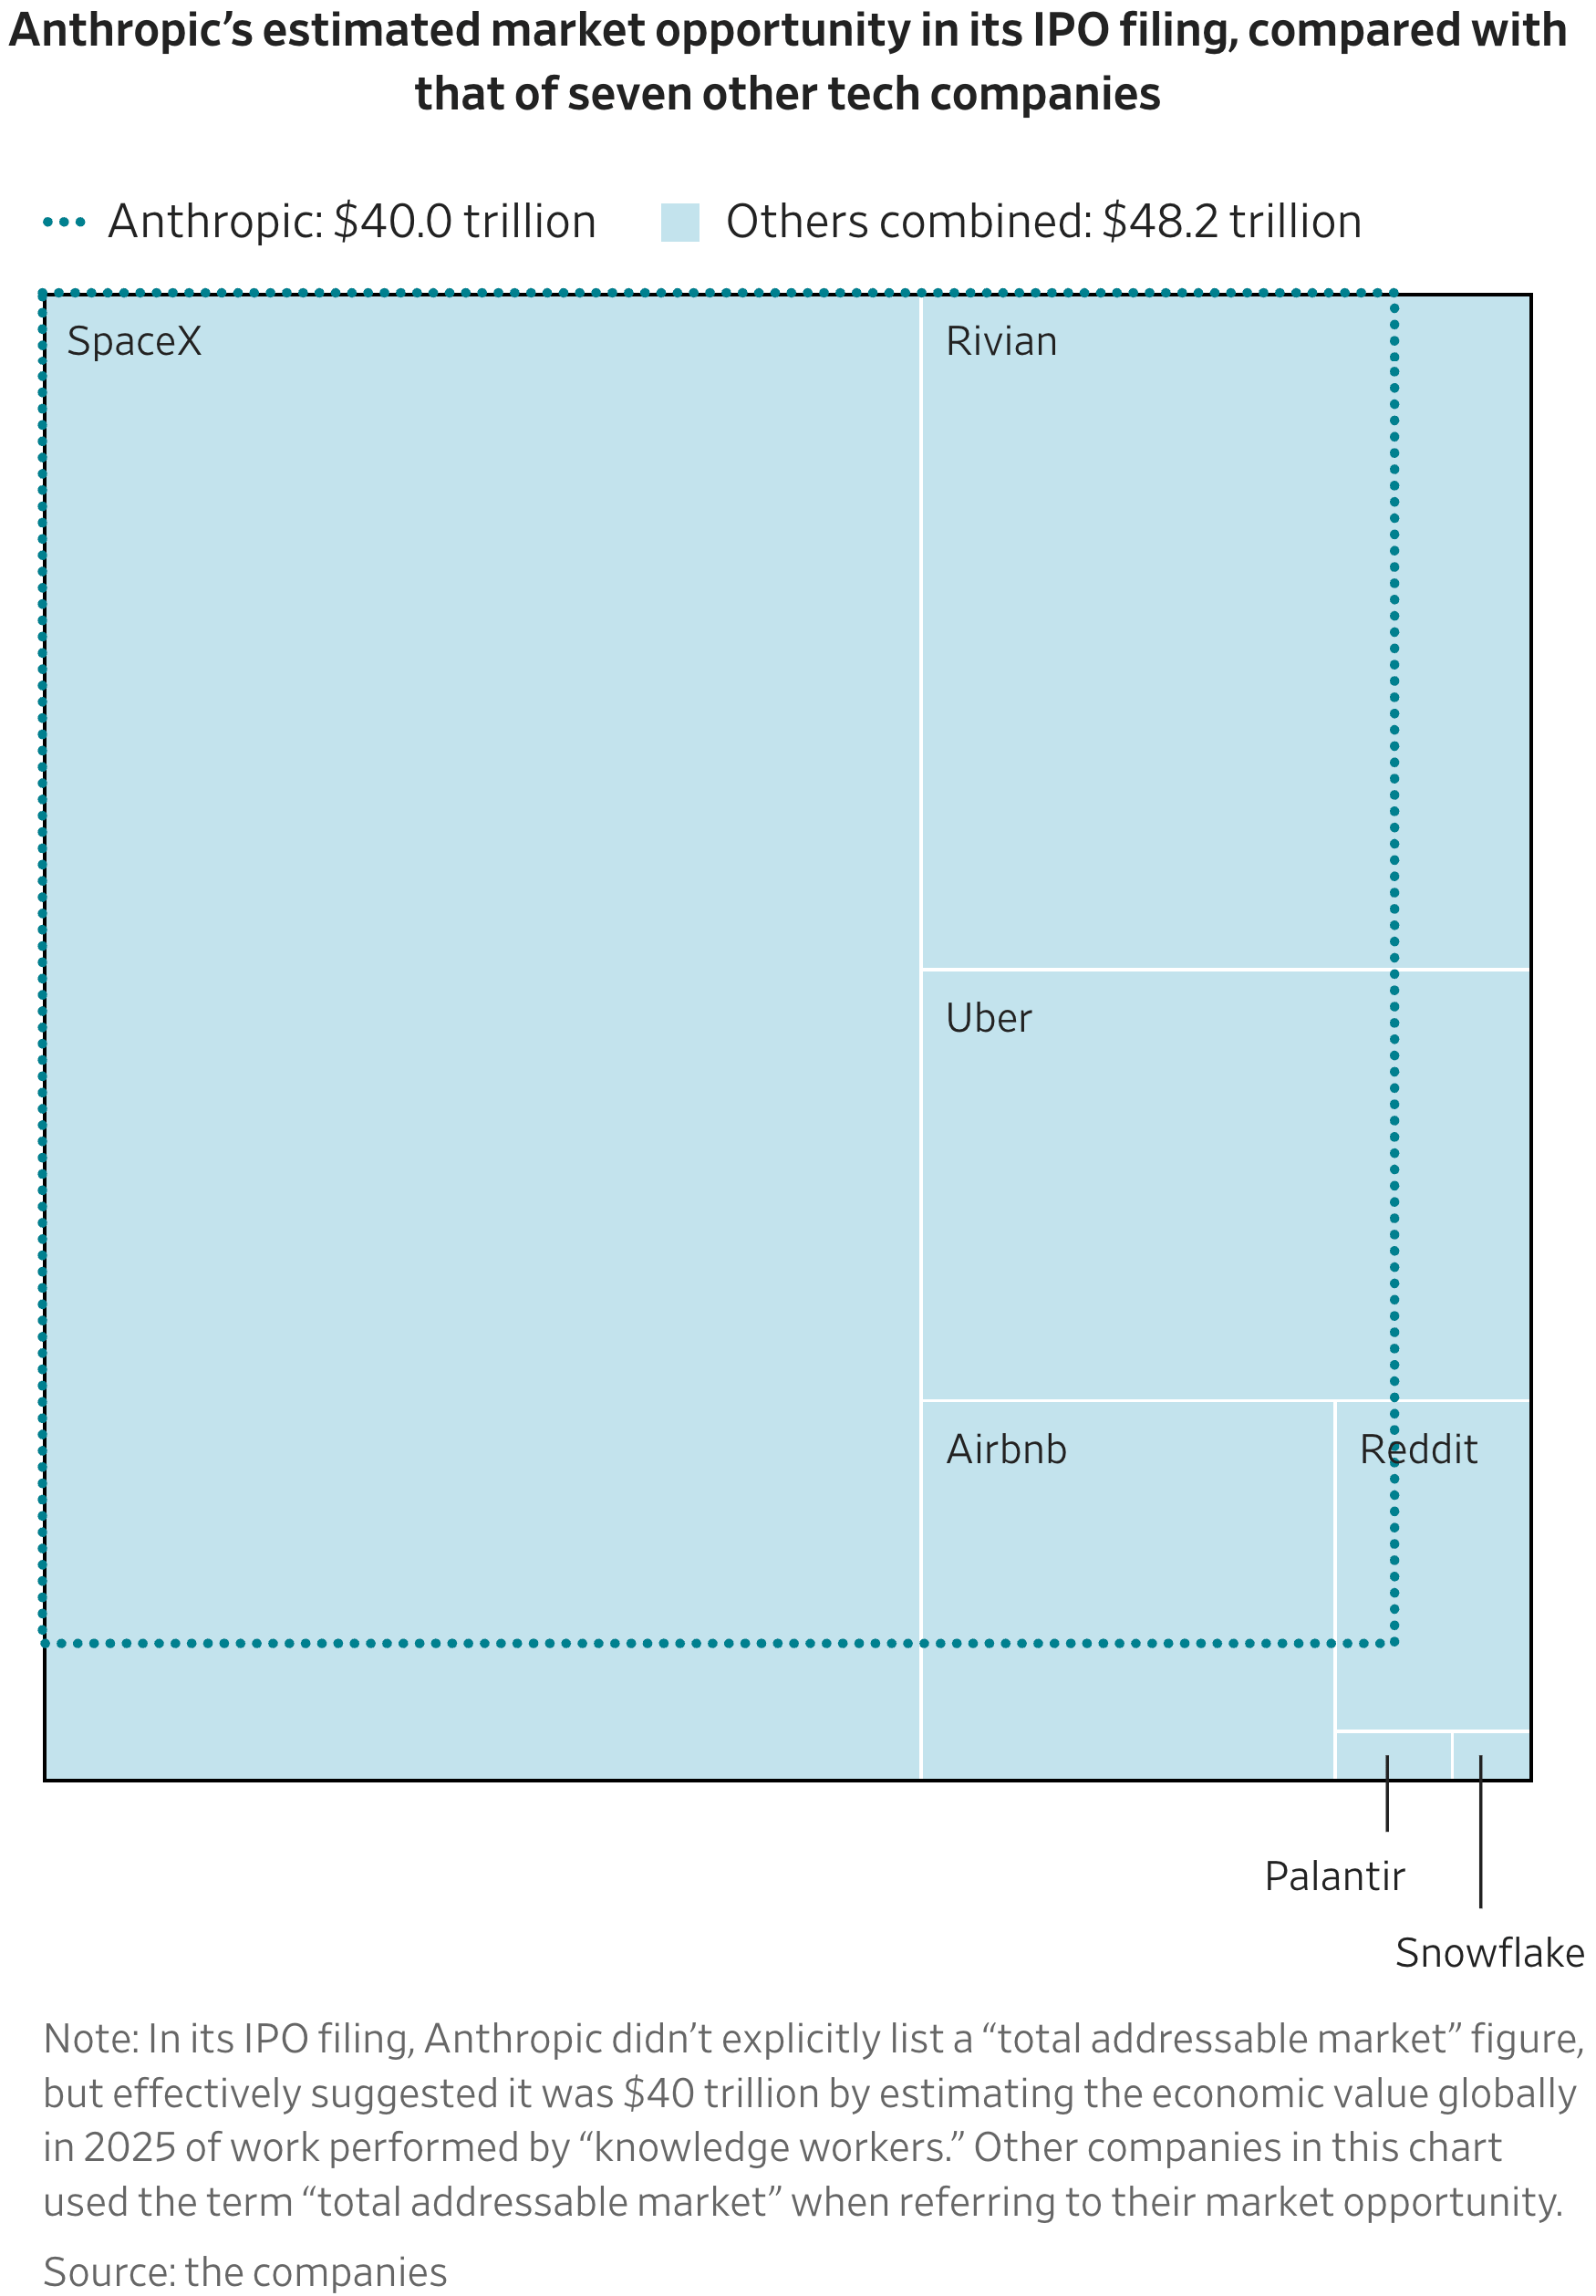
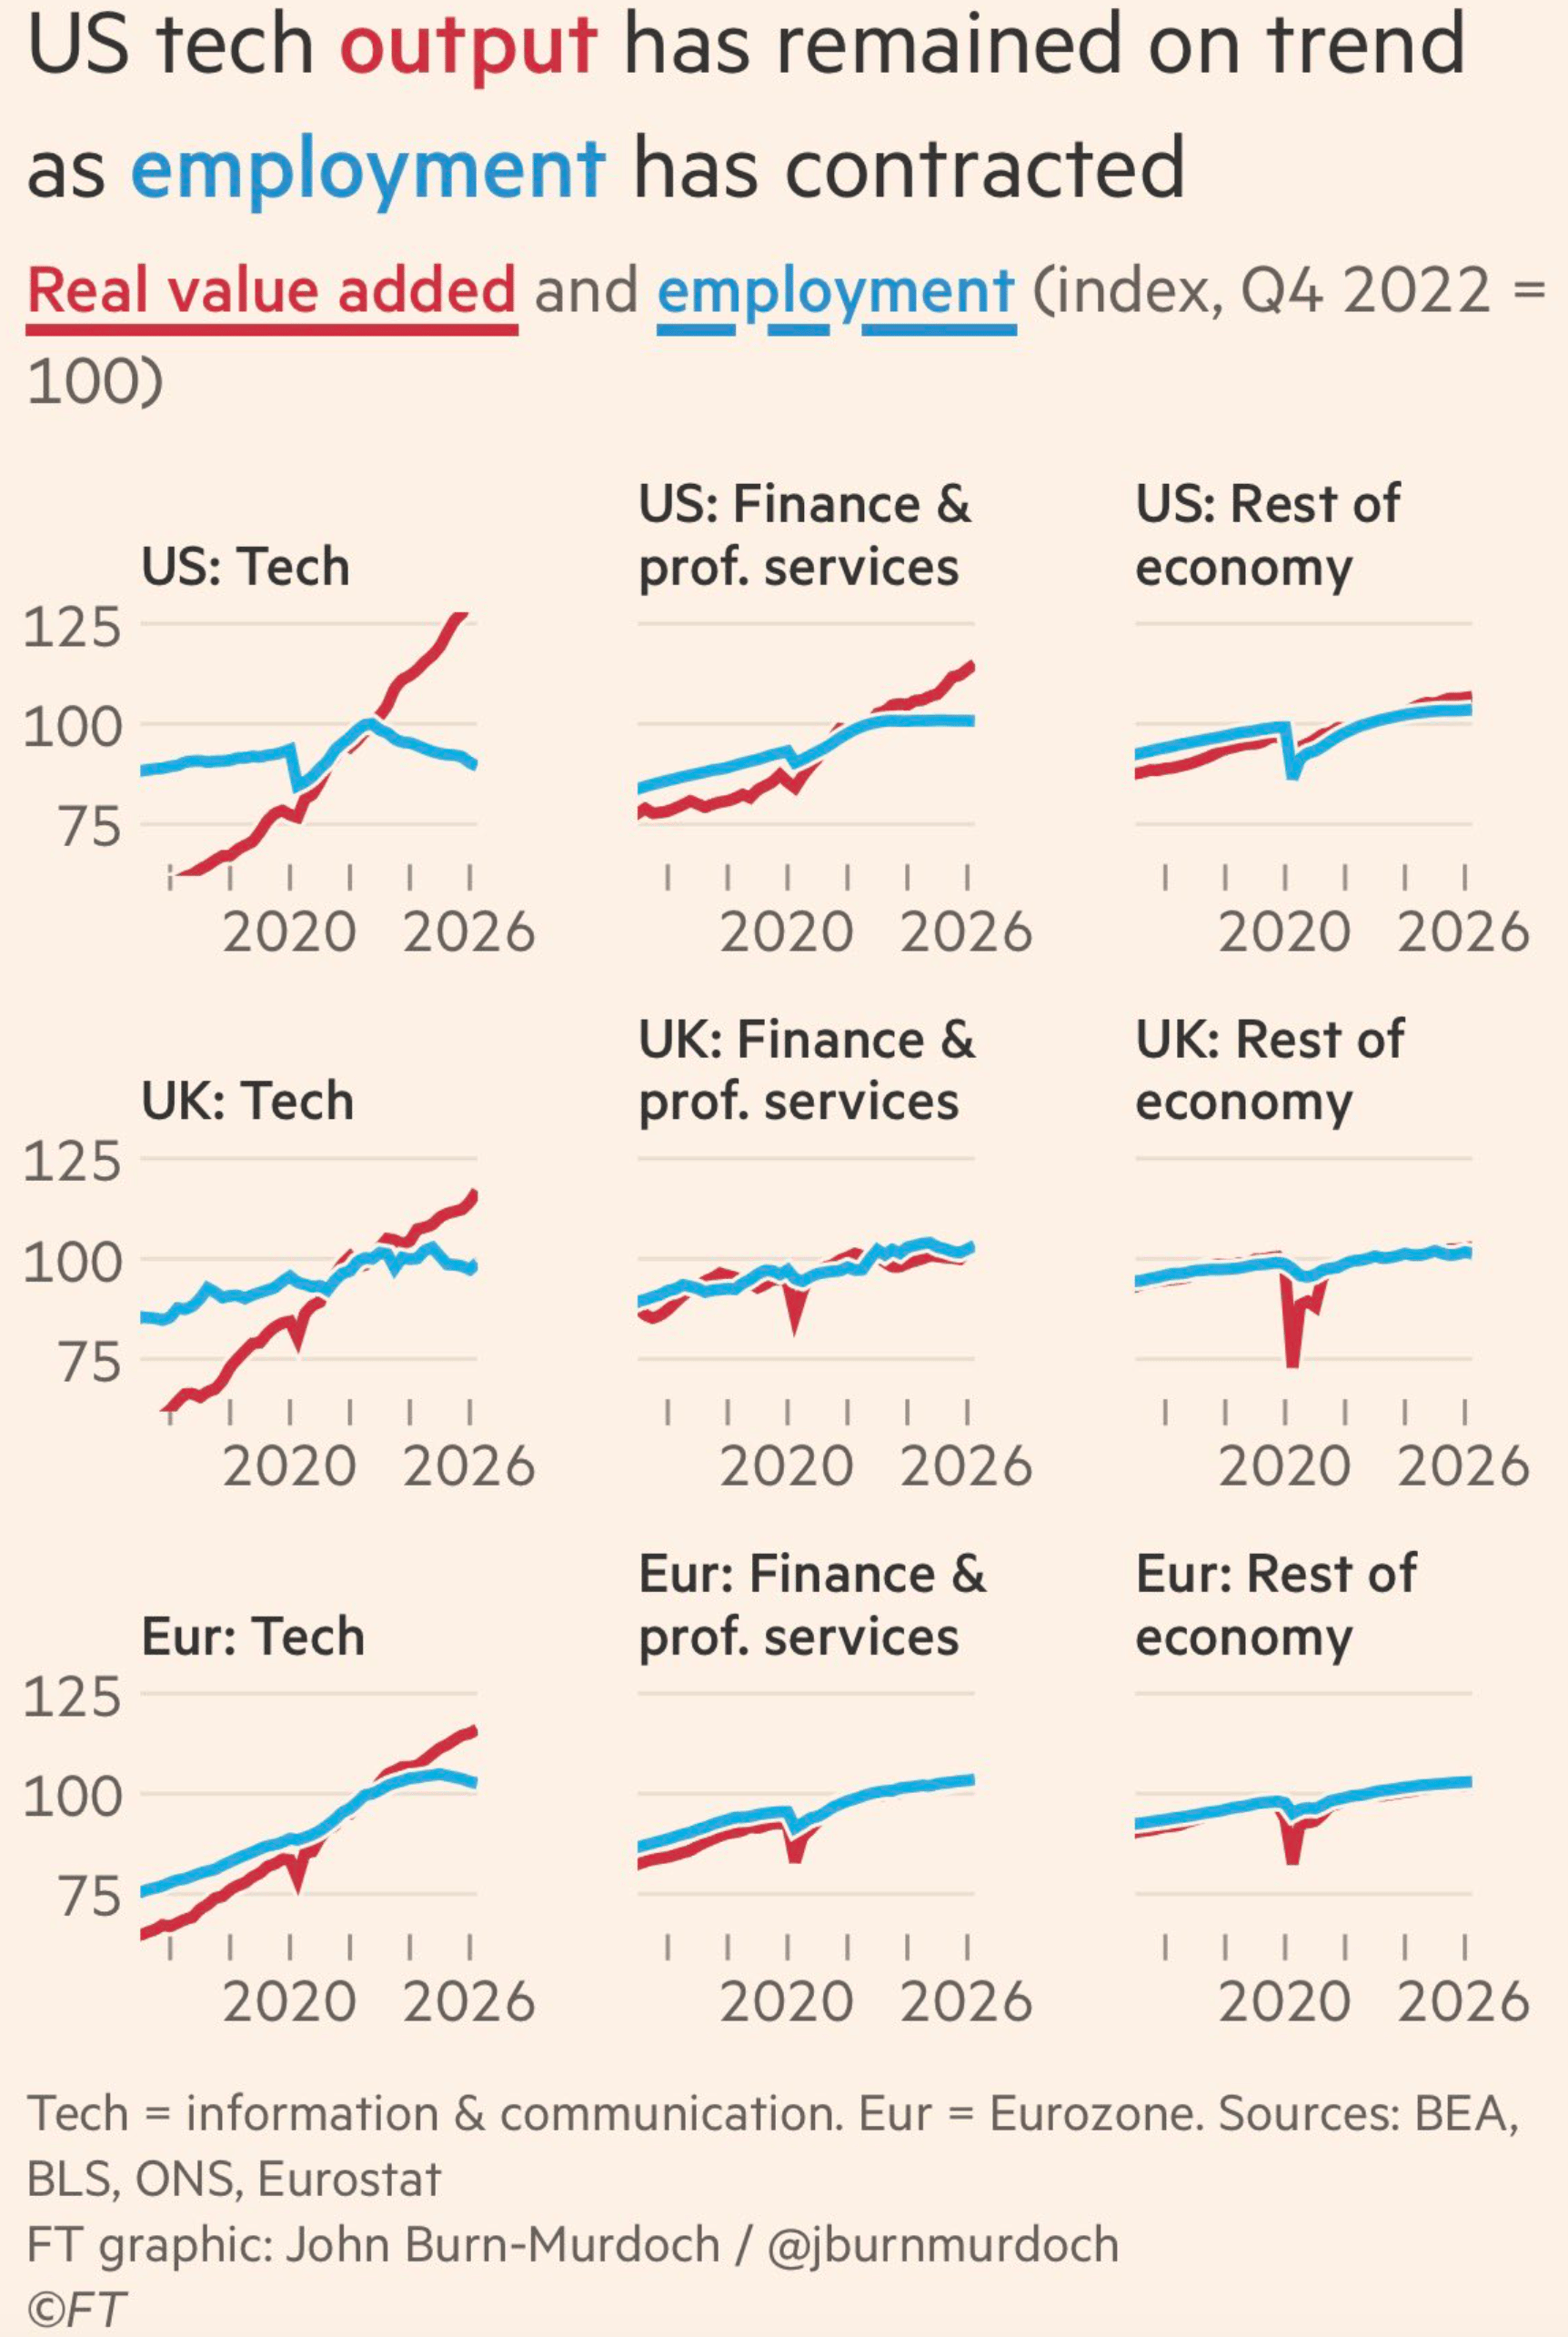
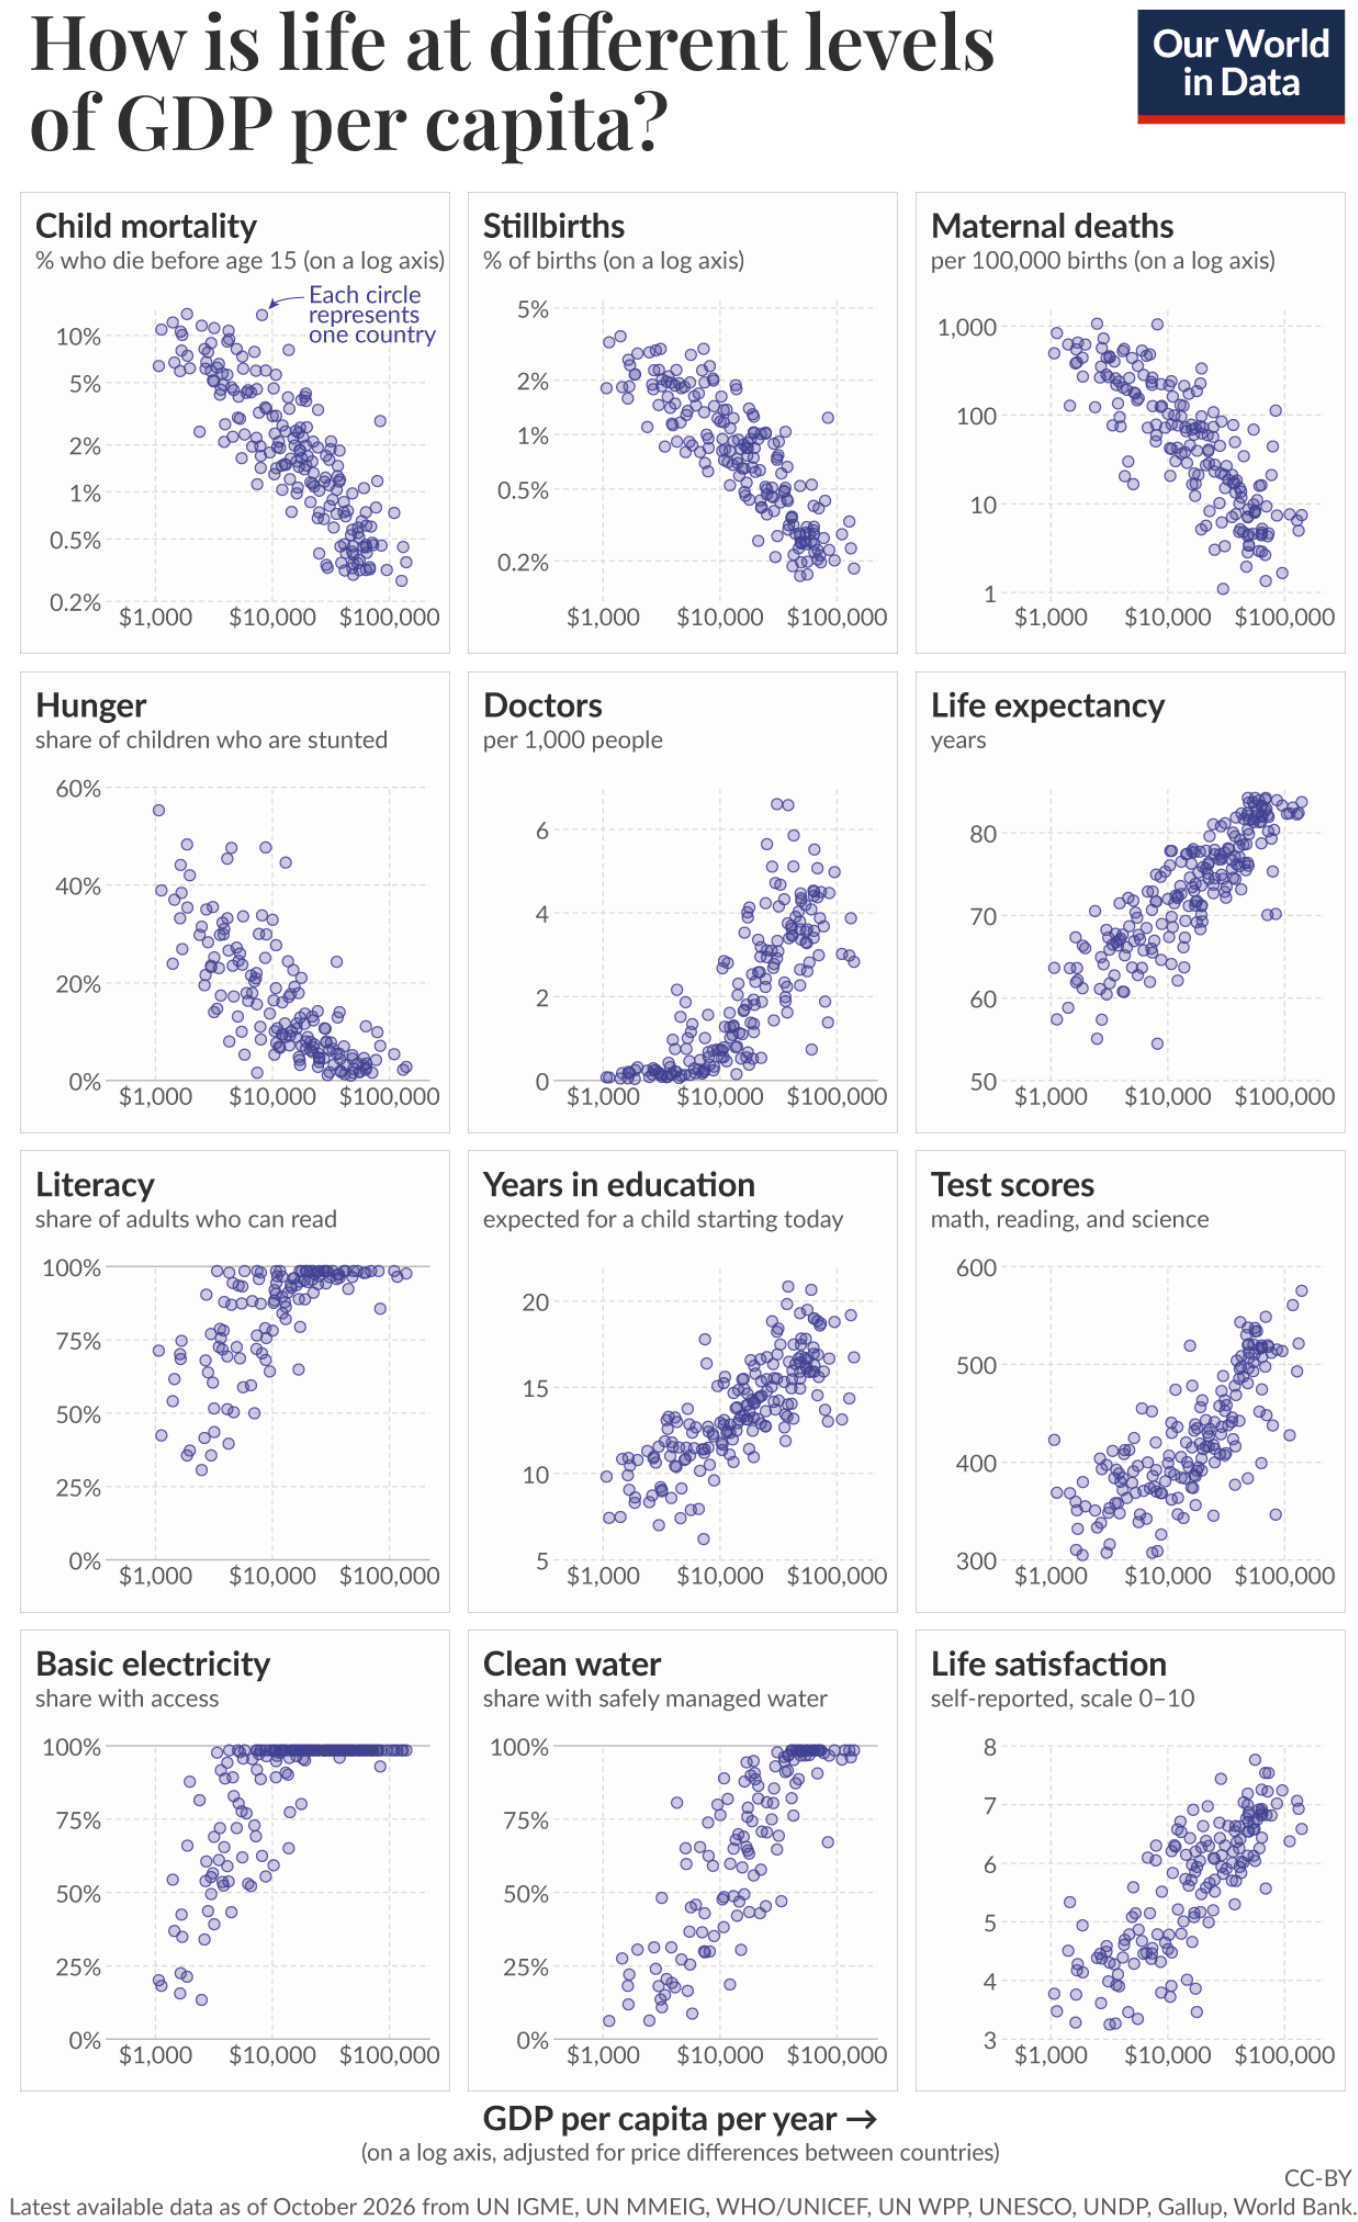
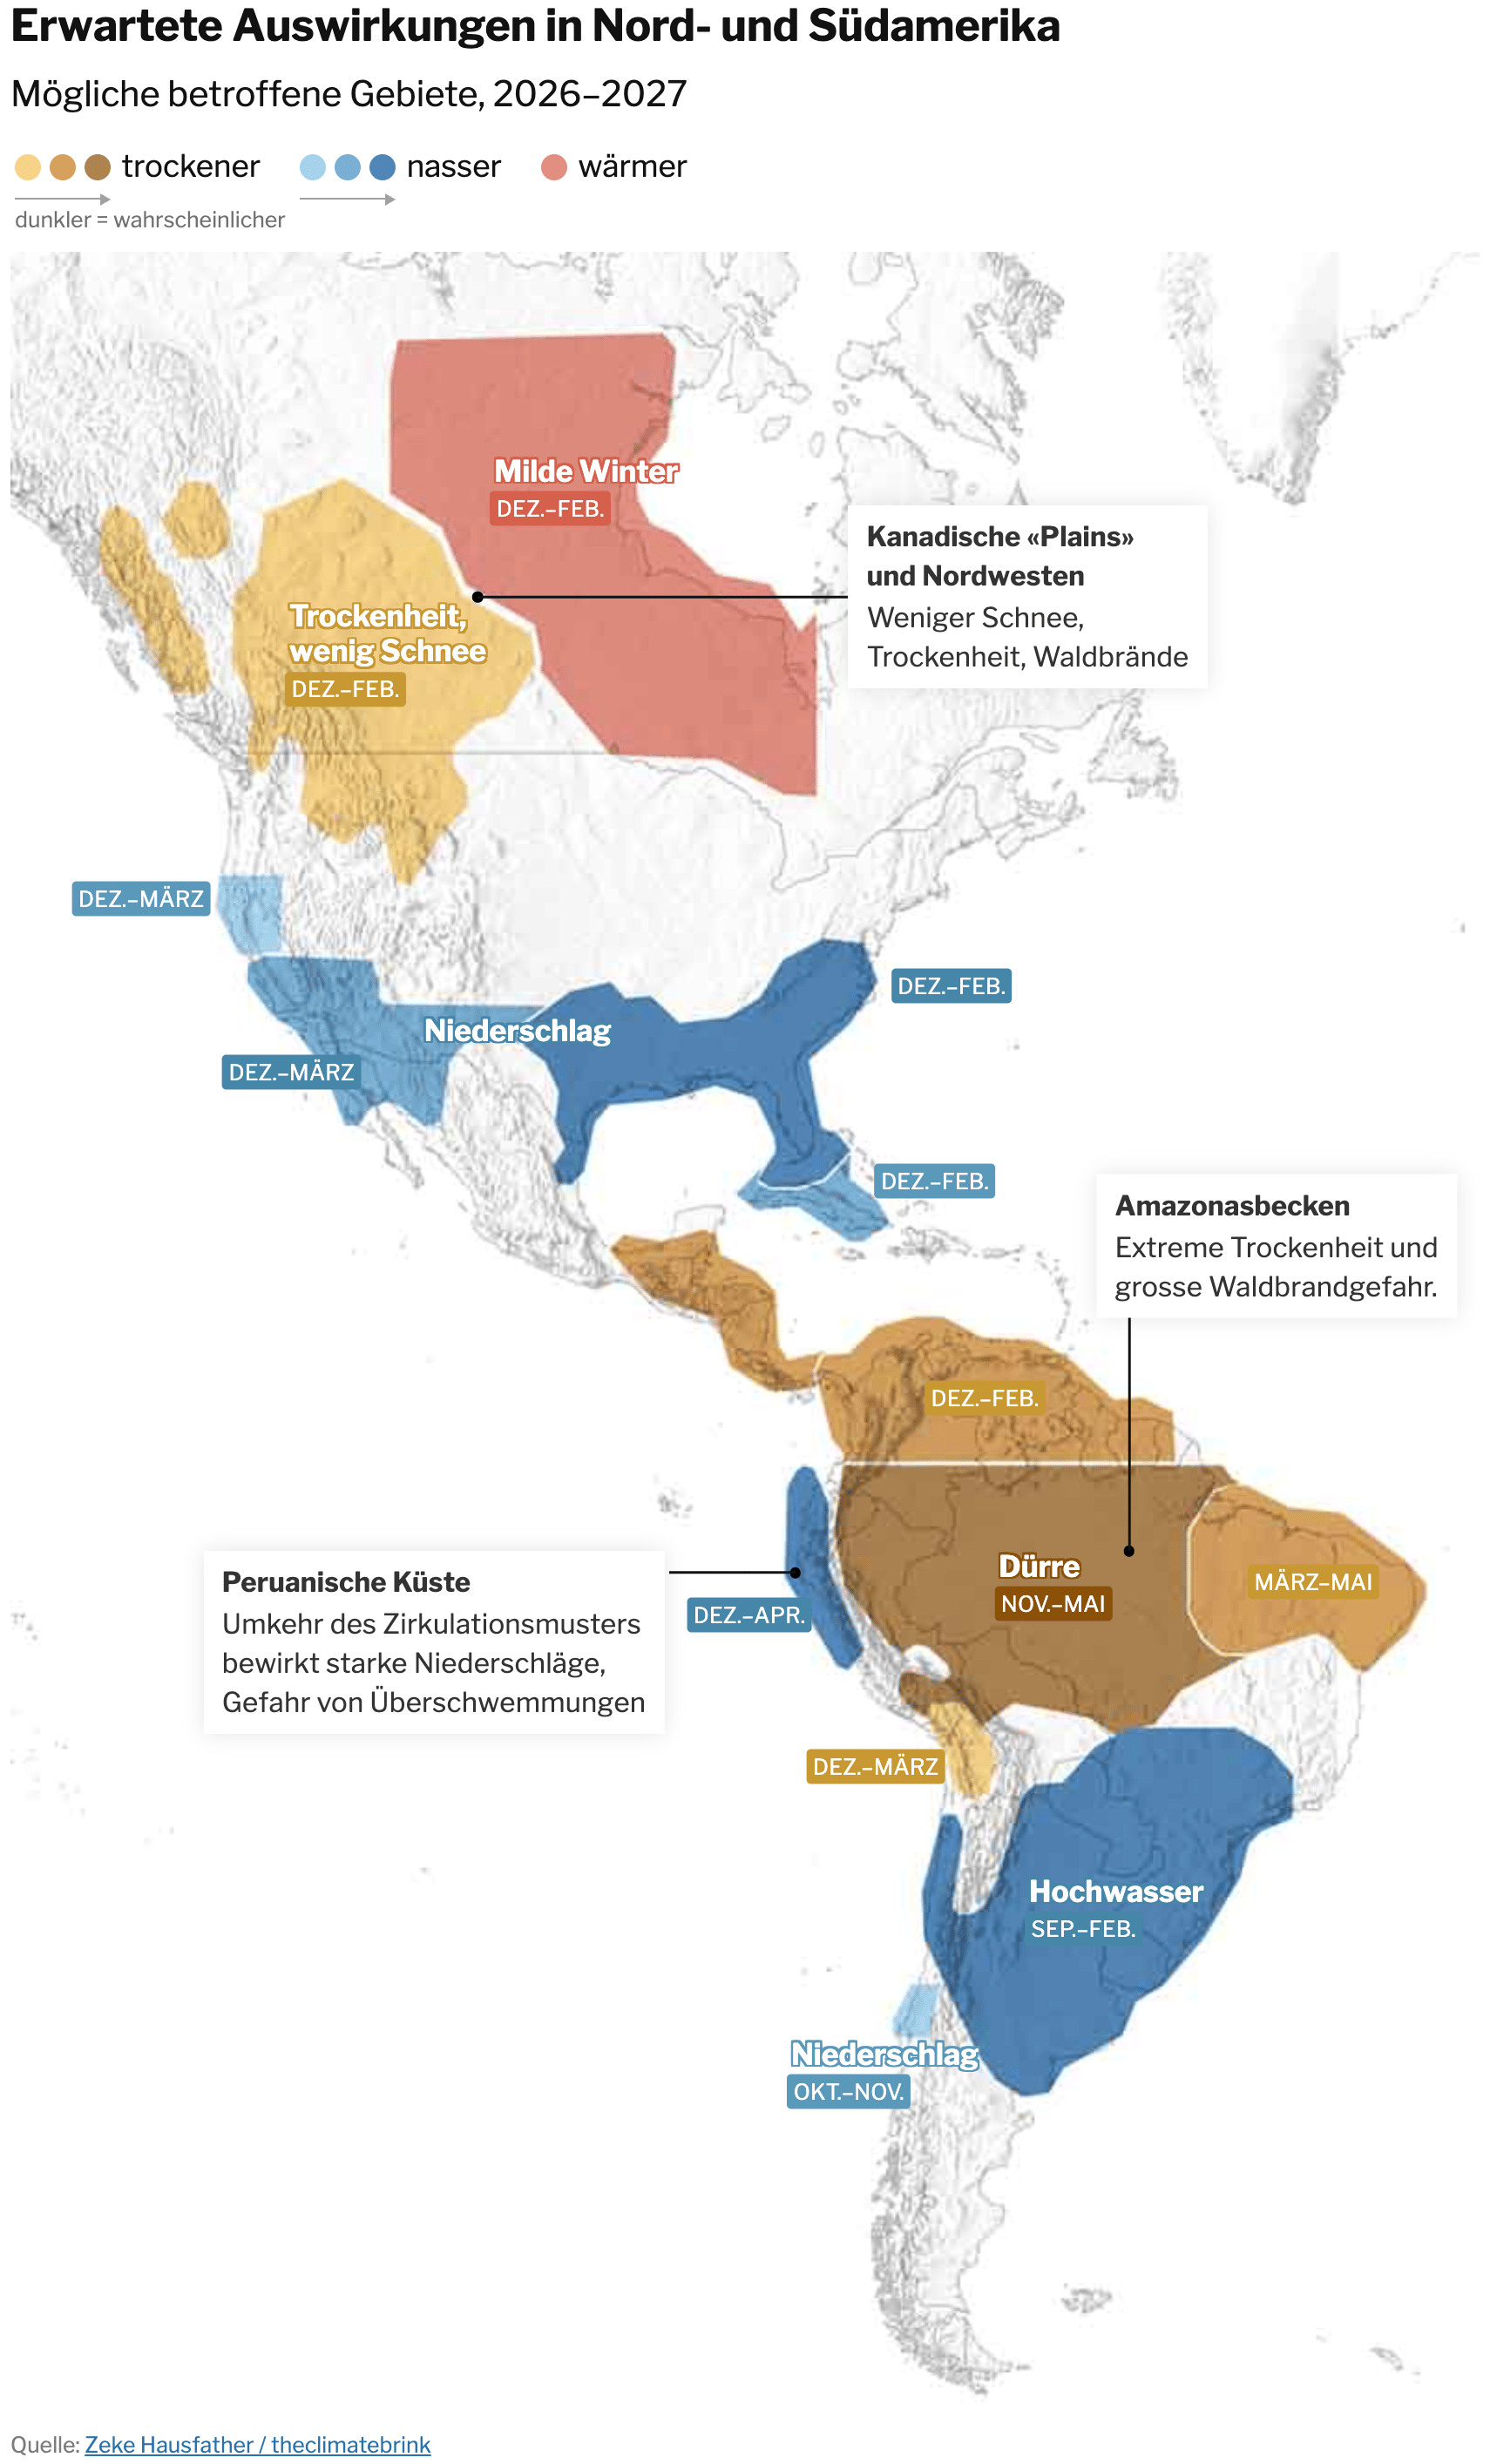
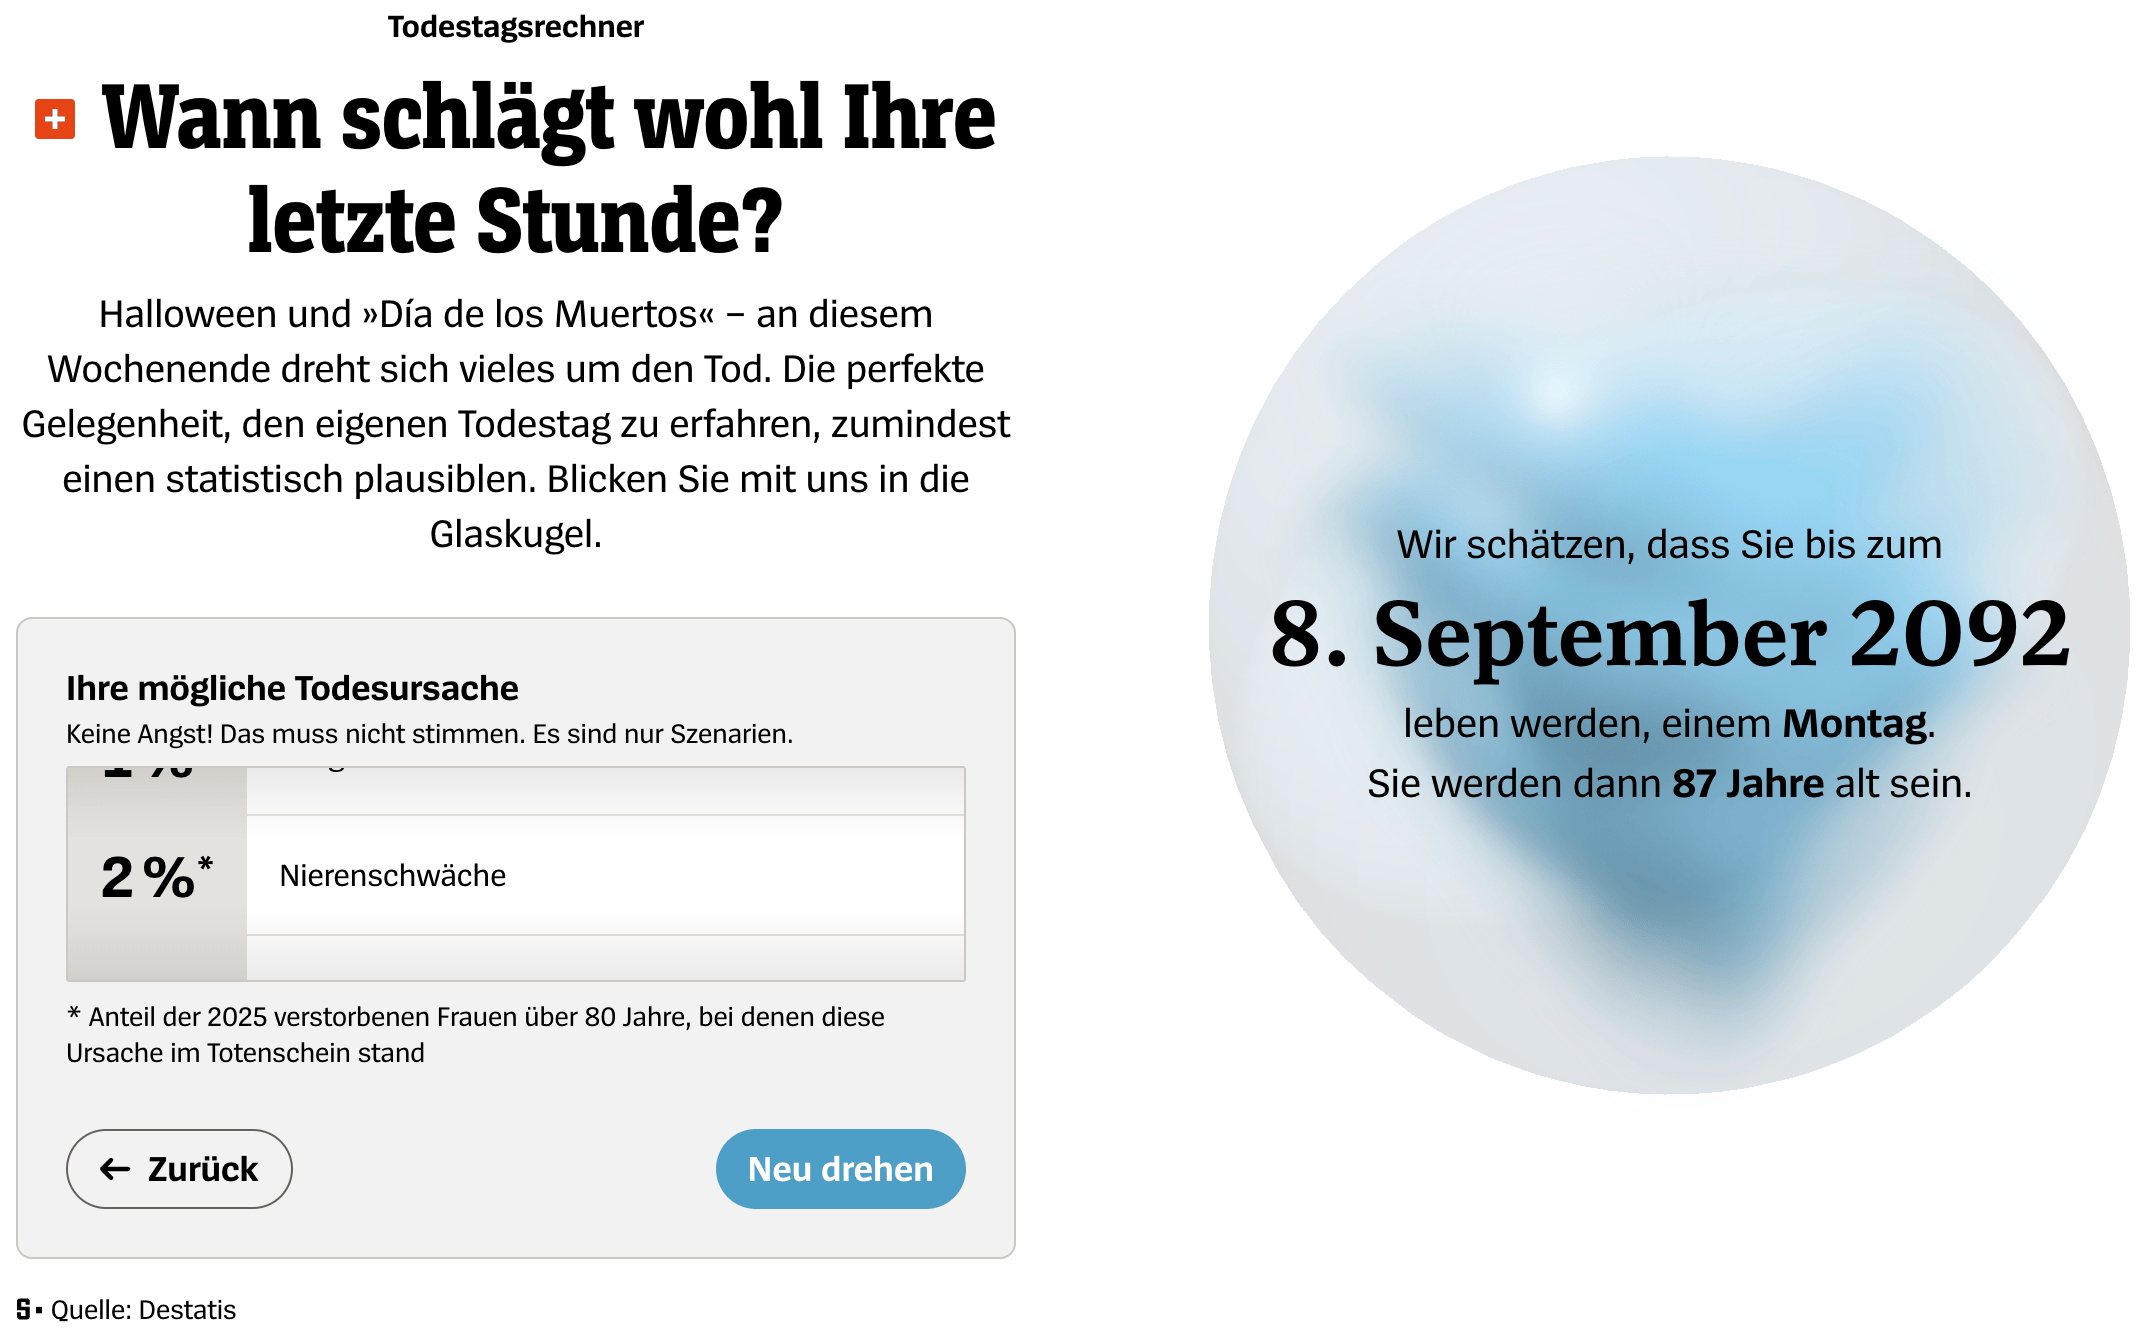
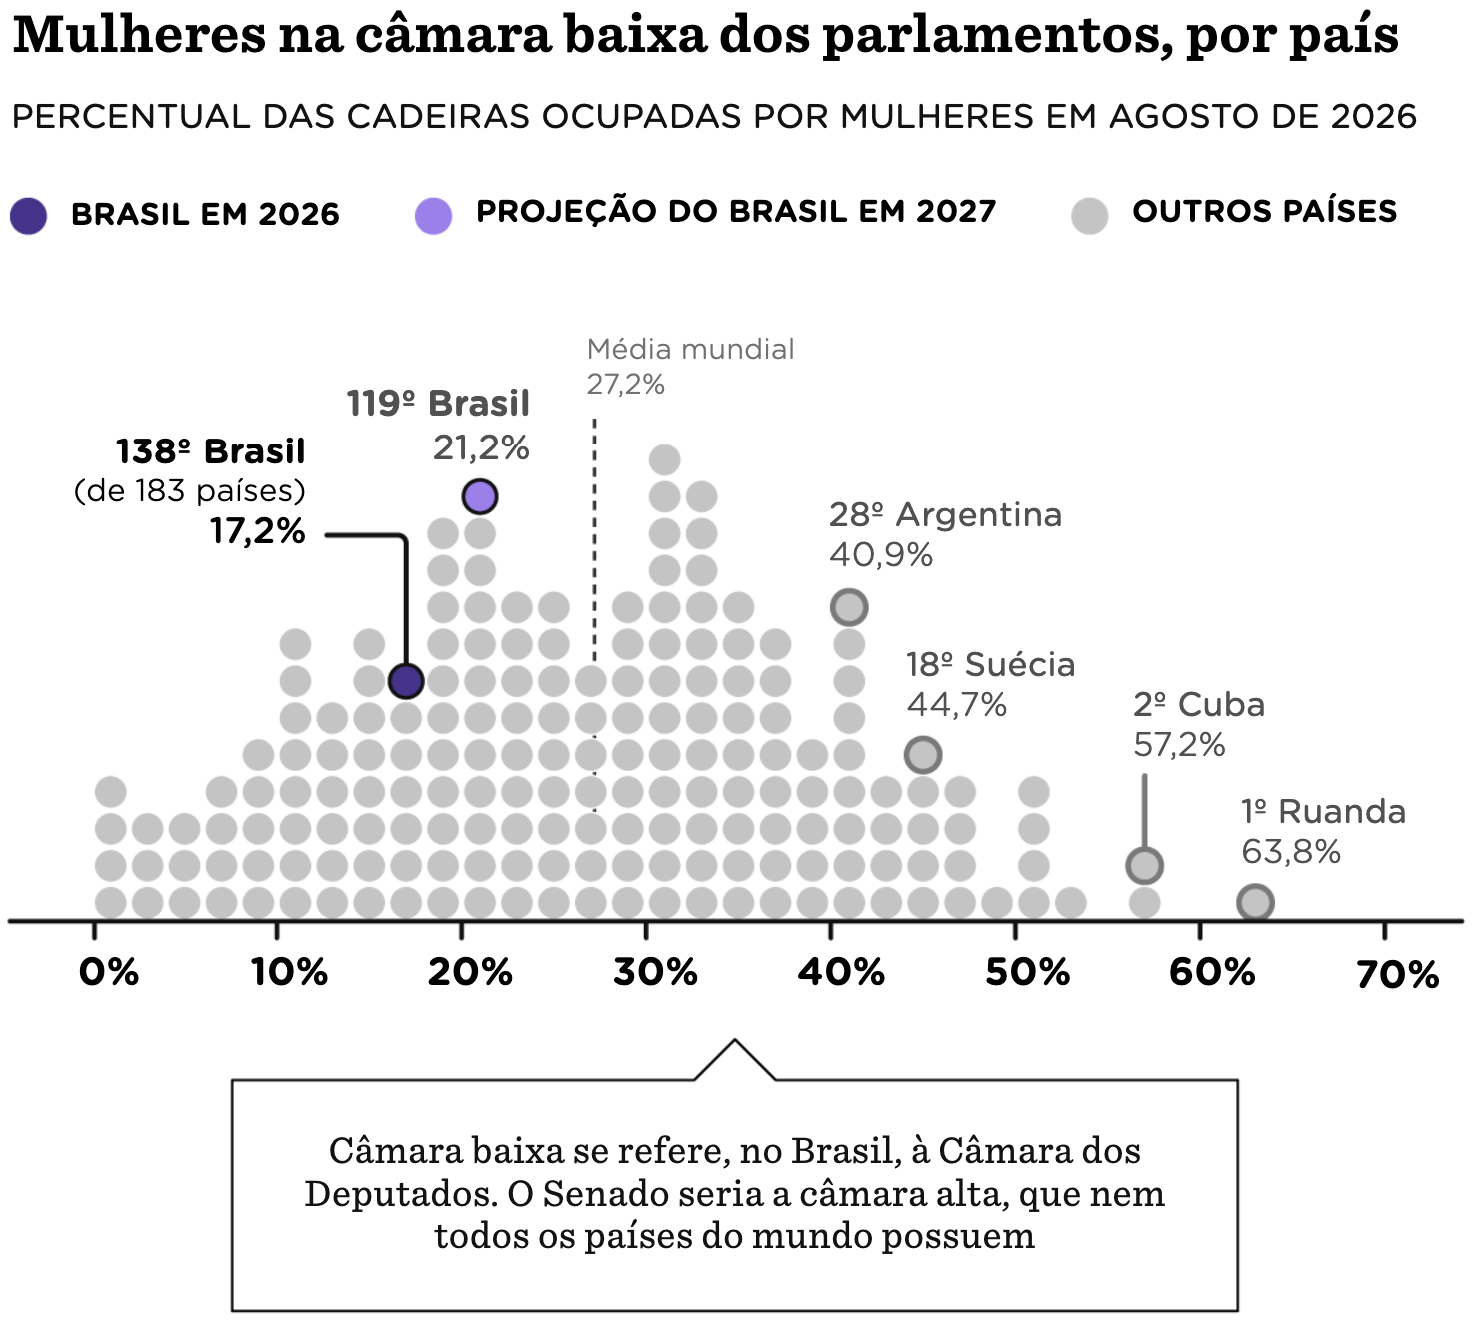
We end this Dispatch with some other interesting topics: Anthropic's $40 trillion market opportunity, output and employment in different industries, life at various GDP per capita levels, Rade de Brest's currents, the expected impacts of El Niño in North and South America, the worst Halloween candies, a death anniversary calculator, and women in the lower house of parliament.

What else we found interesting


Applications are open for…
A video editor at The Economist, New York
A researcher/news assistant at The Economist, Tokyo
A data visualization designer at The New York City Mayor’s Office, Manhattan
A news internship program 2027 at Reuters, Rio de Janeiro
Help us make the Data Vis Dispatch better! Let us know which newsletters, blogs, or social media accounts we should follow to learn about interesting projects, especially from less-covered parts of the world (Asia, South America, Africa). And if you’ve published something new in the last week, we’d love to see it. Write to us at blog@datawrapper.de. (Please note that we don't have the capacity to respond to obviously AI-generated requests.) Want to make sure you never miss a Dispatch? Sign up for our Data Vis Dispatch newsletter.


