Data Vis Dispatch, November 11: Mayoral election in New York City, deforestation, and chess

Welcome back to the 218th edition of Data Vis Dispatch! Every week, we’ll be publishing a collection of the best small and large data visualizations we find, especially from news organizations — to celebrate data journalism, data visualization, simple charts, elaborate maps, and their creators.
Recurring topics this week include the mayoral election in New York City, deforestation in the Amazon rainforest, and chess openings.
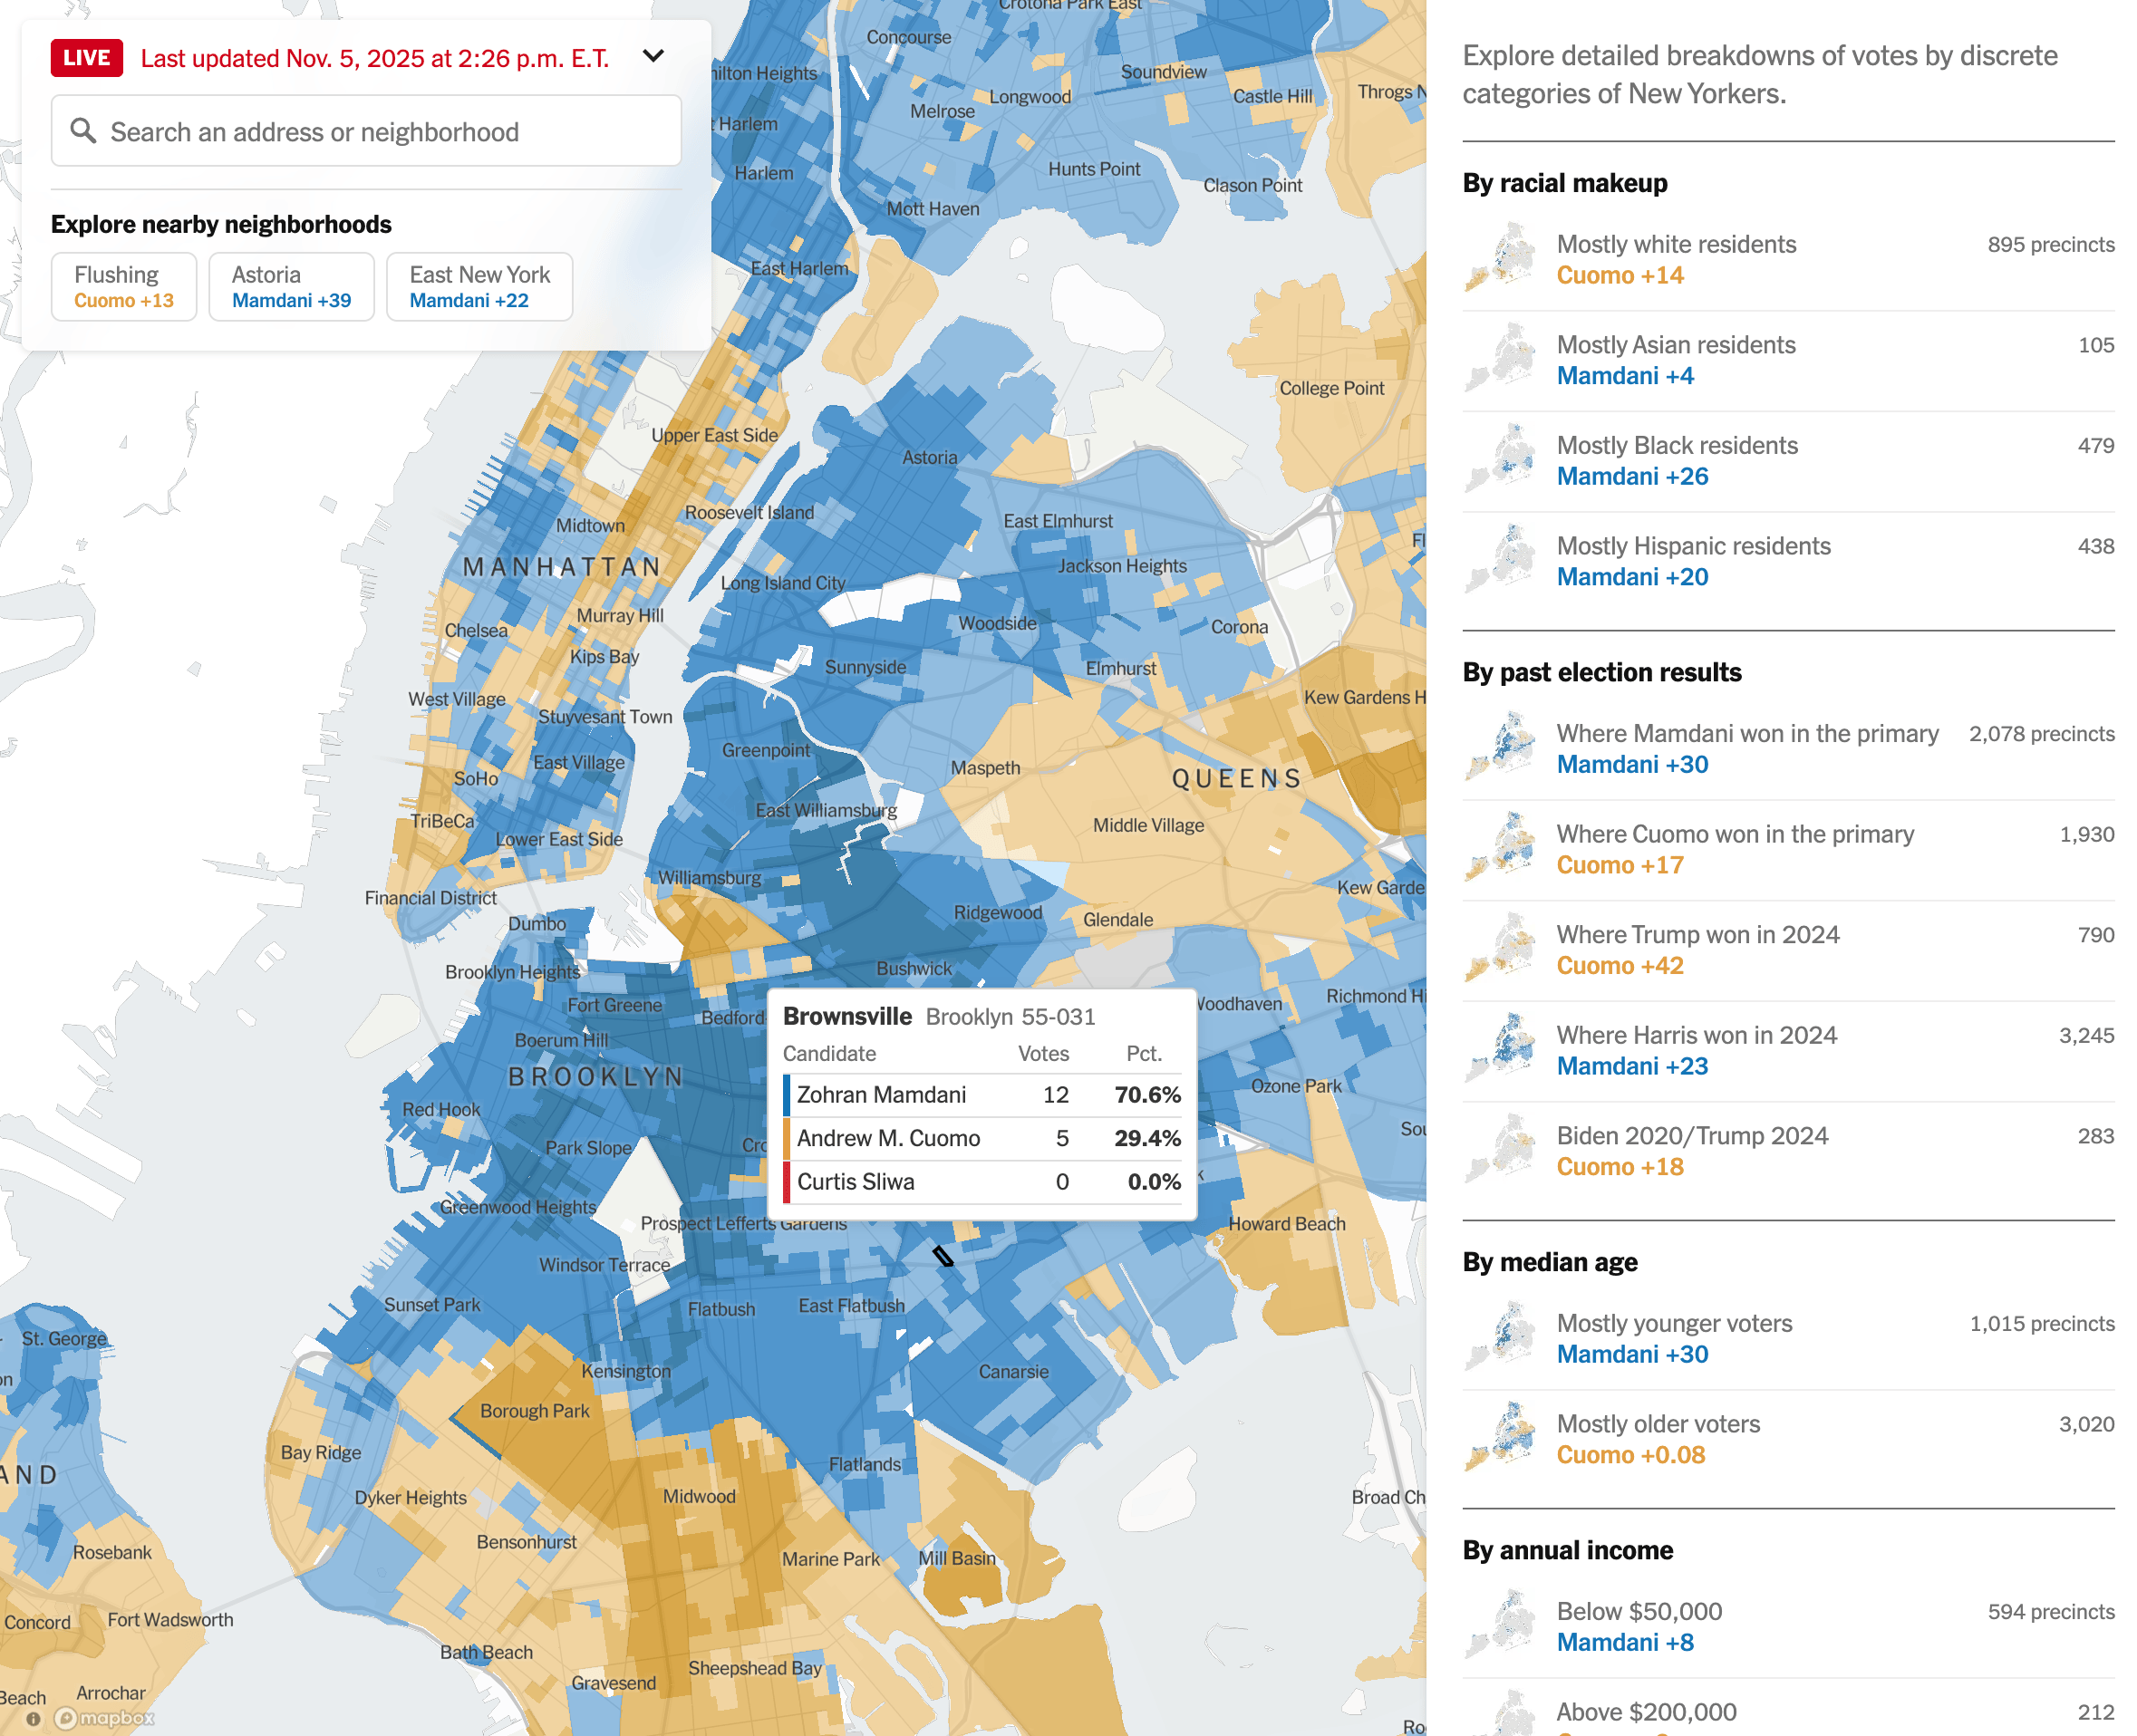
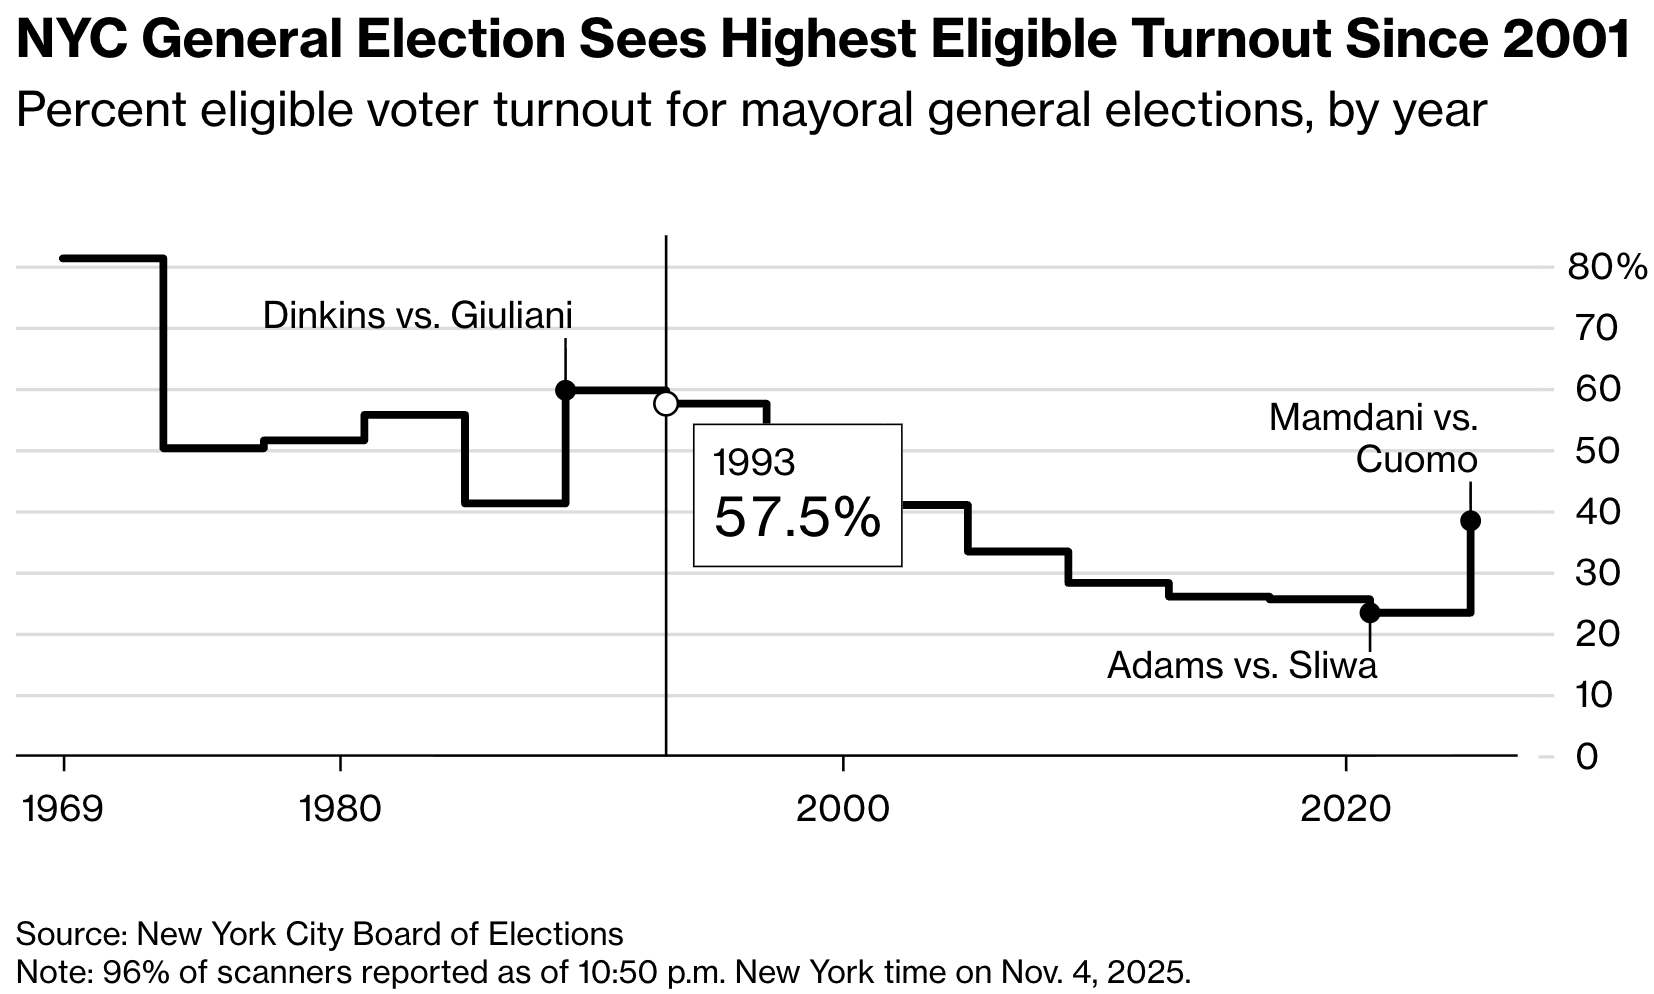
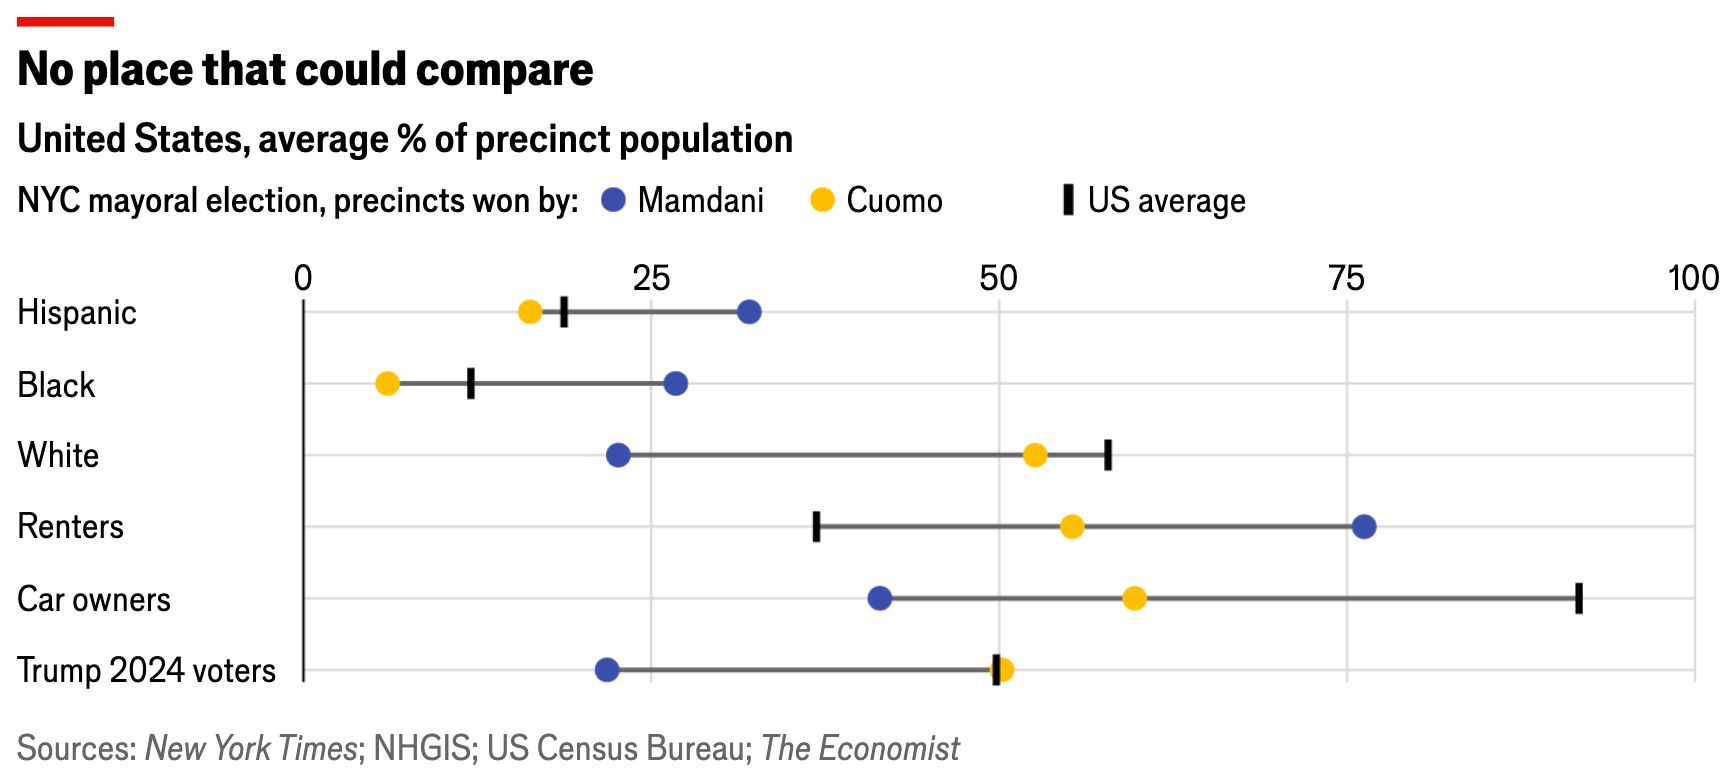
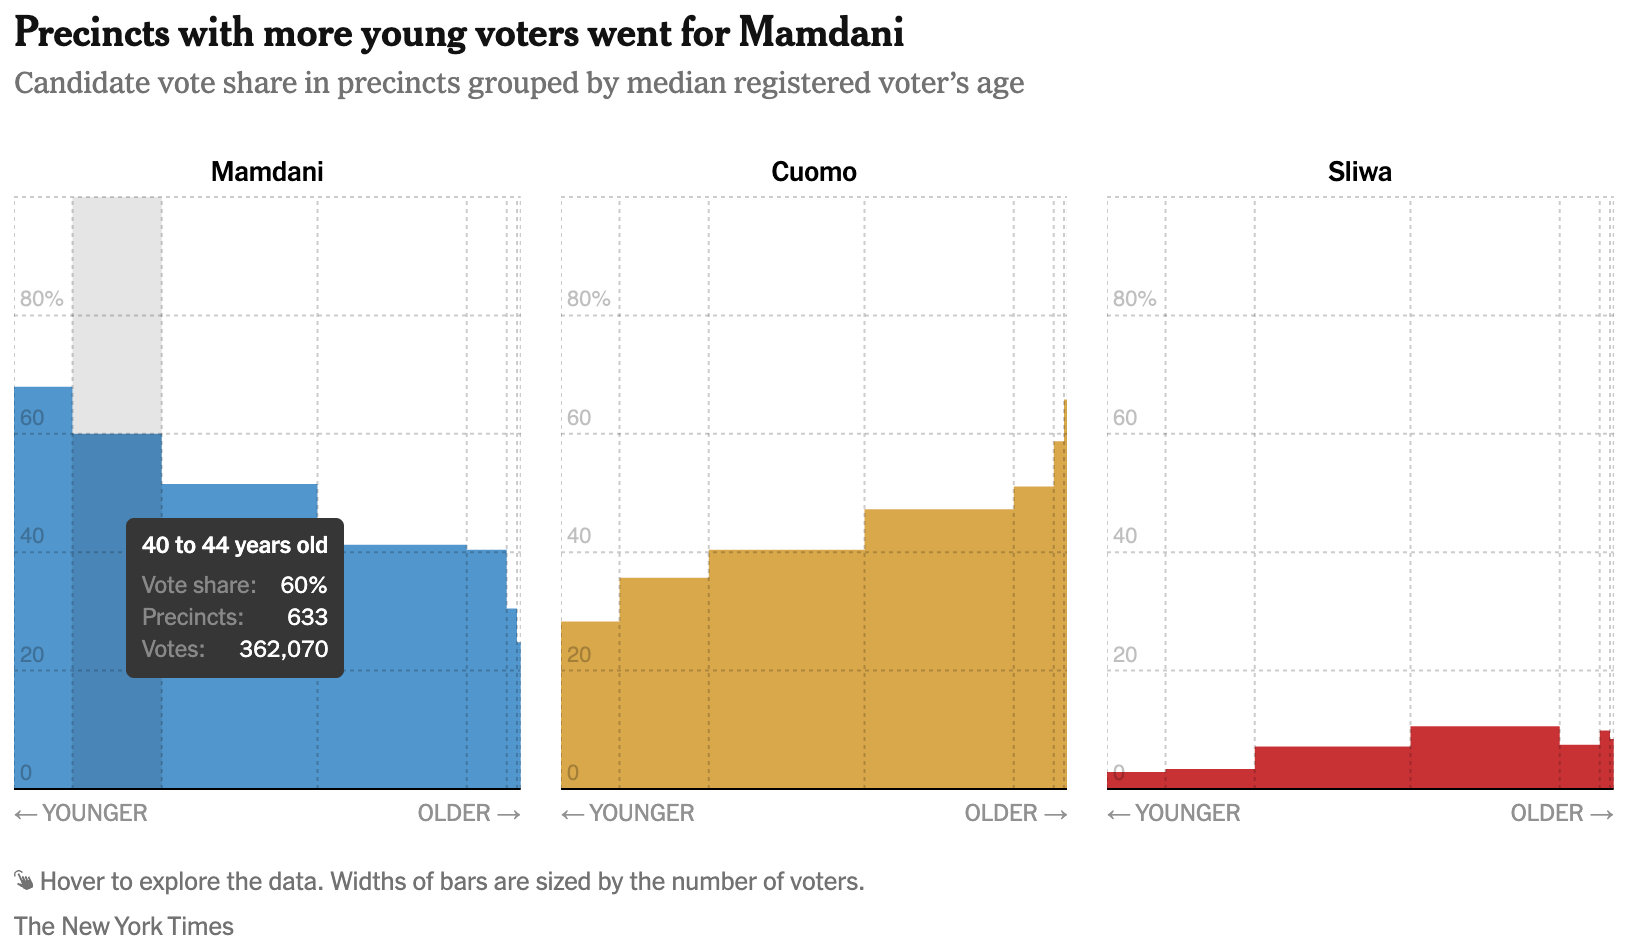
Last week, people around the world had their eyes on the mayoral election in New York City and its winner, Democrat Zohran Mamdani. Take a look at electoral maps, voter turnout, and an analysis of the groups that voted for him:
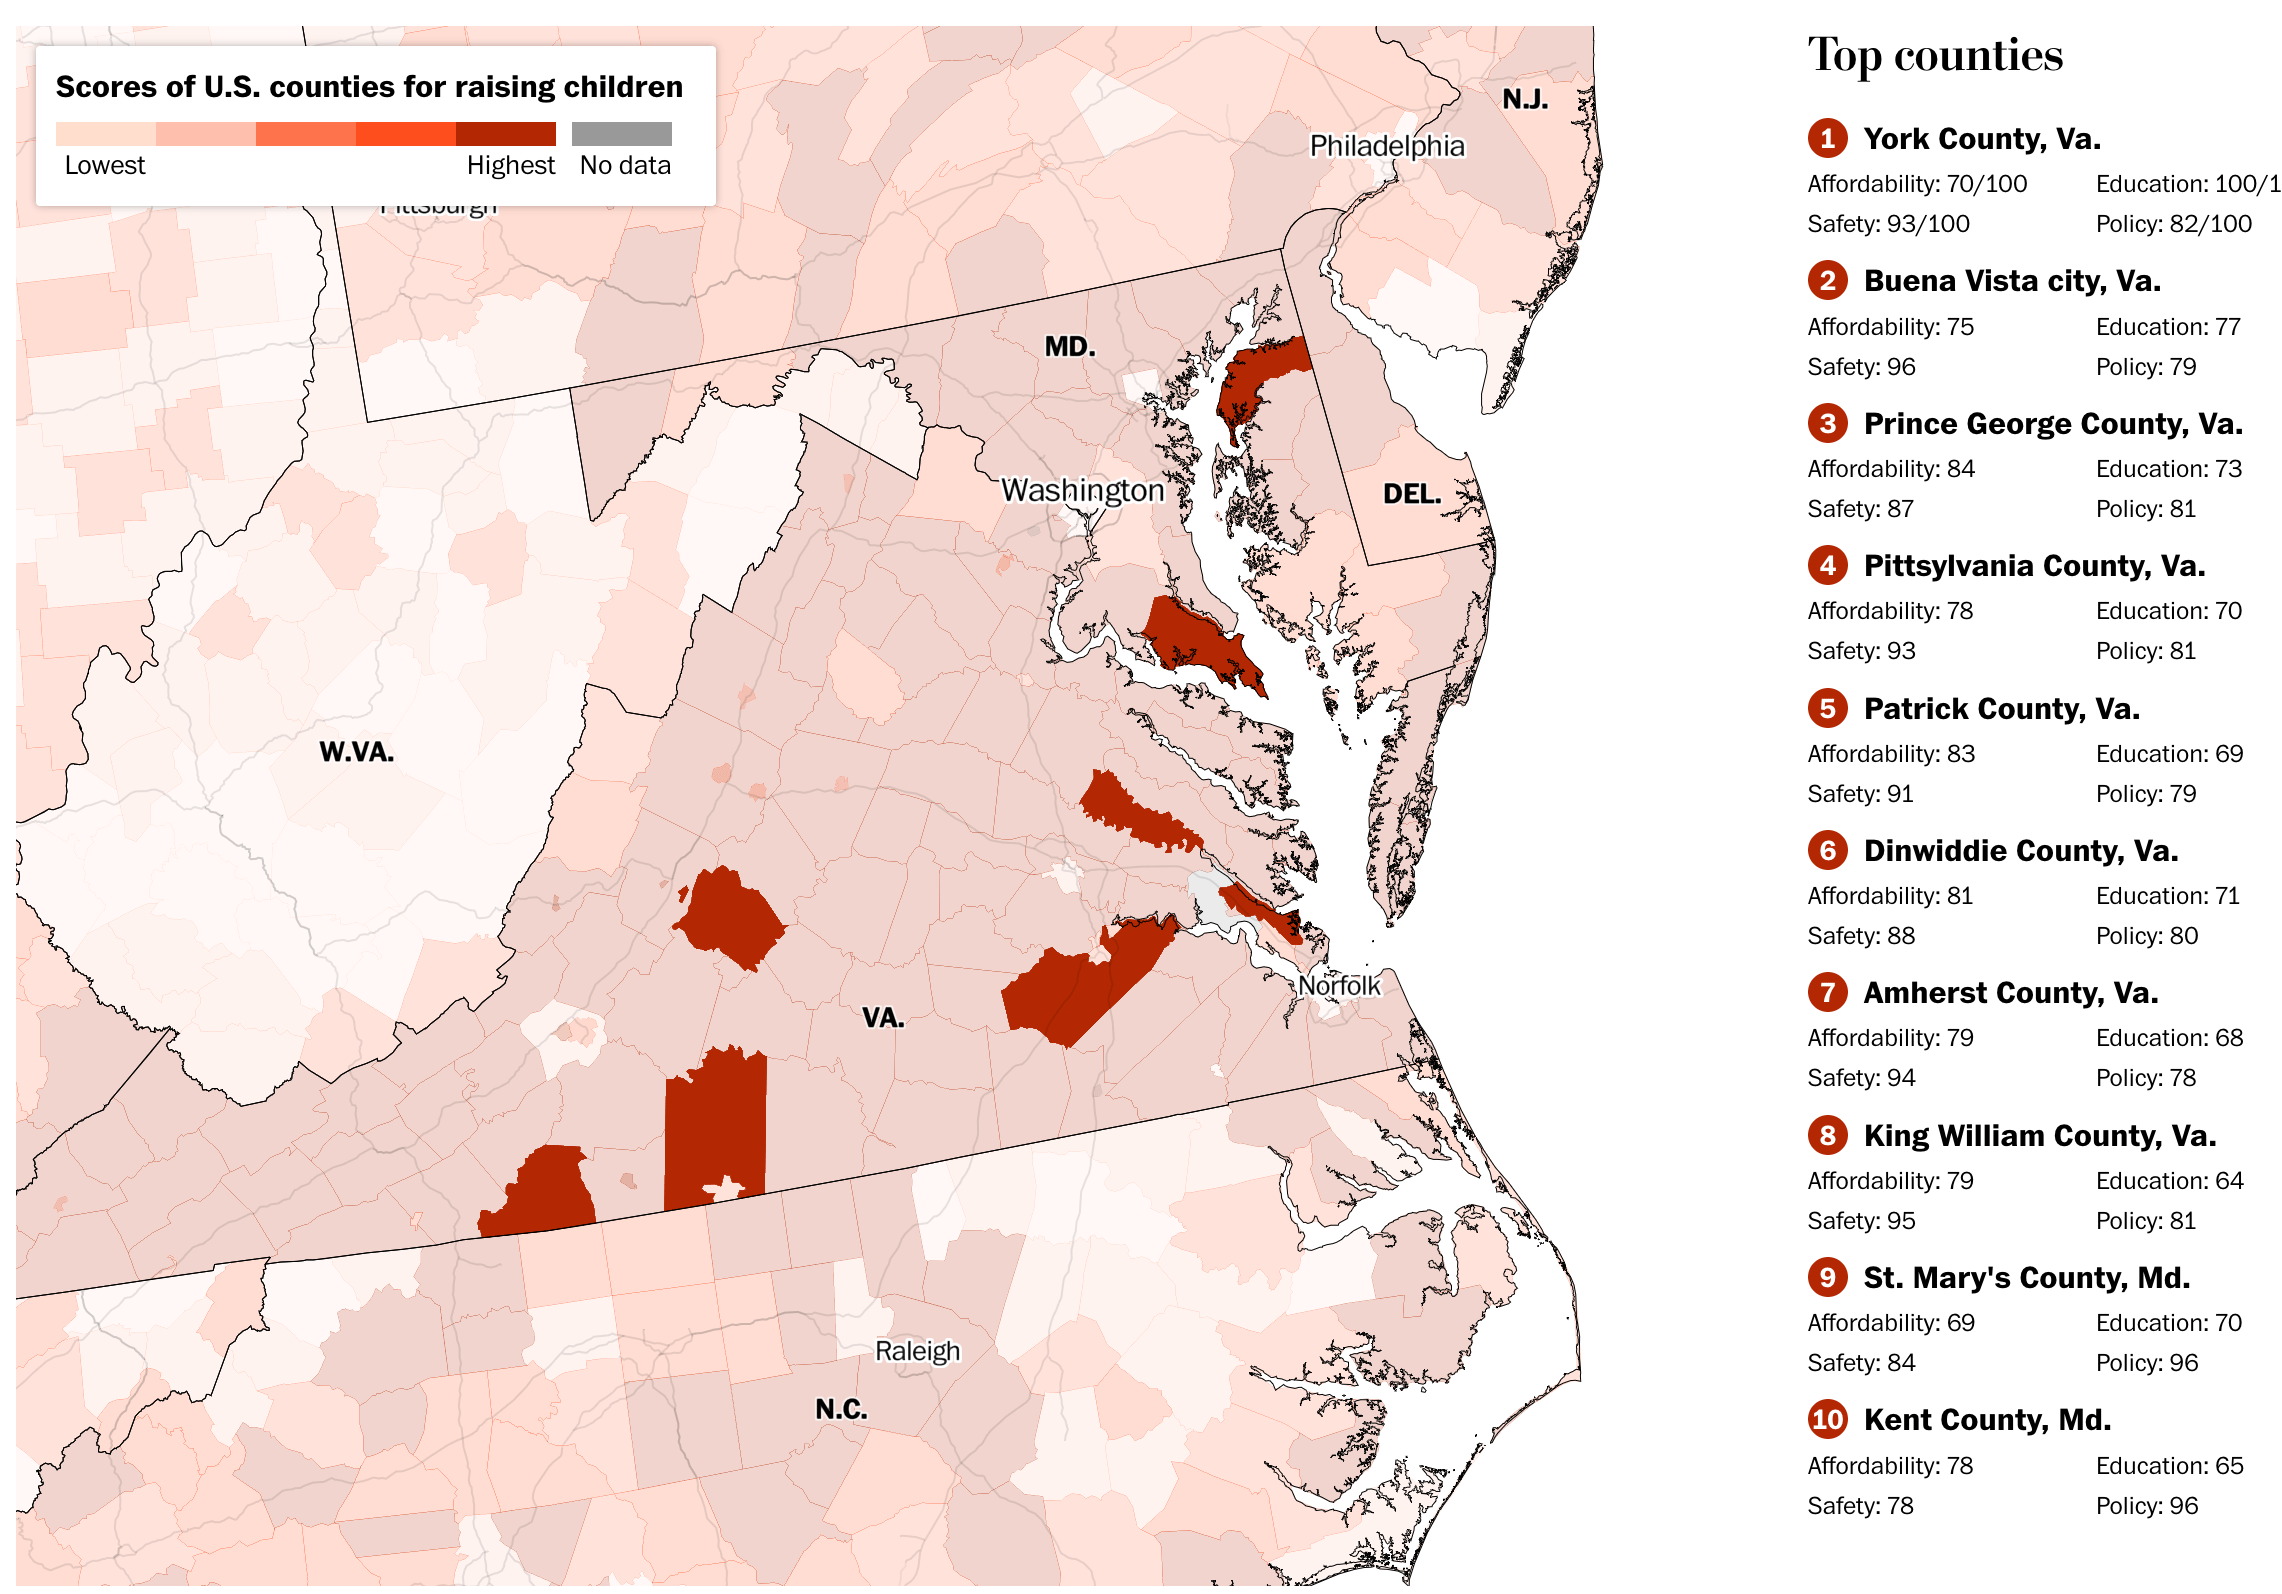
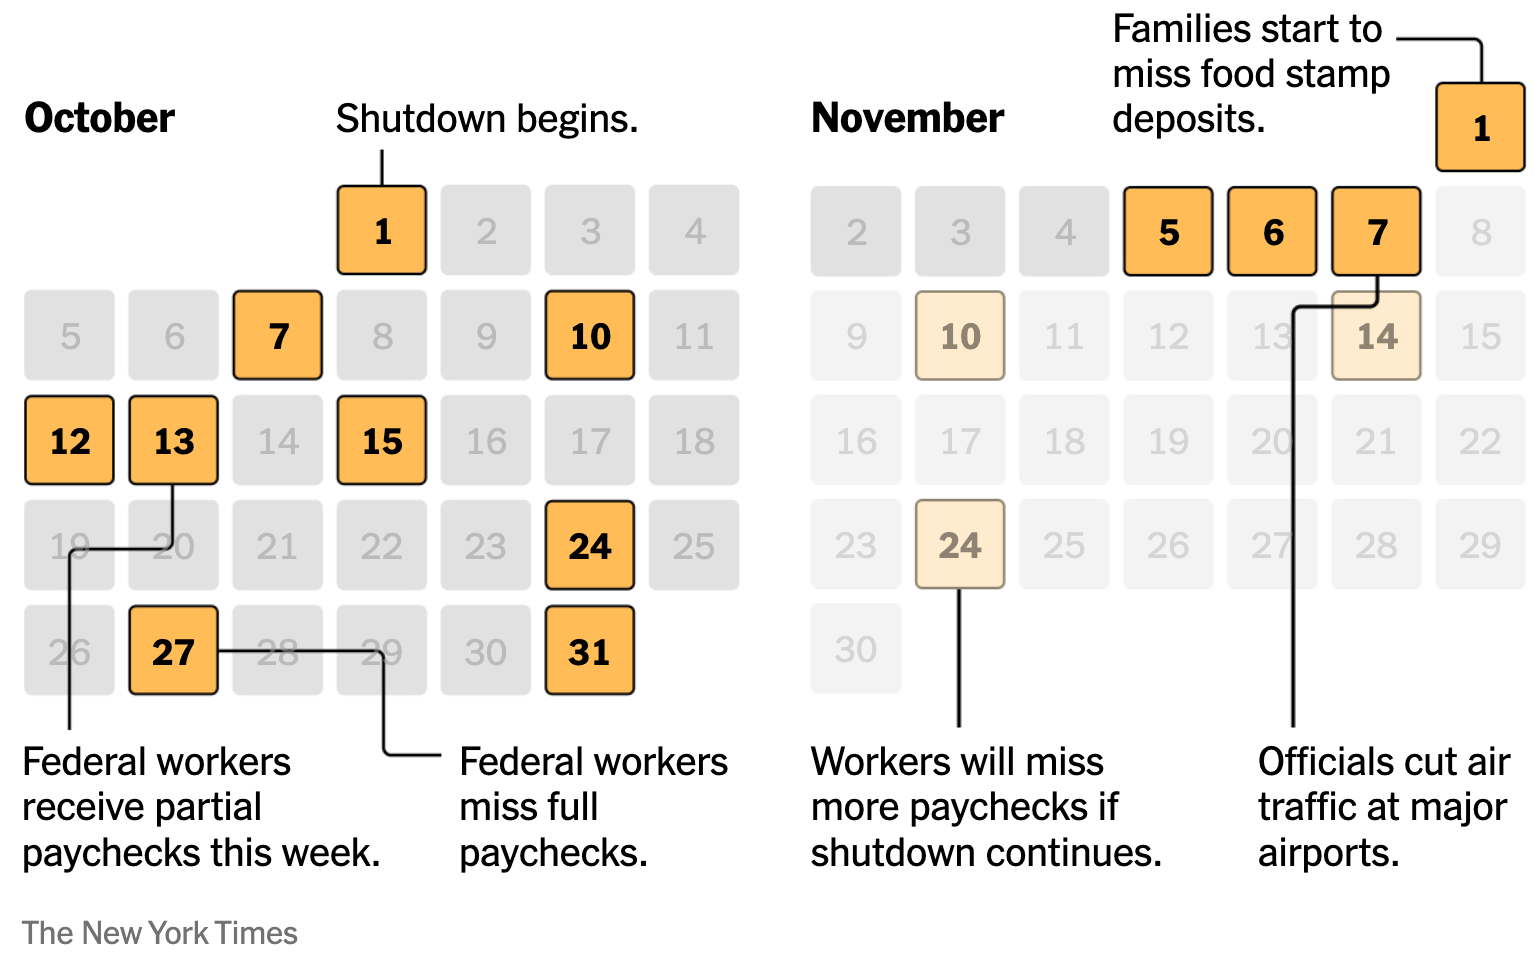
U.S. coverage was not limited to the election. Other topics included best places to raise children, the reactivation of a military base in Puerto Rico, and the impact of the ongoing government shutdown on workers and families.
![Neue Zürcher Zeitung: <a href="https://www.nzz.ch/visuals/usa-reaktiviert-eine-verlassene-militaerbasis-in-der-karibik-ld.1910314"><strong>Eine neue Front im Süden? Die USA reaktivieren eine verlassene Basis in der Karibik</strong></a><strong> </strong>[<em>A new front in the south? The U.S. is reactivating an abandoned base in the Caribbean</em>], November 9](https://datawrapper.de/cdn-cgi/image/quality=85,width=2368,f=auto,fit=cover/https://kirby.datawrapper.de/media/pages/blog/data-vis-dispatch-november-11-2025/e02e544b47-1762854760/f467938e0c8dbe15d71a17c3ca53955271a684d7.jpg)
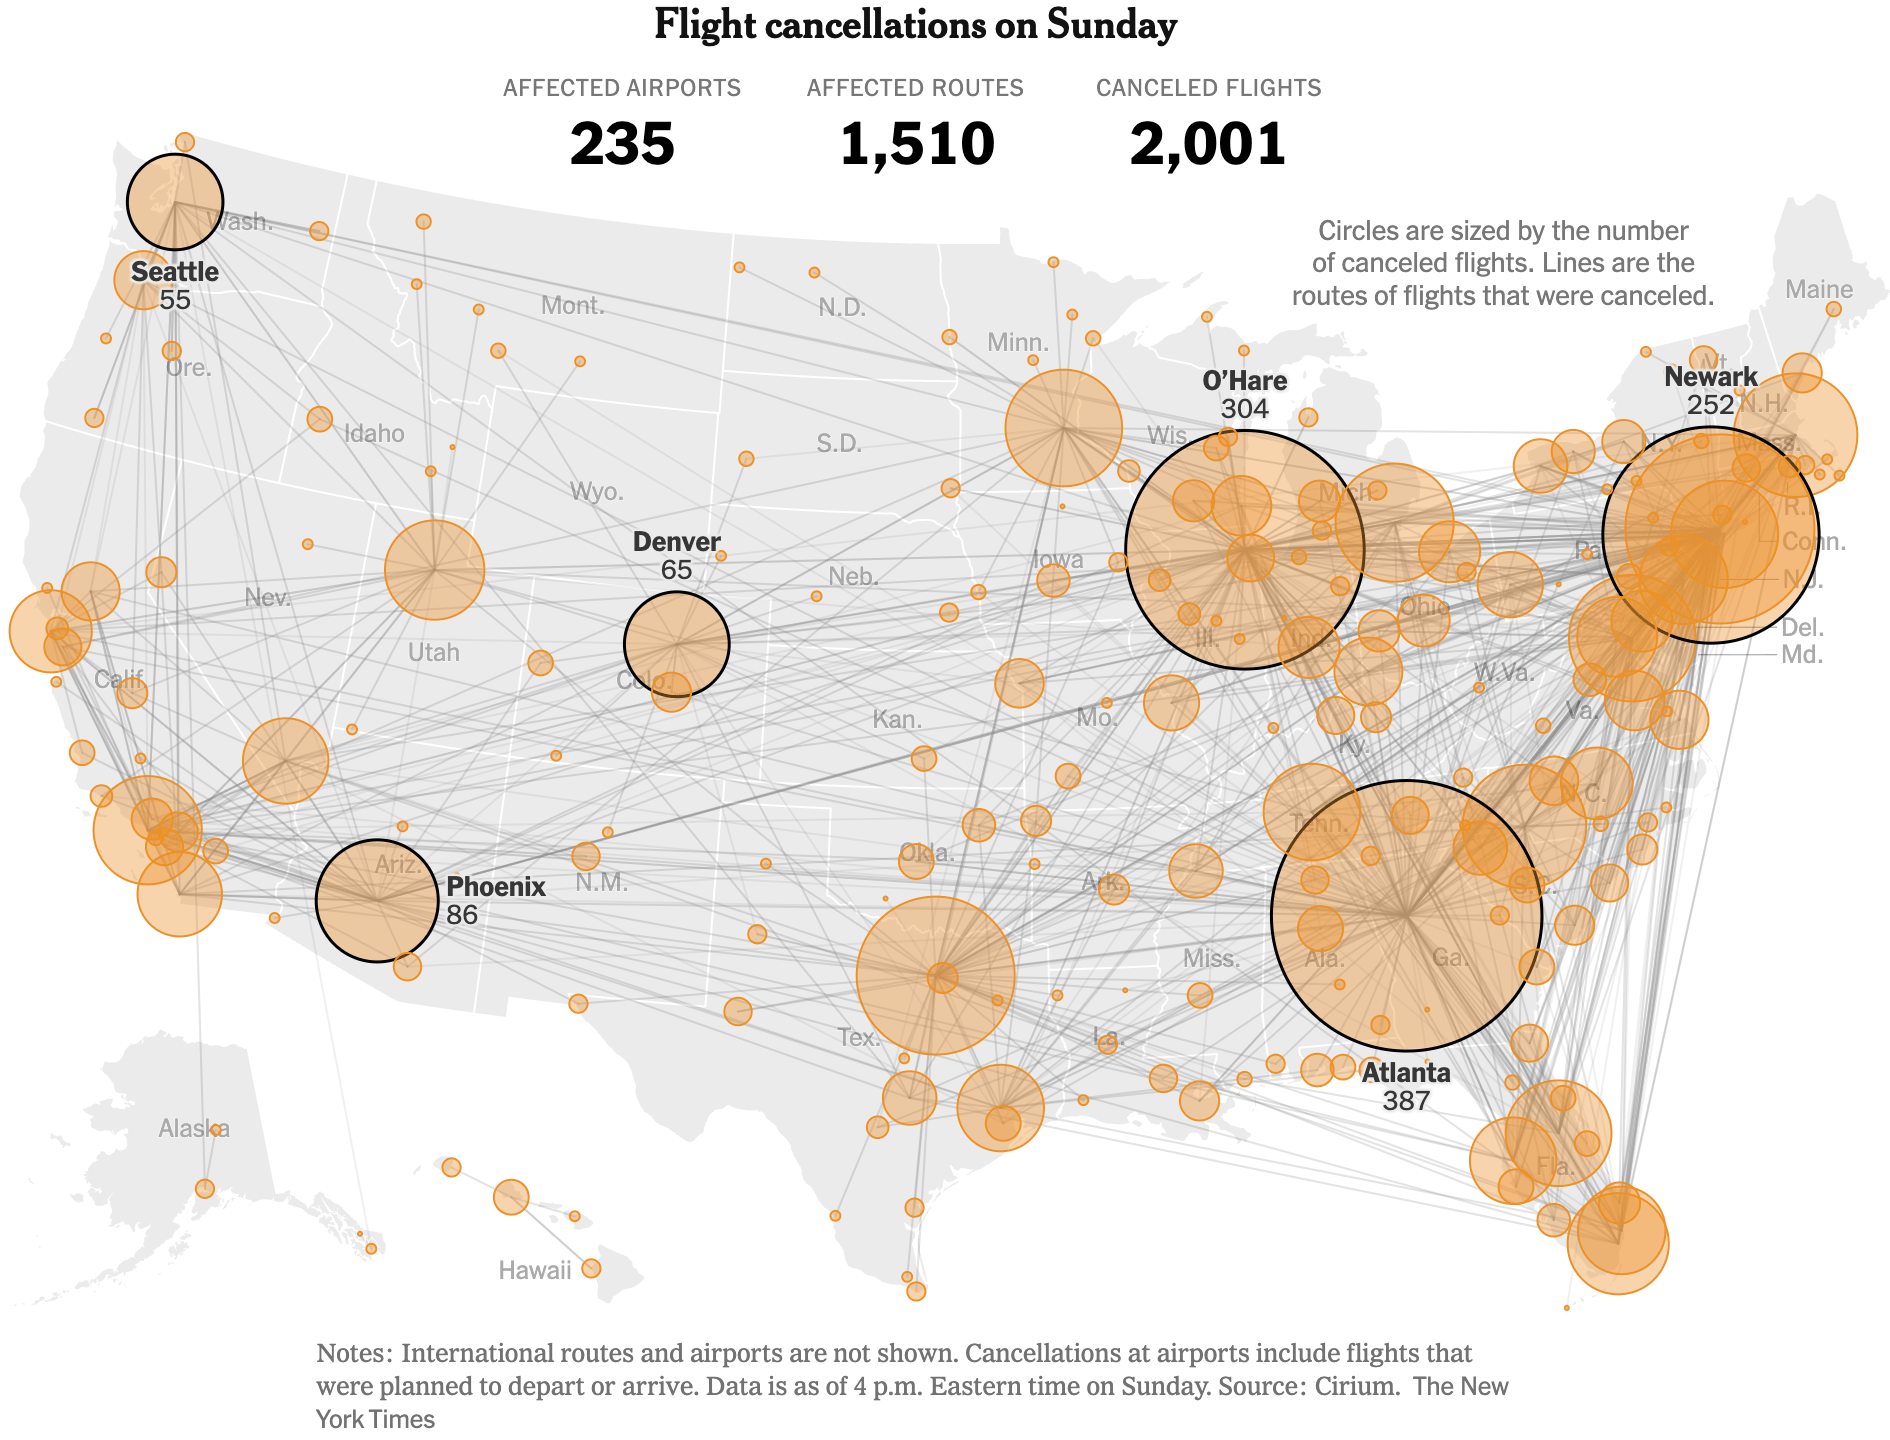
Challenges in the transportation sector extend beyond the U.S. There, flight cancellations are adding up. In Spain, trains are facing declines in production and investment.
![El Mundo: <a href="https://www.elmundo.es/economia/2025/11/06/68fbb60221efa091088b4596.html"><strong>Las horas más bajas de la alta velocidad española: más trenes, más pesados y falta de inversión</strong></a><strong> </strong>[<em>Chart title: High-speed and long-distance train fleet in Spain</em>], November 6](https://datawrapper.de/cdn-cgi/image/quality=85,width=2400,f=auto,fit=cover/https://kirby.datawrapper.de/media/pages/blog/data-vis-dispatch-november-11-2025/272c559335-1762854177/trenes-1200-02.jpg)
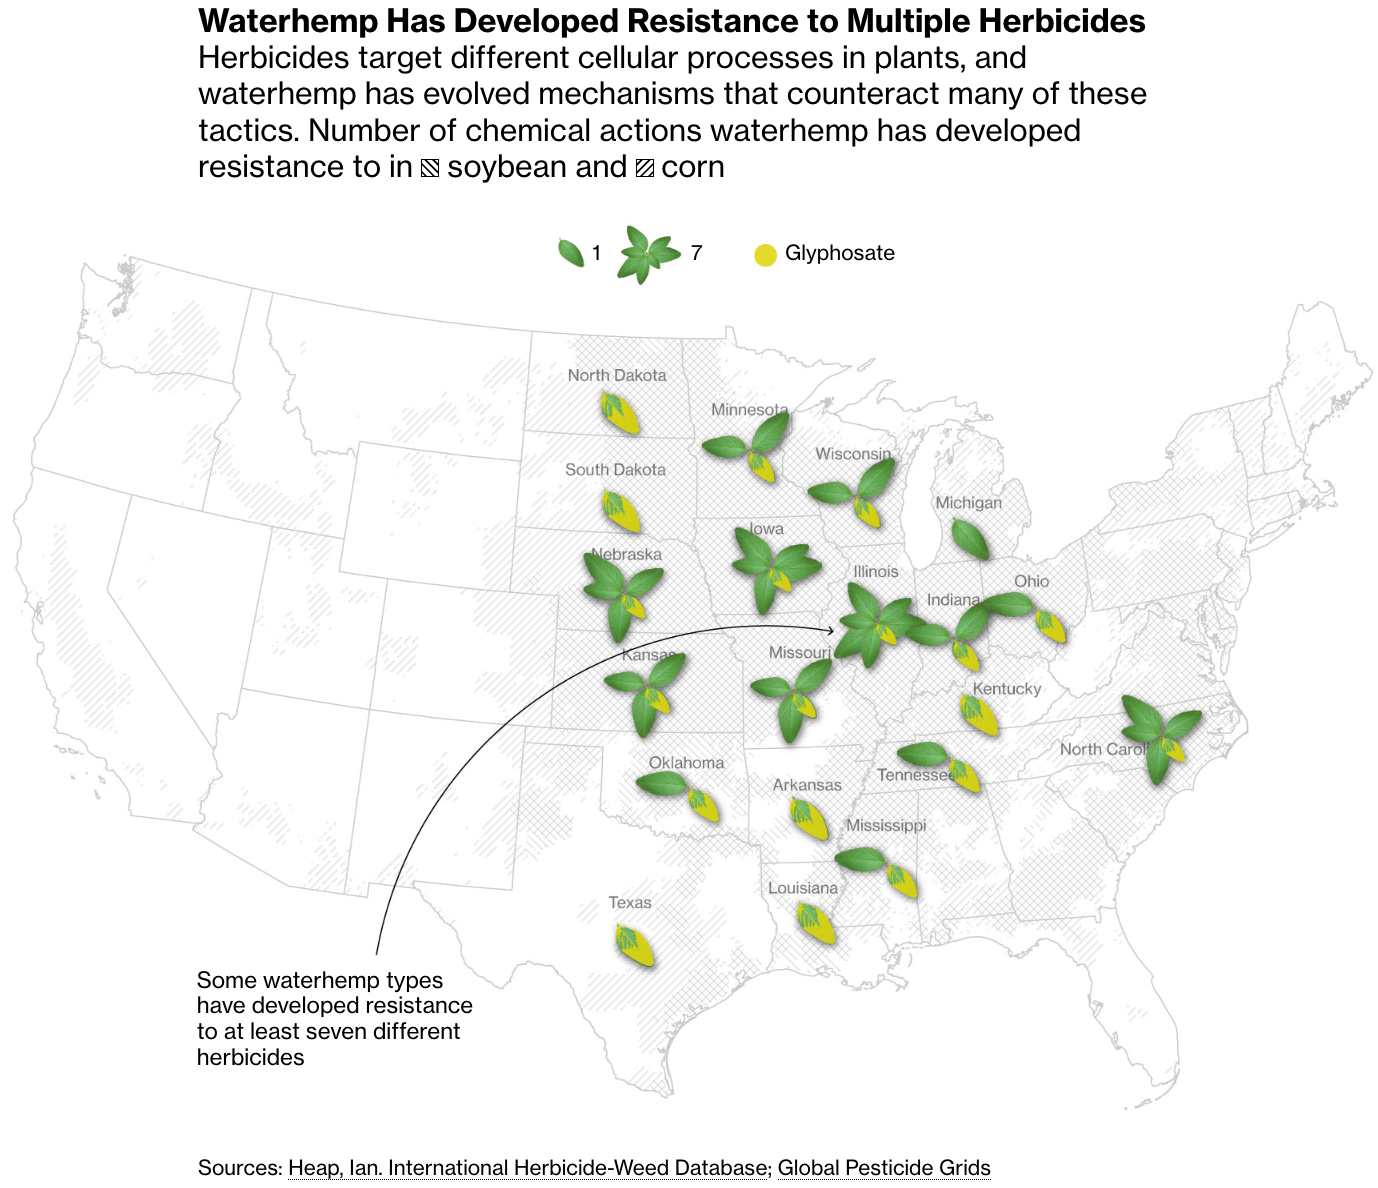
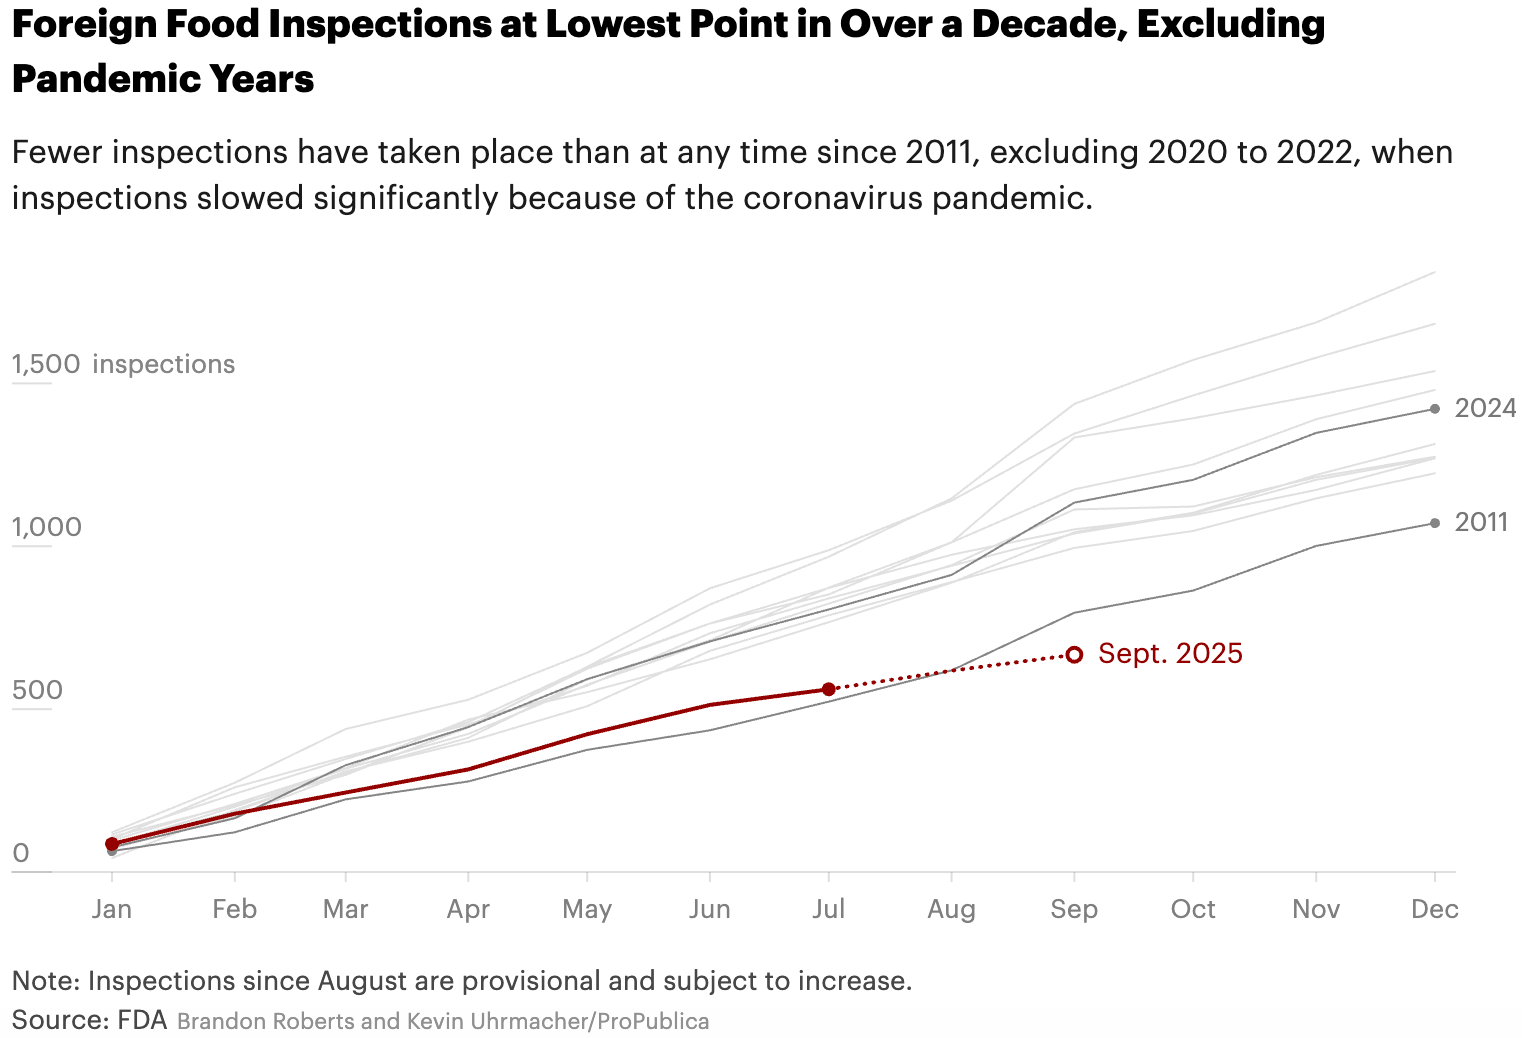
The food industry isn't having an easy time either. Plants, such as waterhemp, are becoming resistant to widespread pesticides, and food inspections are at their lowest level in over a decade.
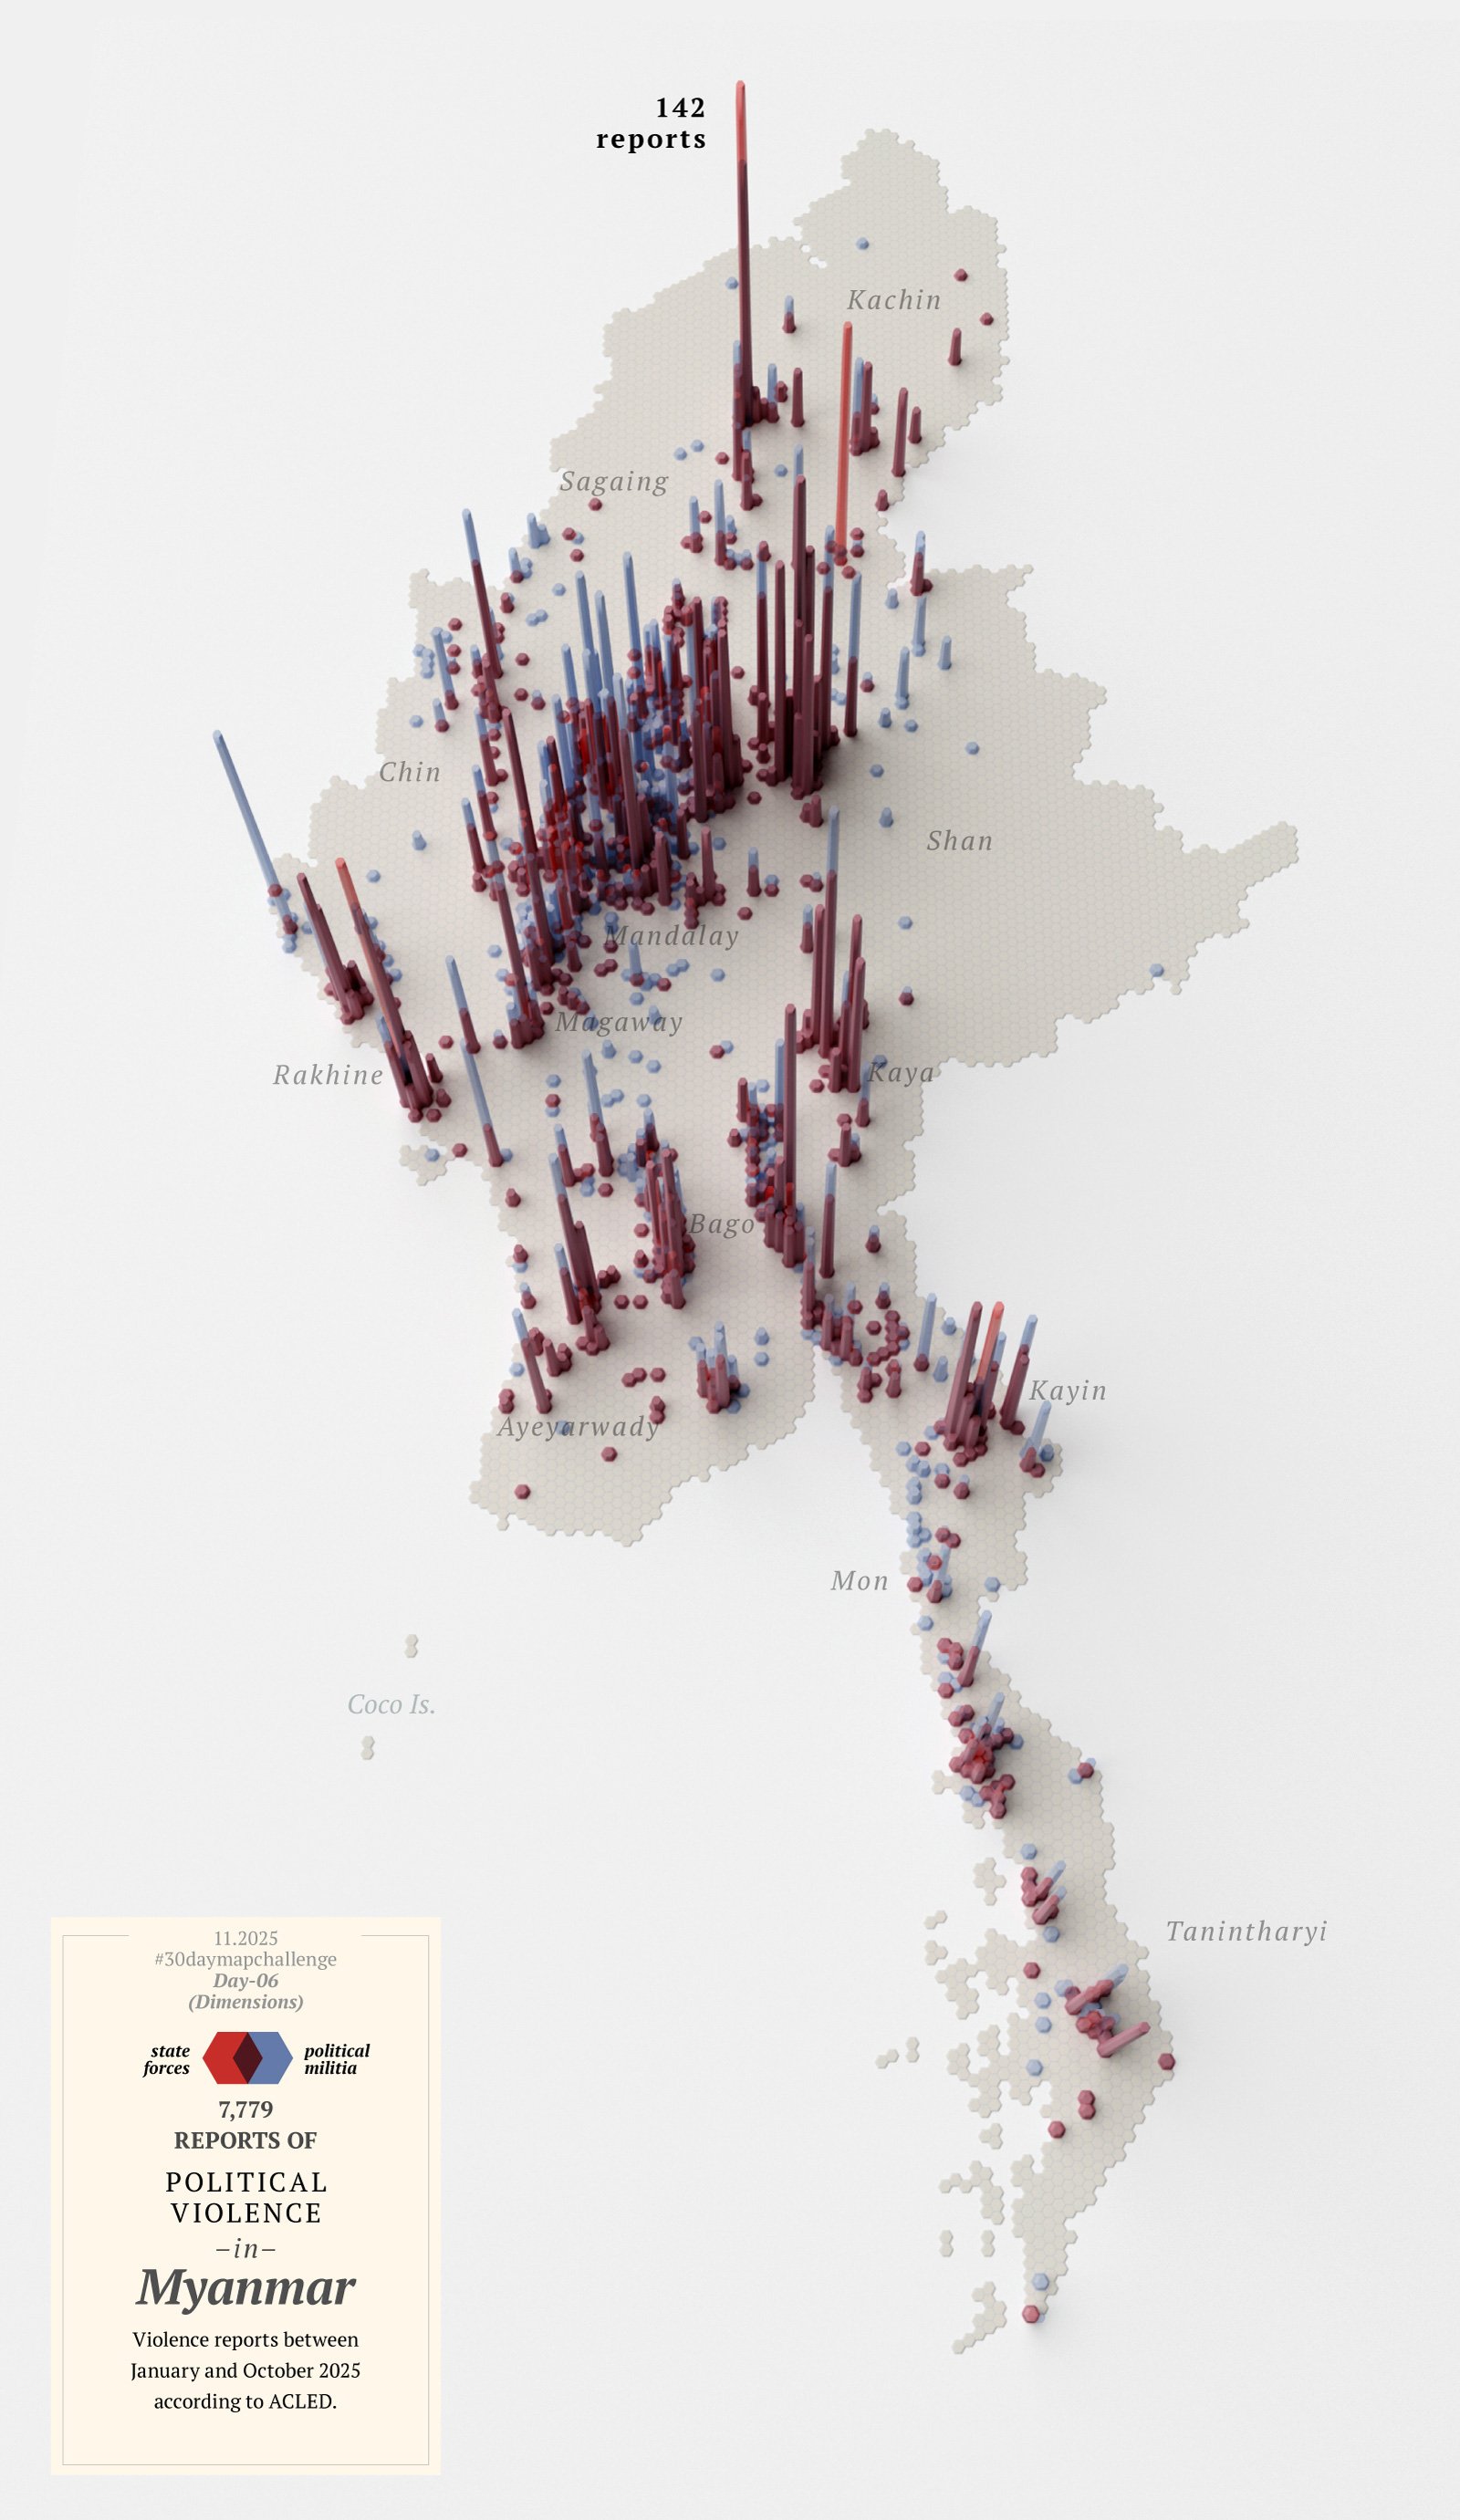
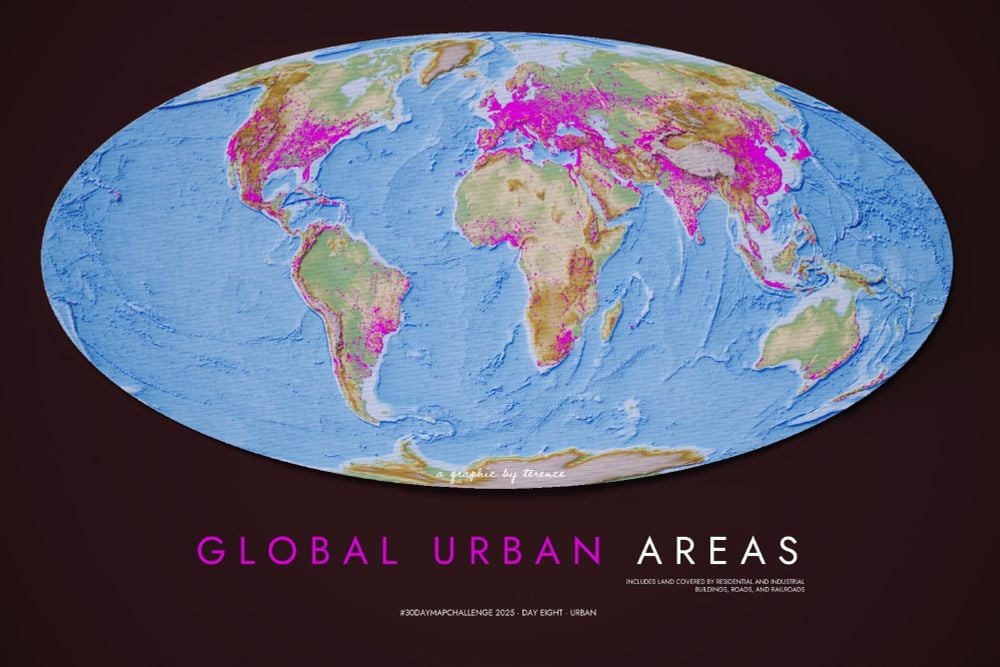
For a more pleasant interlude, let's take a look at the continuing #30DayMapChallenge! Our favorites of the week visualize the following prompts: Earth, dimensions, urban, analog, and air.
![Charmyne Mamador: "Day 9: Analog, Who here is a fan of Netflix’s “Offline Love”? It’s a Japanese dating show where the cast spent ten days in dreamy Nice, France, searching for love — without phones and internet. The only way to reach each other is by leaving handwritten letters at Maison Margaux [...]," November 9 (<a href="https://www.linkedin.com/in/charmynemamador/recent-activity/all/"><strong>LinkedIn</strong></a>)](https://datawrapper.de/cdn-cgi/image/quality=85,width=1280,f=auto,fit=cover/https://kirby.datawrapper.de/media/pages/blog/data-vis-dispatch-november-11-2025/f96b526a41-1762857822/1762699472266.jpeg)
![IGN France: "La Pointe du Raz est l'un des caps les plus venteux de Bretagne. Face à l'océan, une station météorologique enregistre chaque jour les assauts du vent : vitesse, direction, rafales. Des données précieuses sur mer et sur terre [...]" [<em>Pointe du Raz is one of the windiest capes in Brittany. Facing the ocean, a weather station records the wind's assaults every day: speed, direction, gusts.Valuable data for both sea and lan</em>d], November 10 (<a href="https://mastodon.social/@ignfrance@social.numerique.gouv.fr"><strong>Mastodon</strong></a>)](https://datawrapper.de/cdn-cgi/image/quality=85,width=2362,f=auto,fit=cover/https://kirby.datawrapper.de/media/pages/blog/data-vis-dispatch-november-11-2025/640776a26c-1762857646/a40713dfd351f860.png)
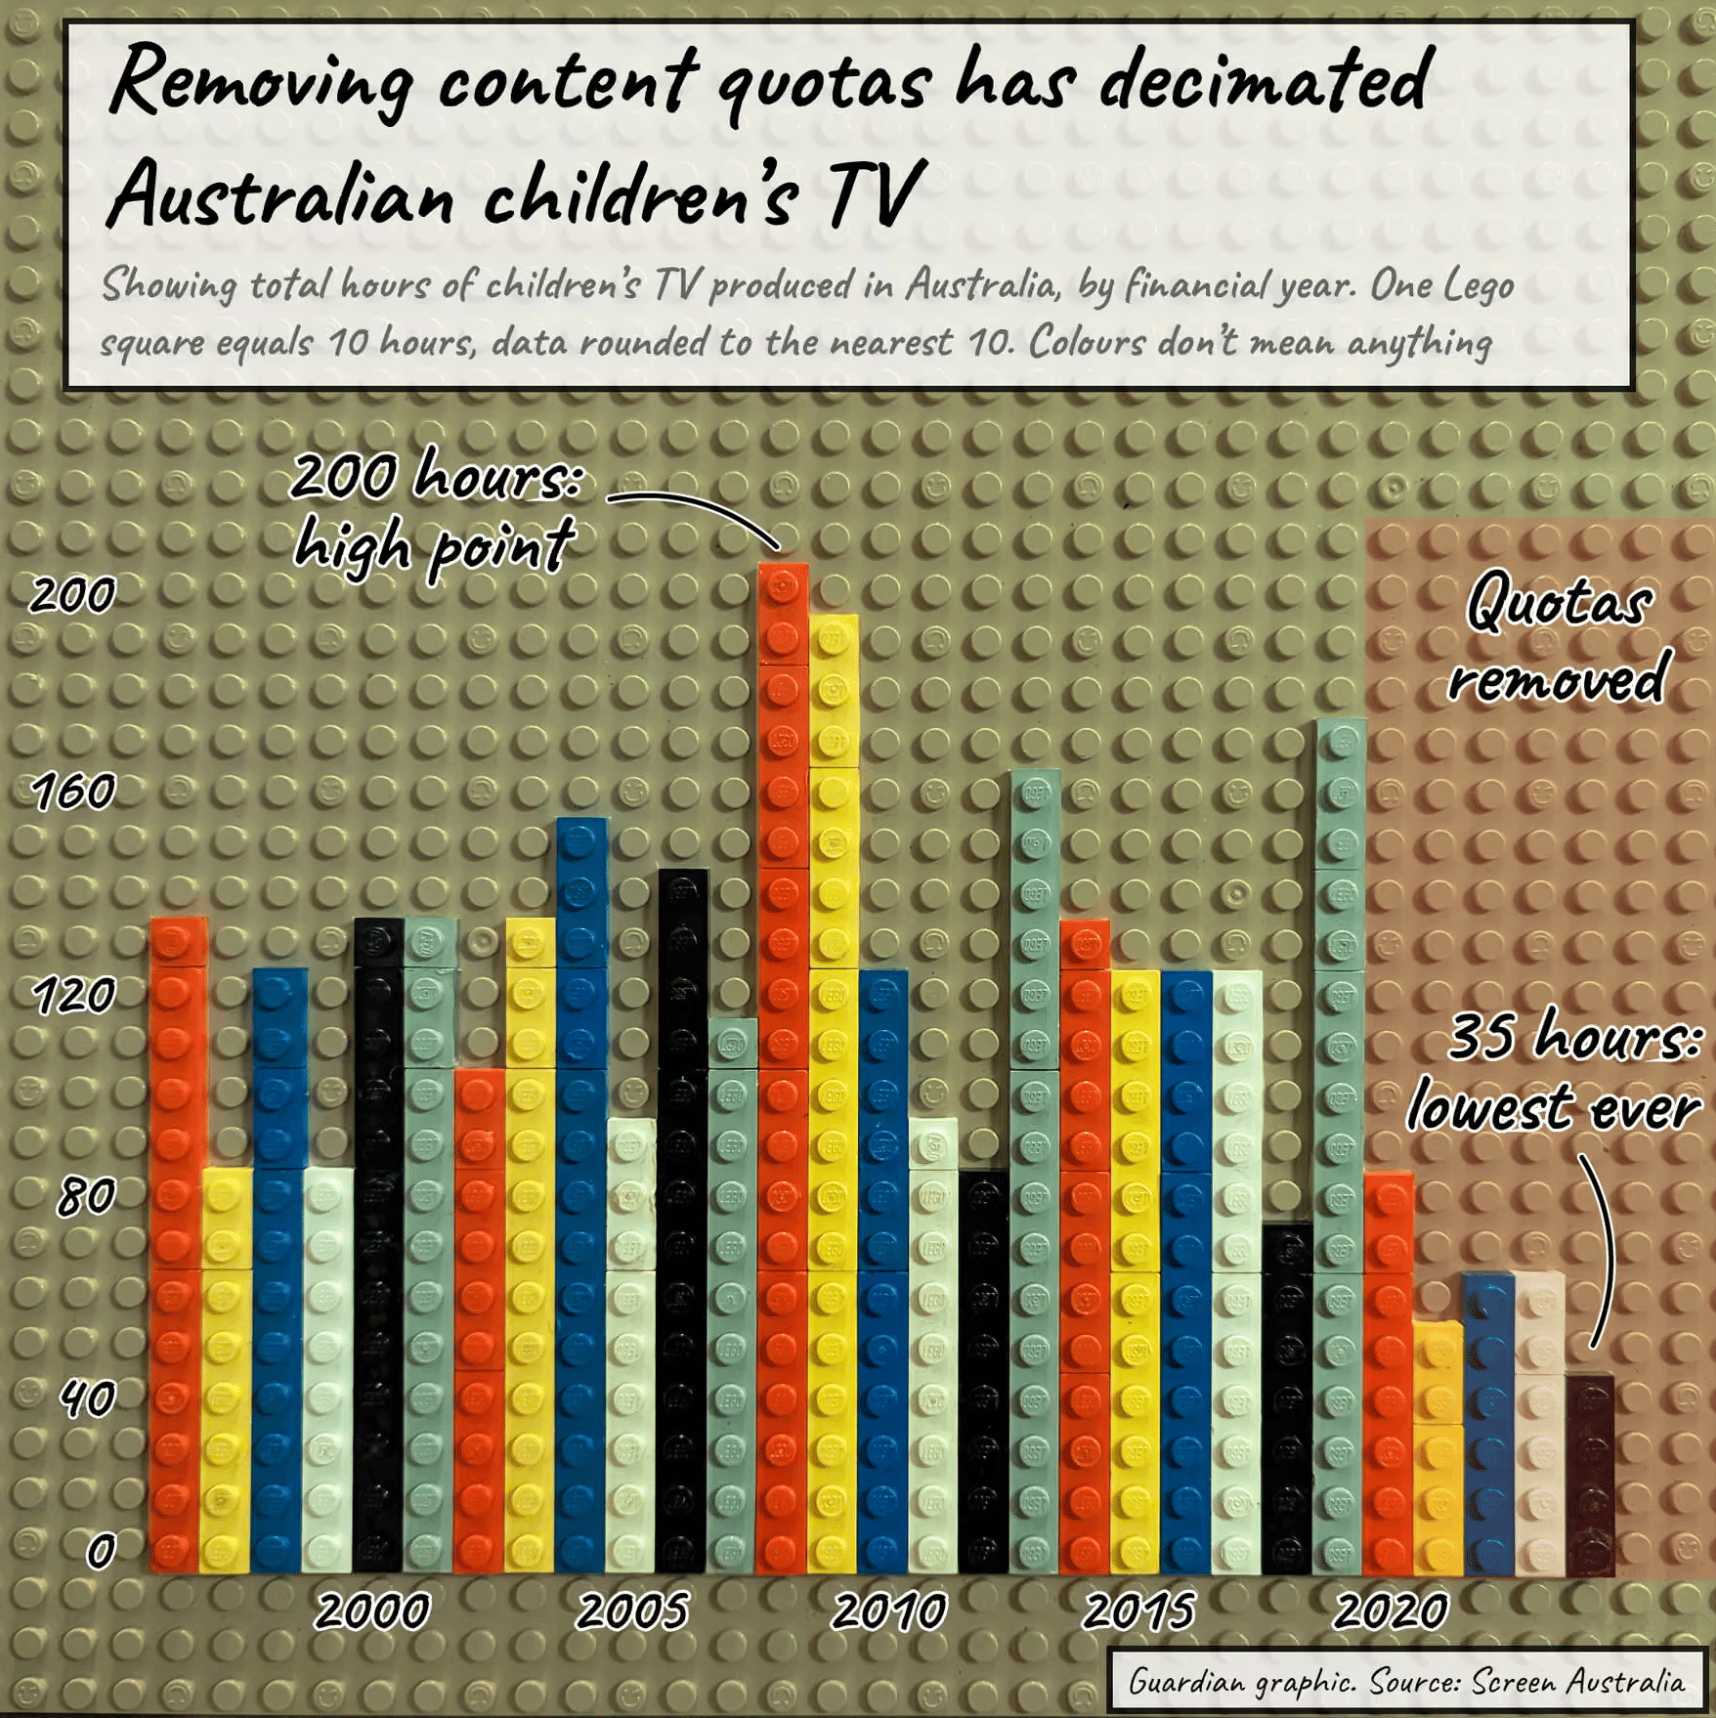
Even outside of the #30DayMapChallenge, we found some intriguing analog data projects: the Women's National Basketball Association on paper, children's TV production in Australia in Lego bricks, and dynamic augmented line charts.
![Raimund Dachselt: "On behalf of my former PhD students and collaborators, I am honored to present our TVCG journal article 'Augmented Dynamic Data Physicalization: Blending Shape-changing Data Sculptures with Virtual Content for Interactive Visualization' [...]," November 4 (<a href="https://www.linkedin.com/feed/update/urn:li:activity:7391273397269417984/"><strong>LinkedIn</strong></a>)](https://datawrapper.de/cdn-cgi/image/quality=85,width=1482,f=auto,fit=cover/https://kirby.datawrapper.de/media/pages/blog/data-vis-dispatch-november-11-2025/3840b985de-1762810643/cleanshot-2025-11-10-at-22.36.35@2x.png)
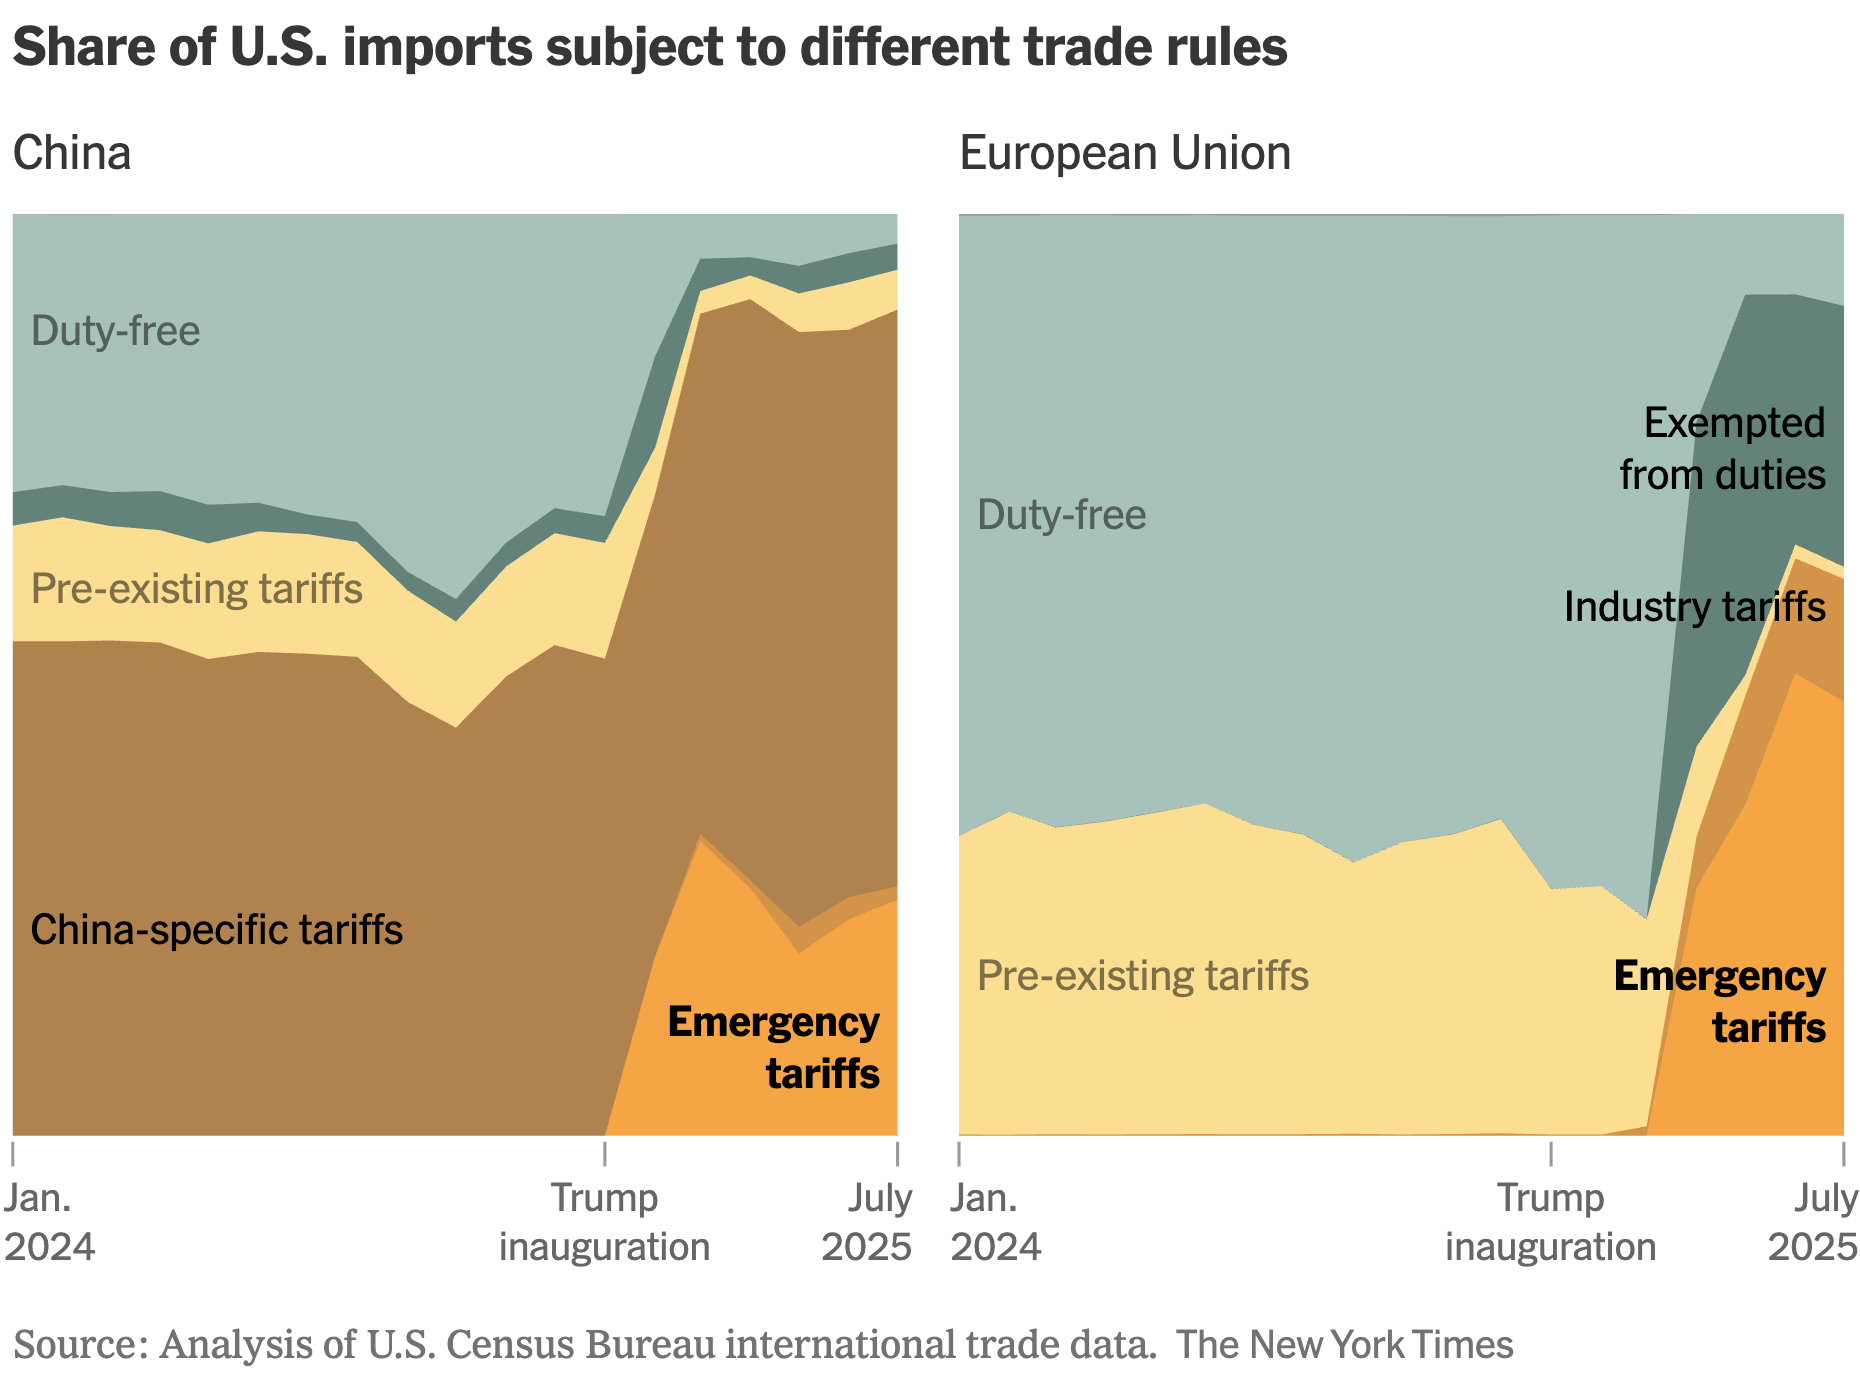
We turn to China, where trade tensions and economic obstacles converge. Steep U.S. tariffs weigh on exports, while too much supply meets too little demand internally.
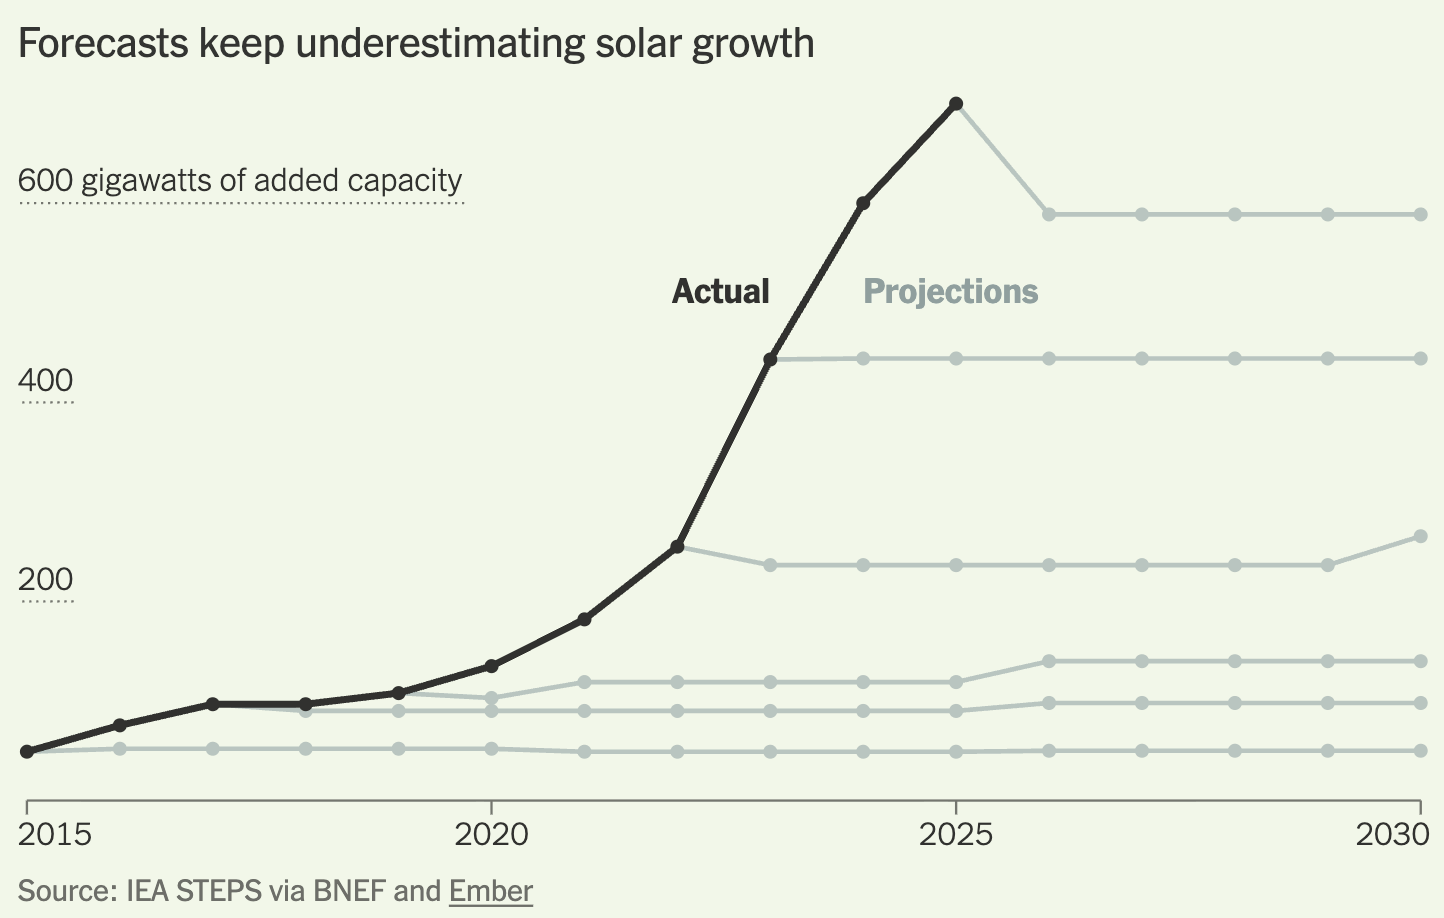
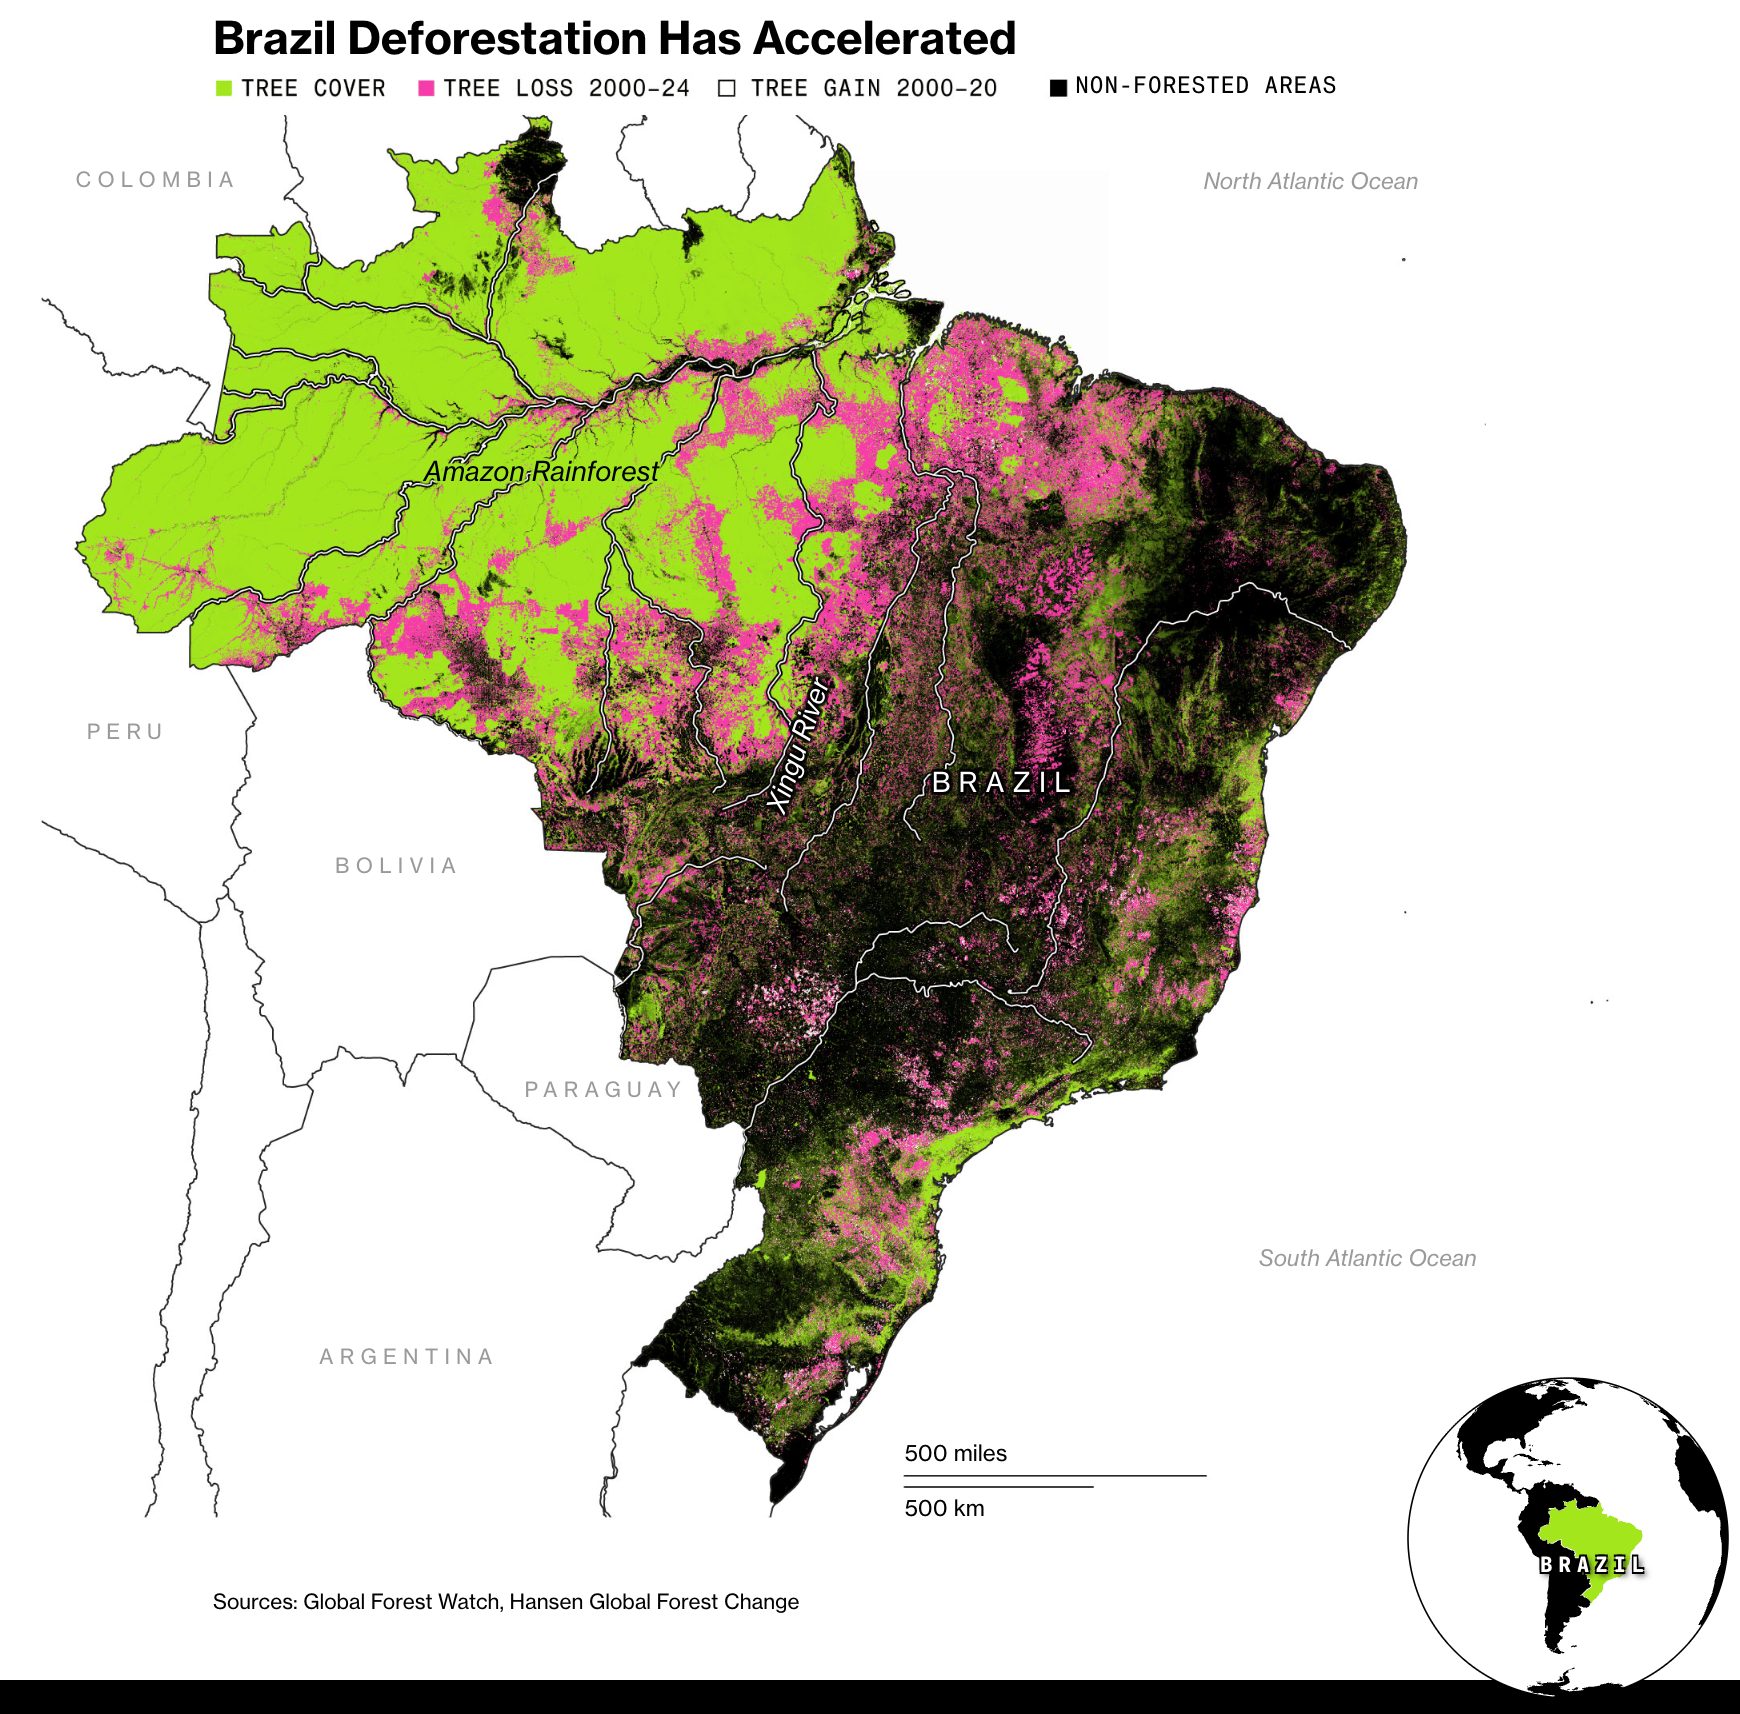
Ahead of the 30th United Nations Climate Change Conference, known as COP30, and the 10th anniversary of the Paris Climate Agreement, attention once again turns to climate. The spotlight is on future greenhouse gas emissions, past projections and current progress. Other indicators, such as clean energy development and deforestation, are being evaluated, particularly in Brazil, where the conference is taking place.
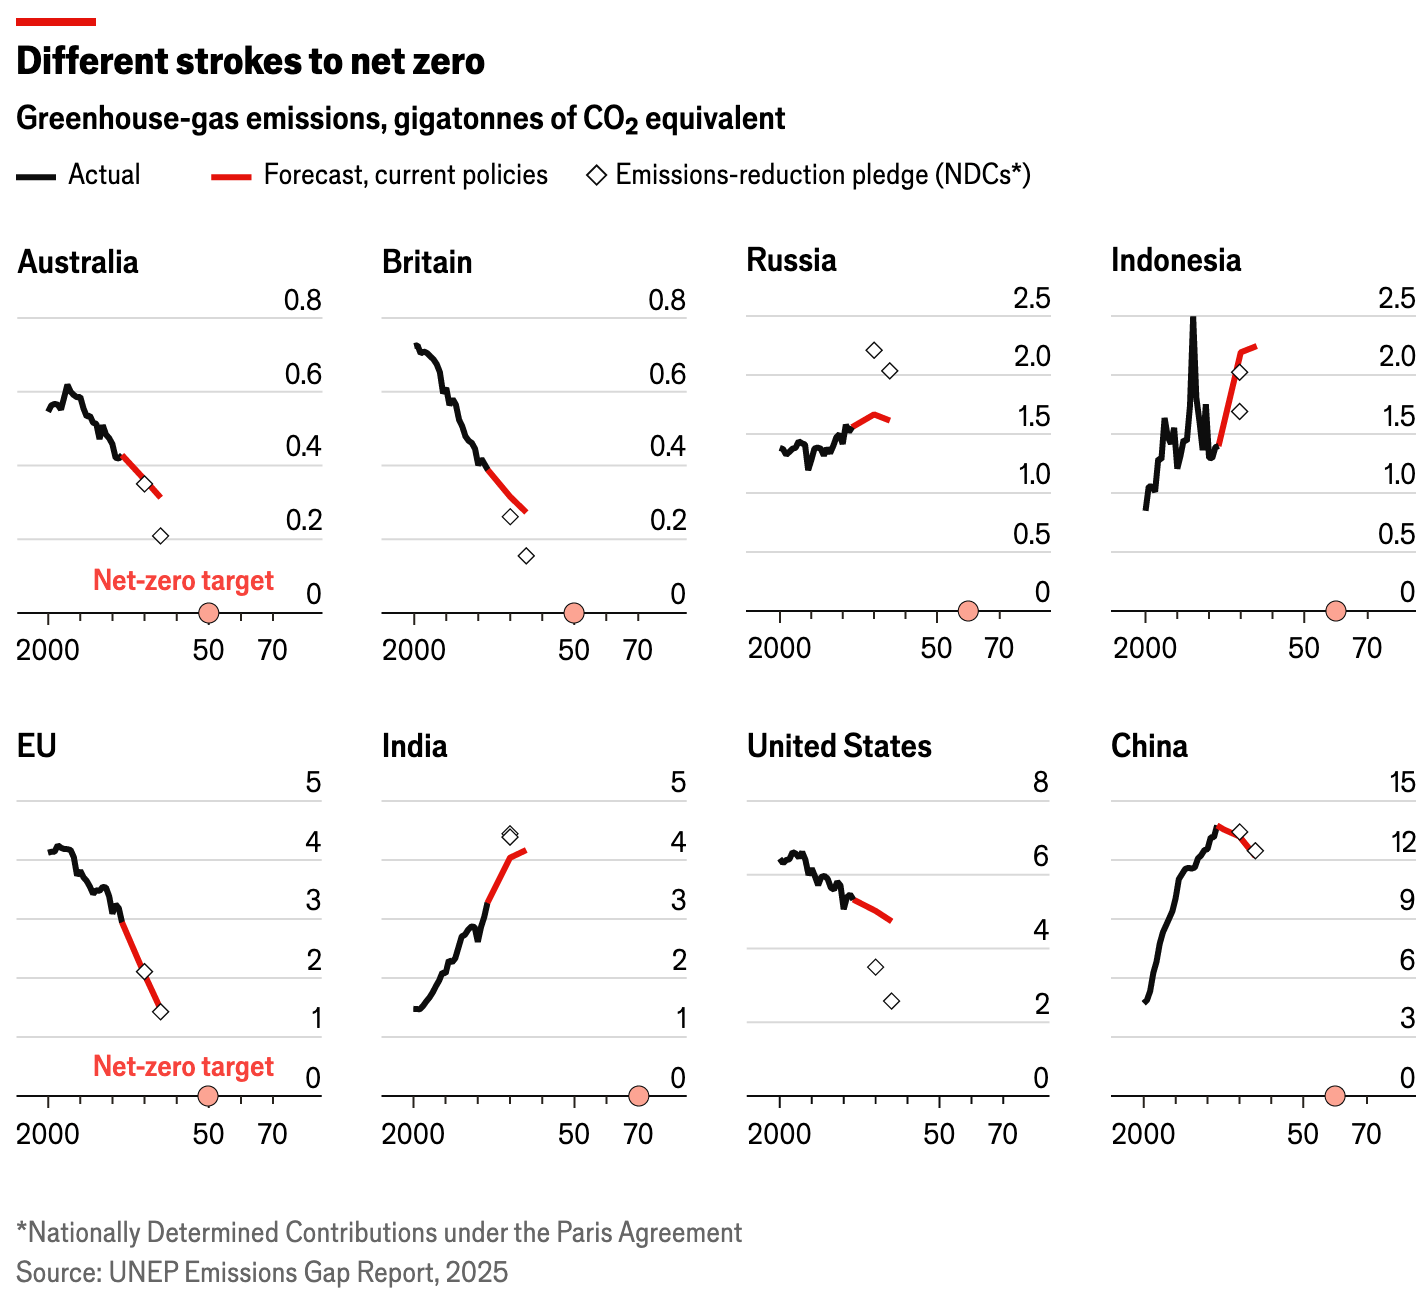
![Der Spiegel: <a href="https://www.spiegel.de/wissenschaft/natur/pariser-klimaabkommen-so-viel-treibhausgas-haben-die-laender-in-zehn-jahren-eingespart-a-6b115474-bef9-4134-bda6-d62ad57a4ad2"><strong>So viel Treibhausgas haben die Länder weltweit eingespart</strong></a> [<em>Chart description: Share of different energy sources in electricity generation between 2000 and 2024 in selected countries, percent</em>], November 10](https://datawrapper.de/cdn-cgi/image/quality=85,width=1698,f=auto,fit=cover/https://kirby.datawrapper.de/media/pages/blog/data-vis-dispatch-november-11-2025/c118f5ee47-1762853138/cleanshot-2025-11-11-at-10.24.14@2x.png)
![Le Monde: <a href="https://www.lemonde.fr/planete/article/2025/11/04/deforestation-puits-de-carbone-quel-est-l-etat-de-sante-de-l-amazonie-la-plus-vaste-foret-tropicale-du-monde_6651554_3244.html"><strong>Quel est l’état de santé de l’Amazonie, la plus vaste forêt tropicale du monde ?</strong></a> [<em>Chart title: The Amazon, the world's largest tropical forest, faces multiple threats</em>], November 4](https://datawrapper.de/cdn-cgi/image/quality=85,width=1336,f=auto,fit=cover/https://kirby.datawrapper.de/media/pages/blog/data-vis-dispatch-november-11-2025/ad25b37e7e-1762852341/cleanshot-2025-11-11-at-10.10.15@2x.png)
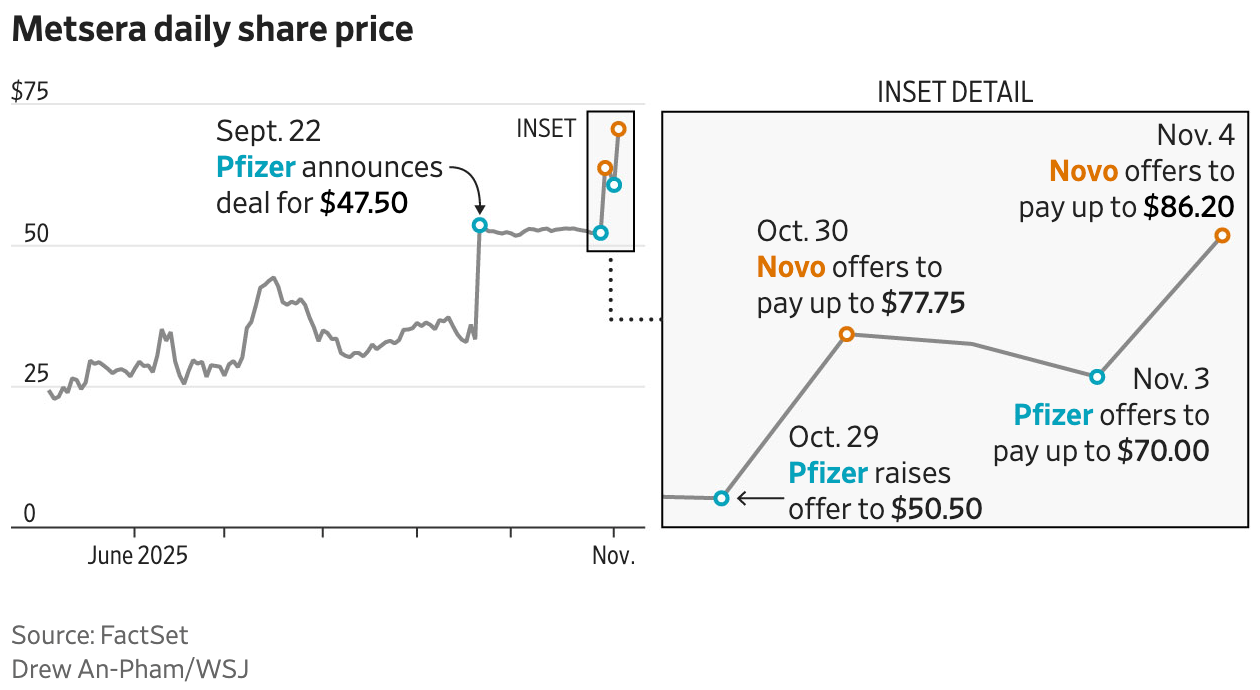
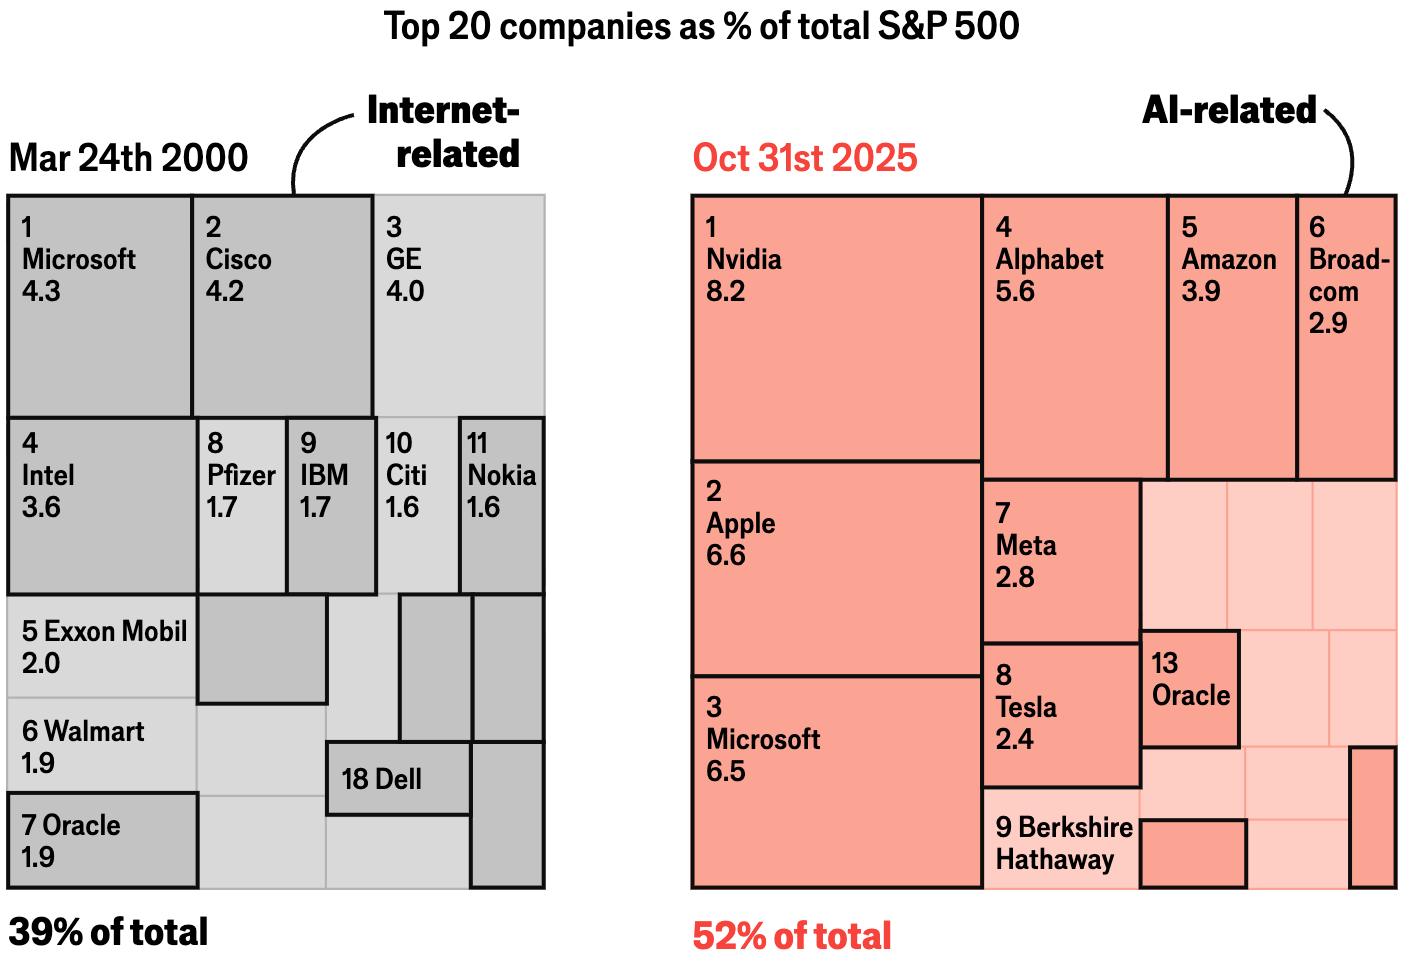
On the financial front, the multibillion-dollar takeover battle for obesity drug developer Metsera between Pfizer and Novo Nordisk boosts the stock price, while AI-related companies dominate the S&P 500.
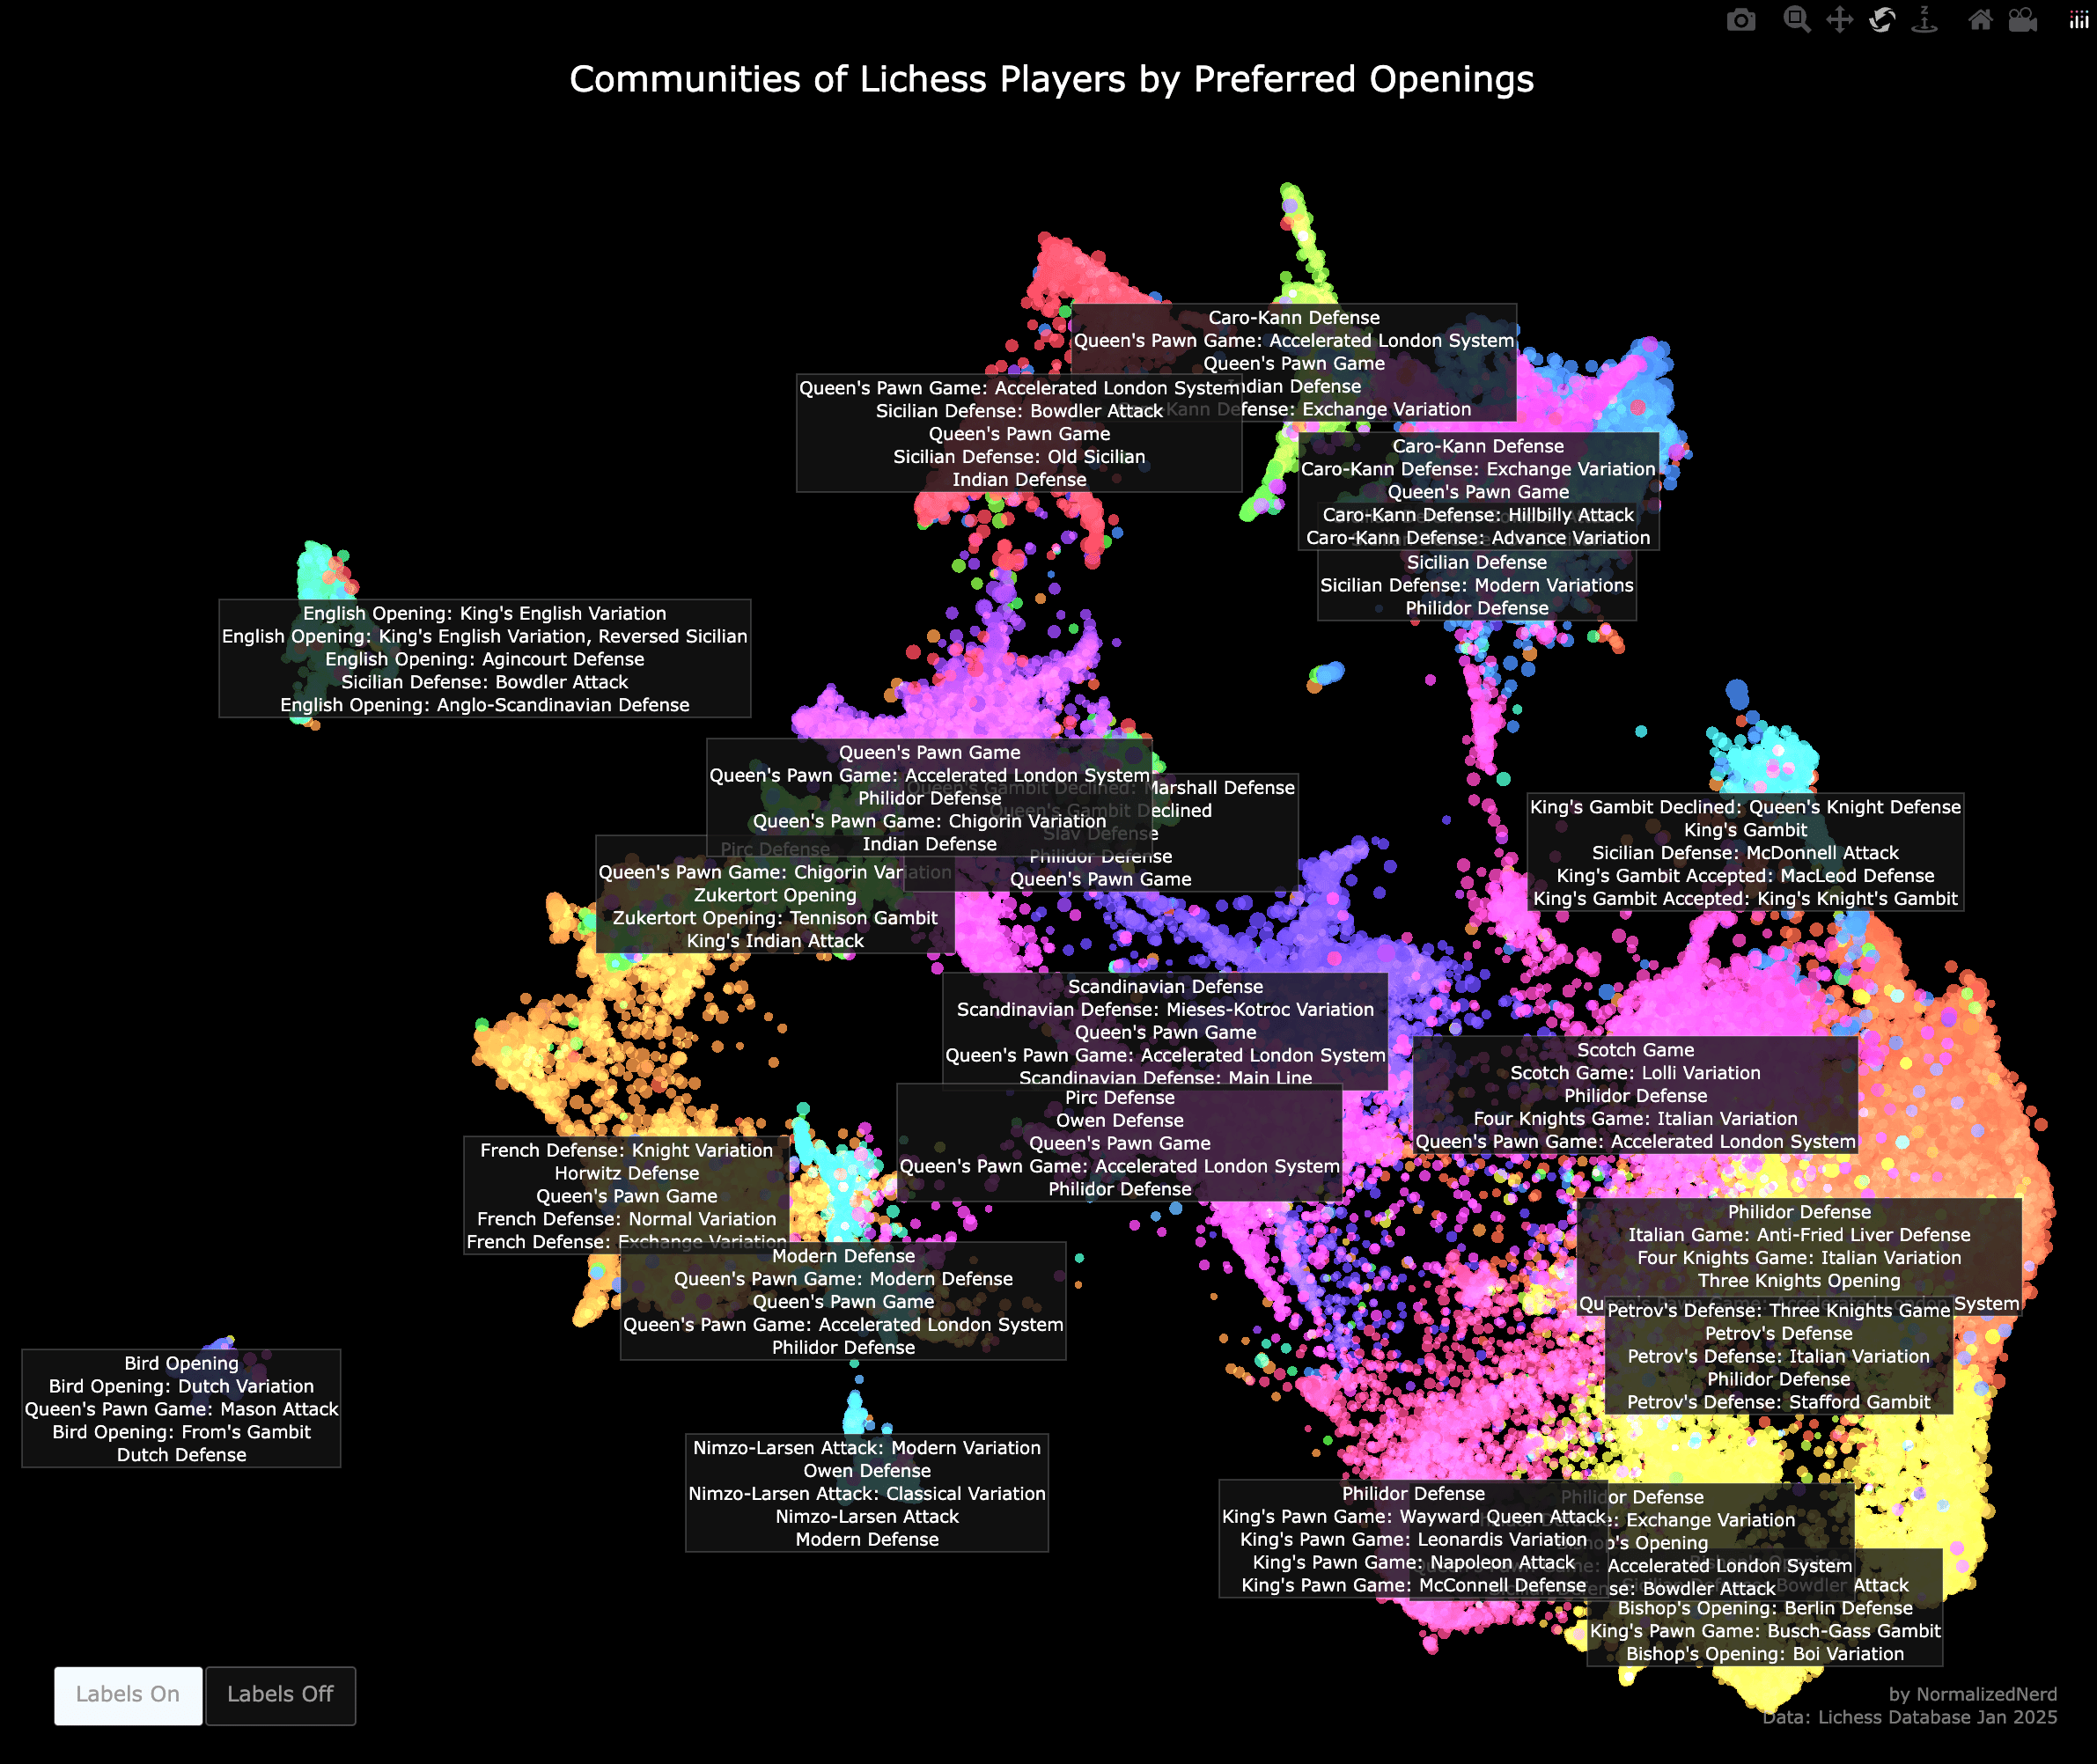
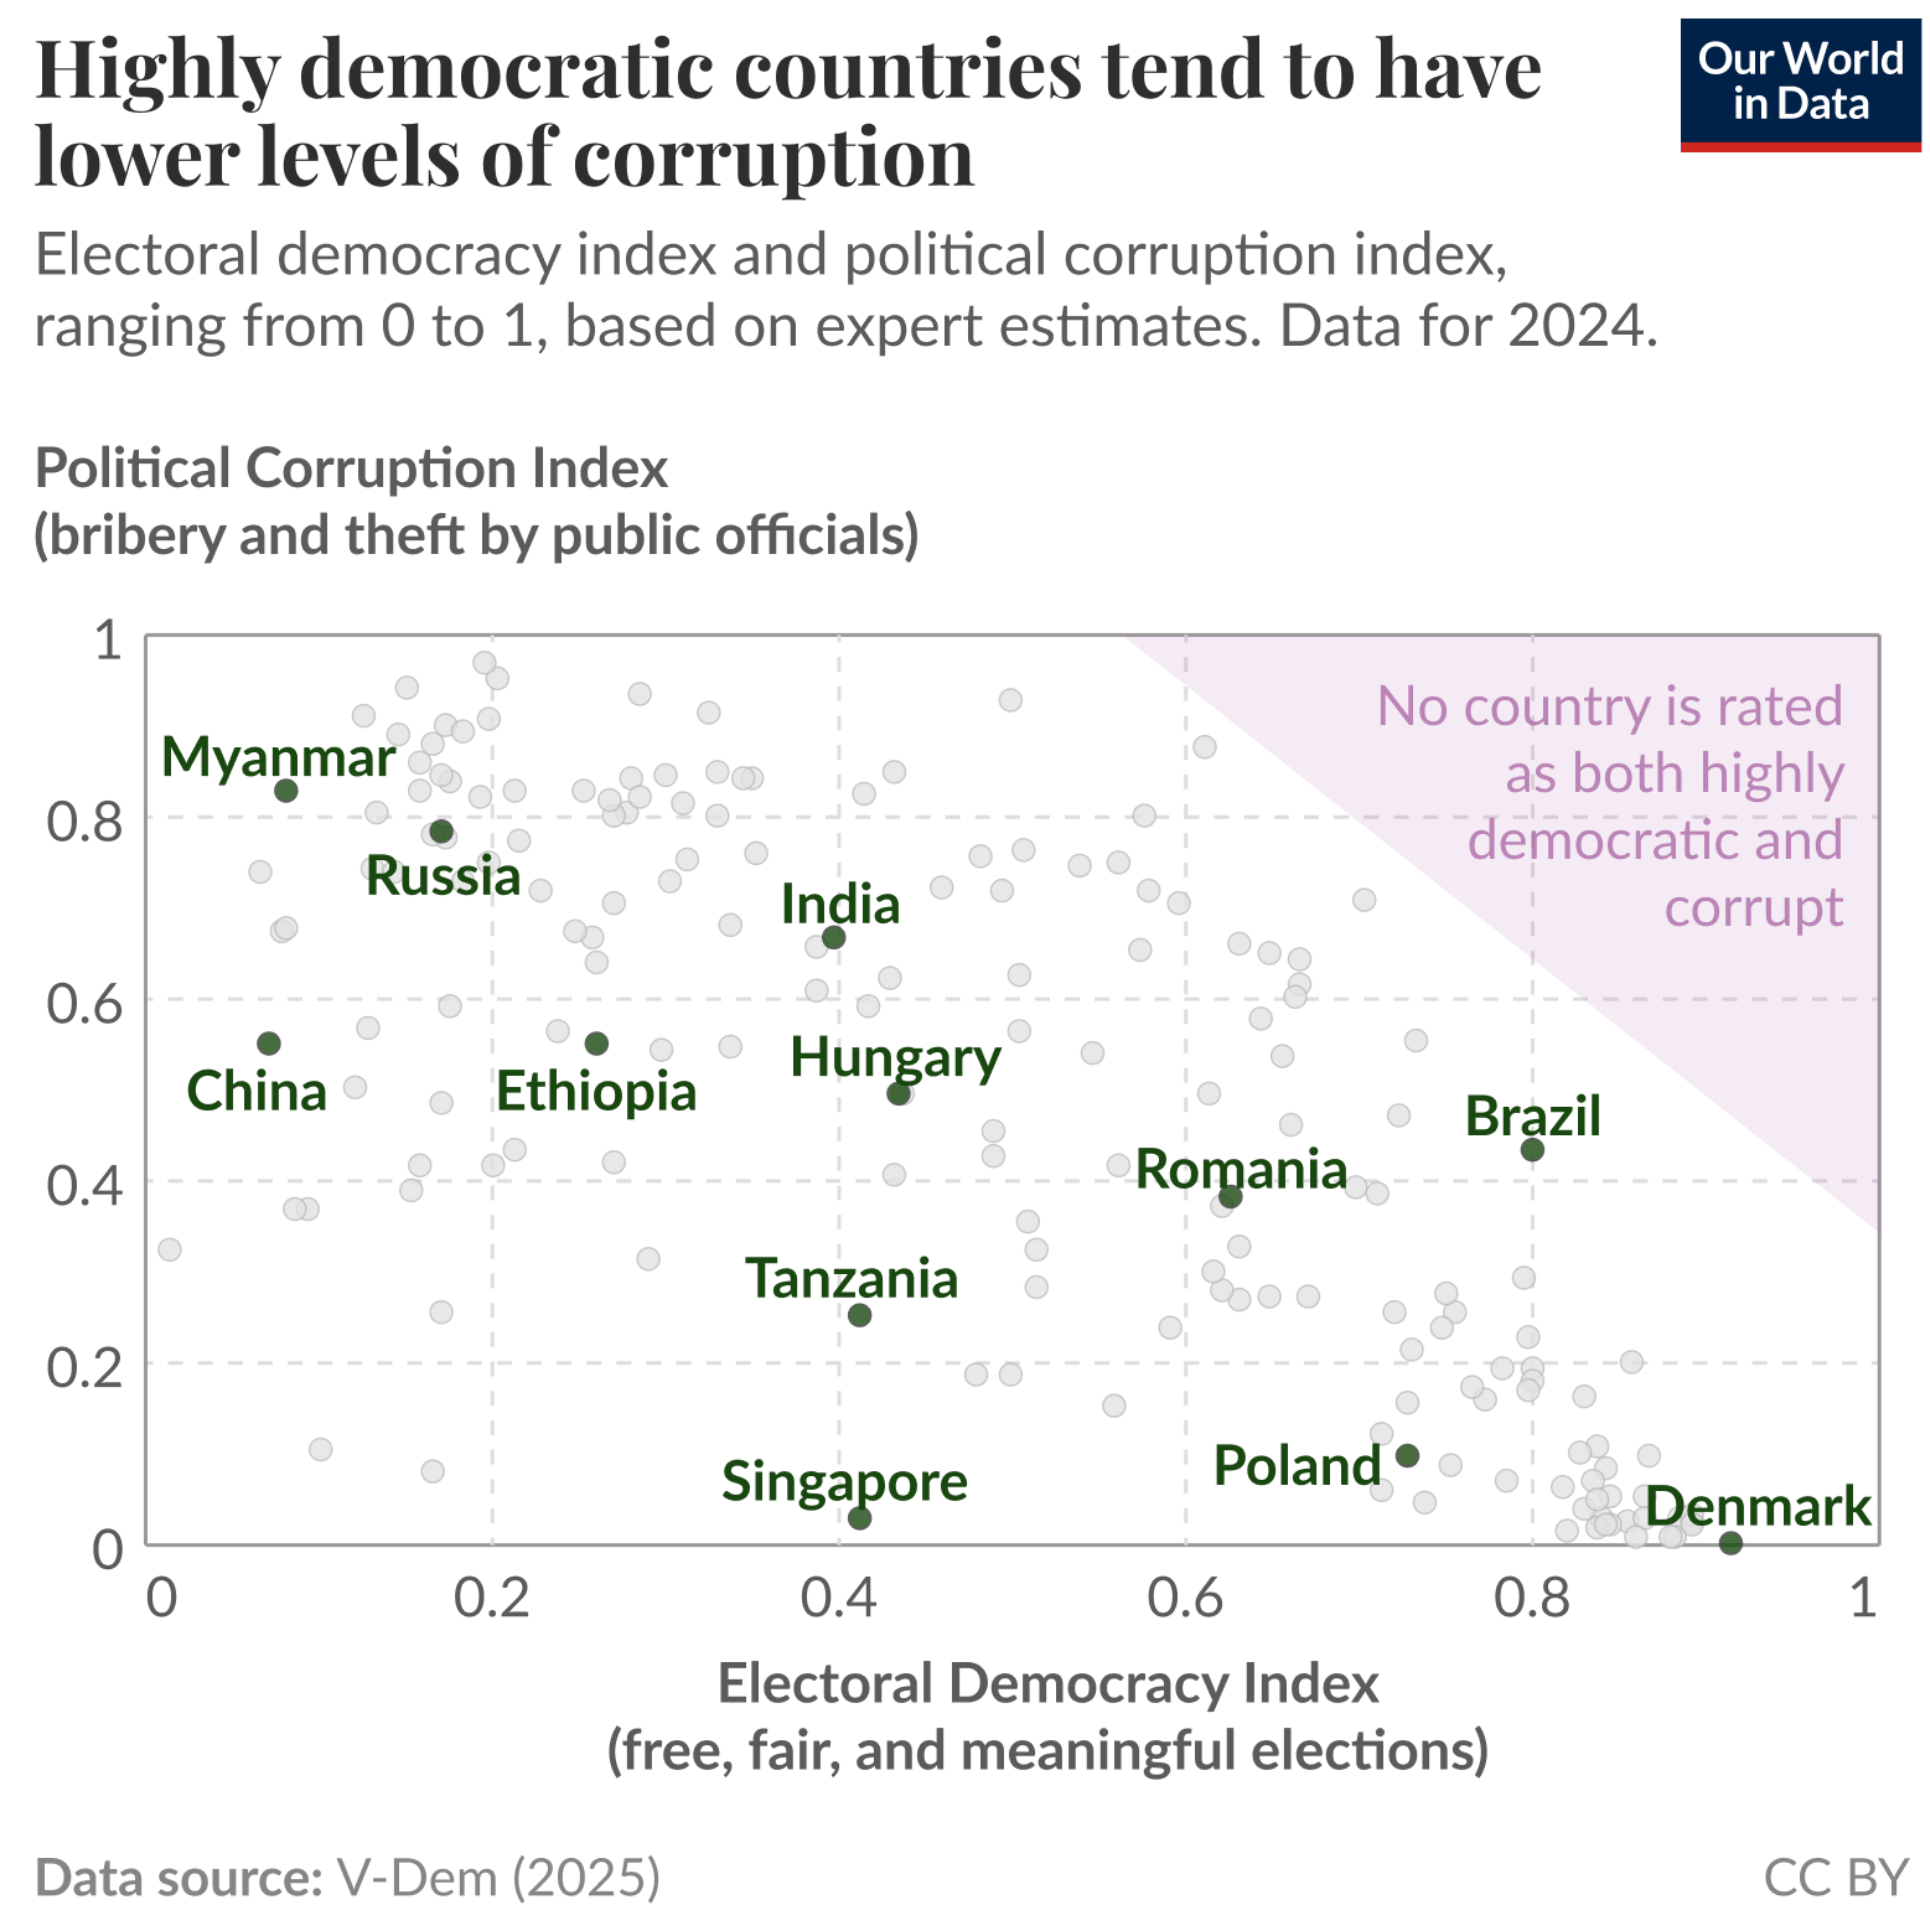
What do chess opening moves, democracies, corruption, and Bolivian census data have in common? All we know is that they can be the basis for intriguing visualizations.
![mauforonda:<strong> </strong><a href="https://mauforonda.github.io/atlasurbano/"><strong>Atlas urbanocon datos del Censo 2024</strong></a> [<em>Urban atlas with data from the 2024 census</em>], November 5](https://datawrapper.de/cdn-cgi/image/quality=85,width=2064,f=auto,fit=cover/https://kirby.datawrapper.de/media/pages/blog/data-vis-dispatch-november-11-2025/df6f9ace51-1762810280/cleanshot-2025-11-10-at-22.30.04@2x.png)
What else we found interesting
![El Diario Sur: <a href="https://www.diariosur.es/economia/crisis-millon-chips-20251109001712-ntrc.html"><strong>La crisis del millón de chips</strong> </a>[<em>The million chip crisis</em>], November 9](https://datawrapper.de/cdn-cgi/image/quality=85,width=2114,f=auto,fit=cover/https://kirby.datawrapper.de/media/pages/blog/data-vis-dispatch-november-11-2025/106a9f3e5c-1762856924/cleanshot-2025-11-11-at-11.27.59@2x.png)
Applications are open for…
A data projects editor at The Guardian
A professor for product and spatial practices at University of Applied Sciences Potsdam
A graphics reporter (deleted data project) at the Guardian
Multiple roles on the board of the Data Visualization Society


