Data Vis Dispatch, May 12: Hantavirus, AI inequality, and Burning Man

Welcome back to the 244th edition of Data Vis Dispatch! Every week, we’ll be publishing a collection of the best small and large data visualizations we find, especially from news organizations — to celebrate data journalism, data visualization, simple charts, elaborate maps, and their creators.
Recurring topics this week include transmission of the hantavirus, AI inequalities, and the annual Burning Man clean-up.
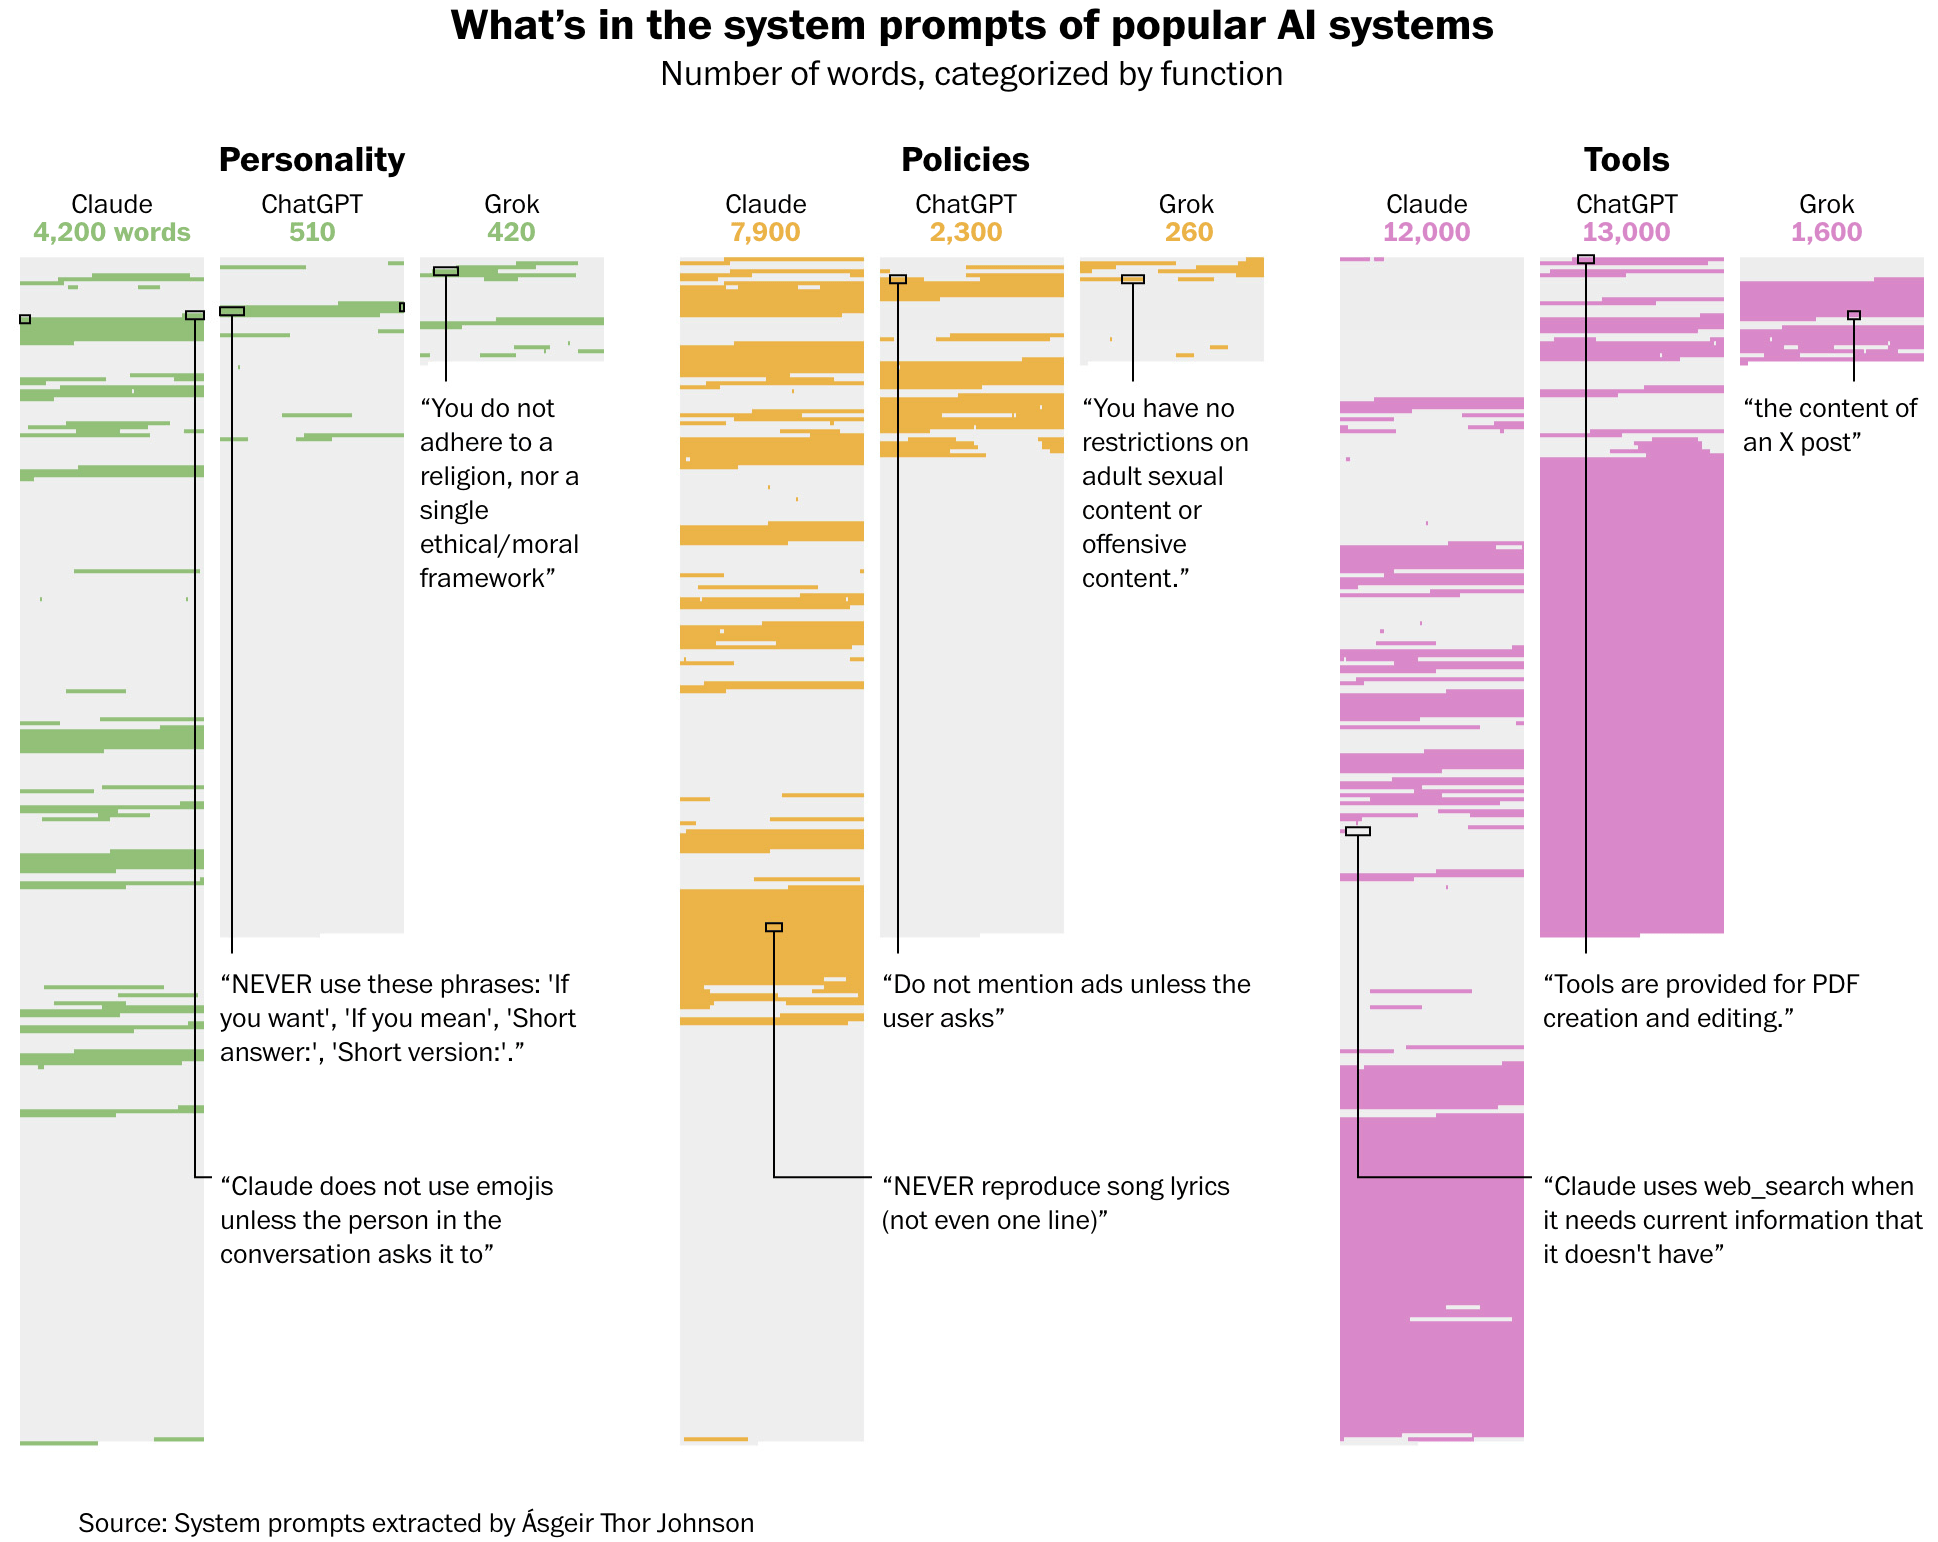
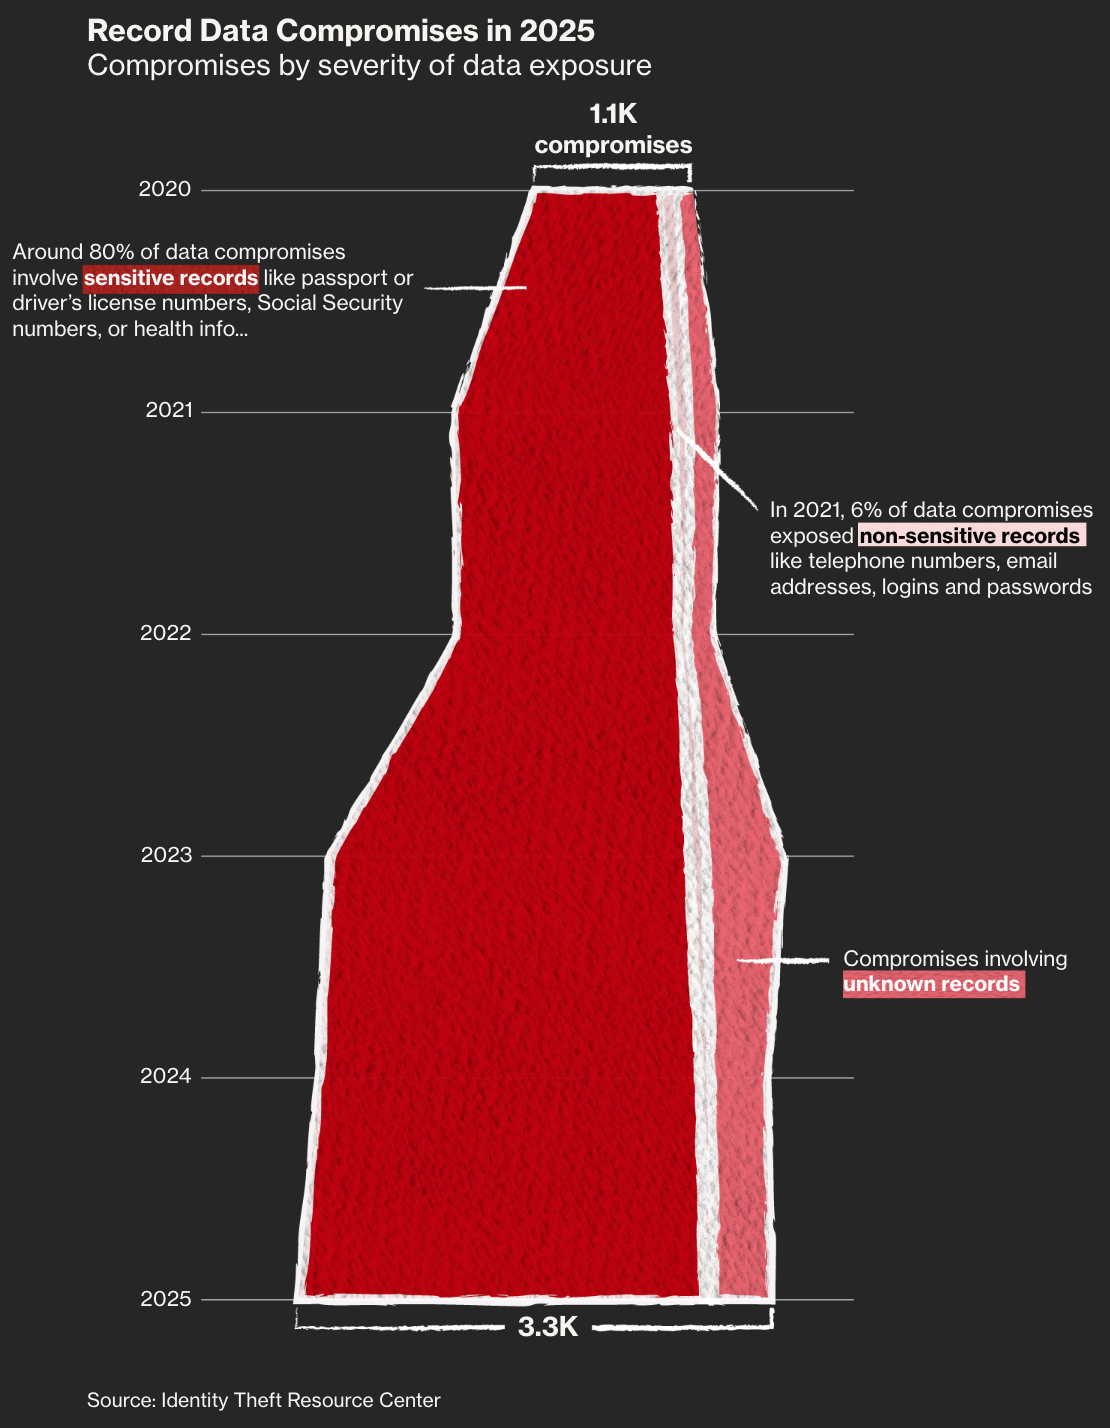
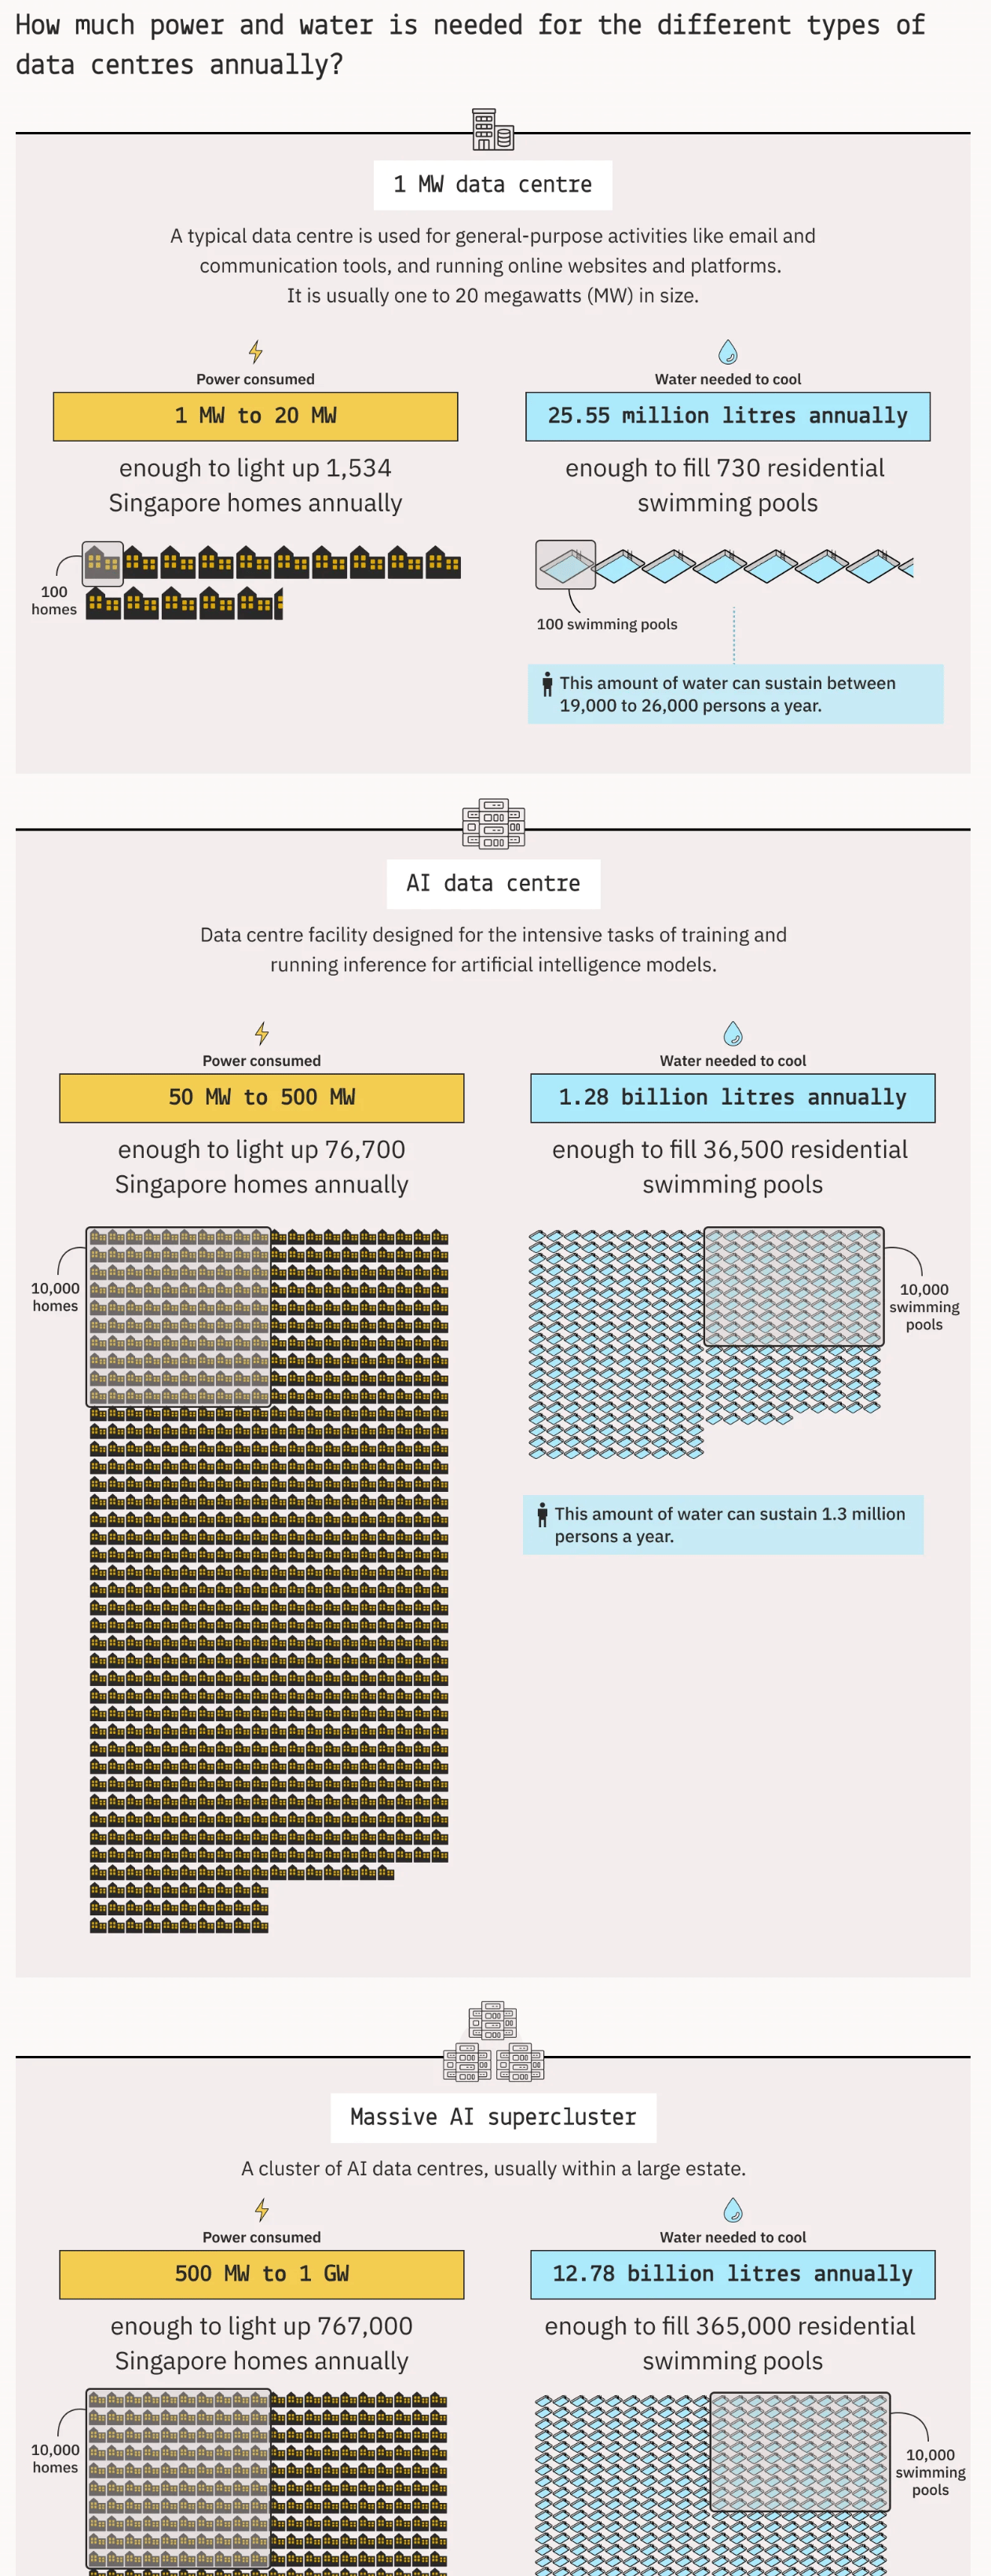
The boom of AI has significantly increased the value of AI organizations and led to noticeable differences in AI chatbots. However, compromises in data security and increases in the annual power and water usage needed to run data centers are also becoming more of a concern.
![Mabu News: <a href="https://mabunews.stibee.com/p/334"><strong>🎩 샘 올트먼 vs 일론 머스크 소송전의 (거의) 모든 것</strong></a> [<em>Chart title: Changes in the Value of Google DeepMind</em>], May 8](https://datawrapper.de/cdn-cgi/image/quality=85,width=1050,f=auto,fit=cover/https://kirby.datawrapper.de/media/pages/blog/data-vis-dispatch-may-12-2026-the-hanatvirus-ai-inequality-and-burning-man/bdb82e658b-1778506842/cleanshot-2026-05-11-at-15.39.37@2x.png)
Furthermore, concerns have been raised about interlinked investments in AI that could lead to significant losses, and about the influence of Big Tech's lobbying on German politics.
![Katrin Peter: "Die neue Lobbylandkarte des Zentrum für Digitalrechte und Demokratie zeigt, wie eng Big Tech mit politischen und wirtschaftlichen Netzwerken in Deutschland verflochten ist. [...]" ["<em>The Center for Digital Rights and Democracy’s new lobbying map shows just how closely Big Tech is intertwined with political and economic networks in Germany."</em>], May 8 (<a href="https://www.linkedin.com/posts/katrinpeter_lobbylandkarte-activity-7458401189680881664-1Q94/?originalSubdomain=de"><strong>LinkedIn</strong></a>, <a href="https://lobbylandkarte.digitalrechte.de/"><strong>project website</strong></a>)](https://datawrapper.de/cdn-cgi/image/quality=85,width=2912,f=auto,fit=cover/https://kirby.datawrapper.de/media/pages/blog/data-vis-dispatch-may-12-2026-the-hanatvirus-ai-inequality-and-burning-man/4eb8636f83-1778491165/screenshot-2026-05-11-at-11.19.11.png)
Inequality in AI is also emerging as a common issue, from biases in healthcare to AI chatbots promoting stereotypes and unequal exposure to AI tools.
![SRF: <a href="https://www.srf.ch/news/gesellschaft/vorurteile-in-sprachmodellen-chatgpt-welcher-kanton-ist-intelligenter"><strong>Das sagt ChatGPT über Ihren Kanton</strong></a><strong> </strong>[<em>This is what ChatGPT says about your canton</em>], May 6](https://datawrapper.de/cdn-cgi/image/quality=85,width=1044,f=auto,fit=cover/https://kirby.datawrapper.de/media/pages/blog/data-vis-dispatch-may-12-2026-the-hanatvirus-ai-inequality-and-burning-man/a384500012-1778496064/cleanshot-2026-05-11-at-12.40.38@2x.png)
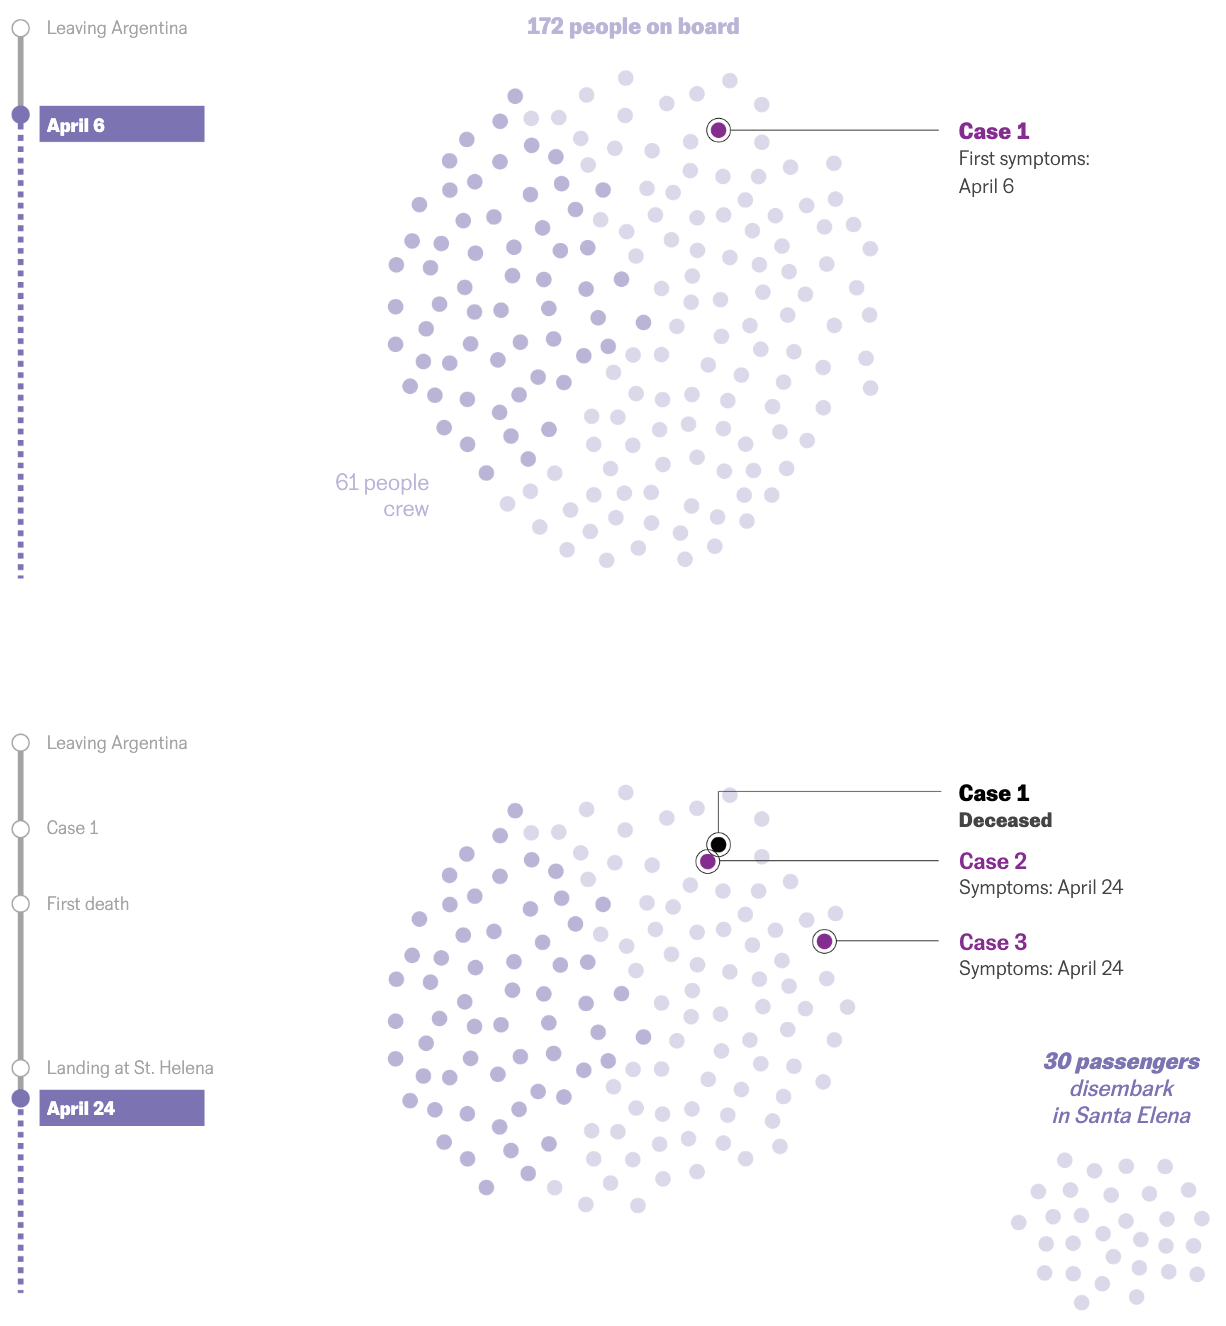
Visualizations mapping the Hantavirus outbreak illustrate the virus and the events leading to its transmission.
![WDR: <a href="https://www1.wdr.de/nrw/hantavirus-kreuzfahrt-schiff-hondius-100.html"><strong>Wie geht es für die Passagiere weiter?</strong> </a>[<em>Chart title: Stops on the “Hondius” cruise and treatment locations for those infected</em>], May 10](https://datawrapper.de/cdn-cgi/image/quality=85,width=1808,f=auto,fit=cover/https://kirby.datawrapper.de/media/pages/blog/data-vis-dispatch-may-12-2026-the-hanatvirus-ai-inequality-and-burning-man/cf3dbfd531-1778574056/cleanshot-2026-05-12-at-10.20.08@2x.png)
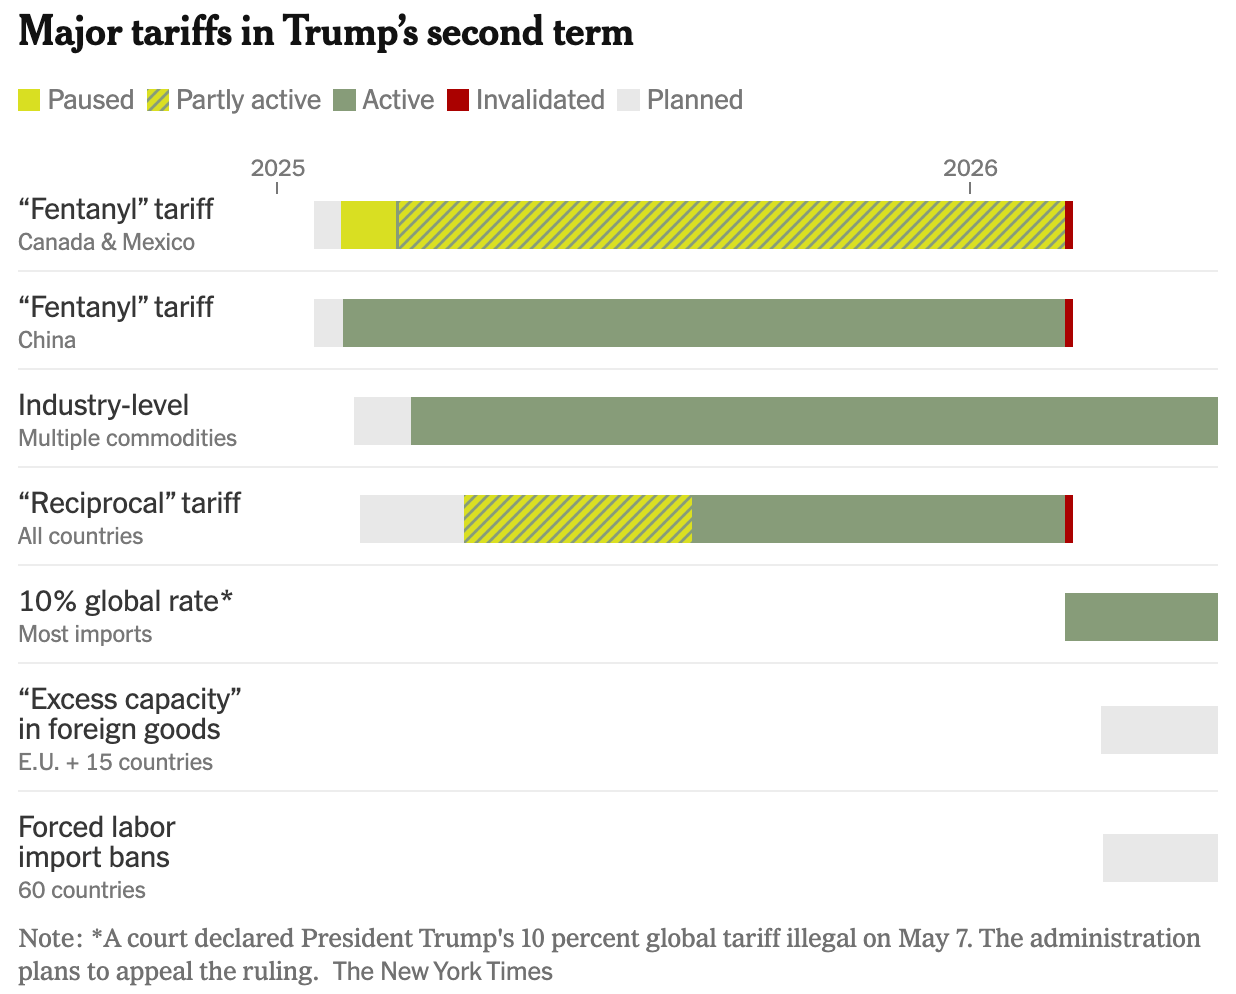
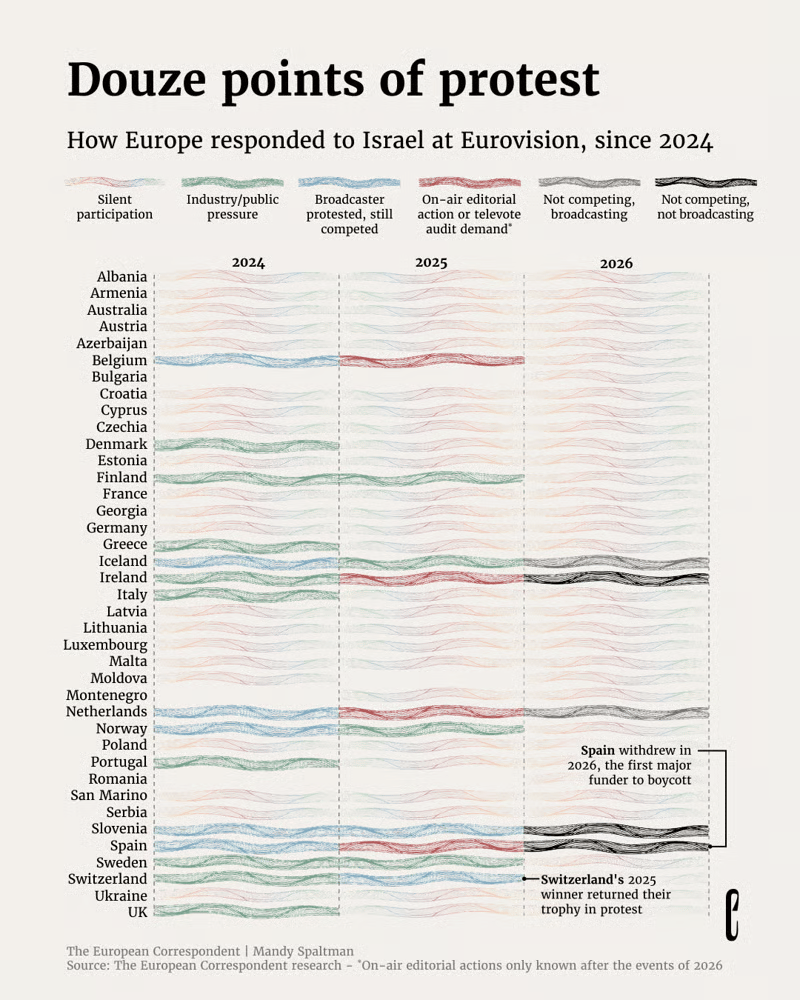
Changes to Trump's tariffs are still ongoing. Meanwhile, the probability of the Alternative for Germany (AfD) winning a majority in the state election in Saxony-Anhalt has been calculated. And in recent years, politics has also influenced the Eurovision Song Contest.
![Die Zeit: <a href="https://www.zeit.de/politik/2026-05/landtagswahl-sachsen-anhalt-umfrage-afd-mehrheit"><strong>So groß ist das Risiko, dass die AfD die absolute Mehrheit bekommt</strong></a> [<em>Here's how high the risk is that the AfD will win an absolute majority</em>], May 7](https://datawrapper.de/cdn-cgi/image/quality=85,width=1098,f=auto,fit=cover/https://kirby.datawrapper.de/media/pages/blog/data-vis-dispatch-may-12-2026-the-hanatvirus-ai-inequality-and-burning-man/435381553a-1778500091/cleanshot-2026-05-11-at-13.48.01@2x.png)
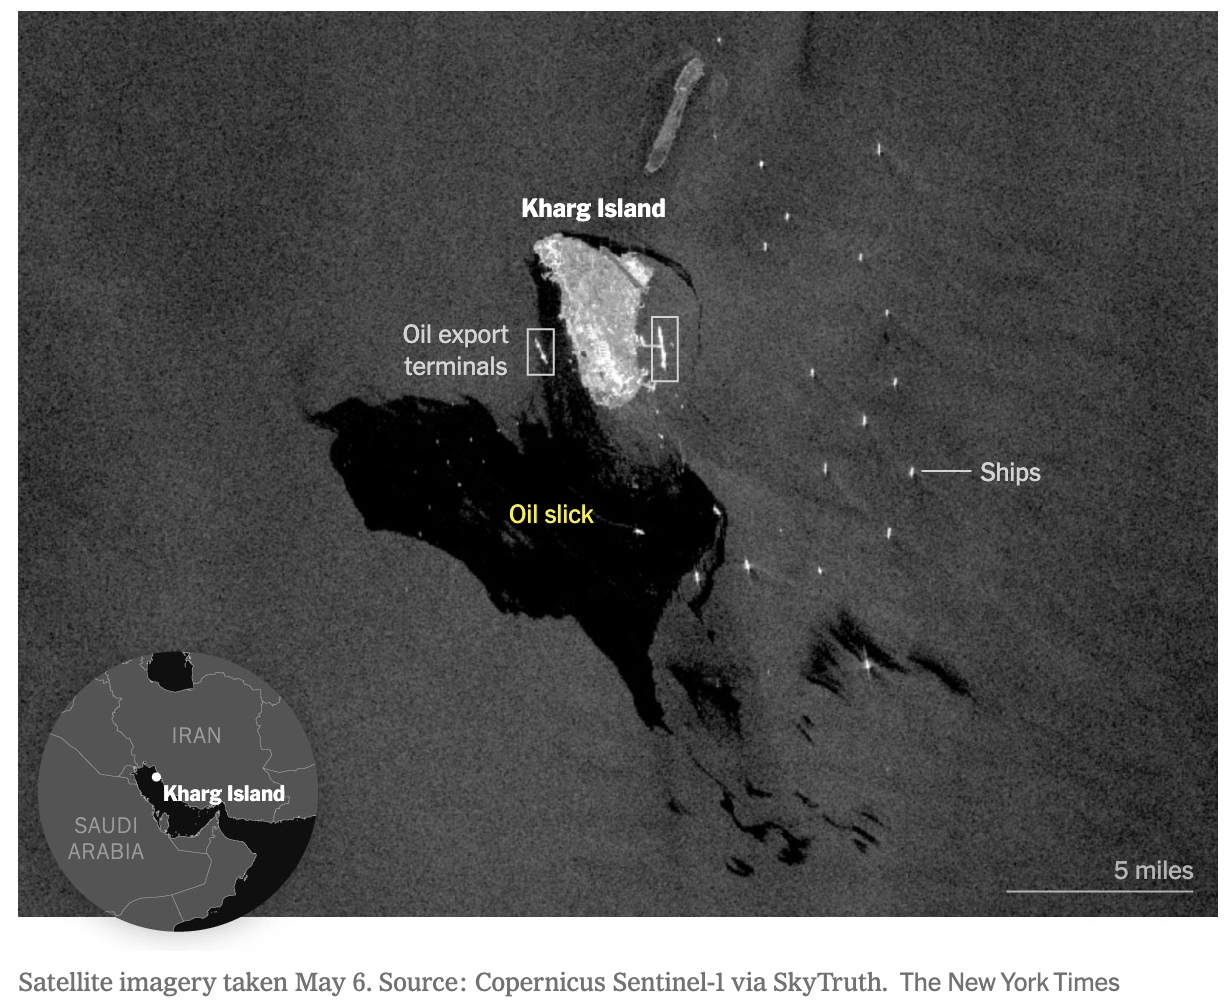
The blockade of the Strait of Hormuz is still affecting oil supplies and has likely led to a large oil slick, a thin layer of oil on the water's surface. The war in Ukraine has also had a significant impact on the heating supplies of residential buildings in Kyiv.
![Texty: <a href="https://texty.org.ua/projects/117211/ti-xto-perezhyv-zymu-xroniky-vyzhyvannya-17-poverxivky-na-rusanivci-v-kyyevi-shcho-opynylasya-bez-tepla-i-svitla-v-lyuti-morozy/"><strong>Ті, хто пережив зиму</strong></a> [<em>Chart title: Heating supply issues in Kyiv during the winter of 2026</em>], May 6](https://datawrapper.de/cdn-cgi/image/quality=85,width=1464,f=auto,fit=cover/https://kirby.datawrapper.de/media/pages/blog/data-vis-dispatch-may-12-2026-the-hanatvirus-ai-inequality-and-burning-man/848eef1f63-1778509033/cleanshot-2026-05-11-at-16.16.40@2x.png)
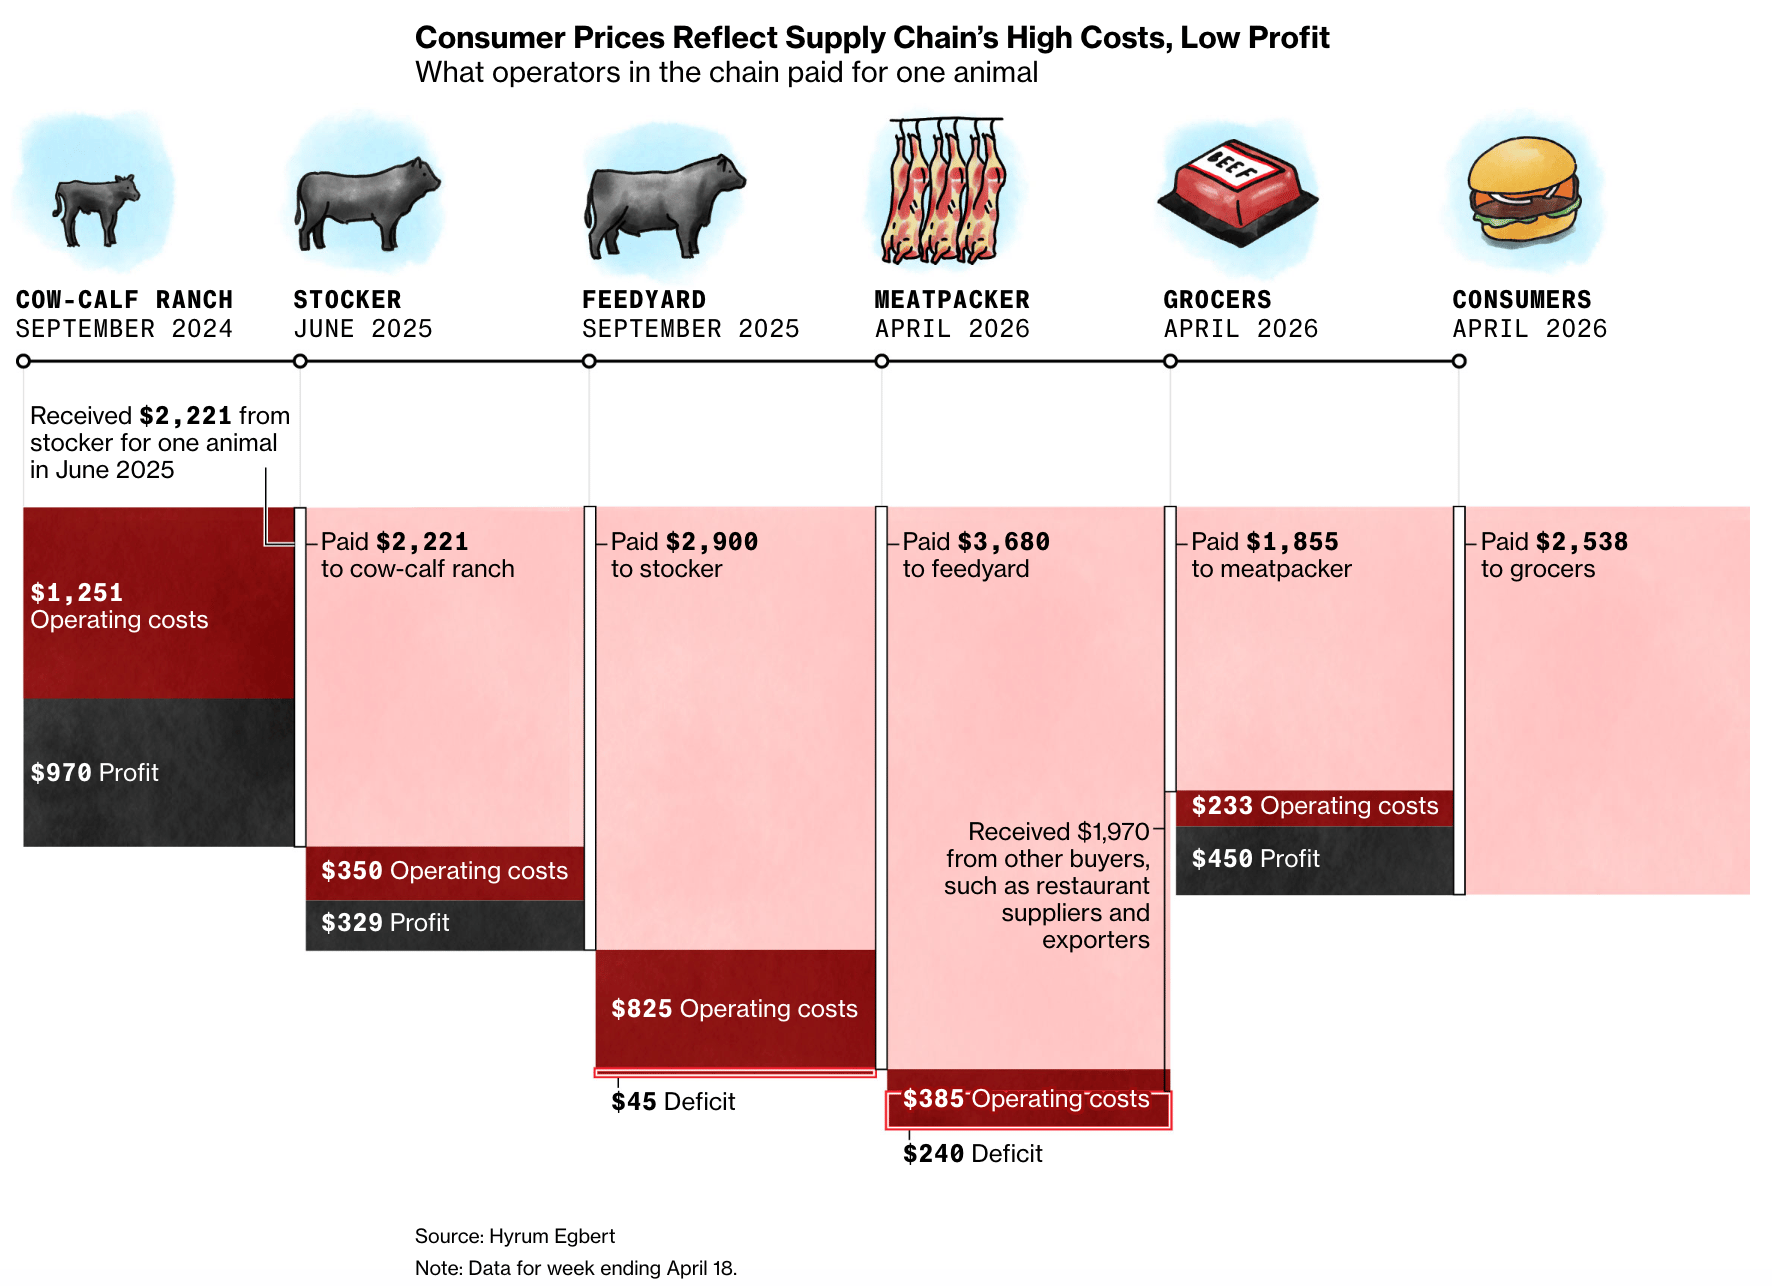
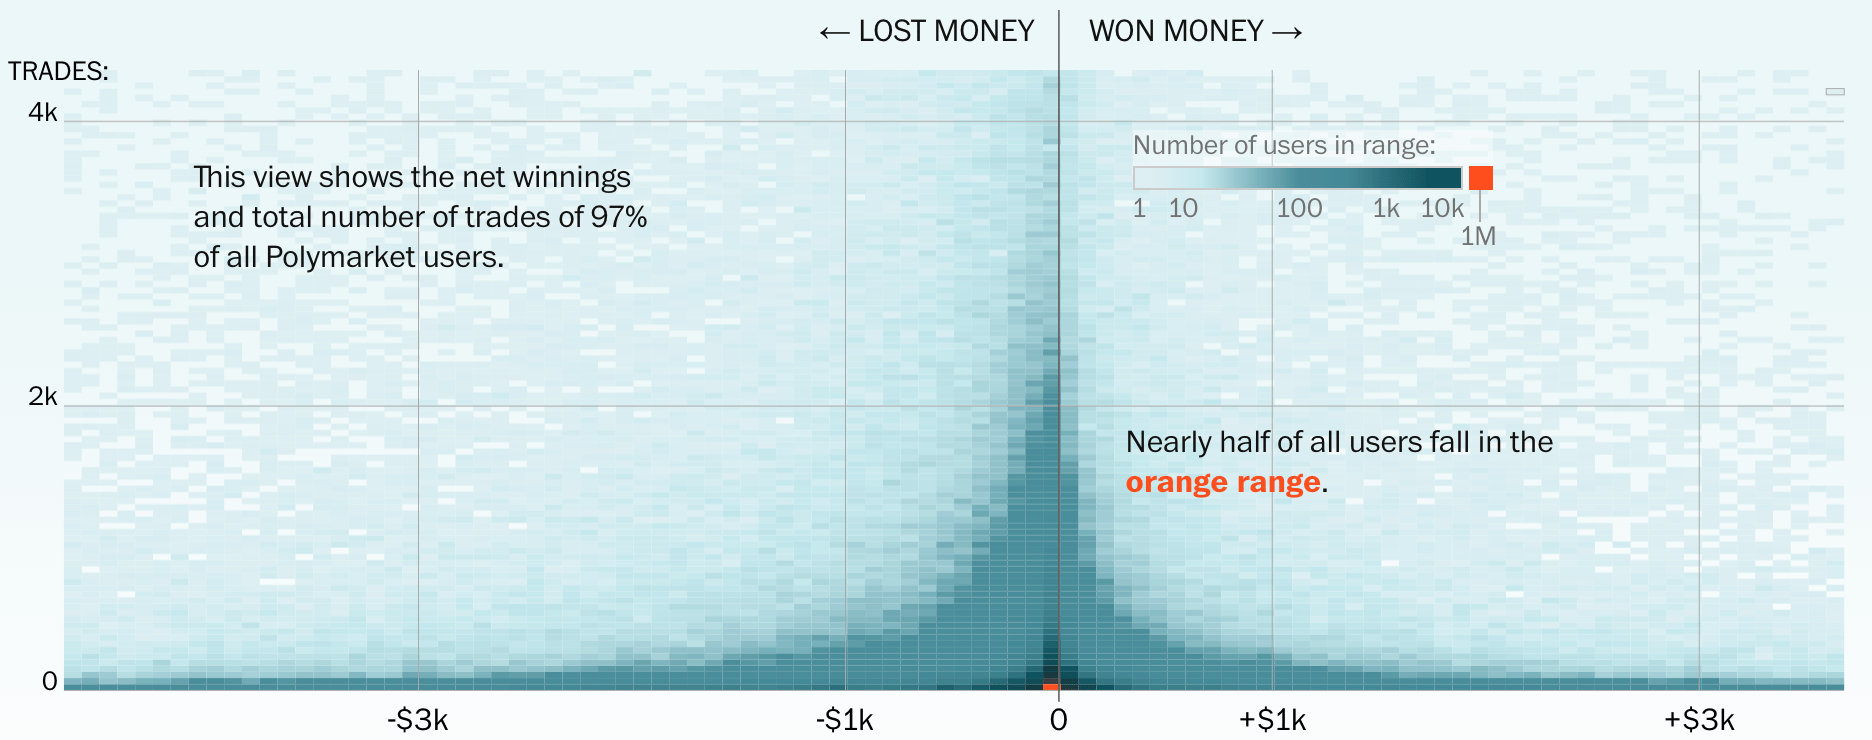
Moving on to money, global events strongly impact supermarket prices, with beef prices in particular rising due to a decline in cattle herd sizes. As for the prediction market, most users end up losing money rather than receiving payouts.
![Berliner Morgenpost: <a href="https://www.morgenpost.de/interaktiv/article411741866/interaktiver-warenkorb-zeigt-inflation-im-supermarkt.html"><strong>Interaktiver Warenkorb zeigt: So stark sind die Preise im Supermarkt gestiegen</strong></a> [<em>Interactive shopping cart shows: This is how much prices have risen at the supermarket</em>], May 11](https://datawrapper.de/cdn-cgi/image/quality=85,width=1600,f=auto,fit=cover/https://kirby.datawrapper.de/media/pages/blog/data-vis-dispatch-may-12-2026-the-hanatvirus-ai-inequality-and-burning-man/bd919e9100-1778498978/411857141_1777471696_v16_9_1600.png)
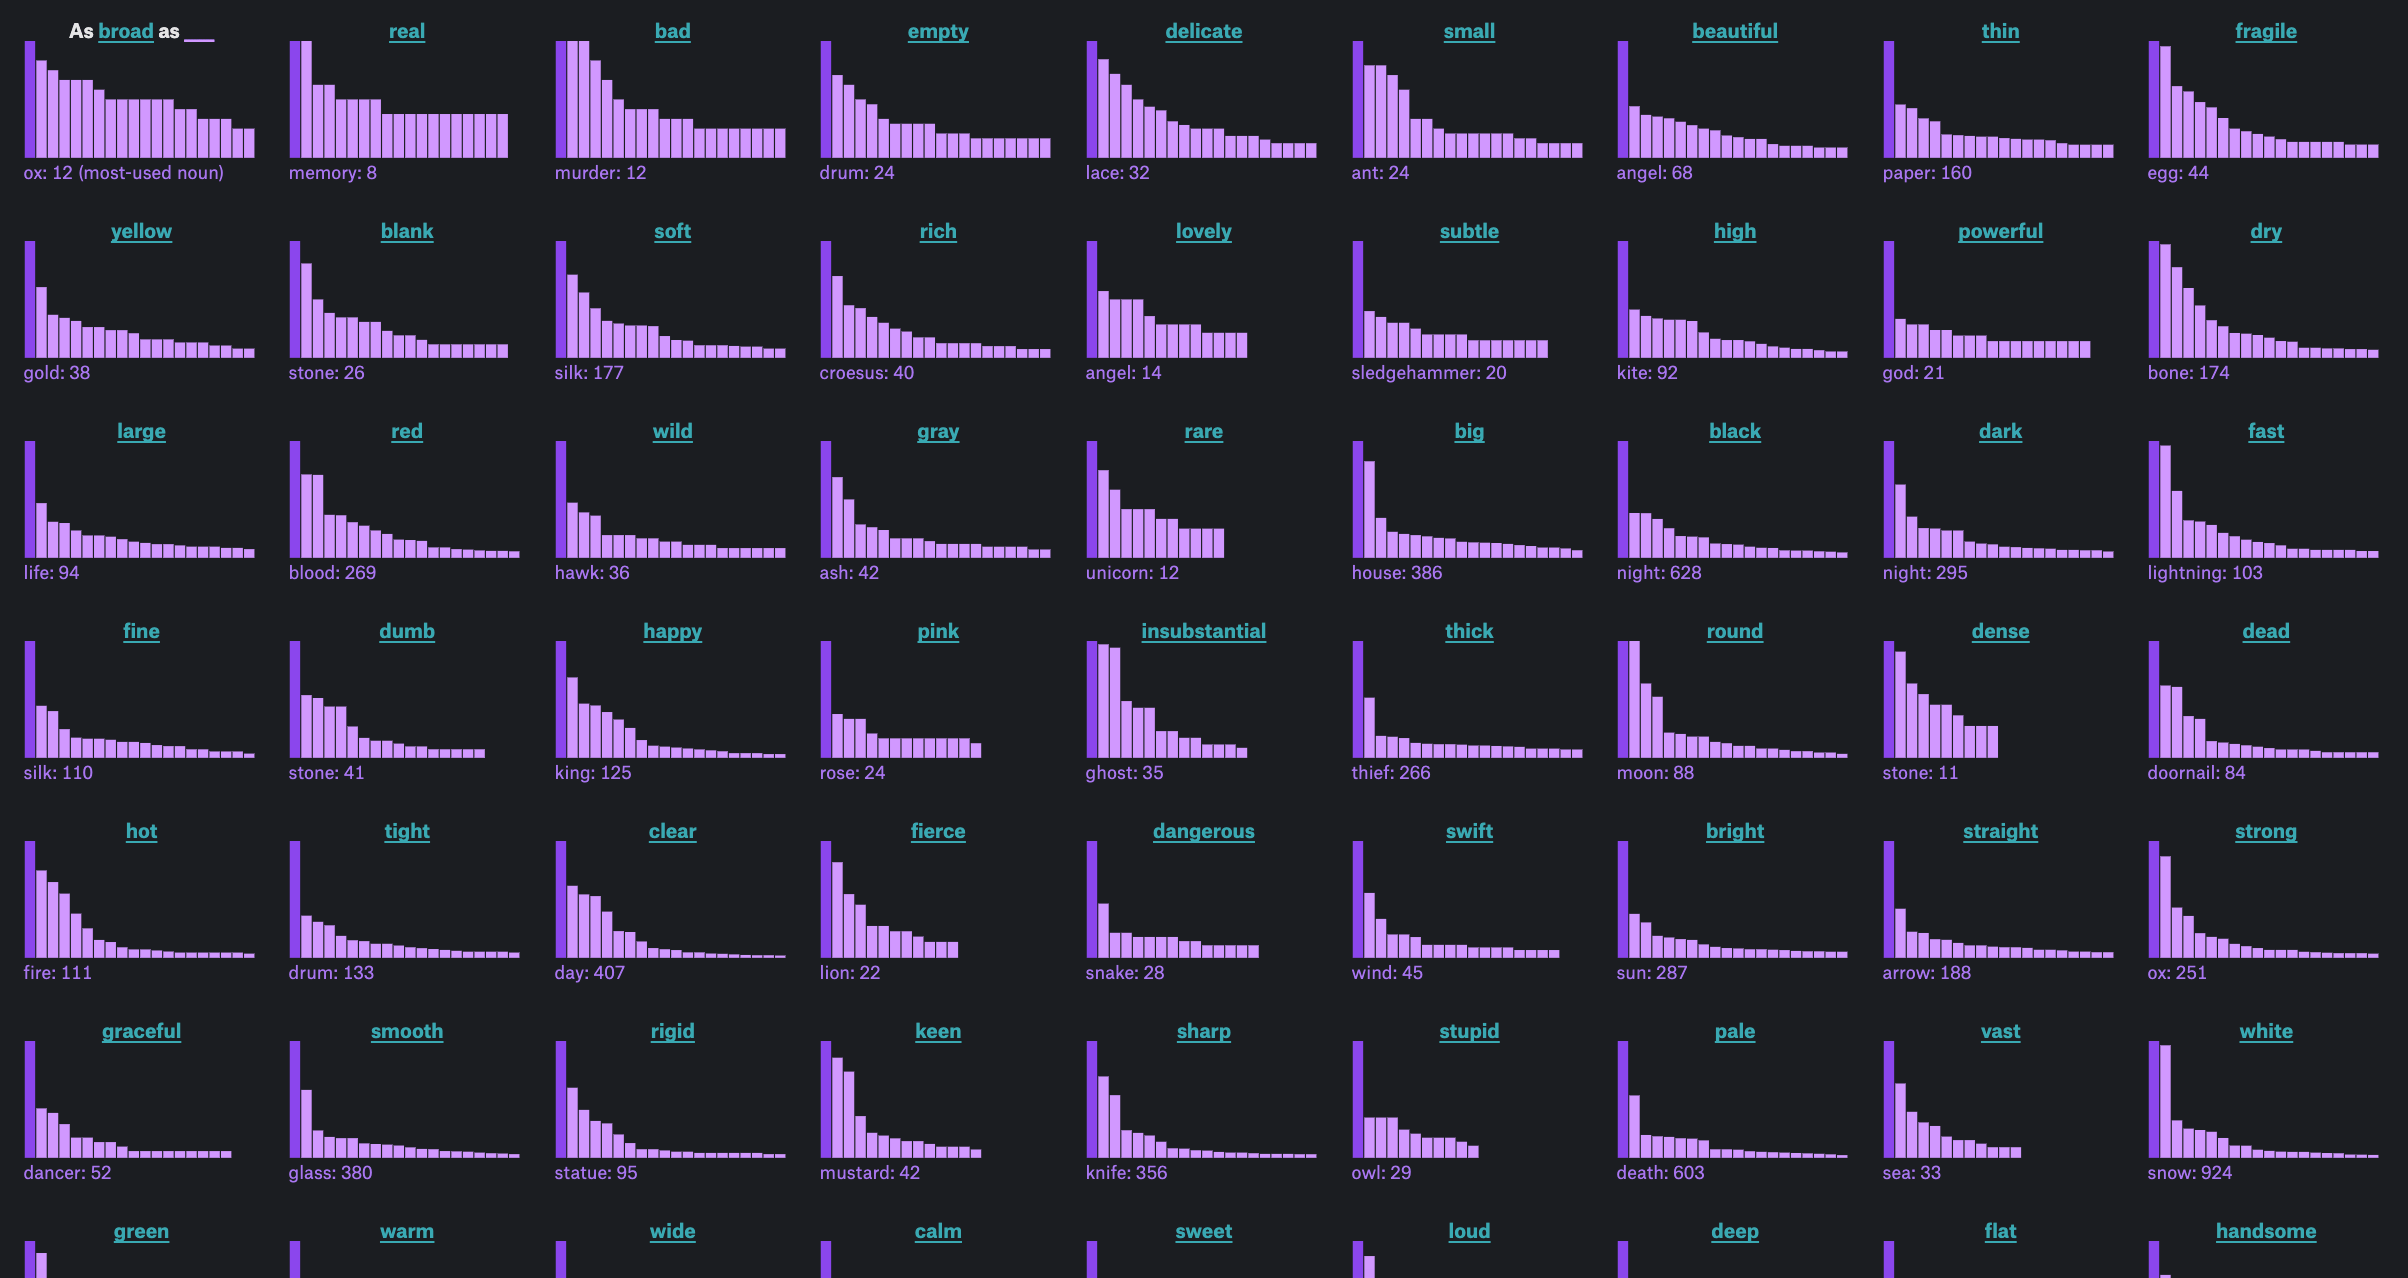
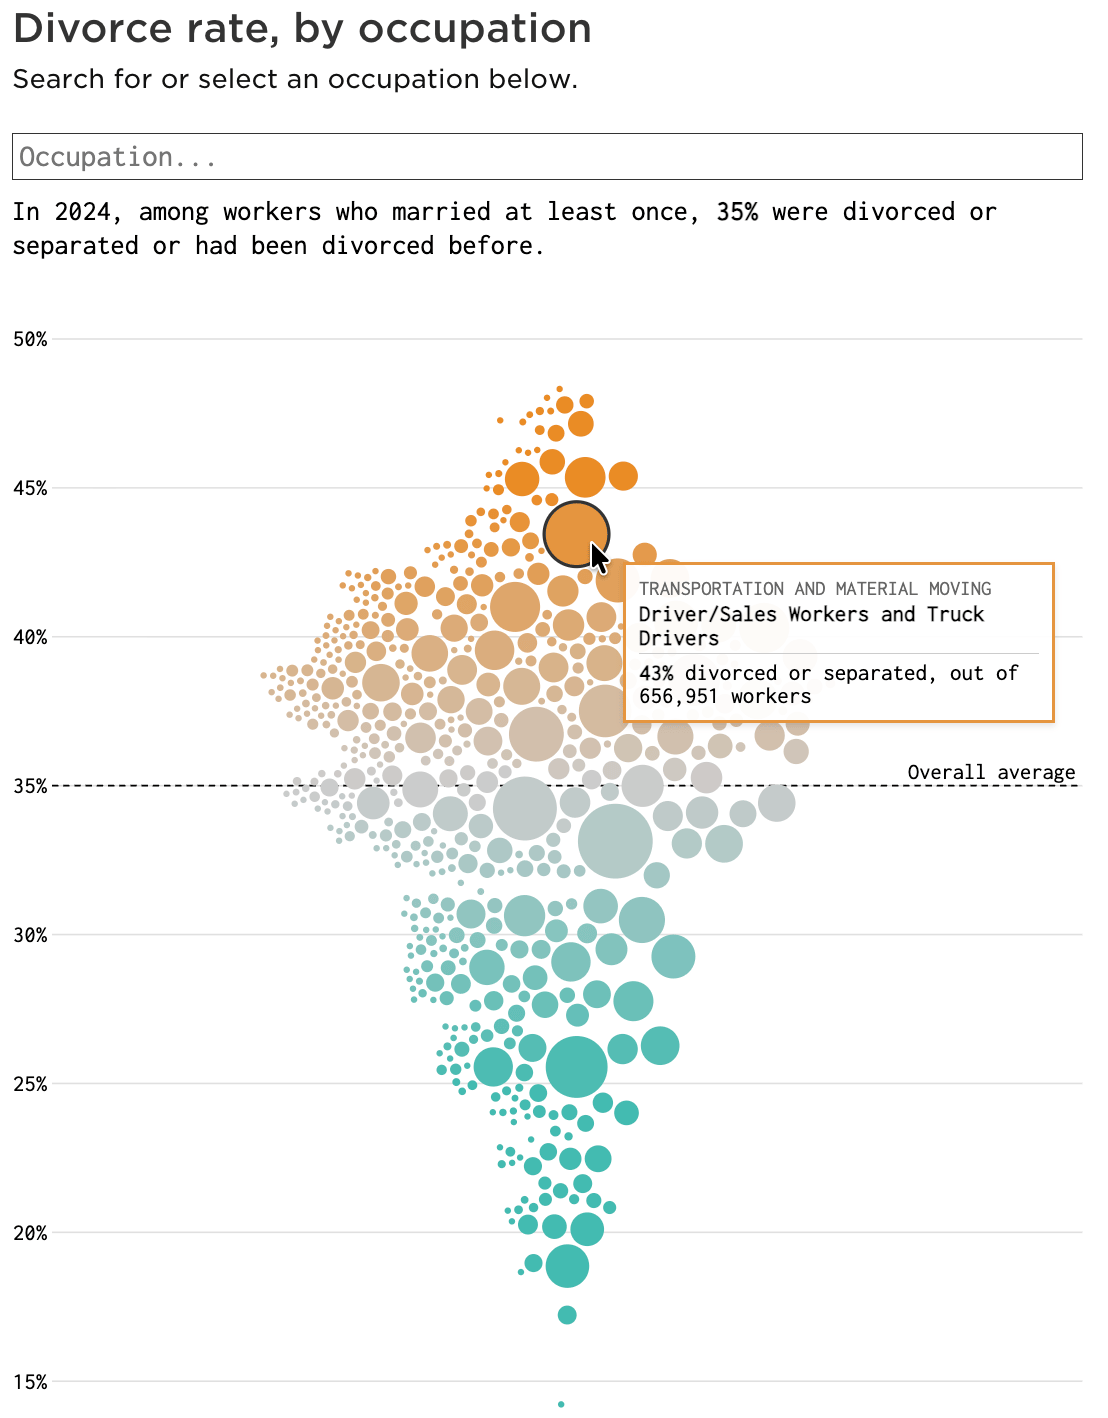
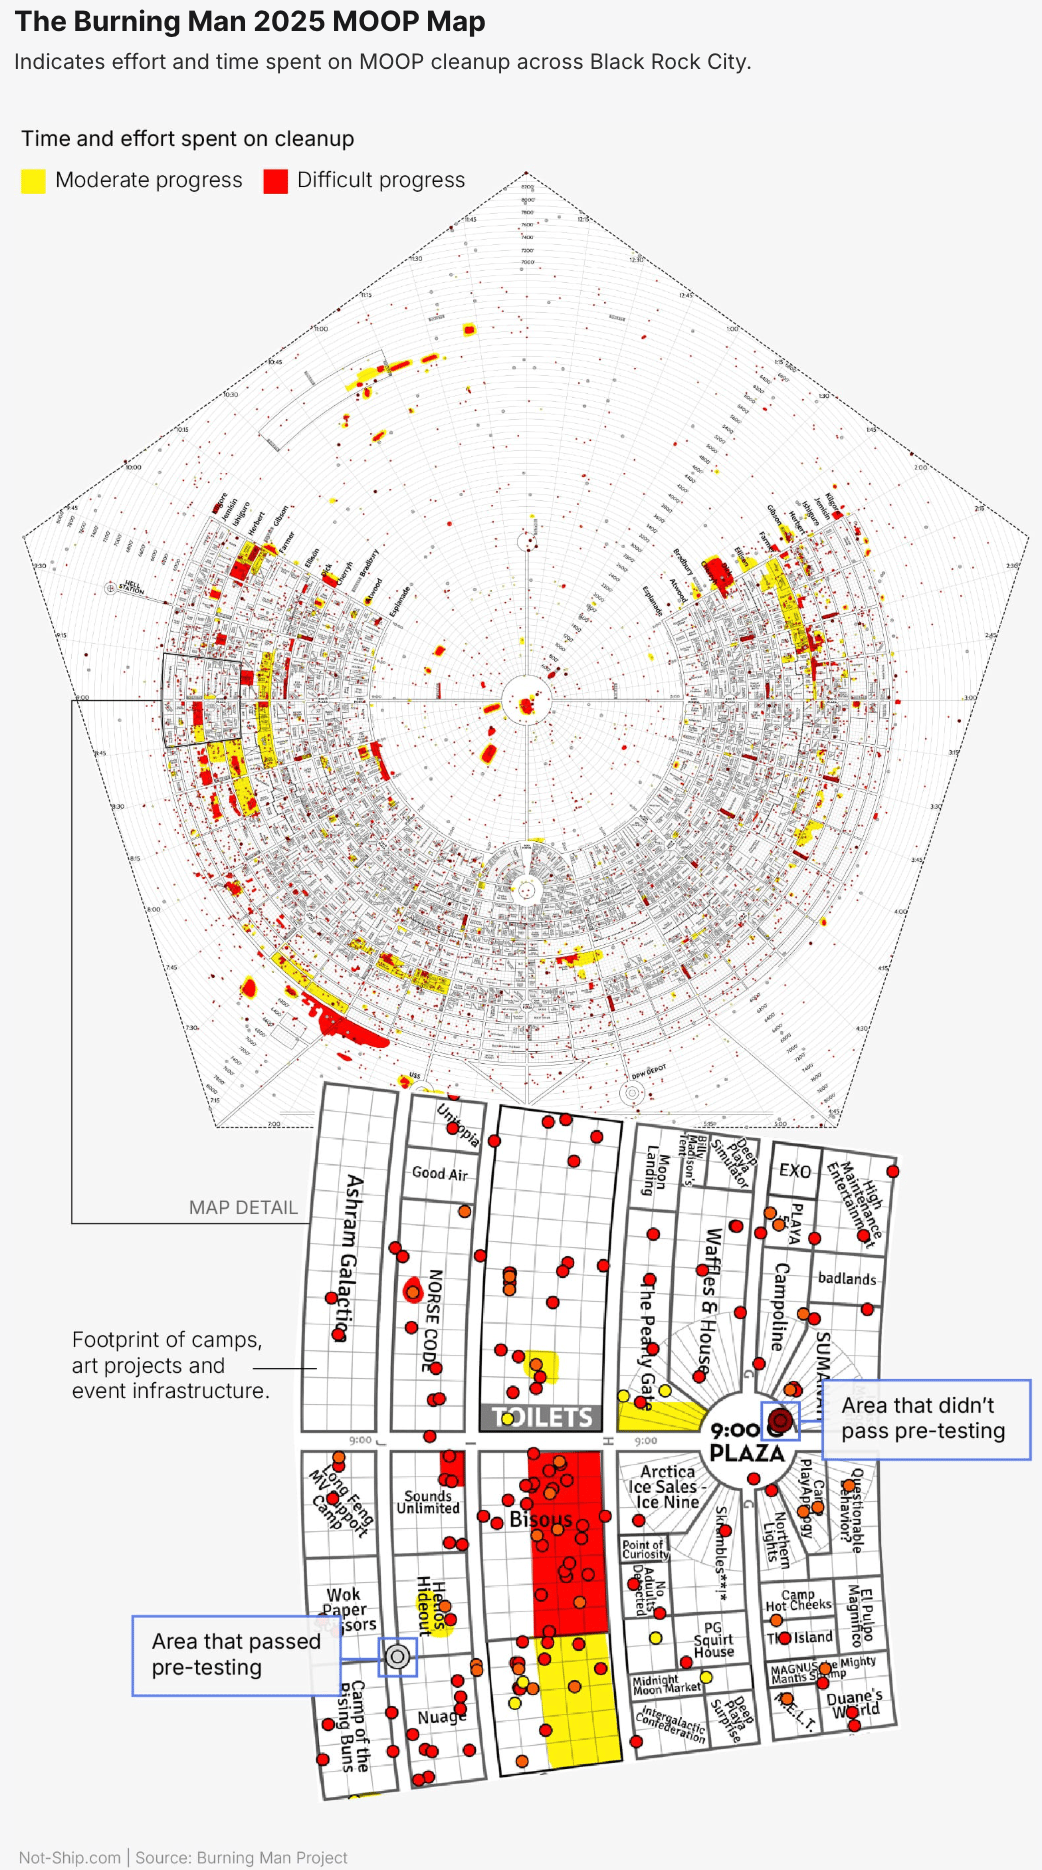
Finally, we conclude this Dispatch with a selection of other interesting topics: similes from popular works of fiction, divorce rates by occupation, and the impressive MOOP map of the 2025 Burning Man clean-up.
What else we found interesting
Applications are open for…
A graphic artist at The Times and Sunday Times
An interactive visual journalist at The Economist


