Data Vis Dispatch, July 22: Energy transition, construction, and China

Welcome back to the 202nd edition of Data Vis Dispatch! Every week, we’ll be publishing a collection of the best small and large data visualizations we find, especially from news organizations — to celebrate data journalism, data visualization, simple charts, elaborate maps, and their creators.
Recurring topics this week include the energy transition, construction, and China.
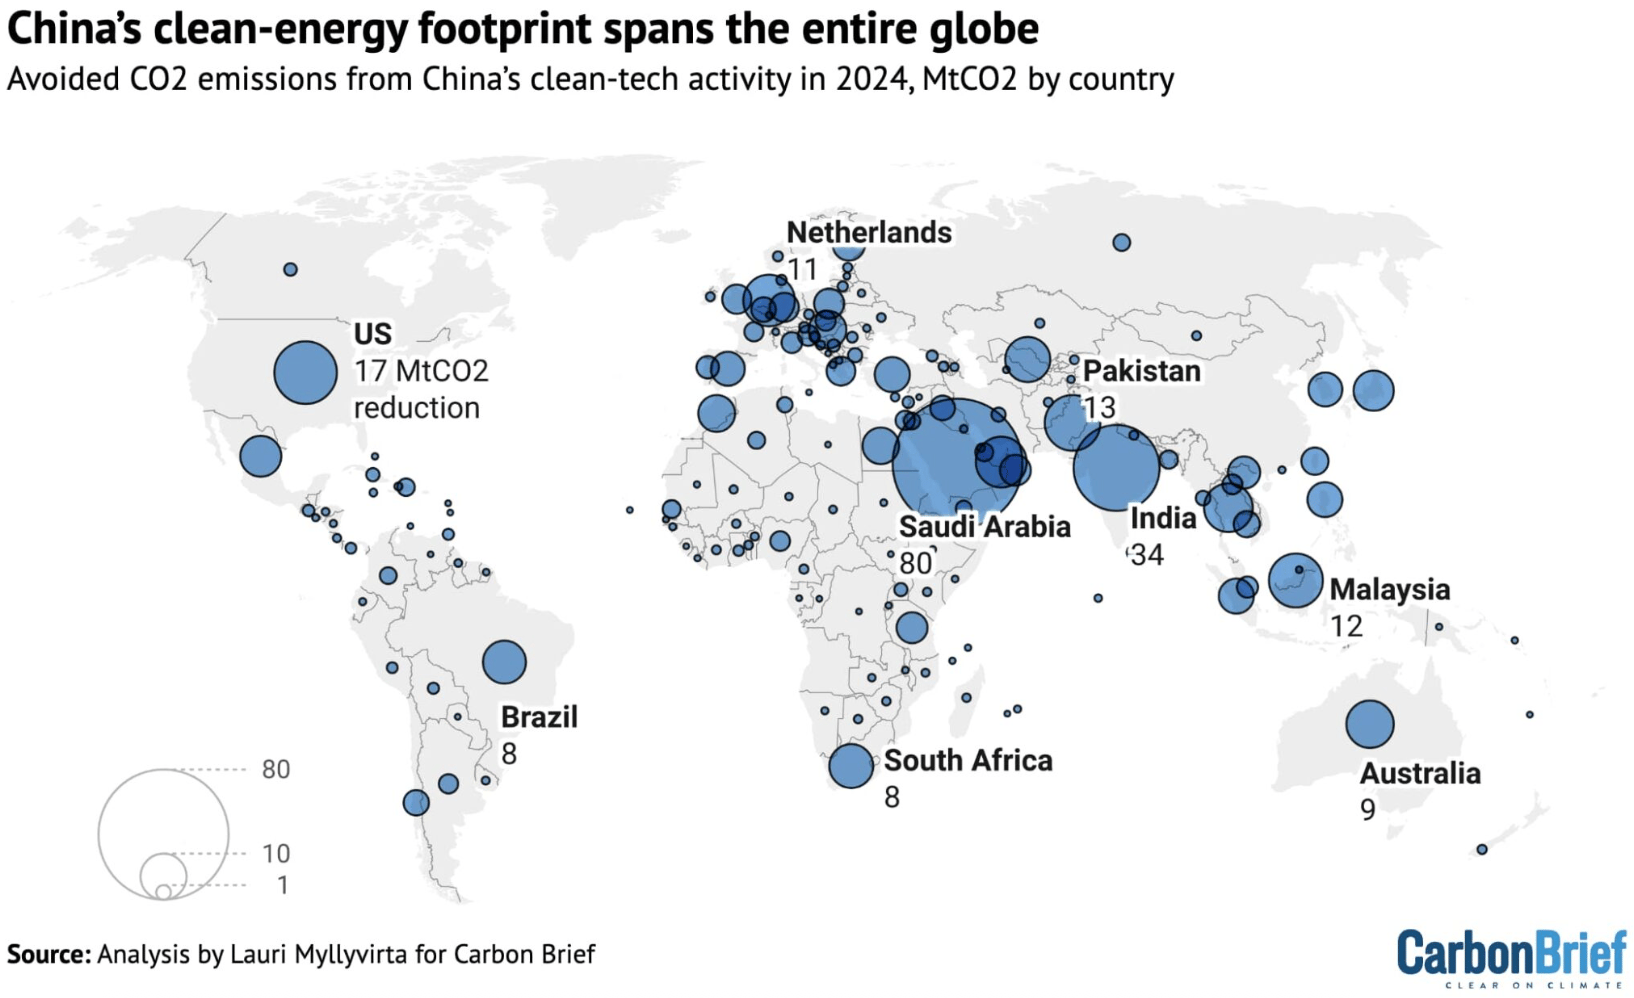
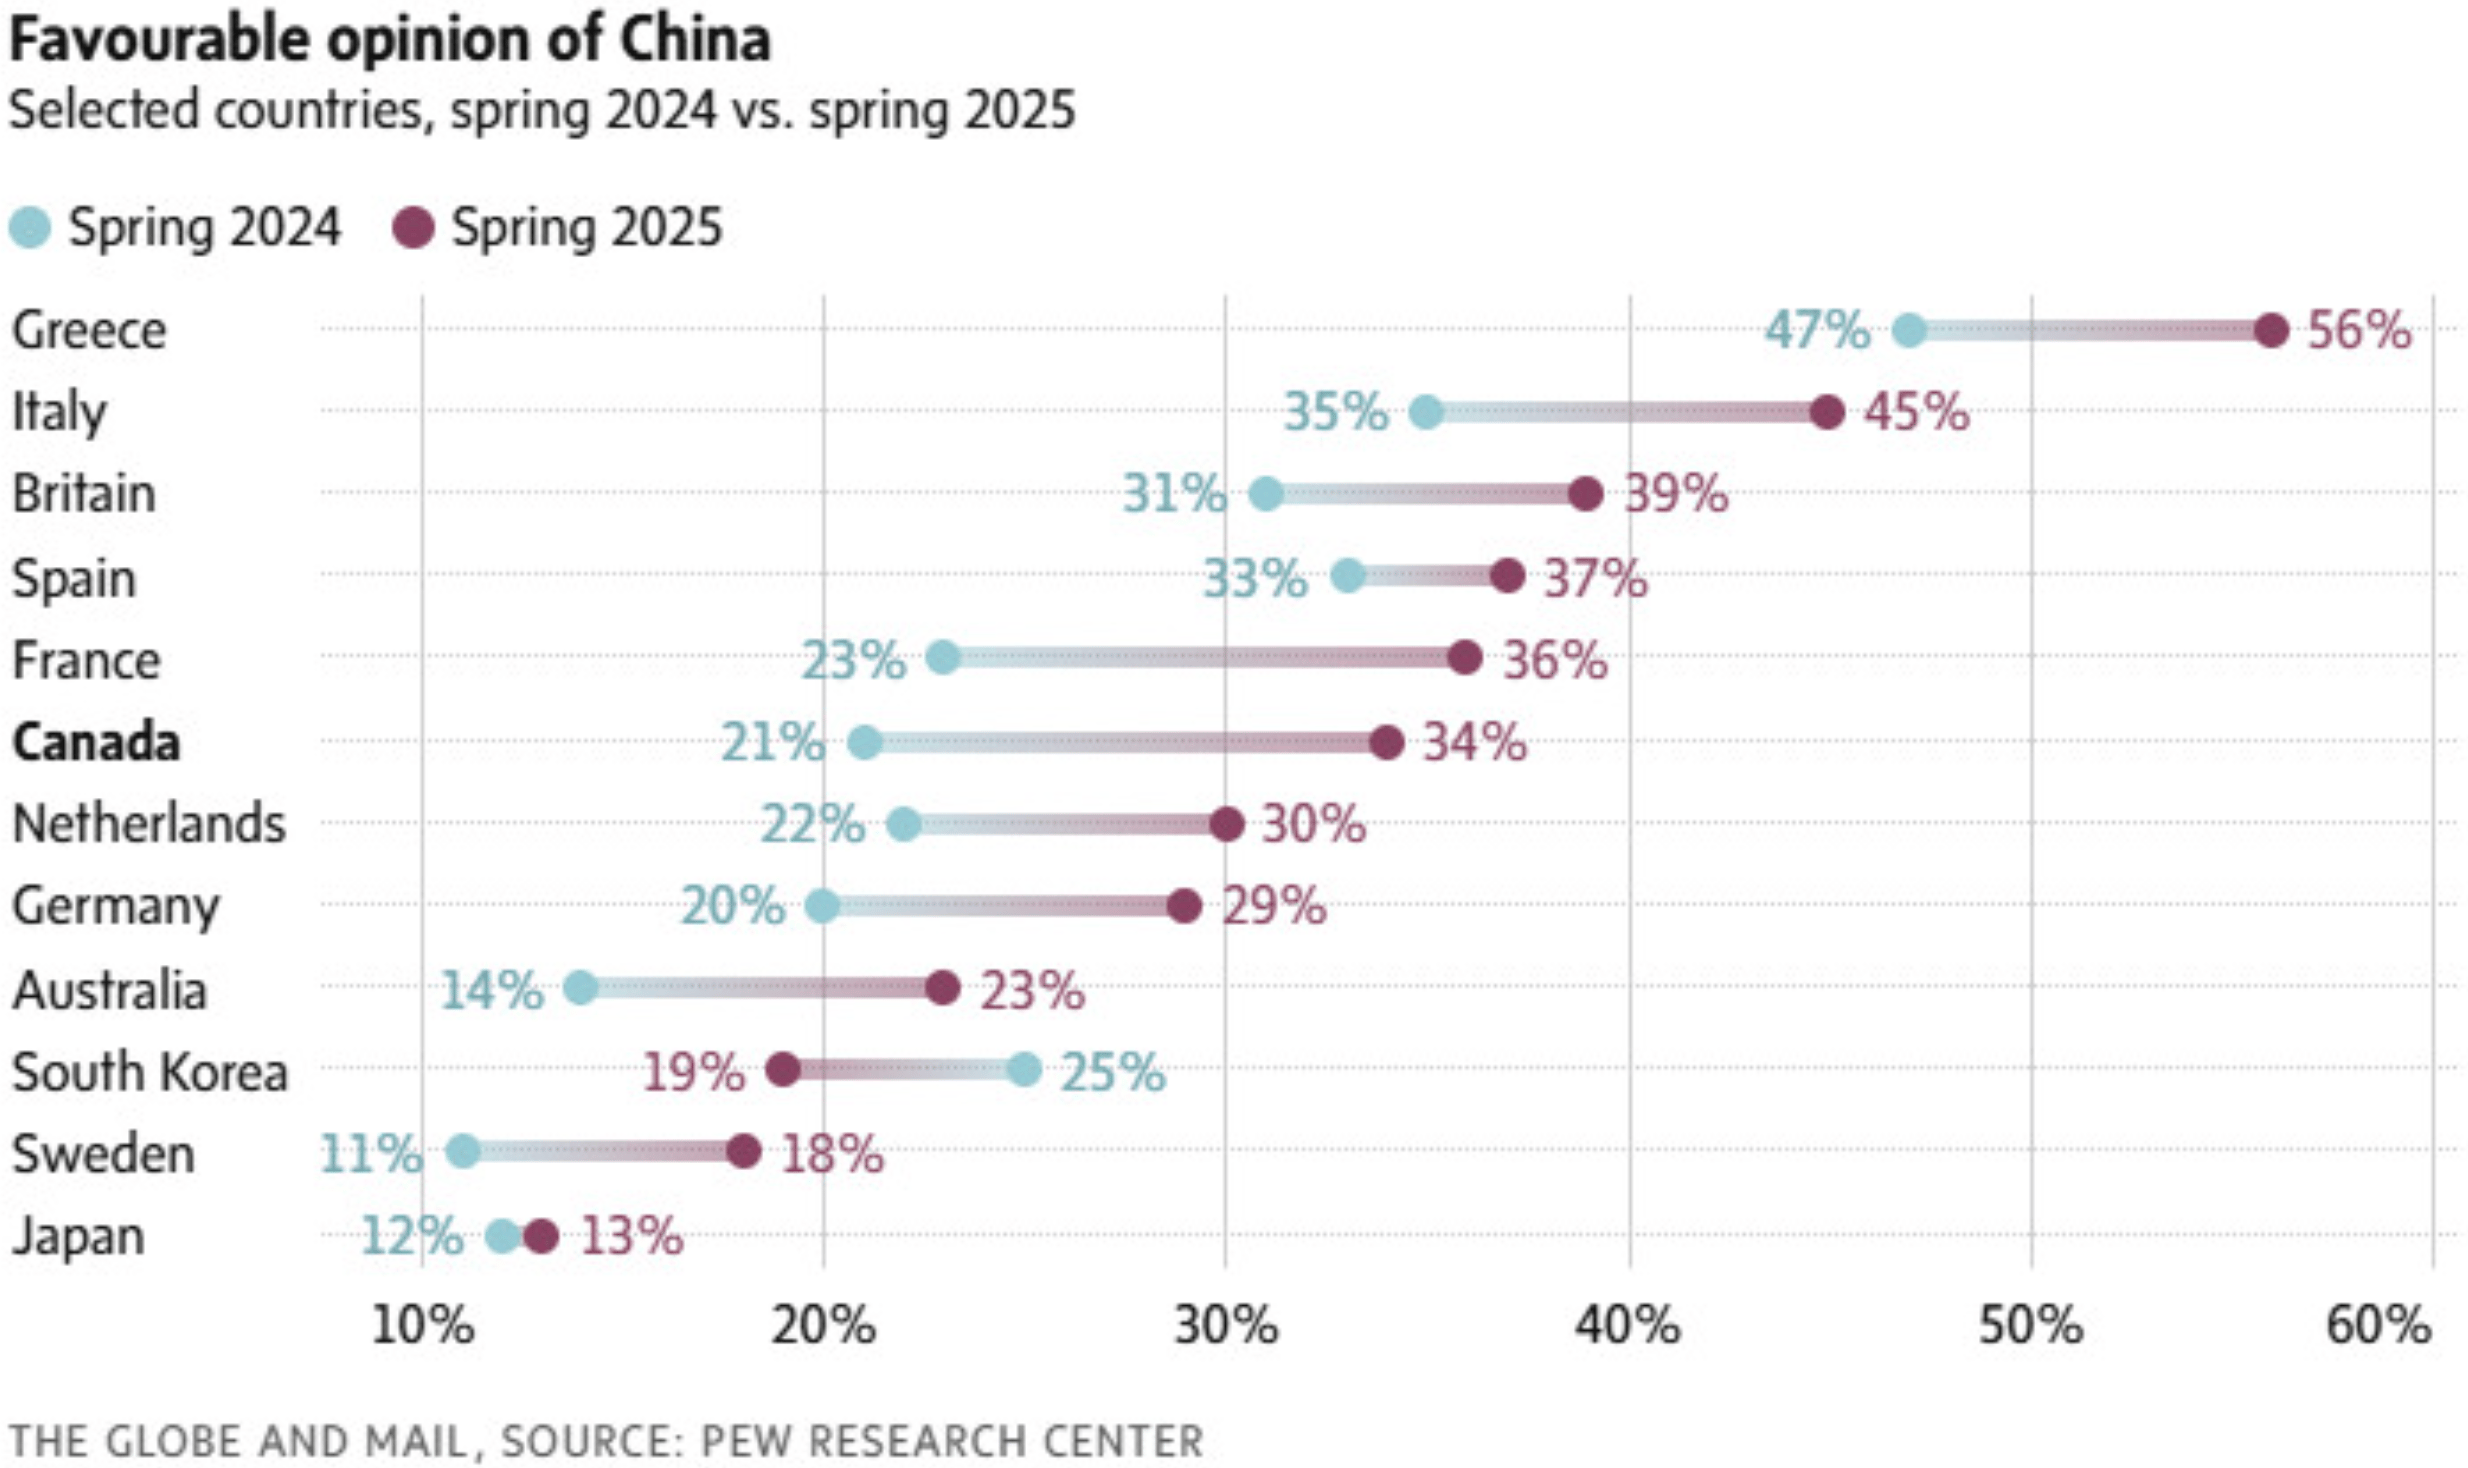
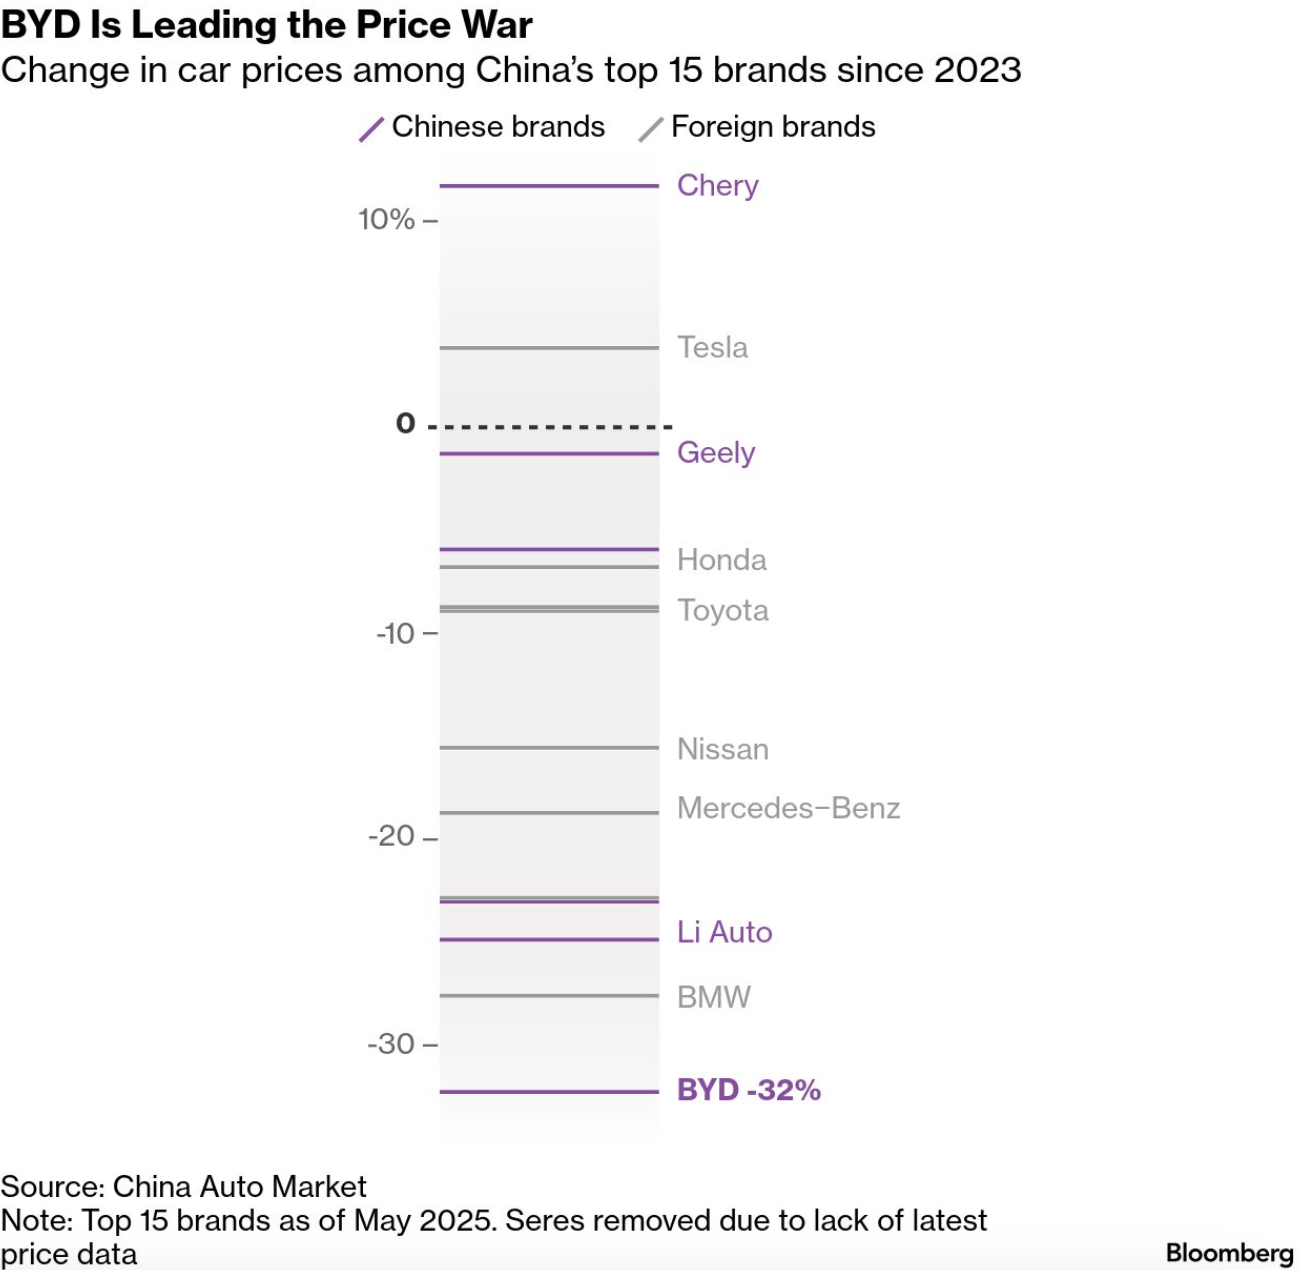
This week, we'll start with a closer look at China, with visualizations covering clean energy, cars, and the country's growing love of durian.
![Newsgraphy: <a href="https://newsgraphy.my/malaysia-durian-production-and-consumption/"><strong>国人平均吃多少公斤榴裢?</strong></a> [<em>How many kilograms of durian do Chinese people eat on average?</em>], July 18](https://datawrapper.de/cdn-cgi/image/quality=85,width=1430,f=auto,fit=cover/https://kirby.datawrapper.de/media/pages/blog/data-vis-dispatch-july-22-2025/04fcefb4ab-1753210574/cleanshot-2025-07-22-at-20.55.52@2x.png)
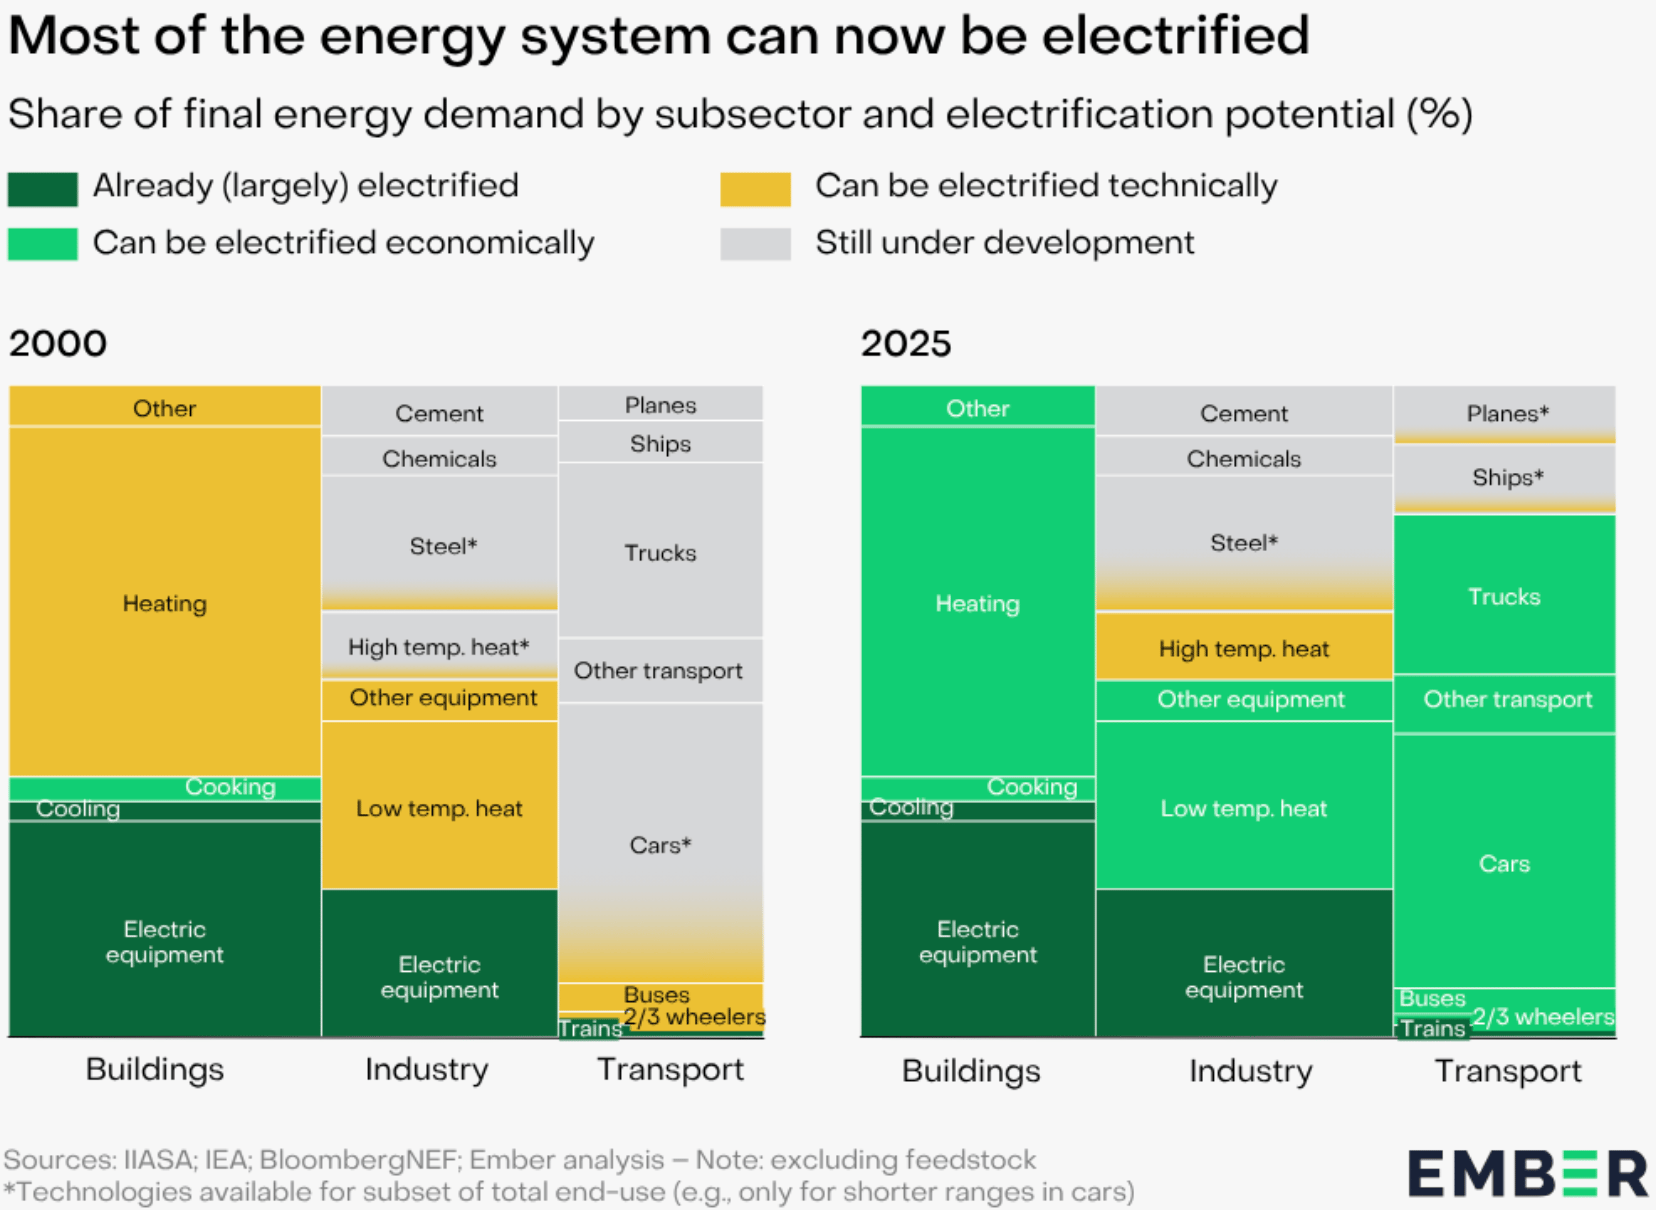
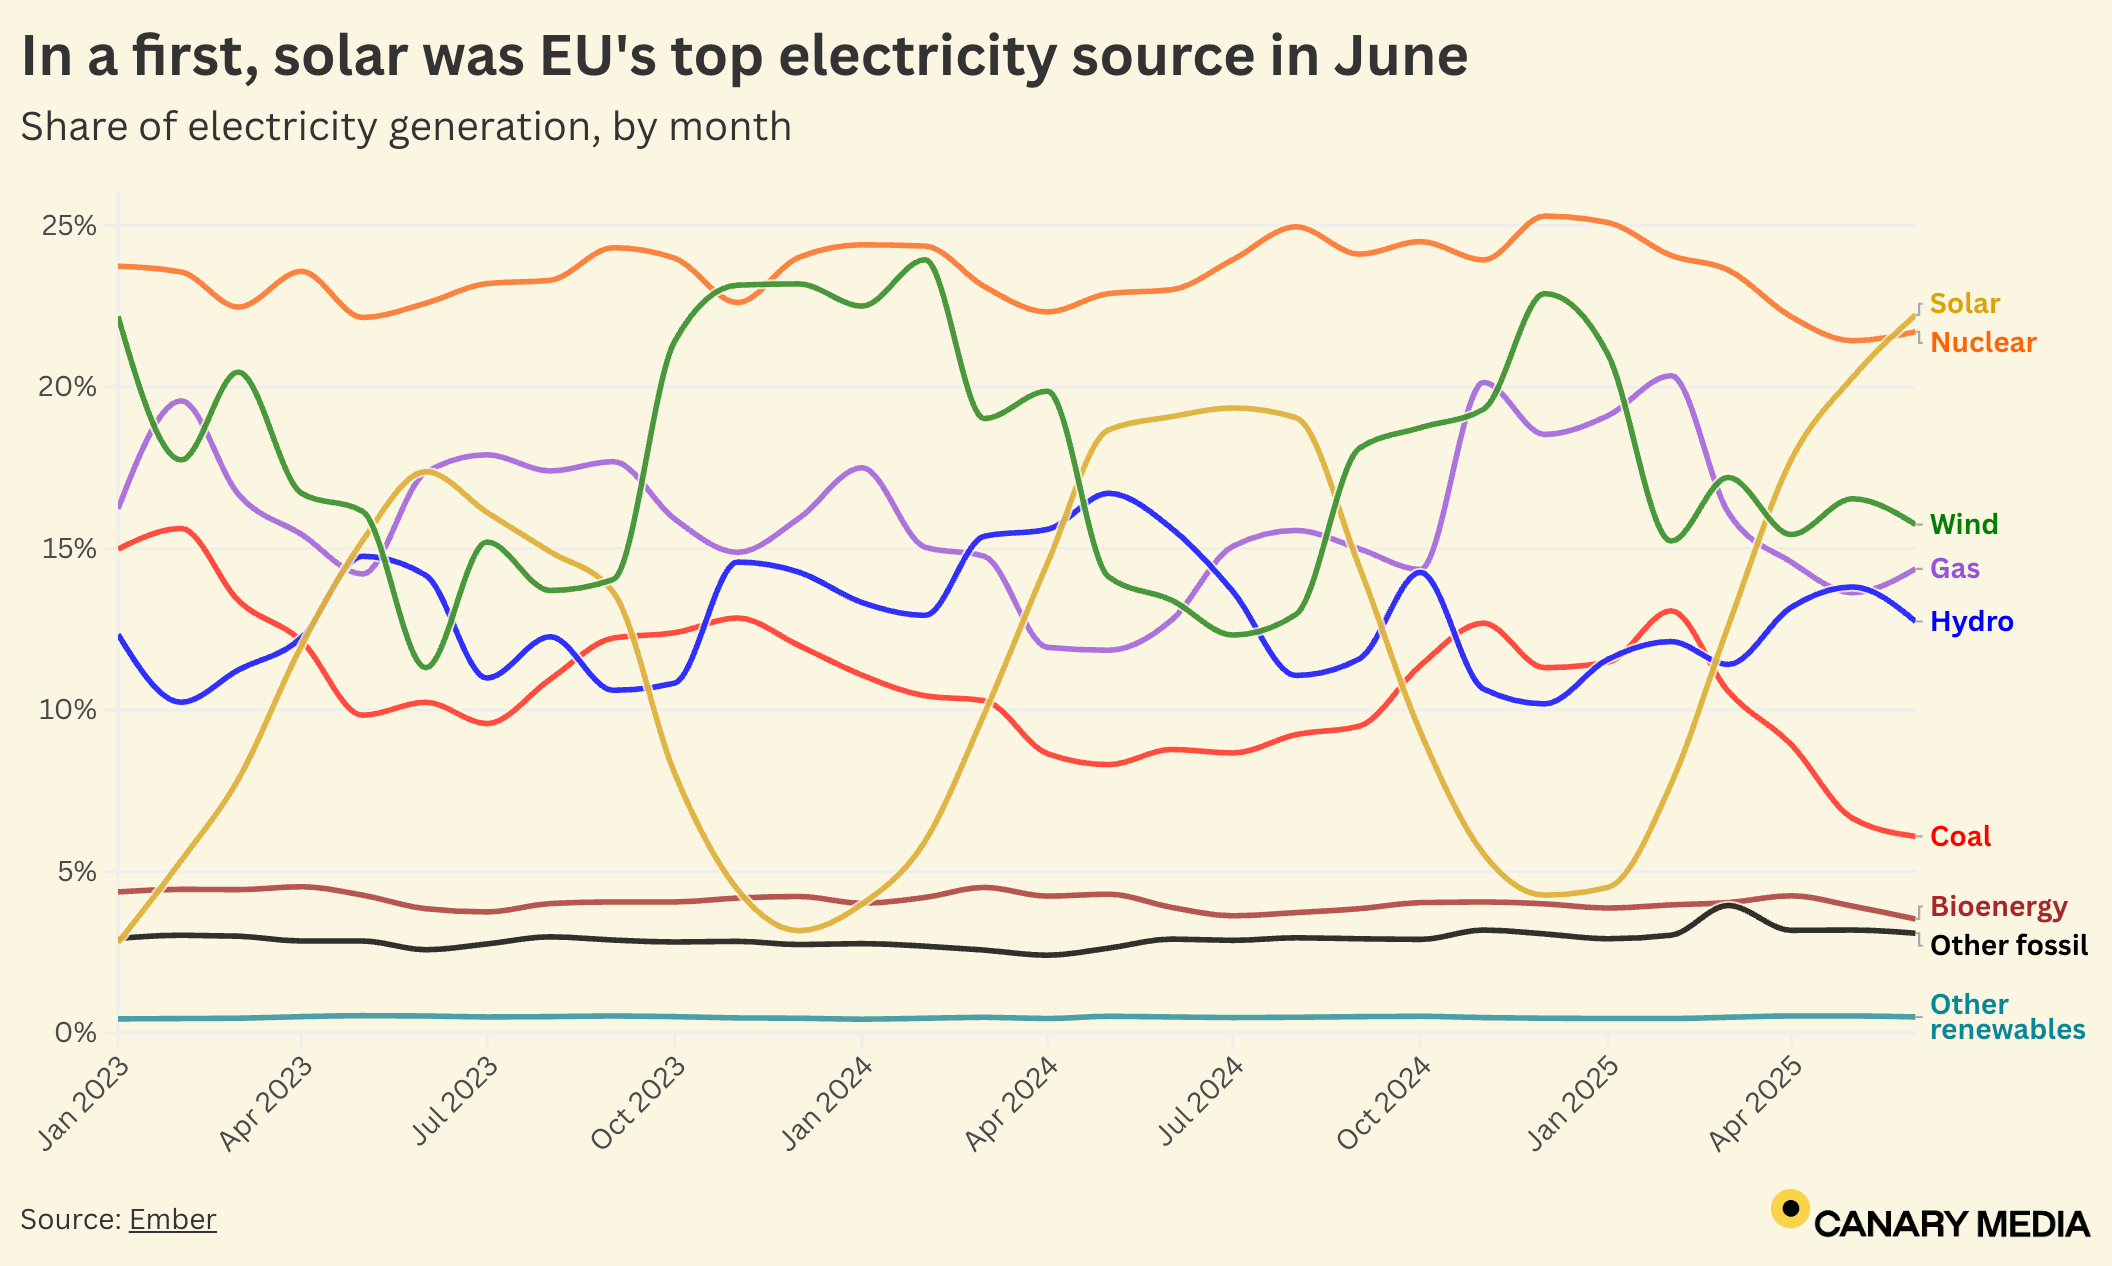
Next up, more good news from the energy sector: the rise of electrification and solar power.
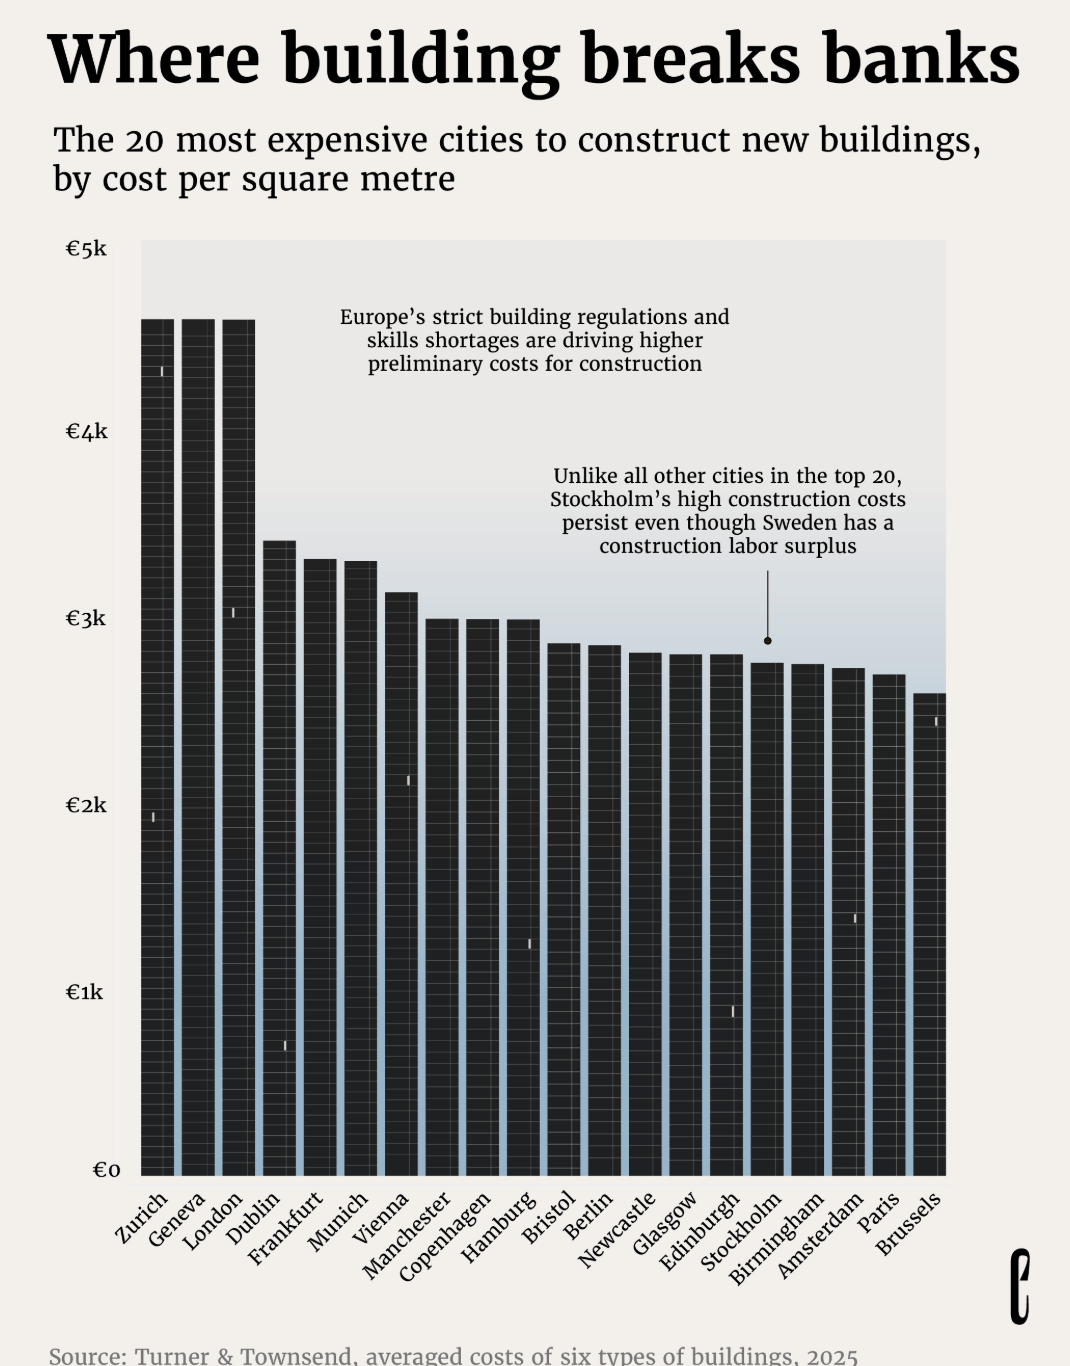
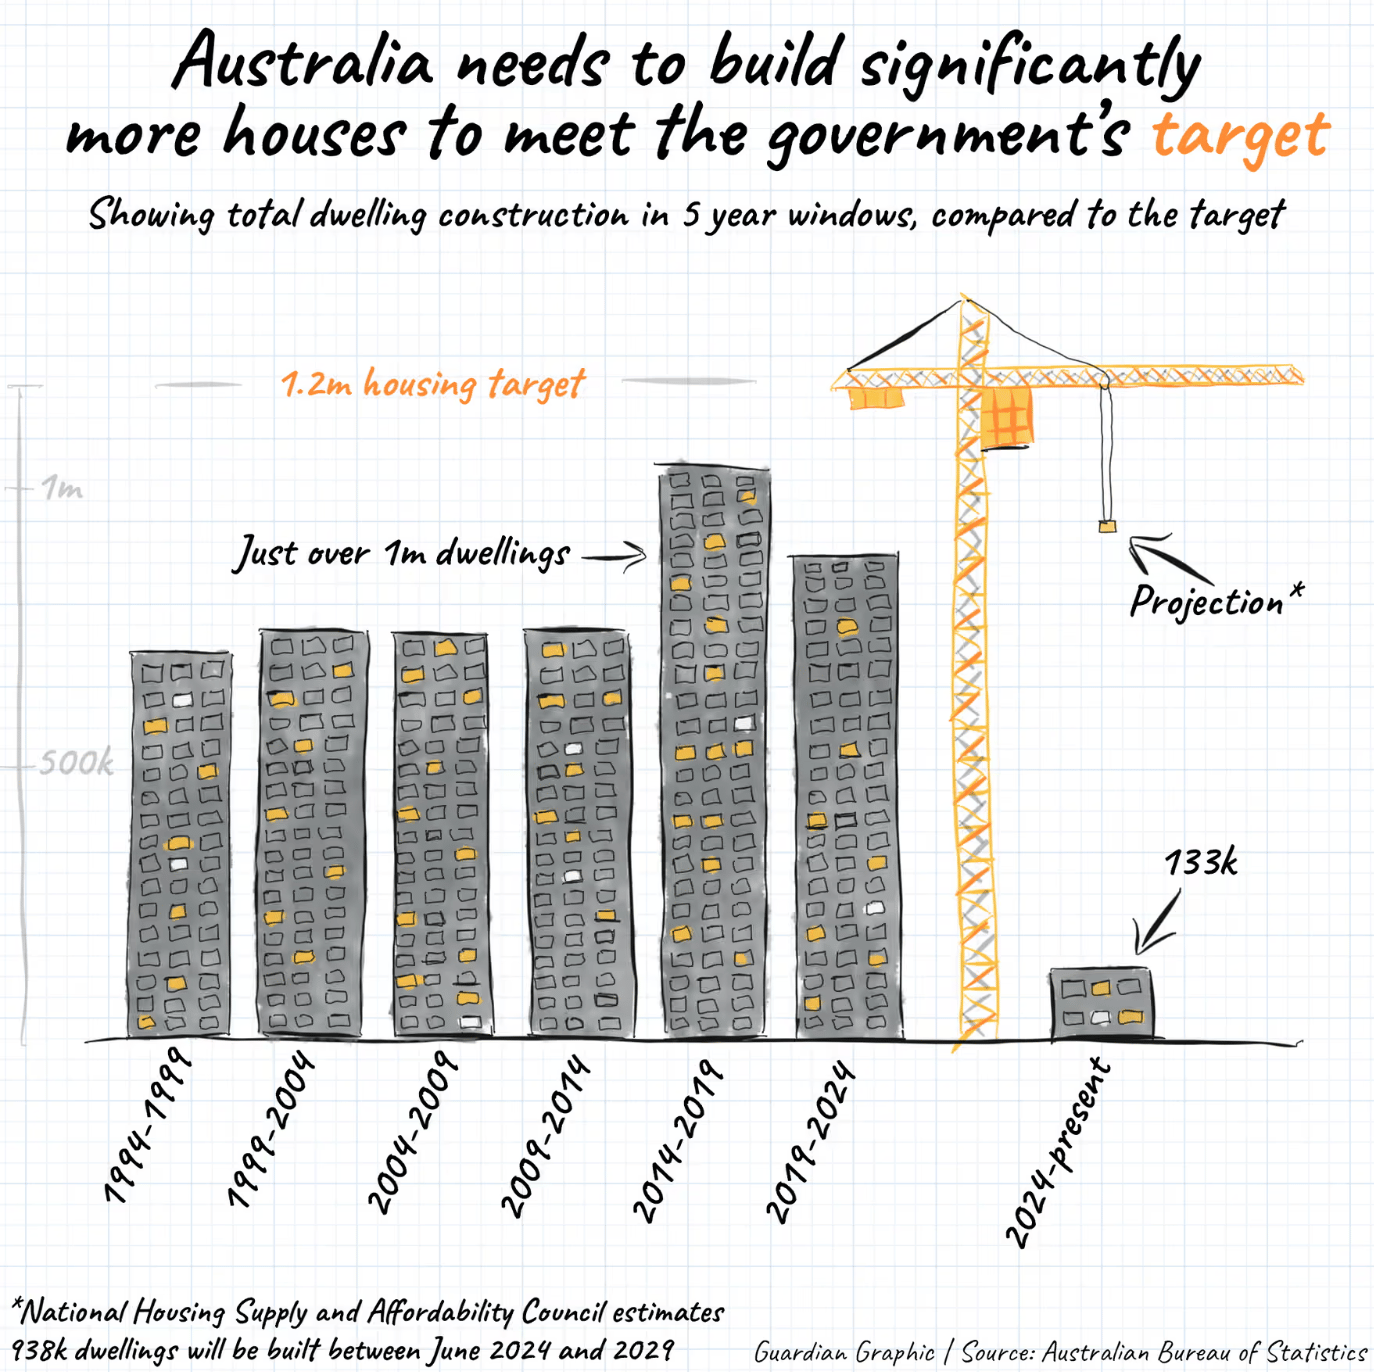
Construction, on the other hand, is not only hard to decarbonize but can also be expensive and lengthy.
Two maps take us to the United States to explore its network of detention centers and changing weather patterns.
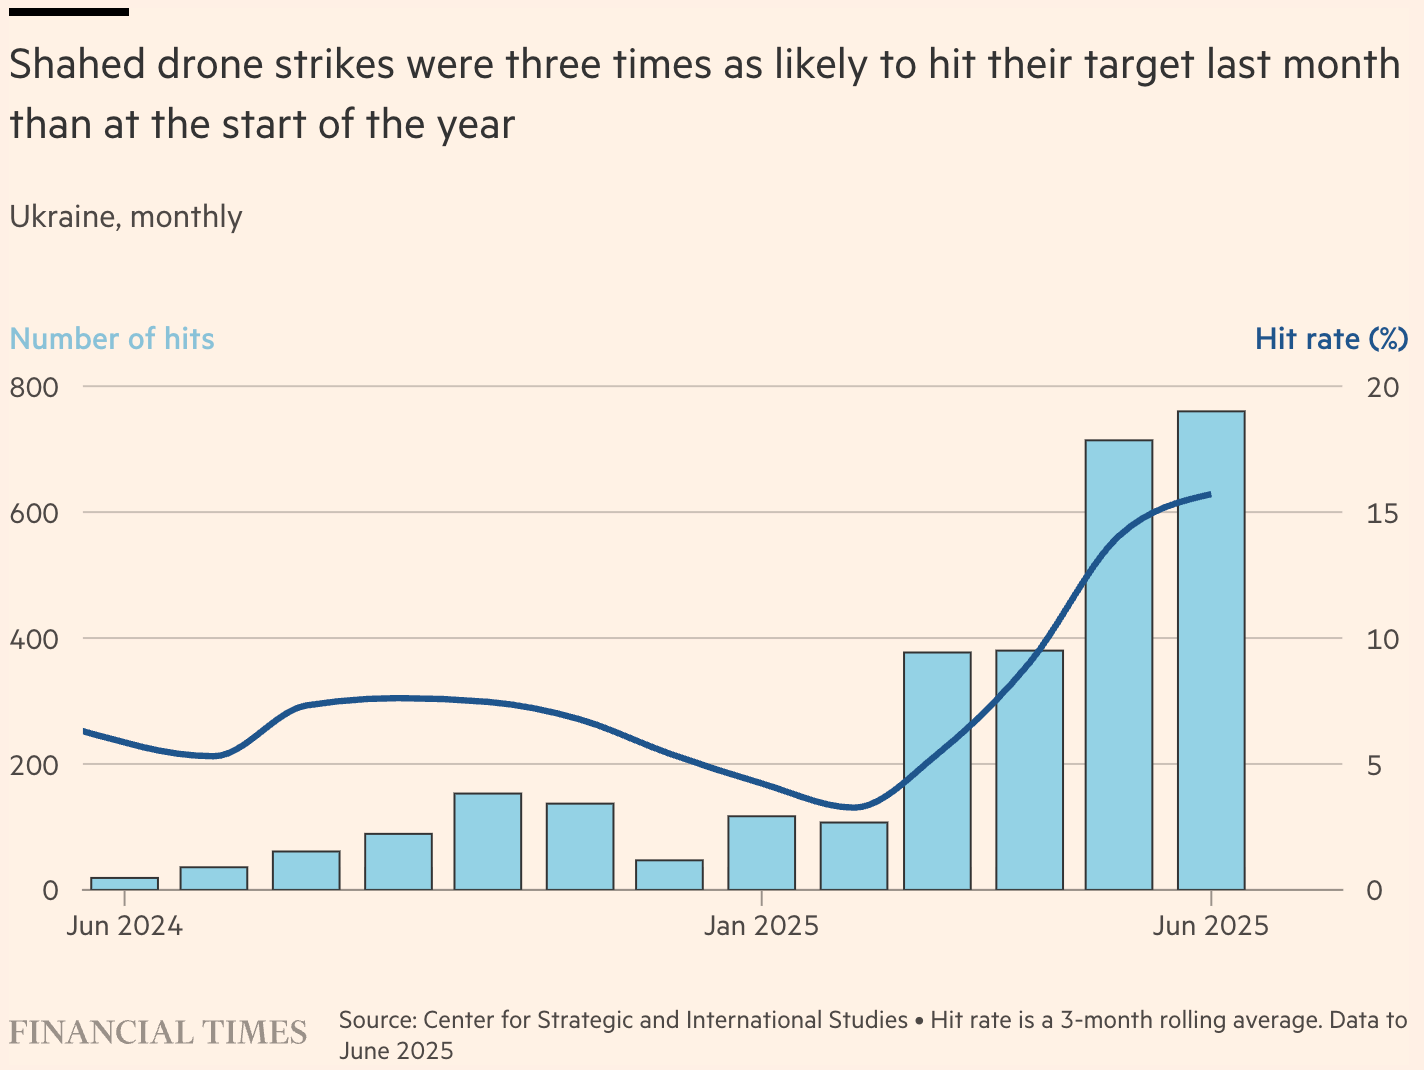
Ukraine has been facing increasingly effective drone attacks, as well as gaps in its criminal justice system.
![Тексти.org.ua: <a href="https://texty.org.ua/projects/115496/imitaciya-narkoborotby-chomu-pravoohoronna-systema-karaye-spozhyvachiv-a-ne-prodavciv/"><strong>Члени наркобанд майже не потрапляють за грати. Аналіз судових рішень</strong></a> [<em>Members of drug gangs almost never go to jail. Analysis of court decisions</em>], July 17](https://datawrapper.de/cdn-cgi/image/quality=85,width=1332,f=auto,fit=cover/https://kirby.datawrapper.de/media/pages/blog/data-vis-dispatch-july-22-2025/84bcdec6ae-1753189133/cleanshot-2025-07-22-at-14.57.42@2x.png)
German salaries are rising faster than inflation, while inflation in Hungary isn't as bad as it seems.
![Átlátszó: <a href="https://atlatszo.hu/adat/2025/07/15/a-lakossag-hatszor-akkoranak-erzi-az-inflaciot-mint-amit-a-ksh-mer/"><strong>A lakosság hatszor akkorának érzi az inflációt, mint amit a KSH mér</strong></a> [<em>The population perceives inflation to be six times higher than what the Central Statistical Office measures</em>], July 15](https://datawrapper.de/cdn-cgi/image/quality=85,width=1523,f=auto,fit=cover/https://kirby.datawrapper.de/media/pages/blog/data-vis-dispatch-july-22-2025/244452846e-1753190618/cleanshot-2025-07-22-at-15.20.40@2x.png)
![Frankfurter Allgemeine Zeitung: <a href="https://www.faz.net/aktuell/karriere-hochschule/buero-co/neue-gehaltsdaten-2024-so-viel-verdienen-die-deutschen-110597341.html"><strong>So viel verdienen die Deutschen</strong></a> [This is how much Germans earn], July 22](https://datawrapper.de/cdn-cgi/image/quality=85,width=1388,f=auto,fit=cover/https://kirby.datawrapper.de/media/pages/blog/data-vis-dispatch-july-22-2025/95b217bc4e-1753187684/cleanshot-2025-07-22-at-14.30.05@2x.png)
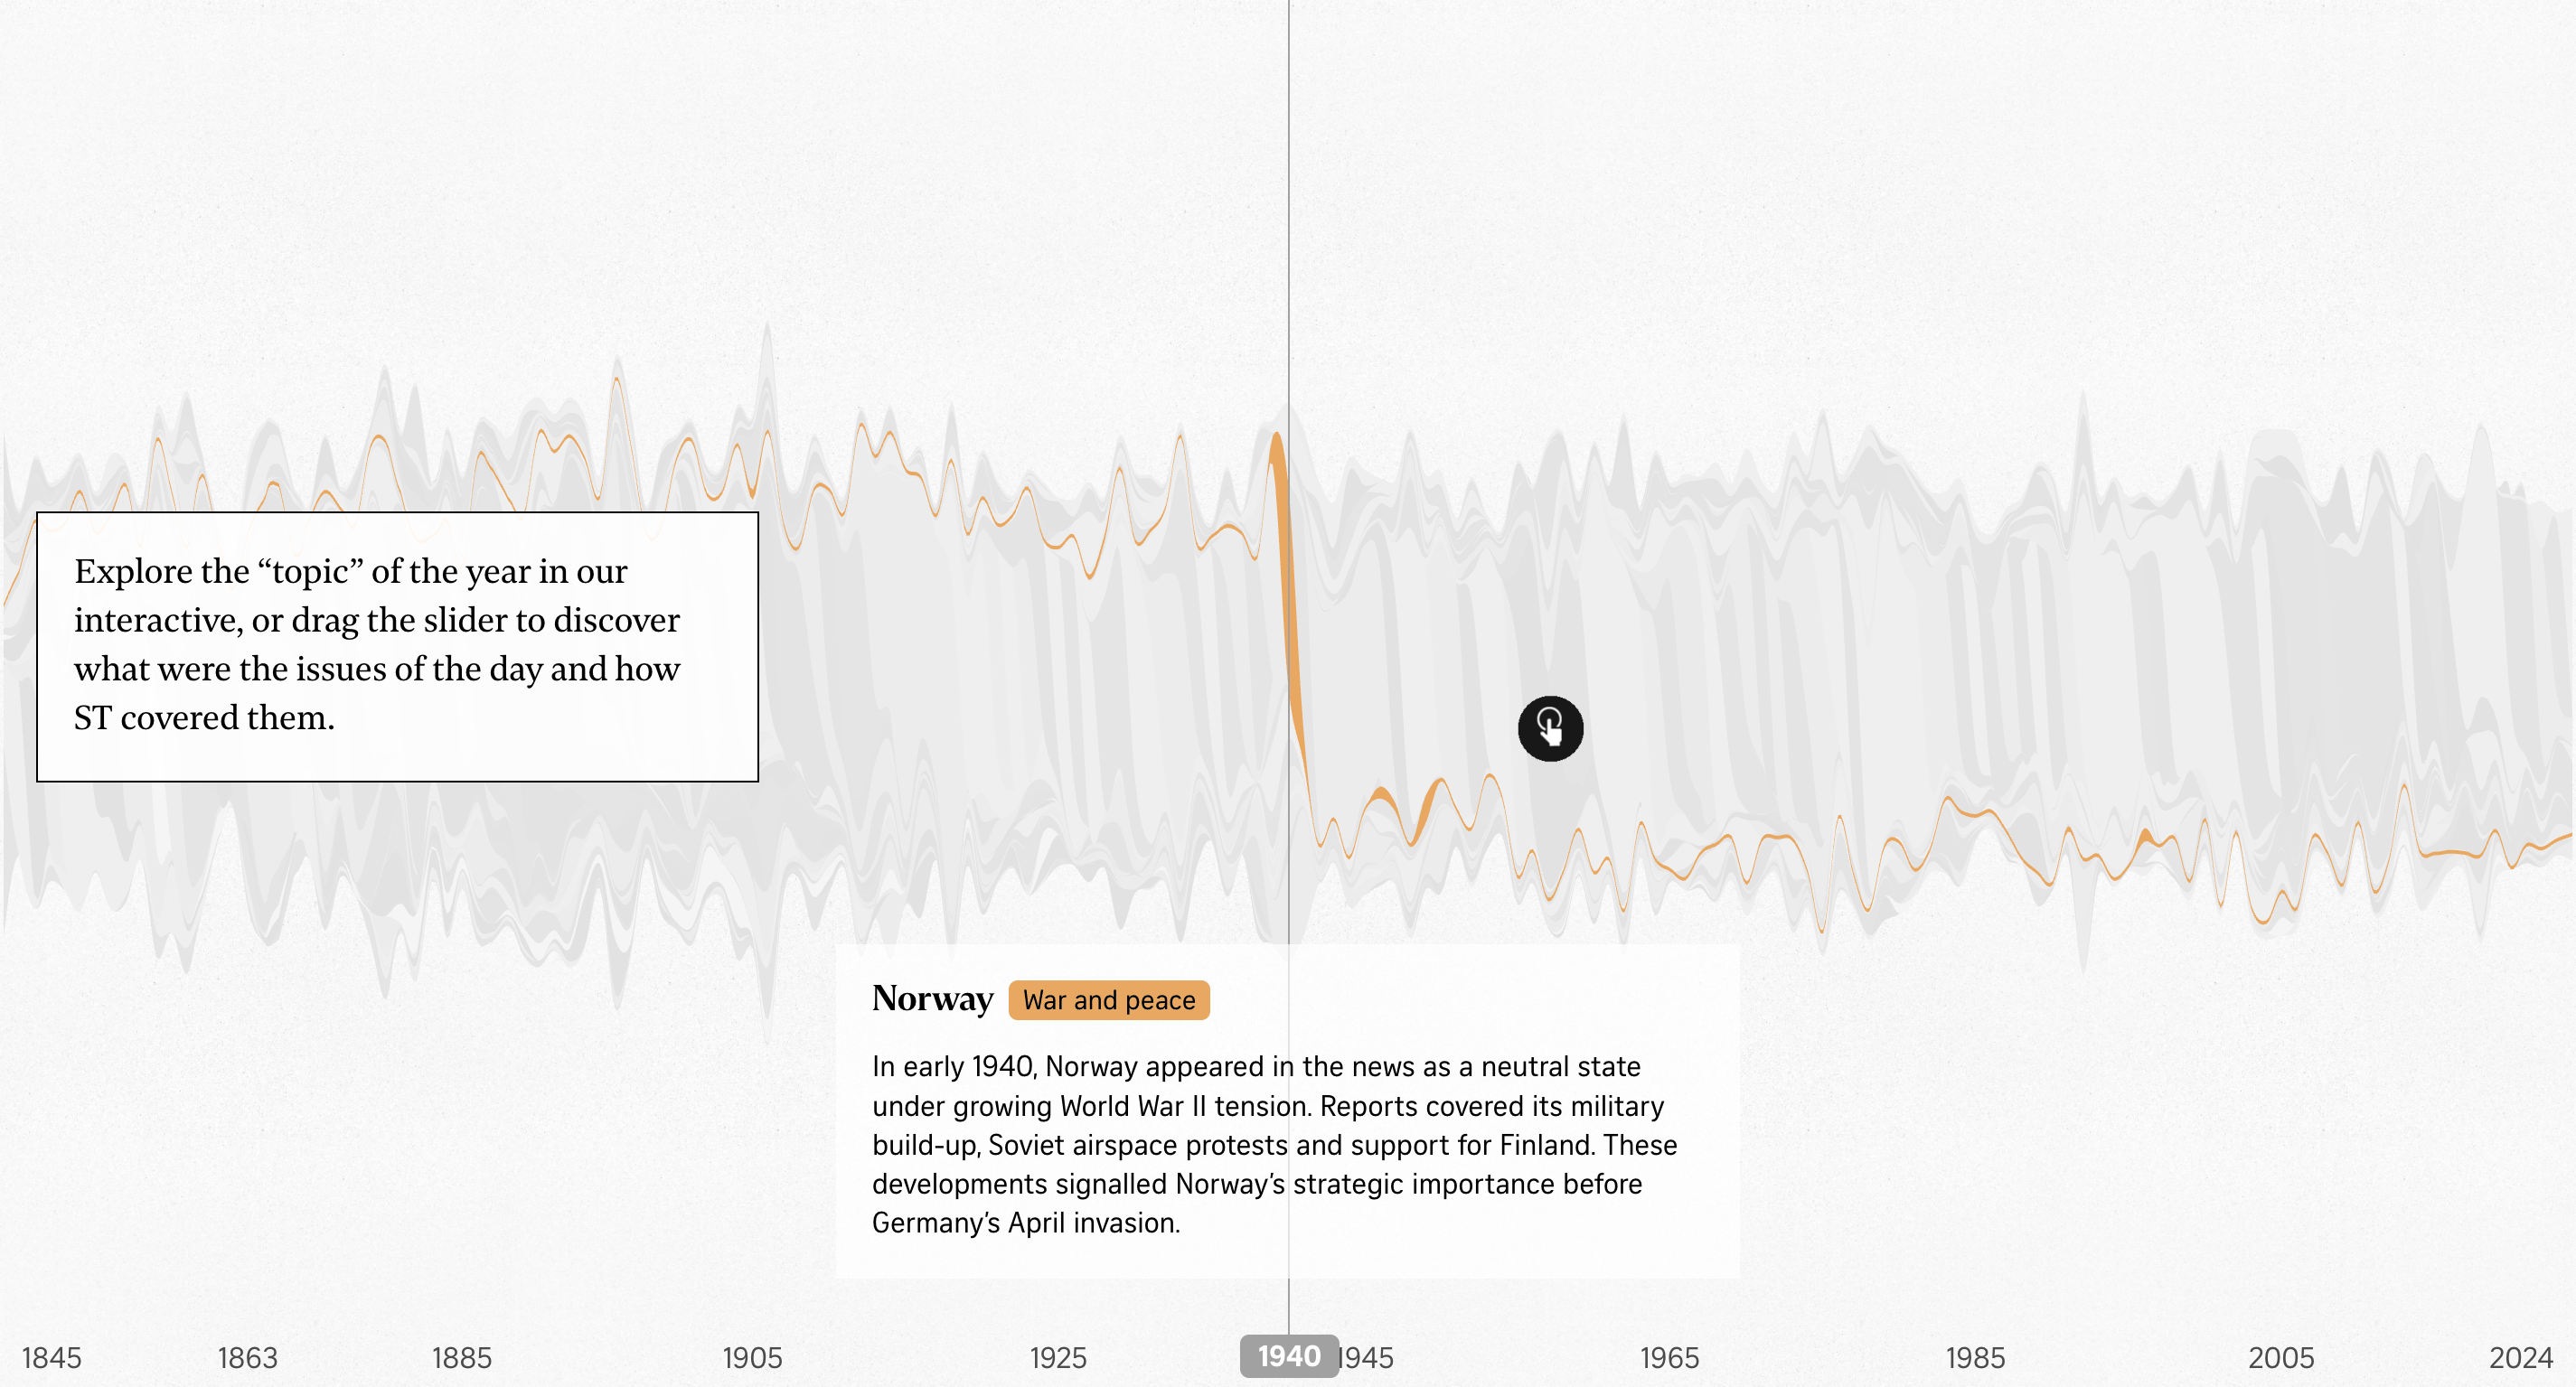
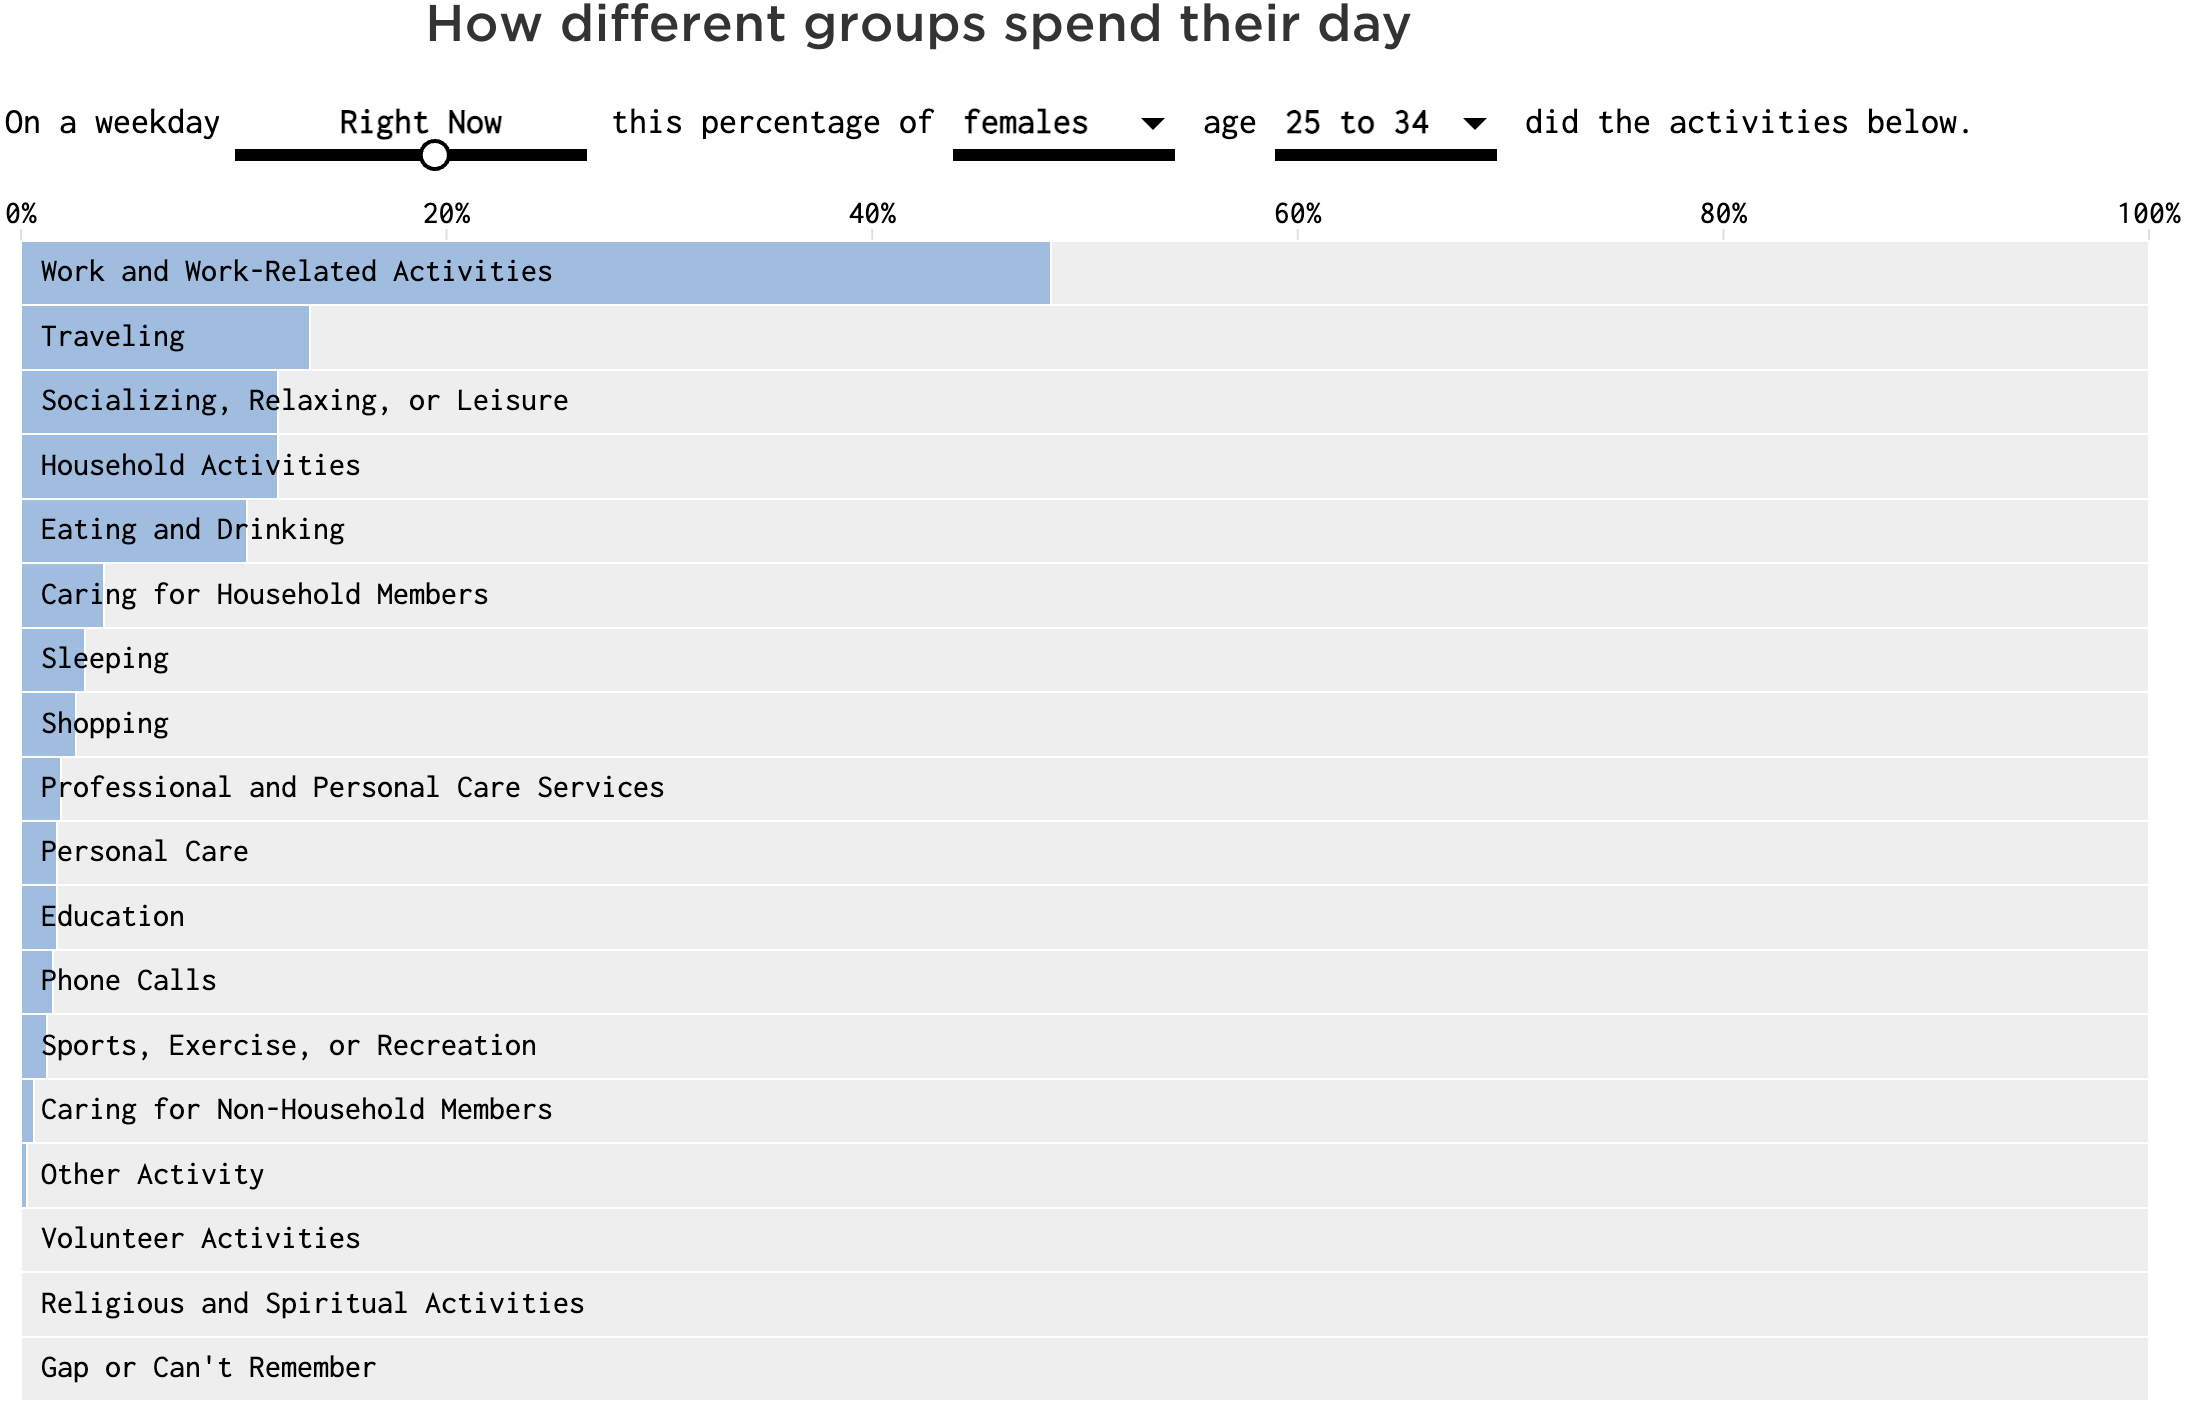
Other visualizations of the week cover the headline history of Singapore, bus routes in Thailand, and how we spend our days.
![WeVis: <a href="https://wevis.info/unmerry-go-round/"><strong>ในแต่ละจังหวัด1 เส้นทางเดินรถต้องแบกรับประชากรกี่คน?</strong></a> [In each province, how many people does one bus route have to carry?], July 16](https://datawrapper.de/cdn-cgi/image/quality=85,width=2880,f=auto,fit=cover/https://kirby.datawrapper.de/media/pages/blog/data-vis-dispatch-july-22-2025/f26bb6b352-1753184954/cleanshot-2025-07-22-at-13.49.02@2x.png)
What else we found interesting
Help us make this dispatch better! We’d love to hear which newsletters, blogs, or social media accounts we need to follow to learn about interesting projects, especially from less-covered parts of the world (Asia, South America, Africa). Write us at hello@datawrapper.de or leave a comment below. Want the Dispatch in your inbox every Tuesday? Sign up for our Blog Update newsletter!