Data Vis Dispatch, August 5: Germany, Texas, and Coffee

Welcome back to the 204th edition of Data Vis Dispatch! Every week, we’ll be publishing a collection of the best small and large data visualizations we find, especially from news organizations — to celebrate data journalism, data visualization, simple charts, elaborate maps, and their creators.
Recurring topics this week include redistricting in Texas, coffee production, and German socio-economics.
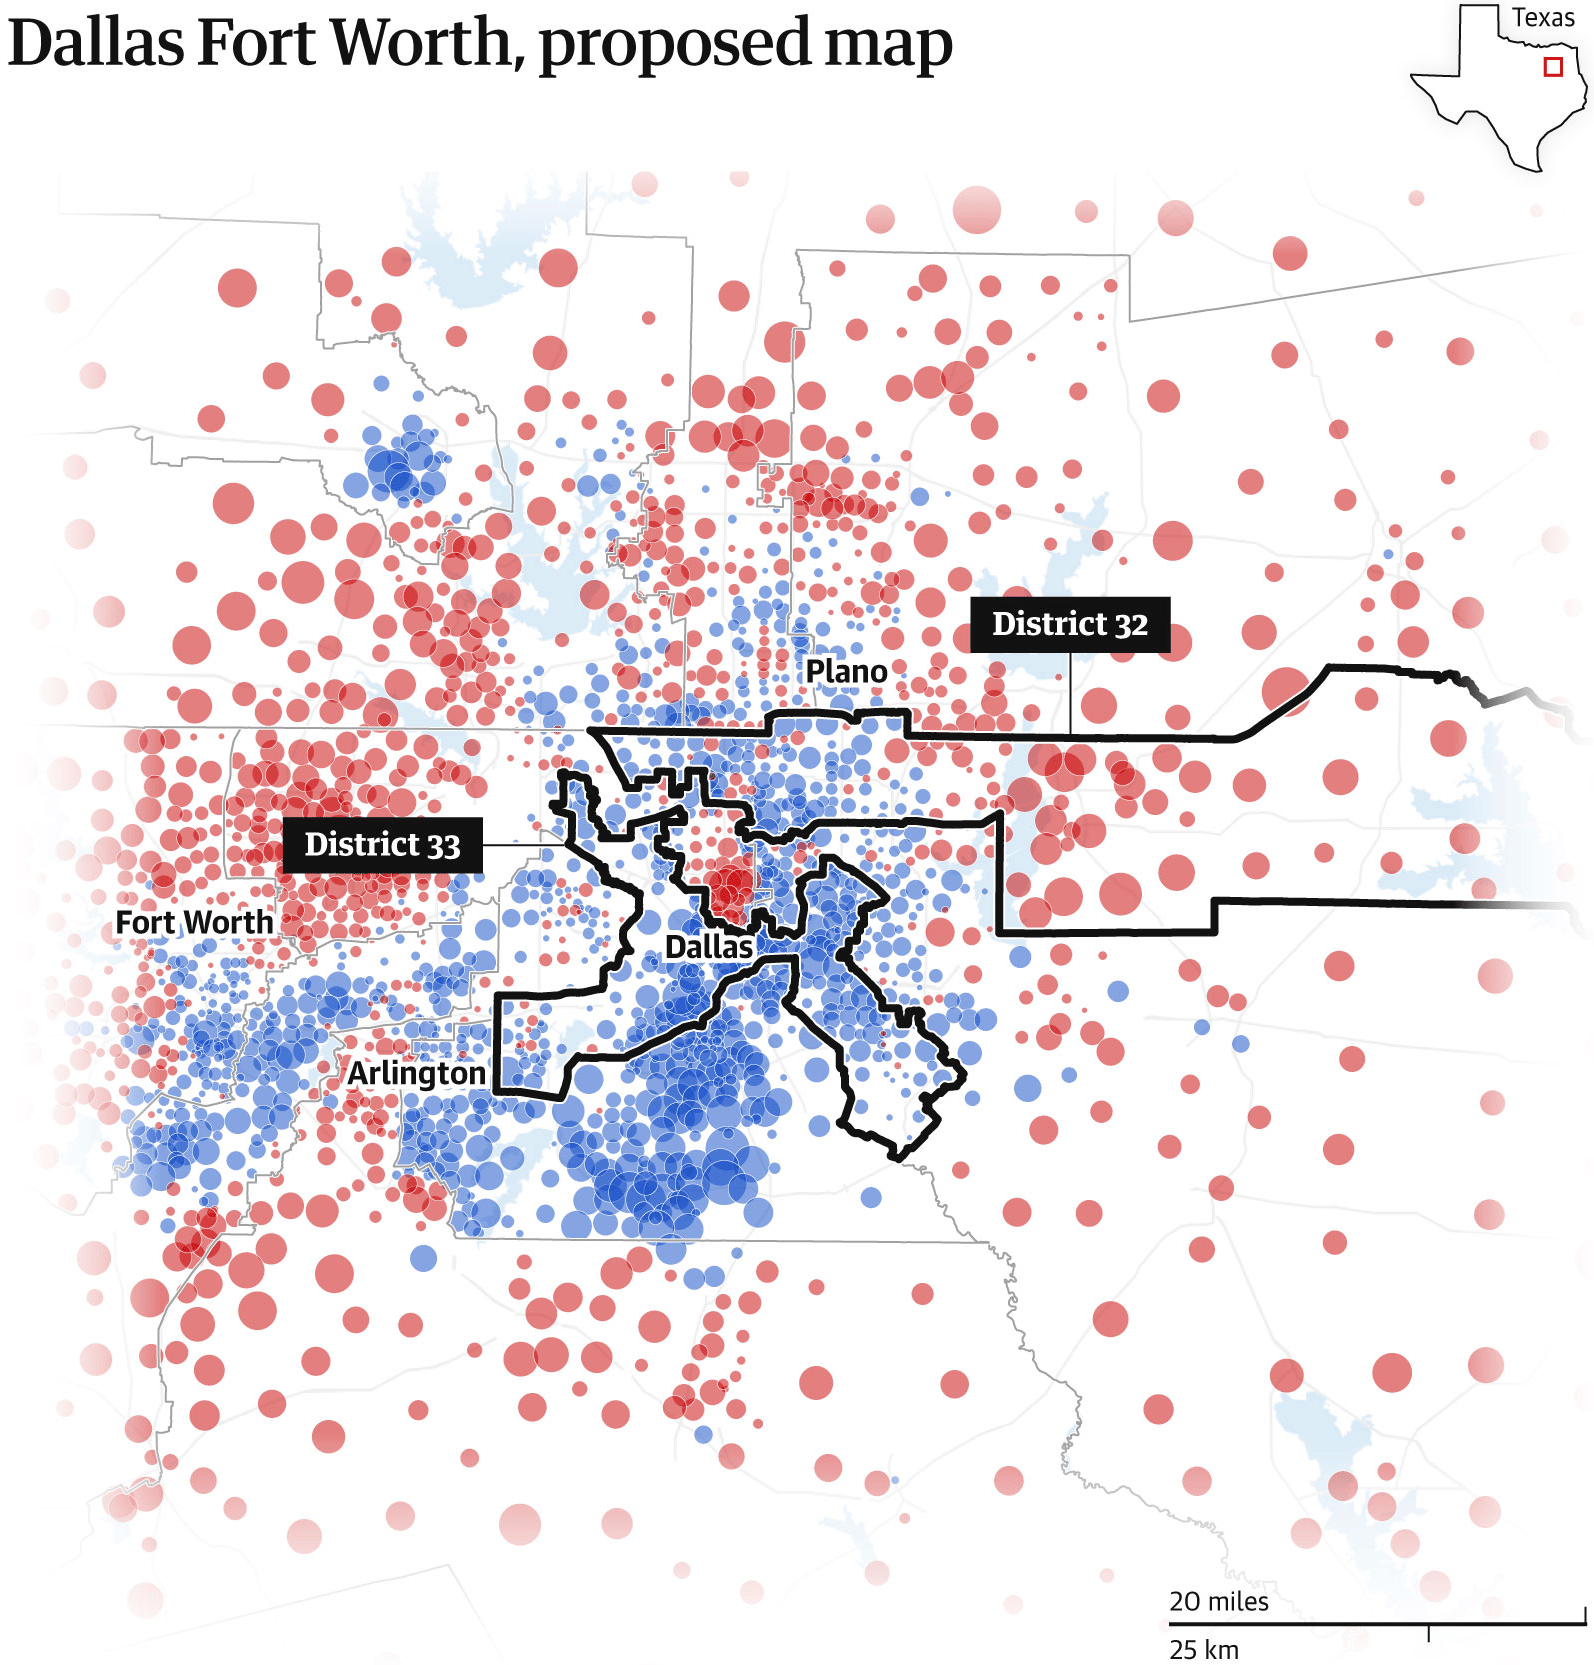
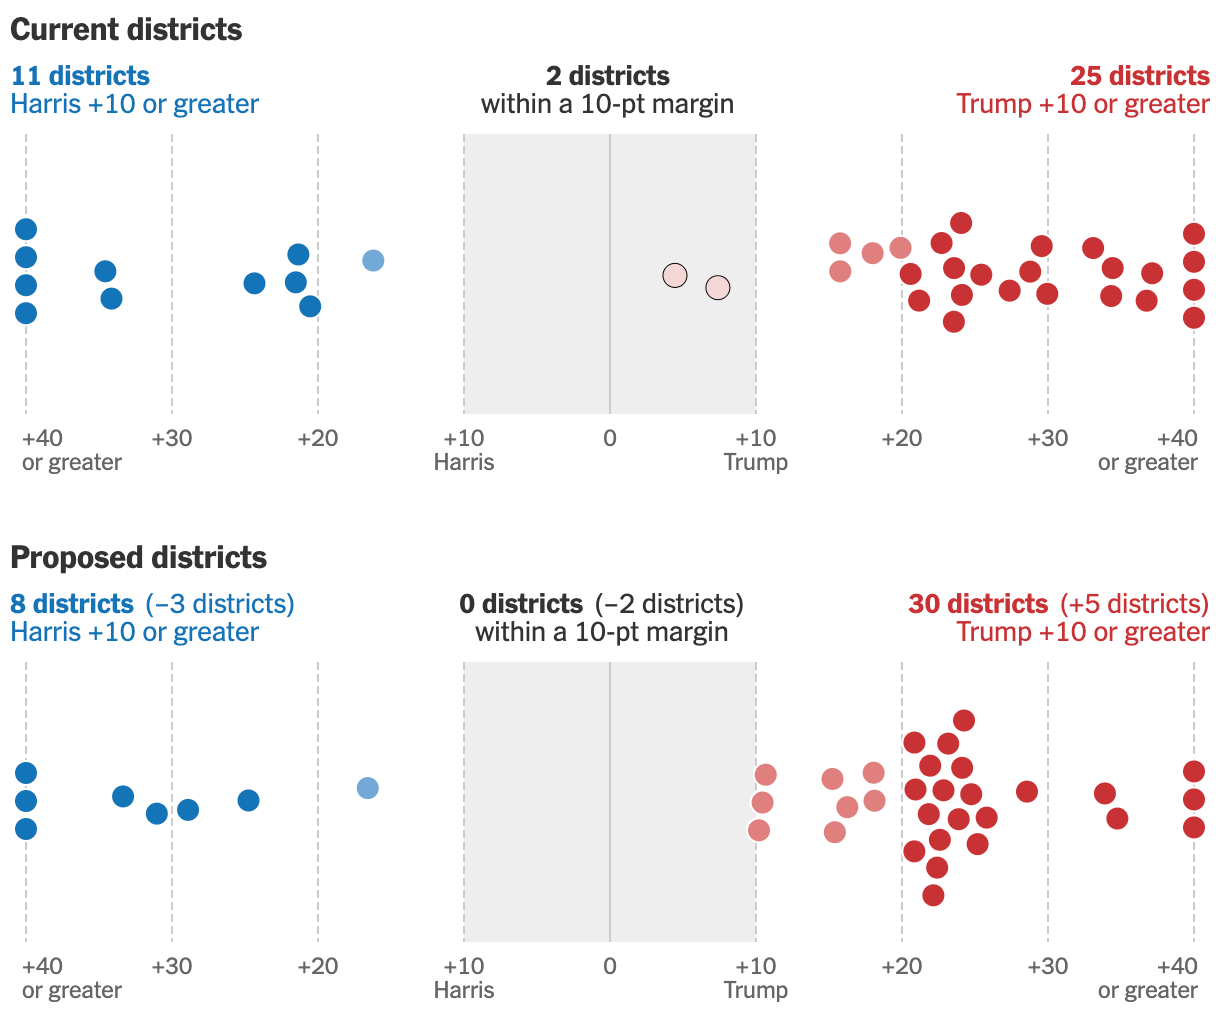
What's new in political moves from the United States? Democratic legislators in Texas have left the state in a last-ditch attempt to stop a gerrymandered Republican redistricting plan:
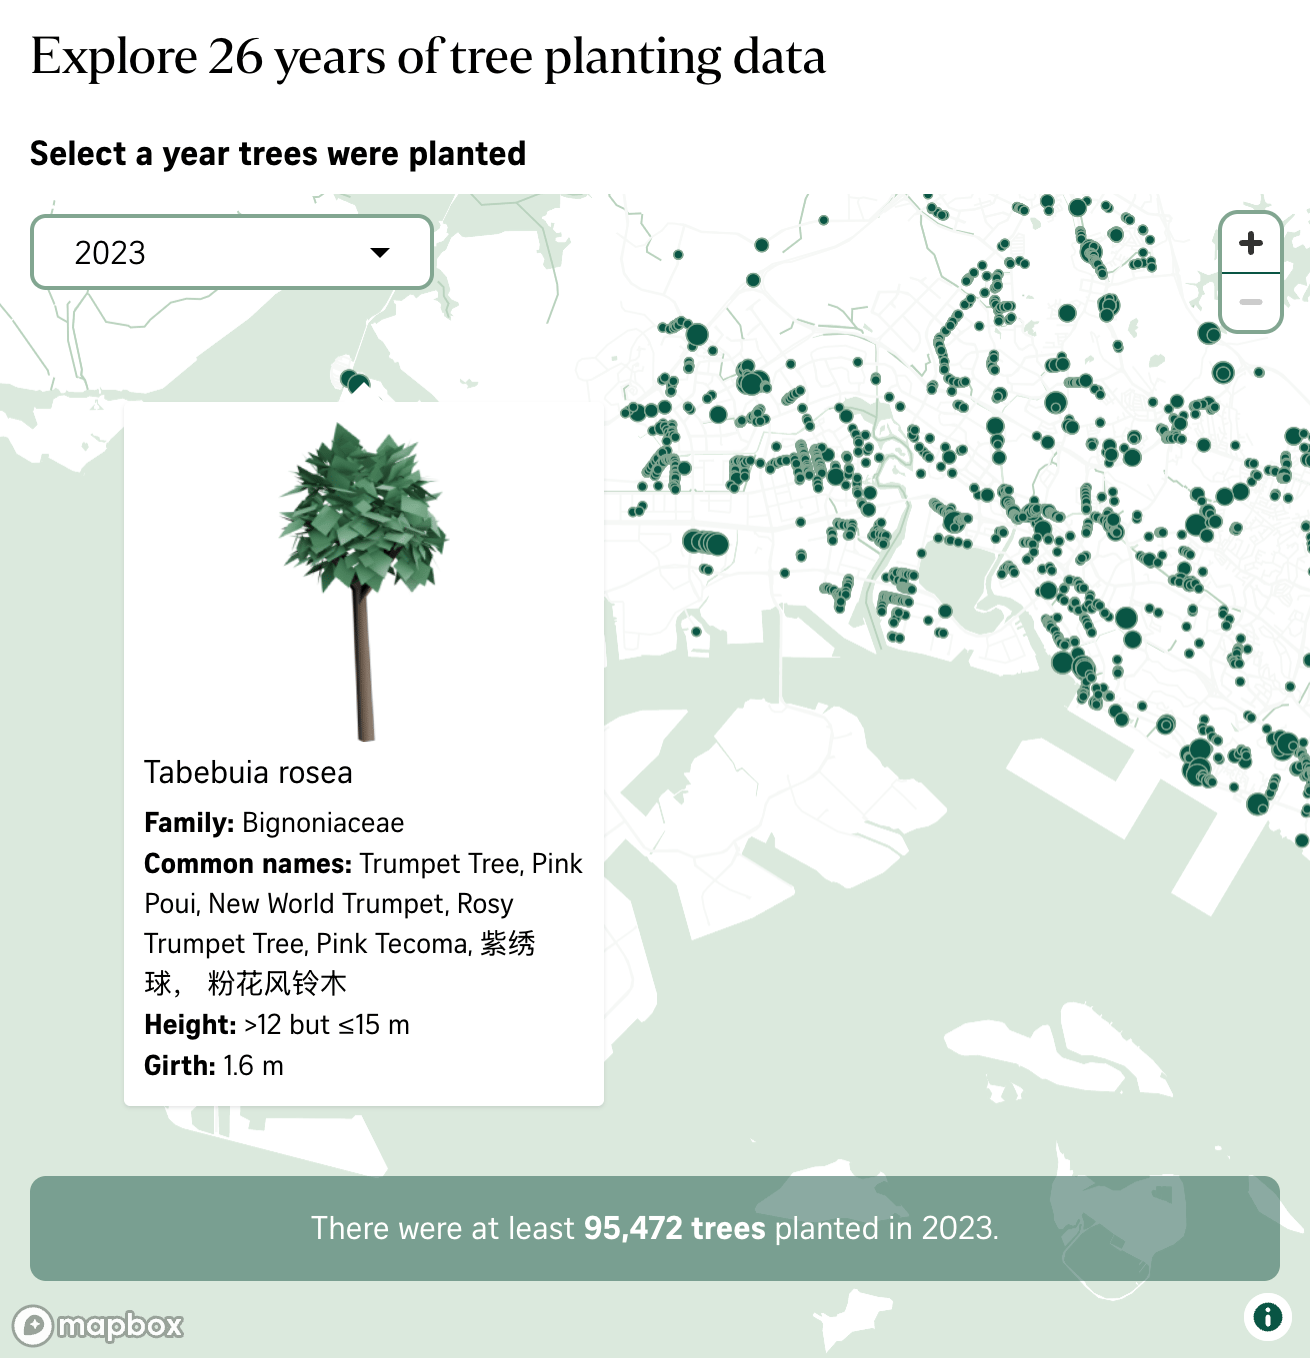
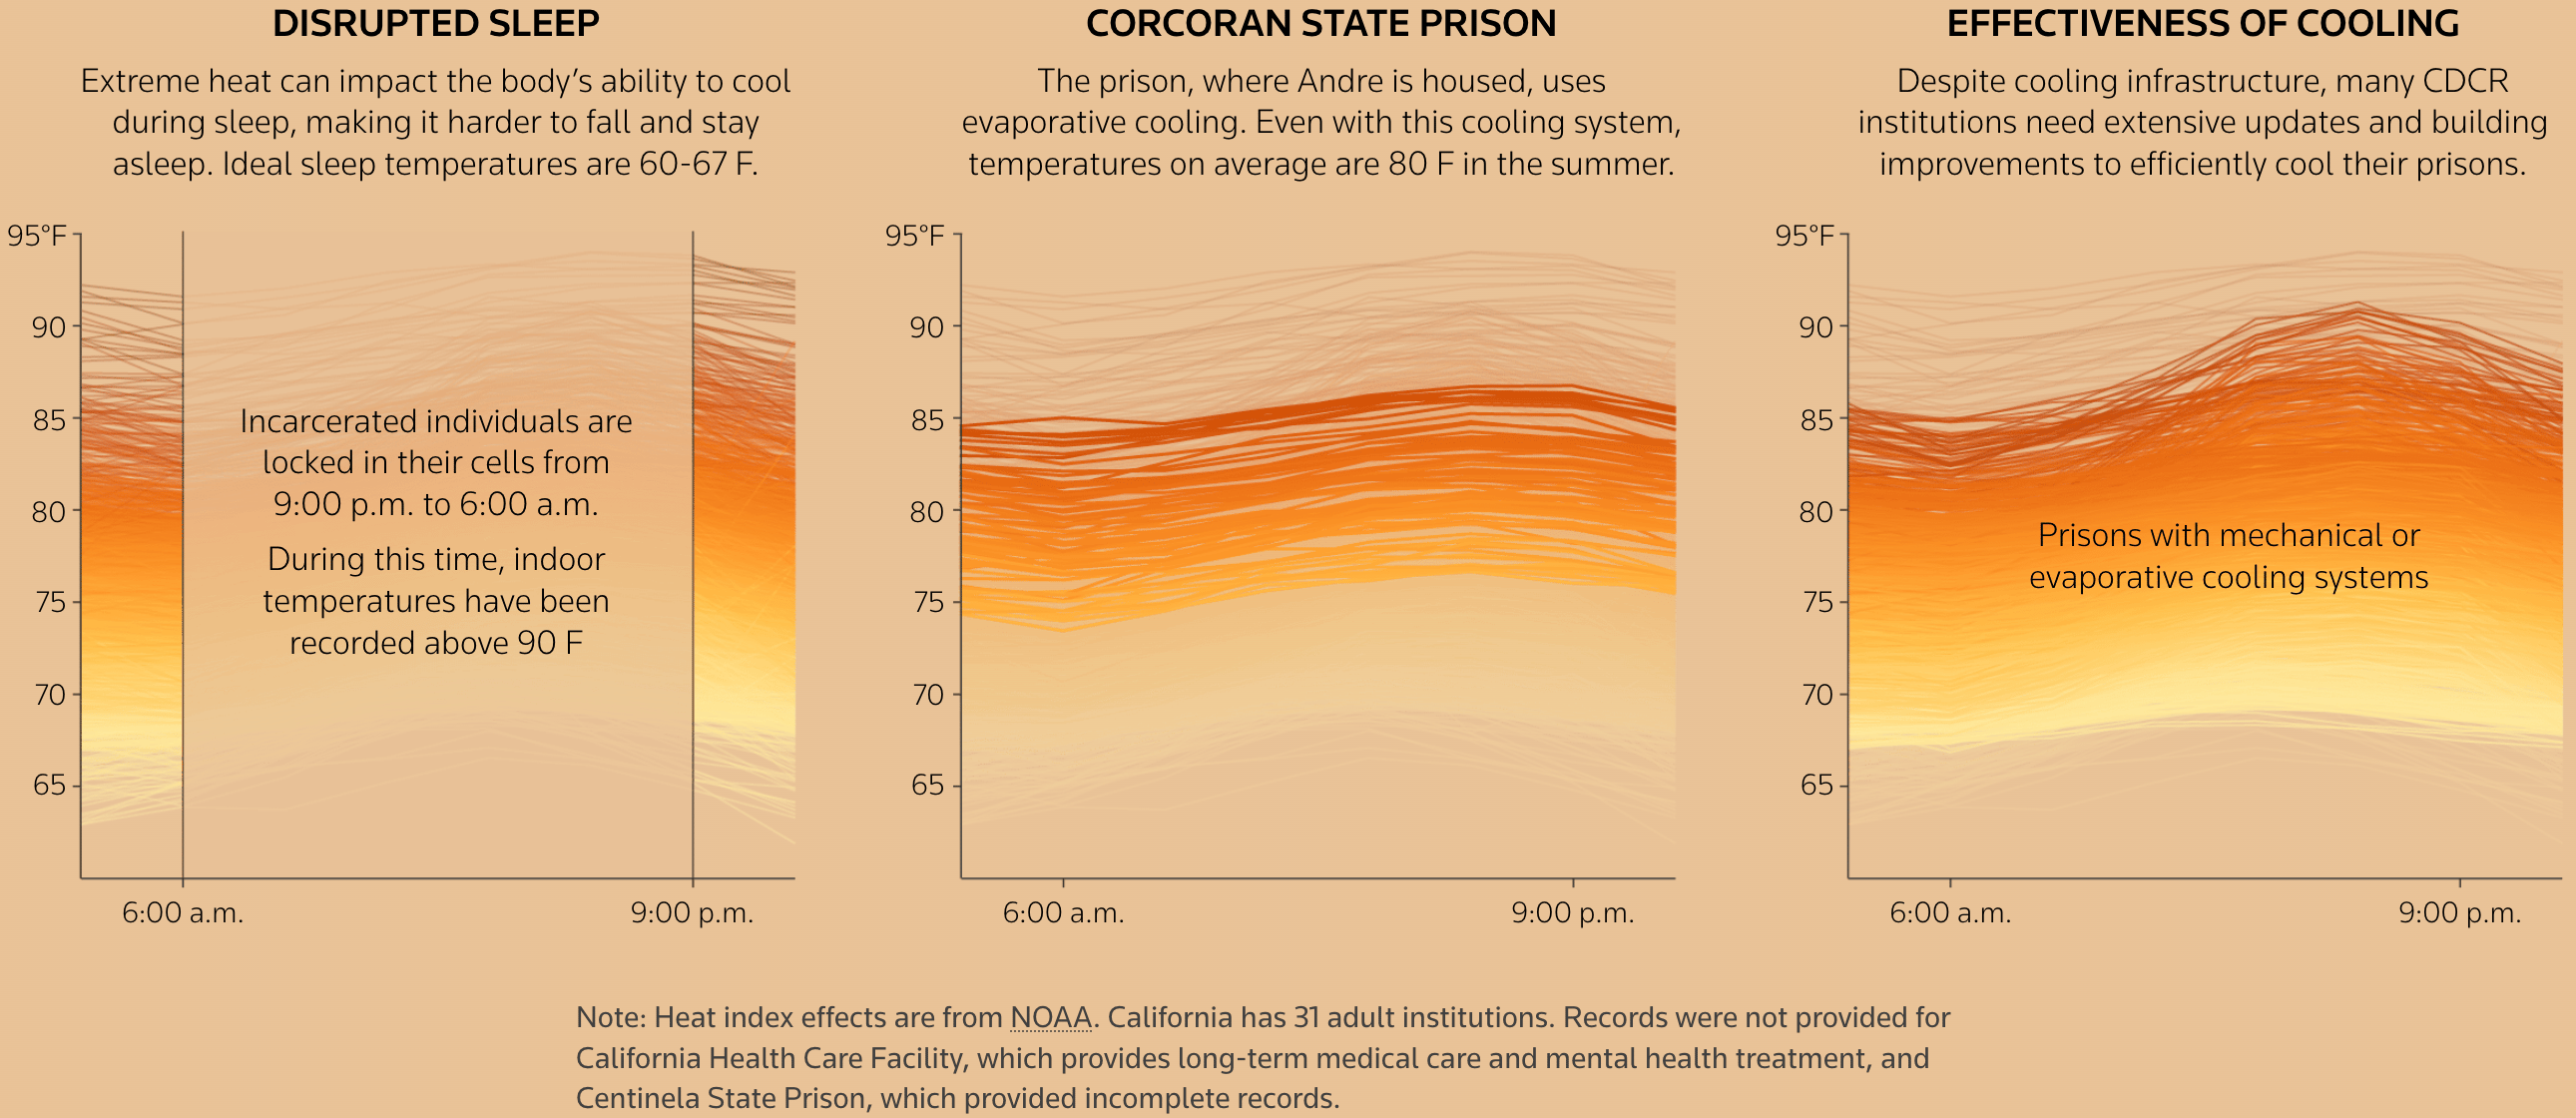
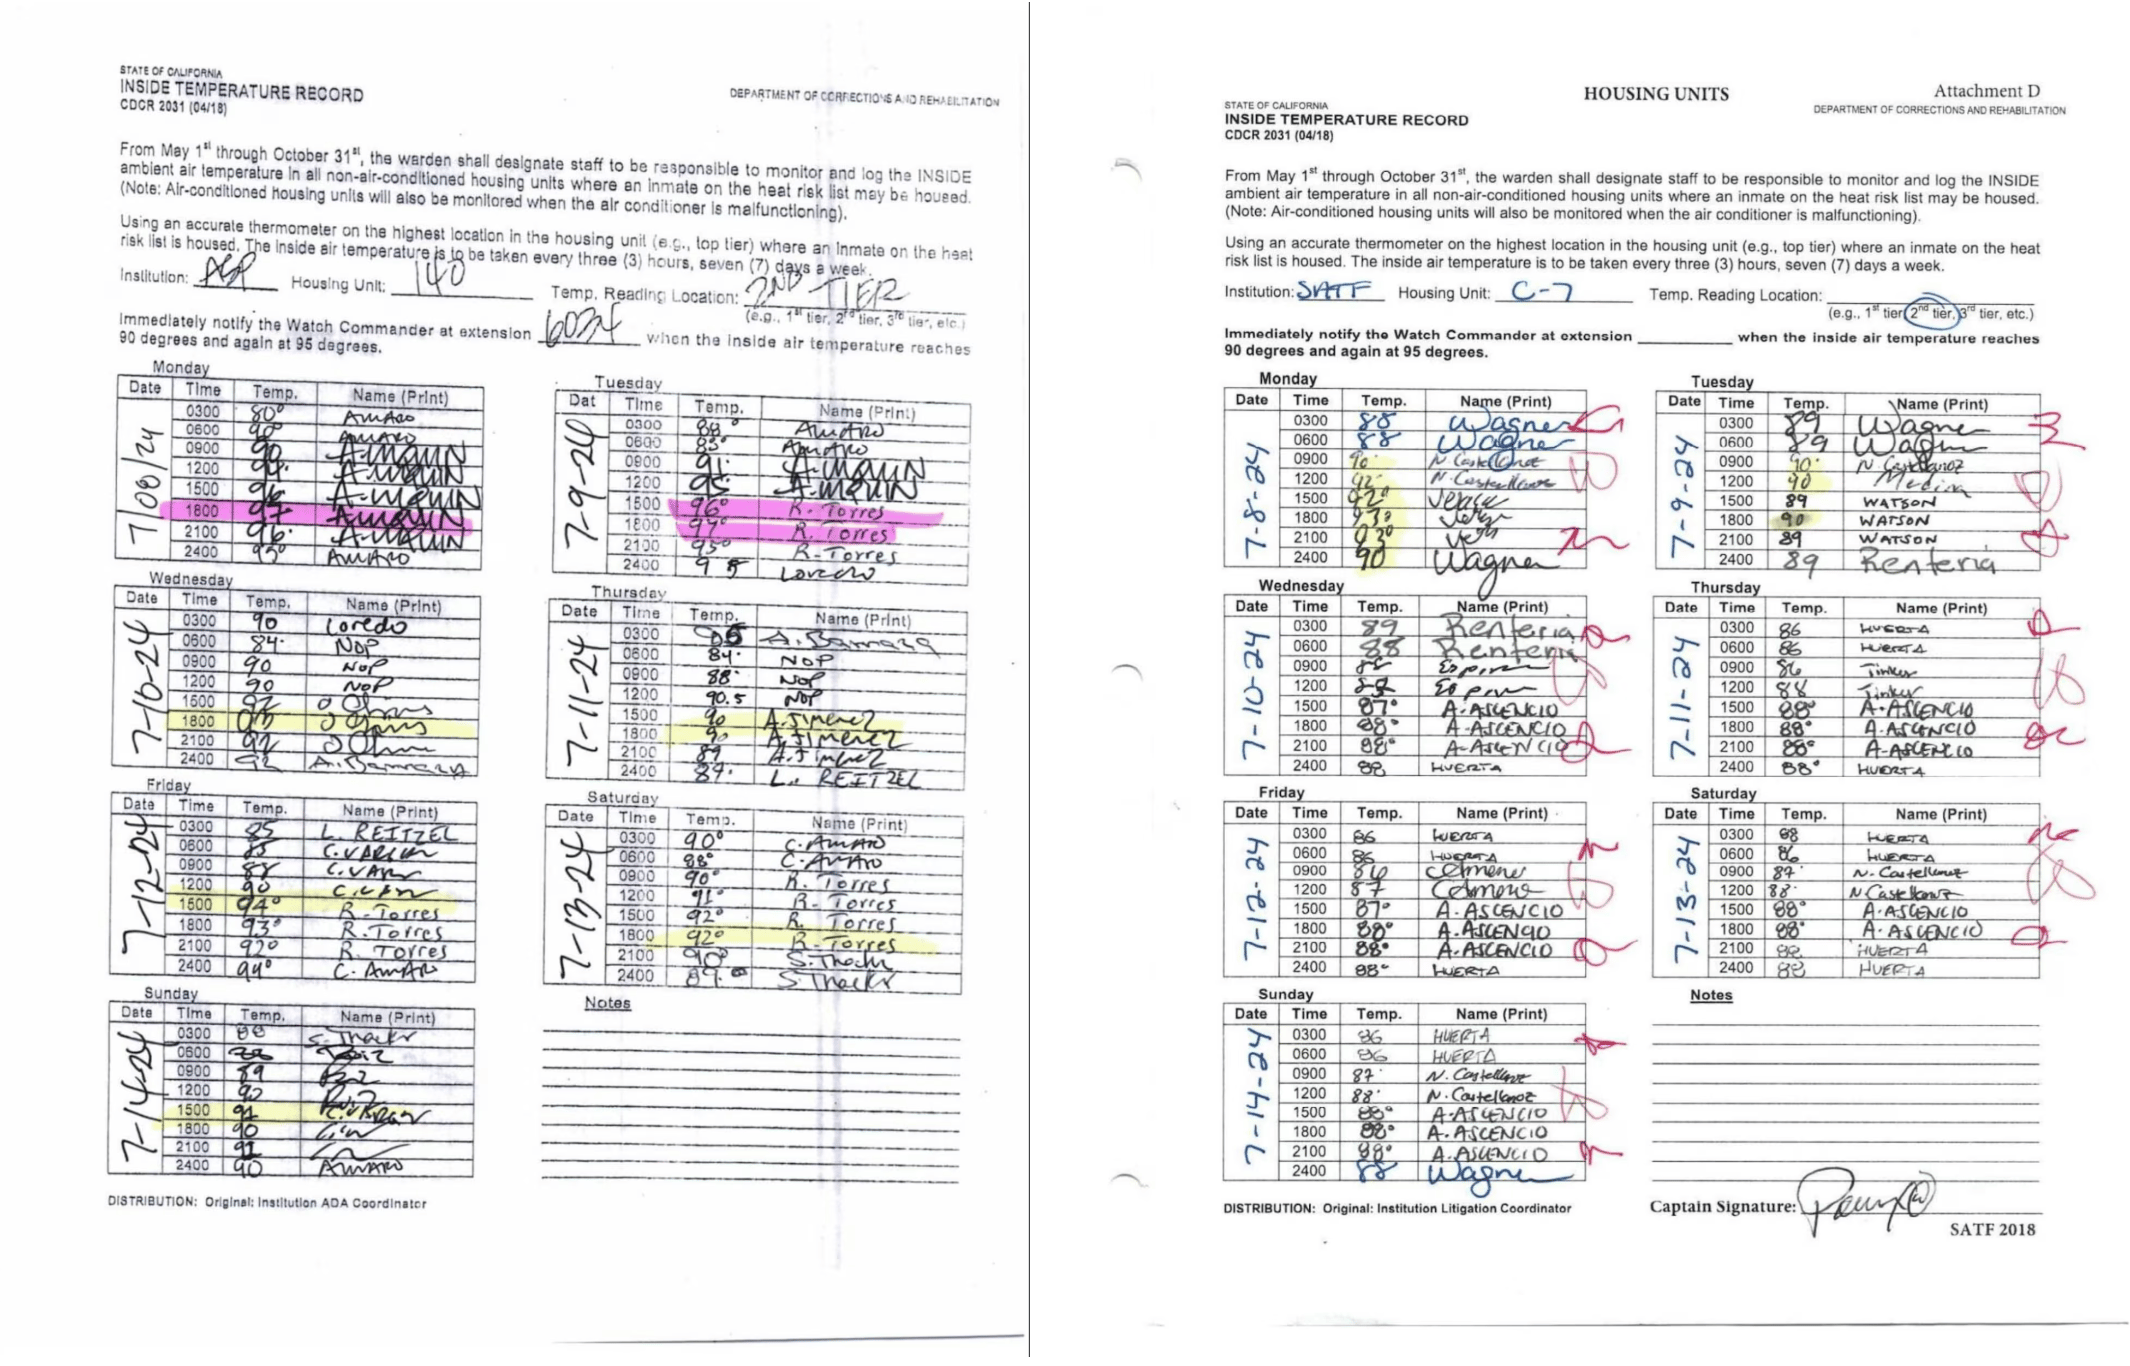
This week brought many charts with an environmental focus, from tree planting and earthquakes to heatwaves in prisons:
![Die Zeit: <a href="https://www.zeit.de/wissen/2025-07/tsunami-erdbeben-pazifik-russland-japan-usa-karten"><strong>Warum eines der schwersten Erdbeben glimpflich ausgegangen ist</strong></a> [<em>Why one of the most severe earthquakes ended without serious consequences</em>], July 30](https://datawrapper.de/cdn-cgi/image/quality=85,width=1344,f=auto,fit=cover/https://kirby.datawrapper.de/media/pages/blog/data-vis-dispatch-august-5/f473aadb31-1754384993/cleanshot-2025-08-05-at-11.08.55@2x.png)
Environmental factors are affecting agriculture worldwide — here's a look at coffee production and price changes:
![Frankfurter Allgemeine Zeitung: <a href="https://www.faz.net/aktuell/wirtschaft/unternehmen/klimawandel-bedroht-kaffeeanbau-zwei-drittel-der-flaechen-gefaehrdet-110619705.html"><strong>Wie der Klimawandel den Kaffeegenuss bedroht</strong></a> [<em>How climate change threatens coffee enjoyment</em>], August 4](https://datawrapper.de/cdn-cgi/image/quality=85,width=1962,f=auto,fit=cover/https://kirby.datawrapper.de/media/pages/blog/data-vis-dispatch-august-5/cd0ee183b2-1754382686/cleanshot-2025-08-05-at-10.30.53@2x.png)
![Nexo: <a href="https://www.nexojornal.com.br/grafico/2025/07/29/preco-do-cafe-grafico-cotacao-diminuiu-em-2025"><strong>Por que o preço do café pode cair nos próximos meses</strong></a> [<em>Why coffee prices may fall in the coming months</em>], July 29](https://datawrapper.de/cdn-cgi/image/quality=85,width=1198,f=auto,fit=cover/https://kirby.datawrapper.de/media/pages/blog/data-vis-dispatch-august-5/74db211849-1754382811/cleanshot-2025-08-05-at-10.32.42@2x.png)
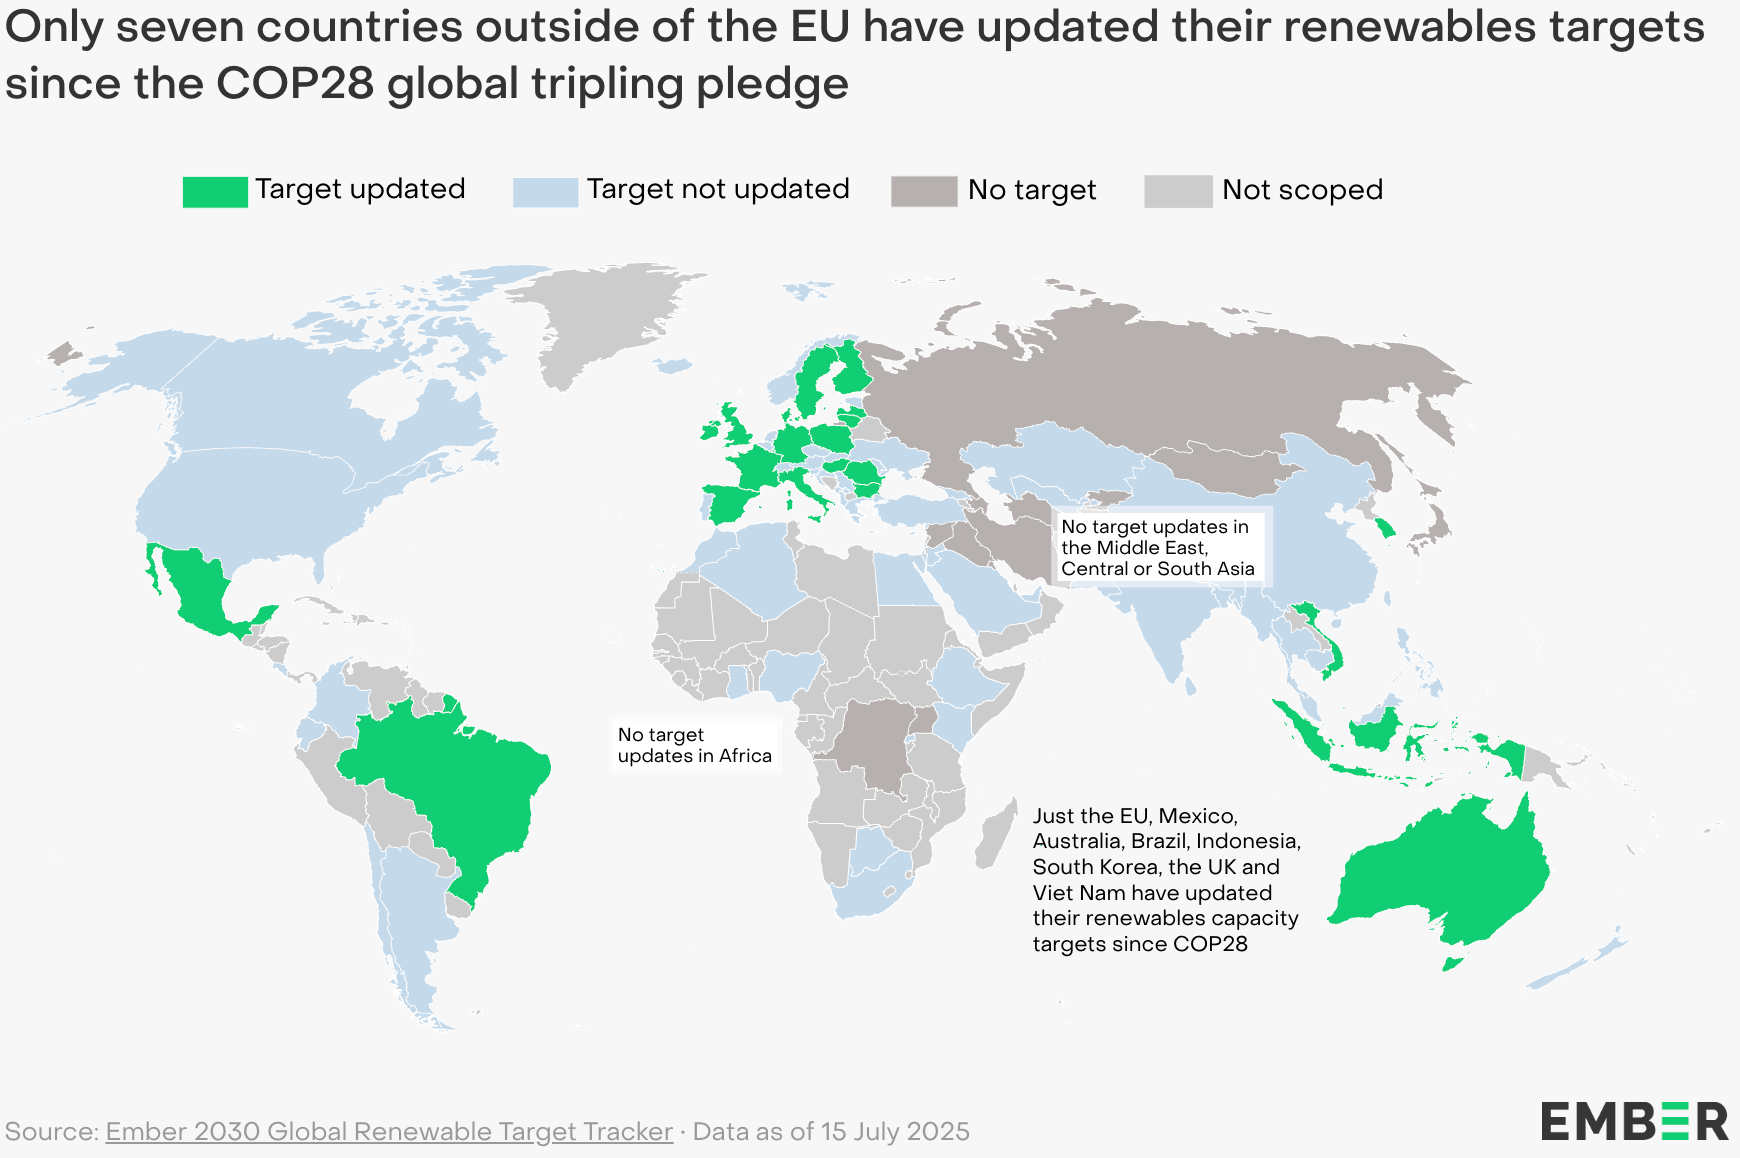
It wouldn't be a Data Vis Dispatch without a few charts on renewable energy:
![Gazeta Wyborcza: <a href="https://biqdata.wyborcza.pl/biqdata/7,159116,32145401,energetyczna-pulapka-tak-przestarzale-budynki-winduja-rachunki.html"><strong>Energetyczna pułapka. Tak przestarzałe budynki windują rachunki najuboższych</strong></a> [<em>Energy Trap: How Outdated Buildings Are Driving Up Bills for the Poorest</em>], August 4](https://datawrapper.de/cdn-cgi/image/quality=85,width=1682,f=auto,fit=cover/https://kirby.datawrapper.de/media/pages/blog/data-vis-dispatch-august-5/c5aaf1f891-1754383541/cleanshot-2025-08-05-at-10.44.59@2x.png)
These articles covered socio-economic factors in Germany — from local rents to your expected pension:
![Der Spiegel: <a href="https://www.spiegel.de/panorama/gesellschaft/einkommen-alter-wohnungsgroesse-wo-in-deutschland-durchschnittliche-menschen-leben-a-bbd47ae8-c82f-4b13-9e73-98a2649fd772"><strong>Leben Sie über dem Durchschnitt?</strong></a> [<em>Map title: Around-average rents</em>], August 2 <span class="badge">Unusual angle</span>](https://datawrapper.de/cdn-cgi/image/quality=85,width=1165,f=auto,fit=cover/https://kirby.datawrapper.de/media/pages/blog/data-vis-dispatch-august-5/61fc237b52-1754384389/cleanshot-2025-08-05-at-10.58.18@2x.png)
![Die Zeit: <a href="https://www.zeit.de/wirtschaft/2025-07/rendite-rente-geburtsjahr-einzahlung-auszahlung-vergleich"><strong>Wie viel zahle ich ein – und was krieg ich an Rente raus?</strong></a><strong> </strong>[<em>How much do I pay in – and what pension do I get back?</em>], July 31](https://datawrapper.de/cdn-cgi/image/quality=85,width=1871,f=auto,fit=cover/https://kirby.datawrapper.de/media/pages/blog/data-vis-dispatch-august-5/f93f93a648-1754384924/cleanshot-2025-08-05-at-11.06.55@2x.png)
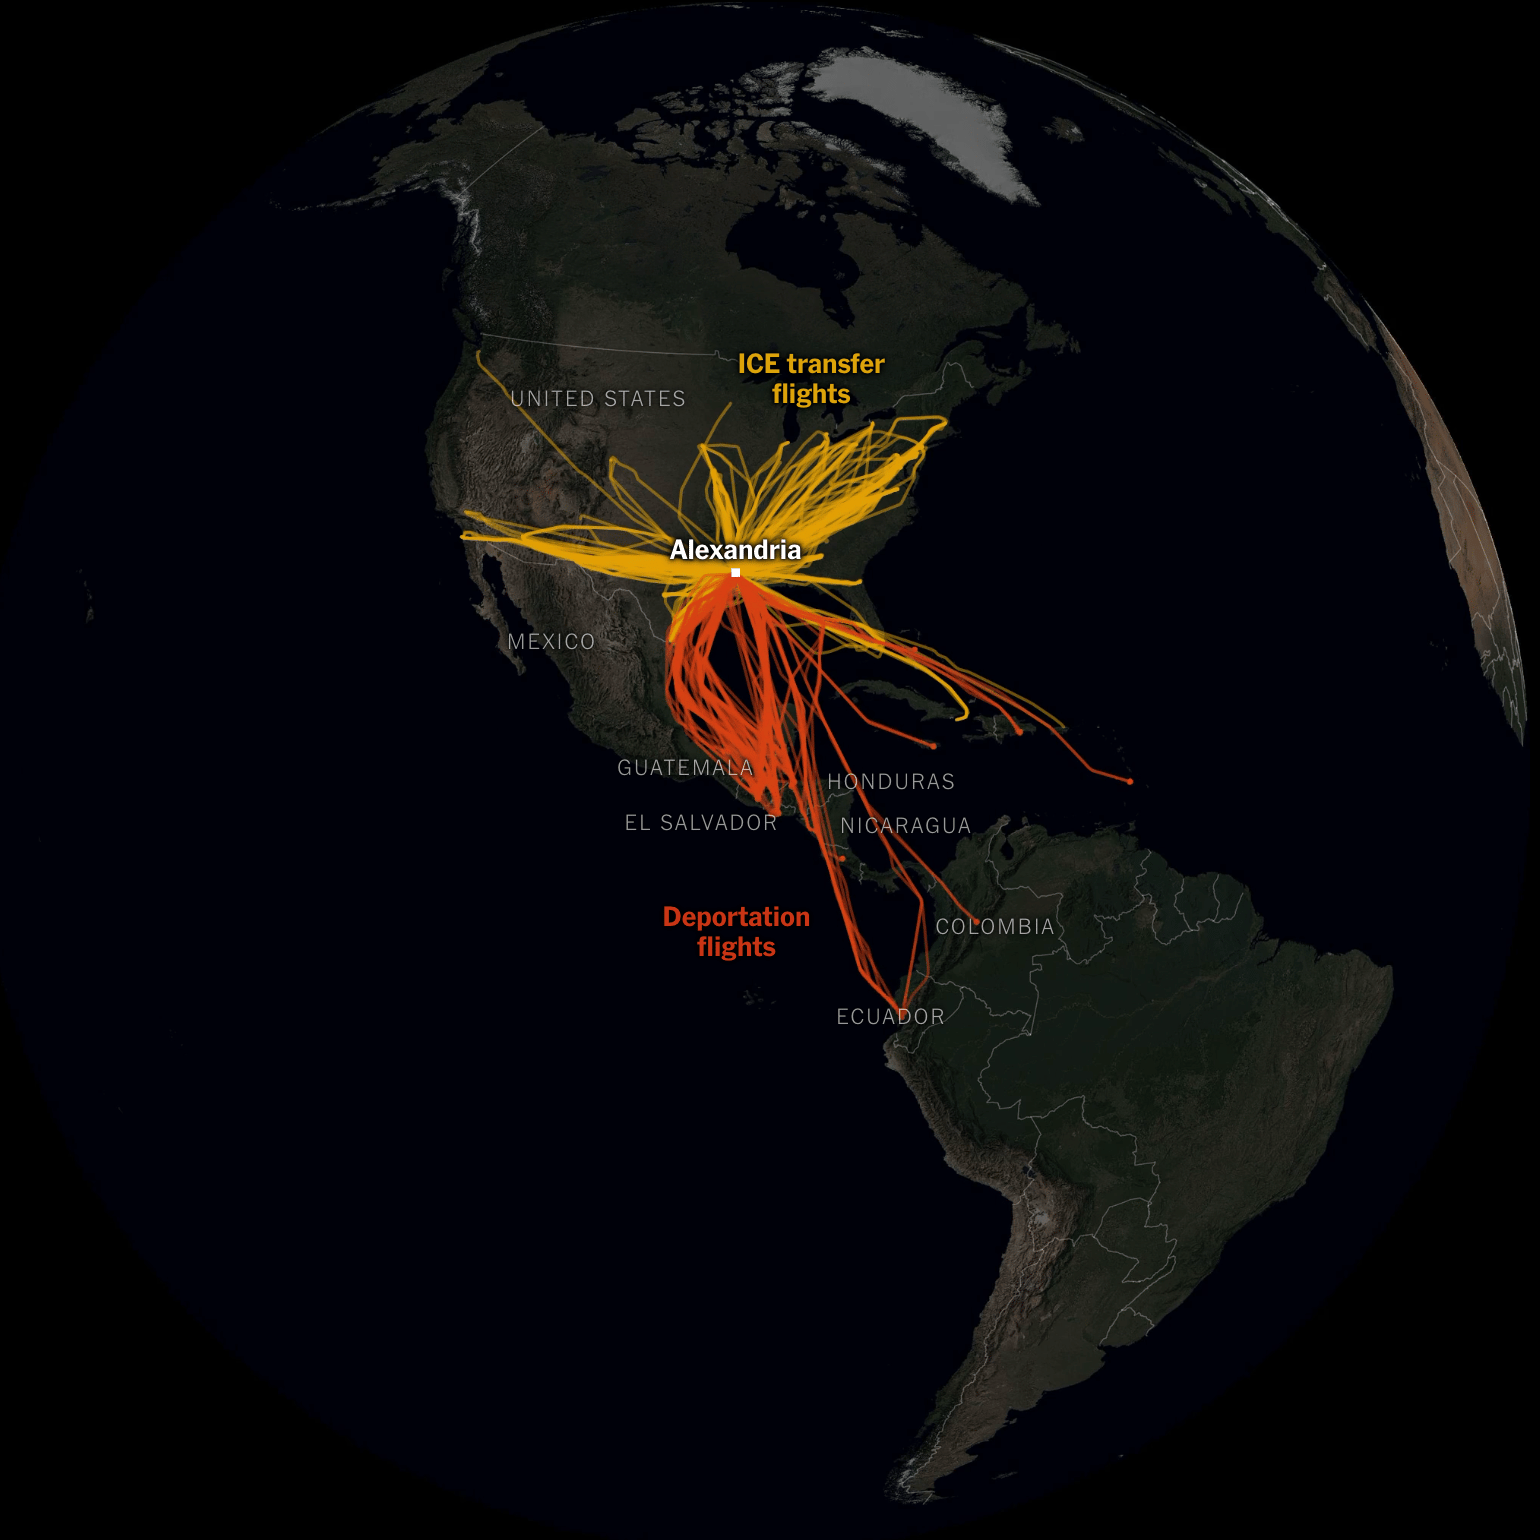
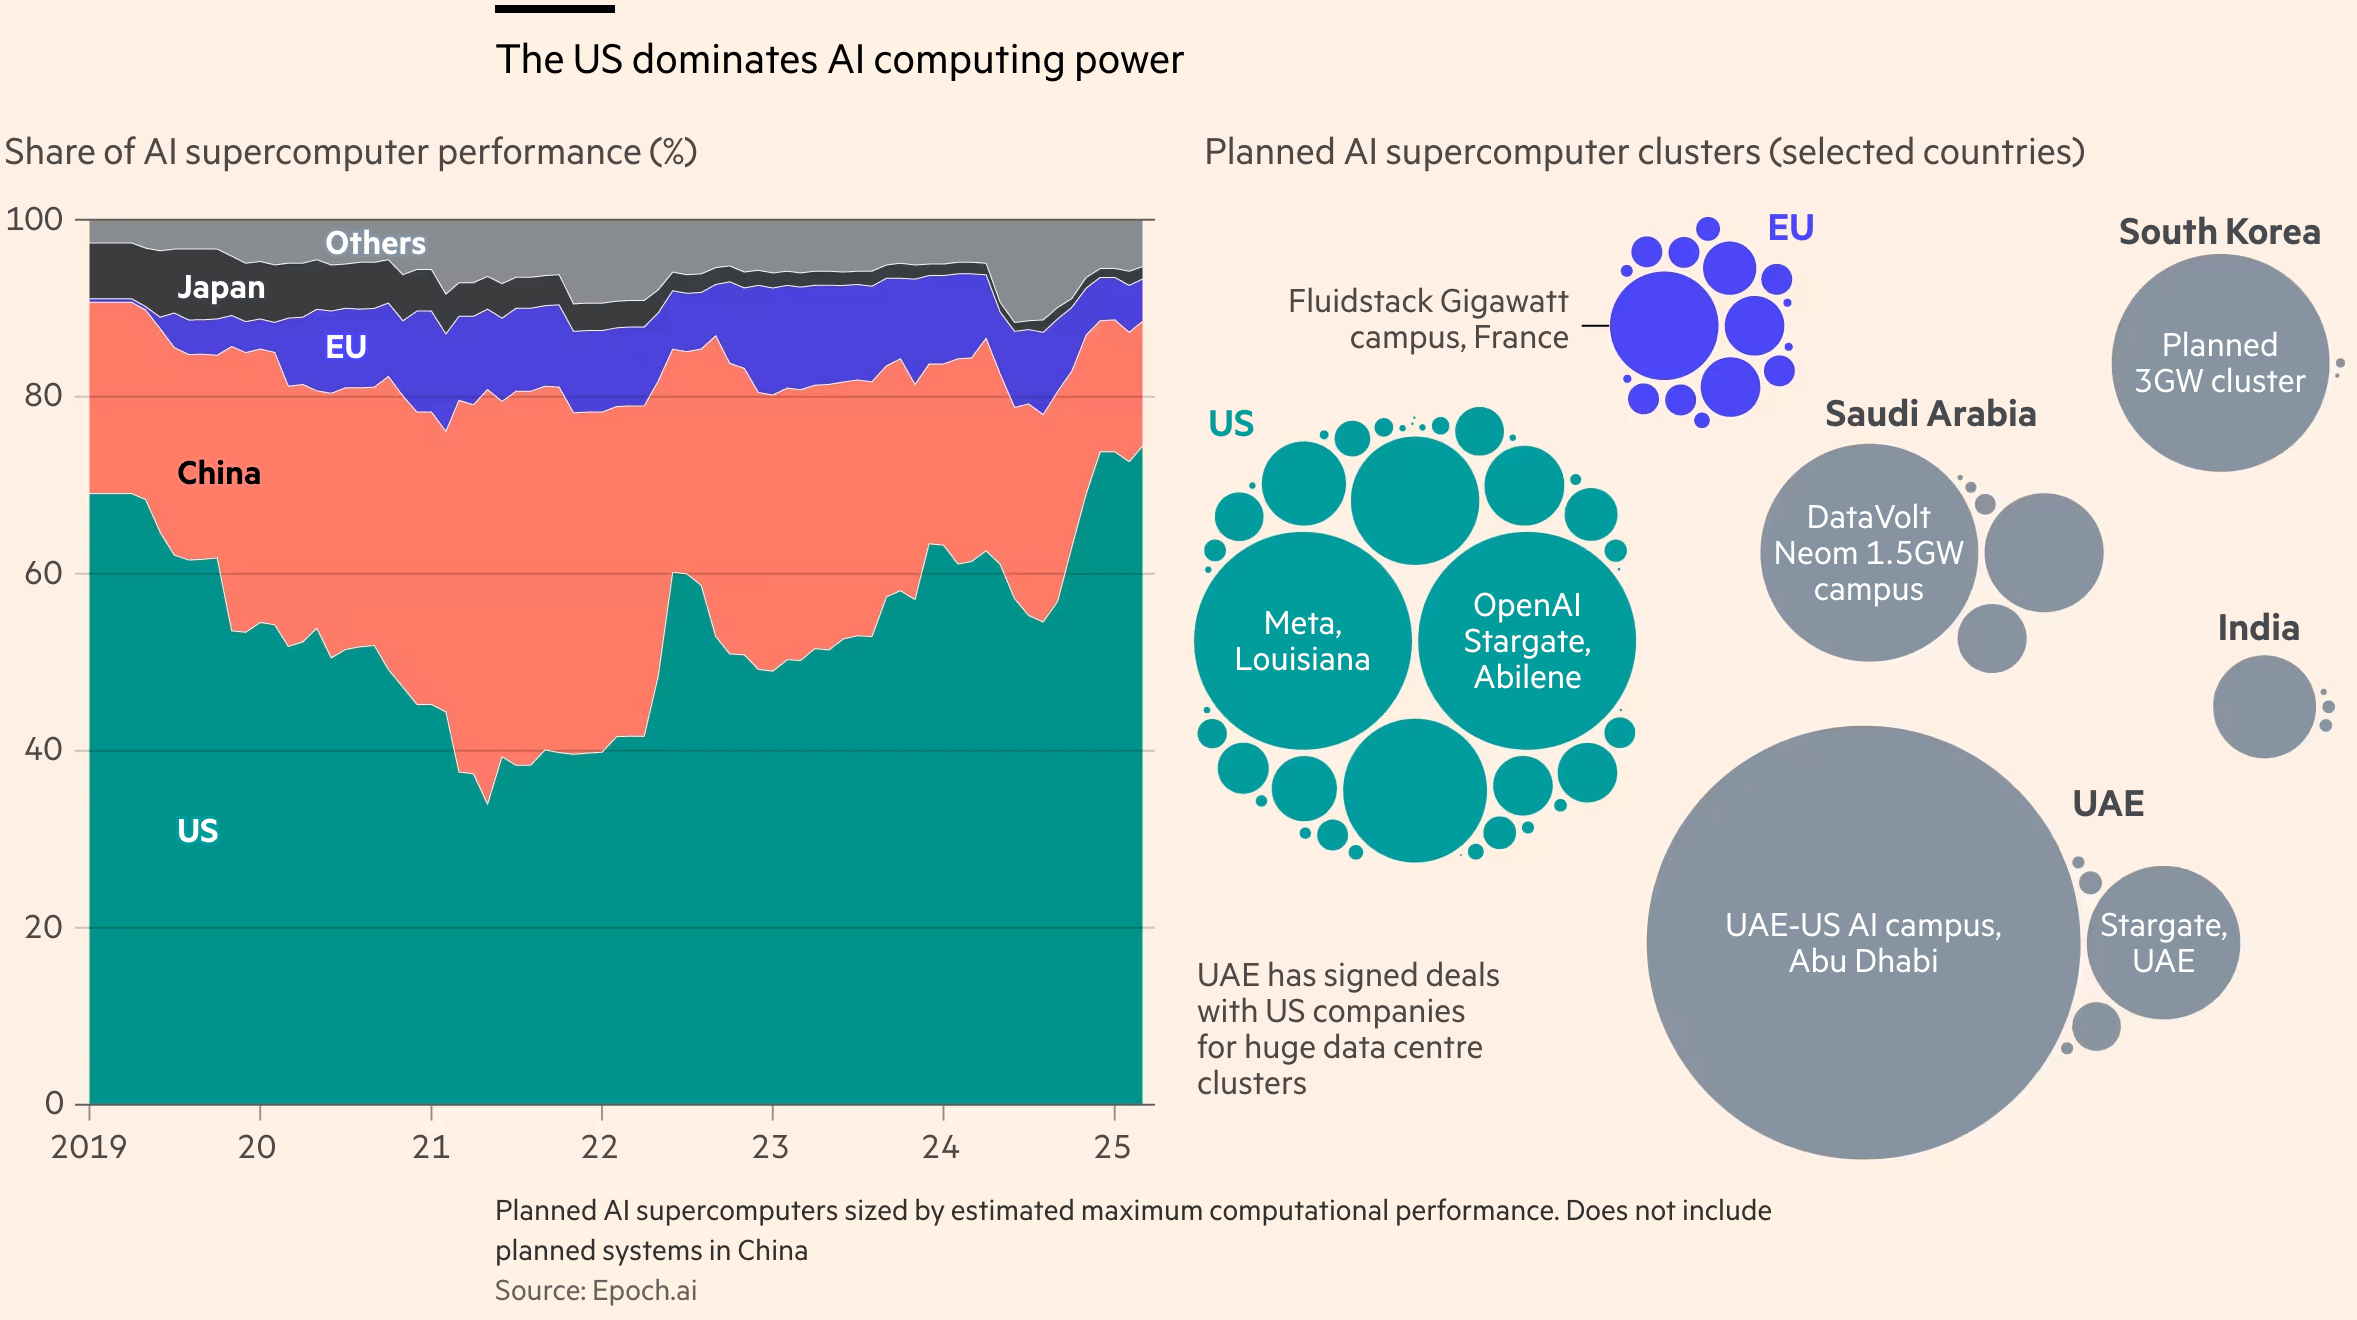
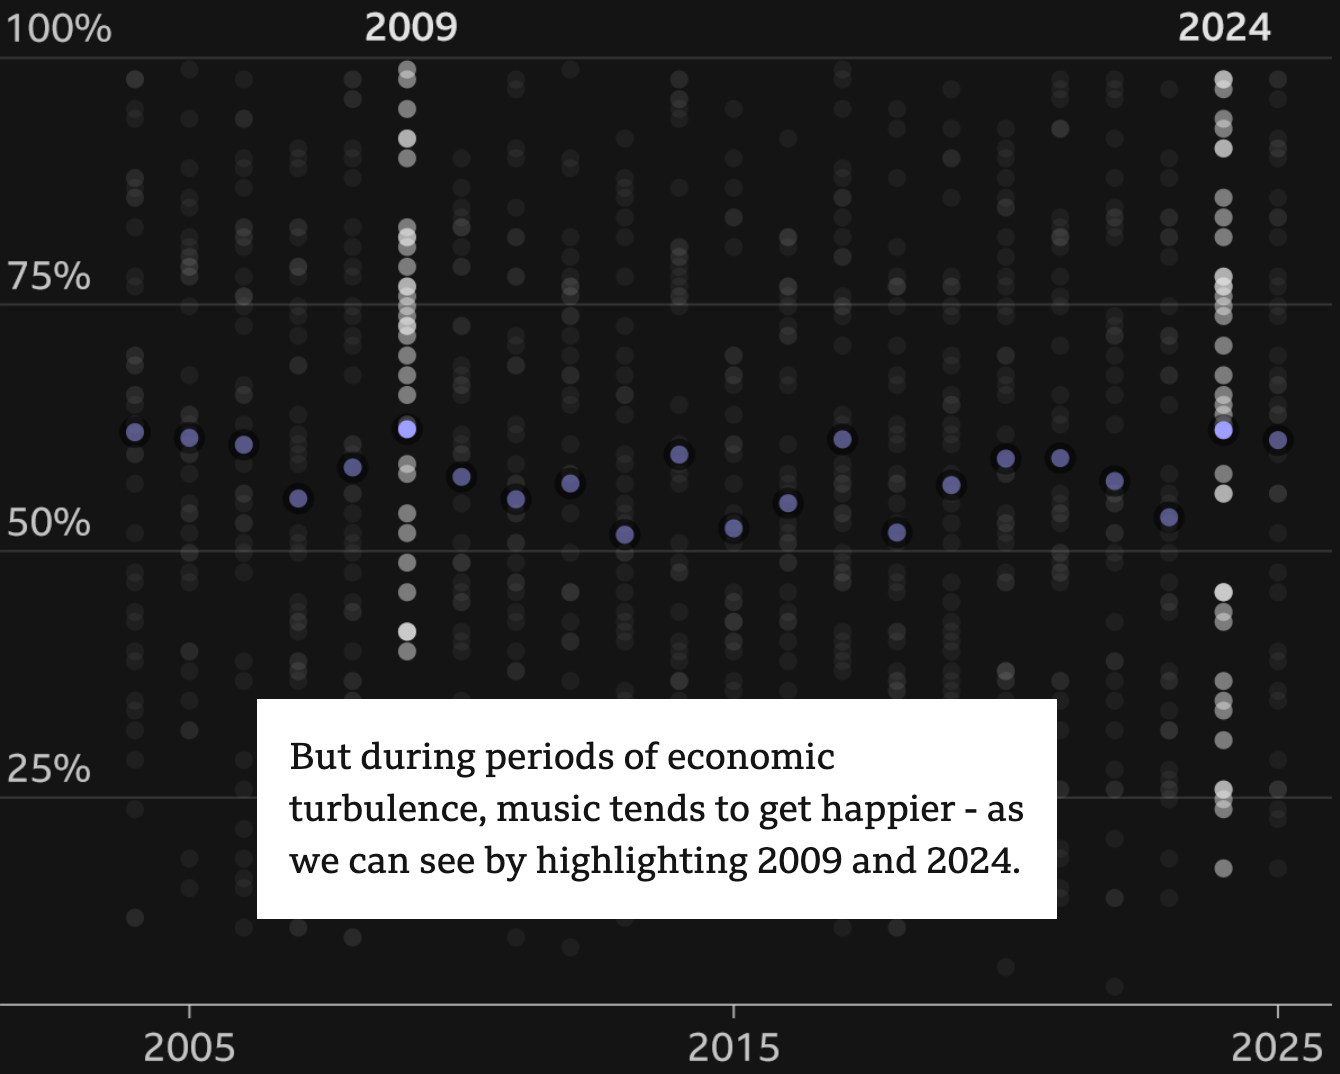
Other notable charts covered U.S. deportations, AI performance, and happy songs in trying times:
What else we found interesting
![BBC: <a href="https://www.bbc.com/bengali/extra/aimee860o7/36-days-of-july-revolution-in-bangladesh"><strong>জুলাই গণঅভ্যুত্থানের ৩৬ দিন</strong></a><strong> </strong>[<em>36 days of July Revolution</em>], August 4](https://datawrapper.de/cdn-cgi/image/quality=85,width=1670,f=auto,fit=cover/https://kirby.datawrapper.de/media/pages/blog/data-vis-dispatch-august-5/a9177c2342-1754393787/cleanshot-2025-08-05-at-13.35.51@2x.png)
Help us make this dispatch better! We’d love to hear which newsletters, blogs, or social media accounts we need to follow to learn about interesting projects, especially from less-covered parts of the world (Asia, South America, Africa). Write us at hello@datawrapper.de or leave a comment below. Want the Dispatch in your inbox every Tuesday? Sign up for our Blog Update newsletter!


