Examples of Datawrapper grouped bar charts
Here we collect examples of grouped bar charts that are created with Datawrapper, to show the possibilities that our chart editor offers. If you want to create a grouped bar chart yourself, visit the article "How to create a grouped bar chart".
If you want to find out how a certain chart was created, hover over the chart and click on "Edit this chart" in the top right corner. This will create a copy of the chart and bring you right into step 3: Visualize of the chart creation. There you can play around with the settings or go back to step 2: Check & Describe, to find out how the data for this chart was structured.


This chart first appeared in our blog post "The AI gender gap" .
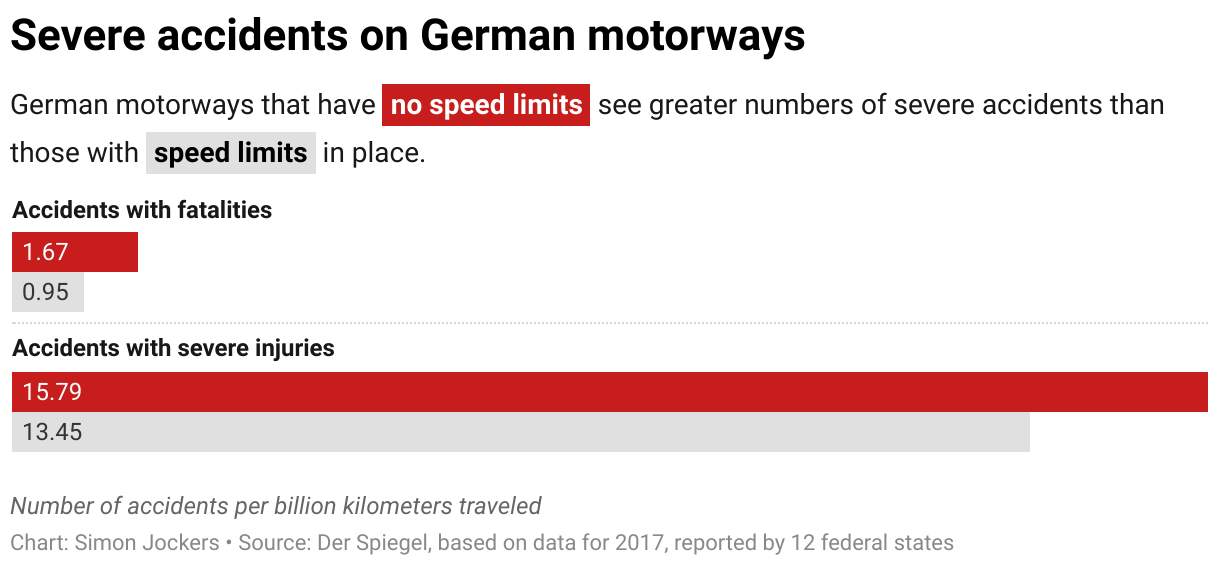
This chart first appeared in our blog post "The case for speed limits" .