The Weekly Chart turns 400

Hi it’s Rose! I’m Datawrapper’s deputy head of communications and today I’m celebrating a Weekly Chart milestone.
Four hundred weeks is a ripe old age for a blog series. It was already almost two years ago that we celebrated the 300th Weekly Chart with a big retrospective, including lots of illustrations and charts analyzing the chart types, topics, and authors of its first six years. But although Weekly Chart has gotten older, it’s never stopped learning new tricks. So for this anniversary, I decided to create three charts that wouldn’t have been possible back in 2023.
Let’s start with a look at how our chart usage developed over these years:
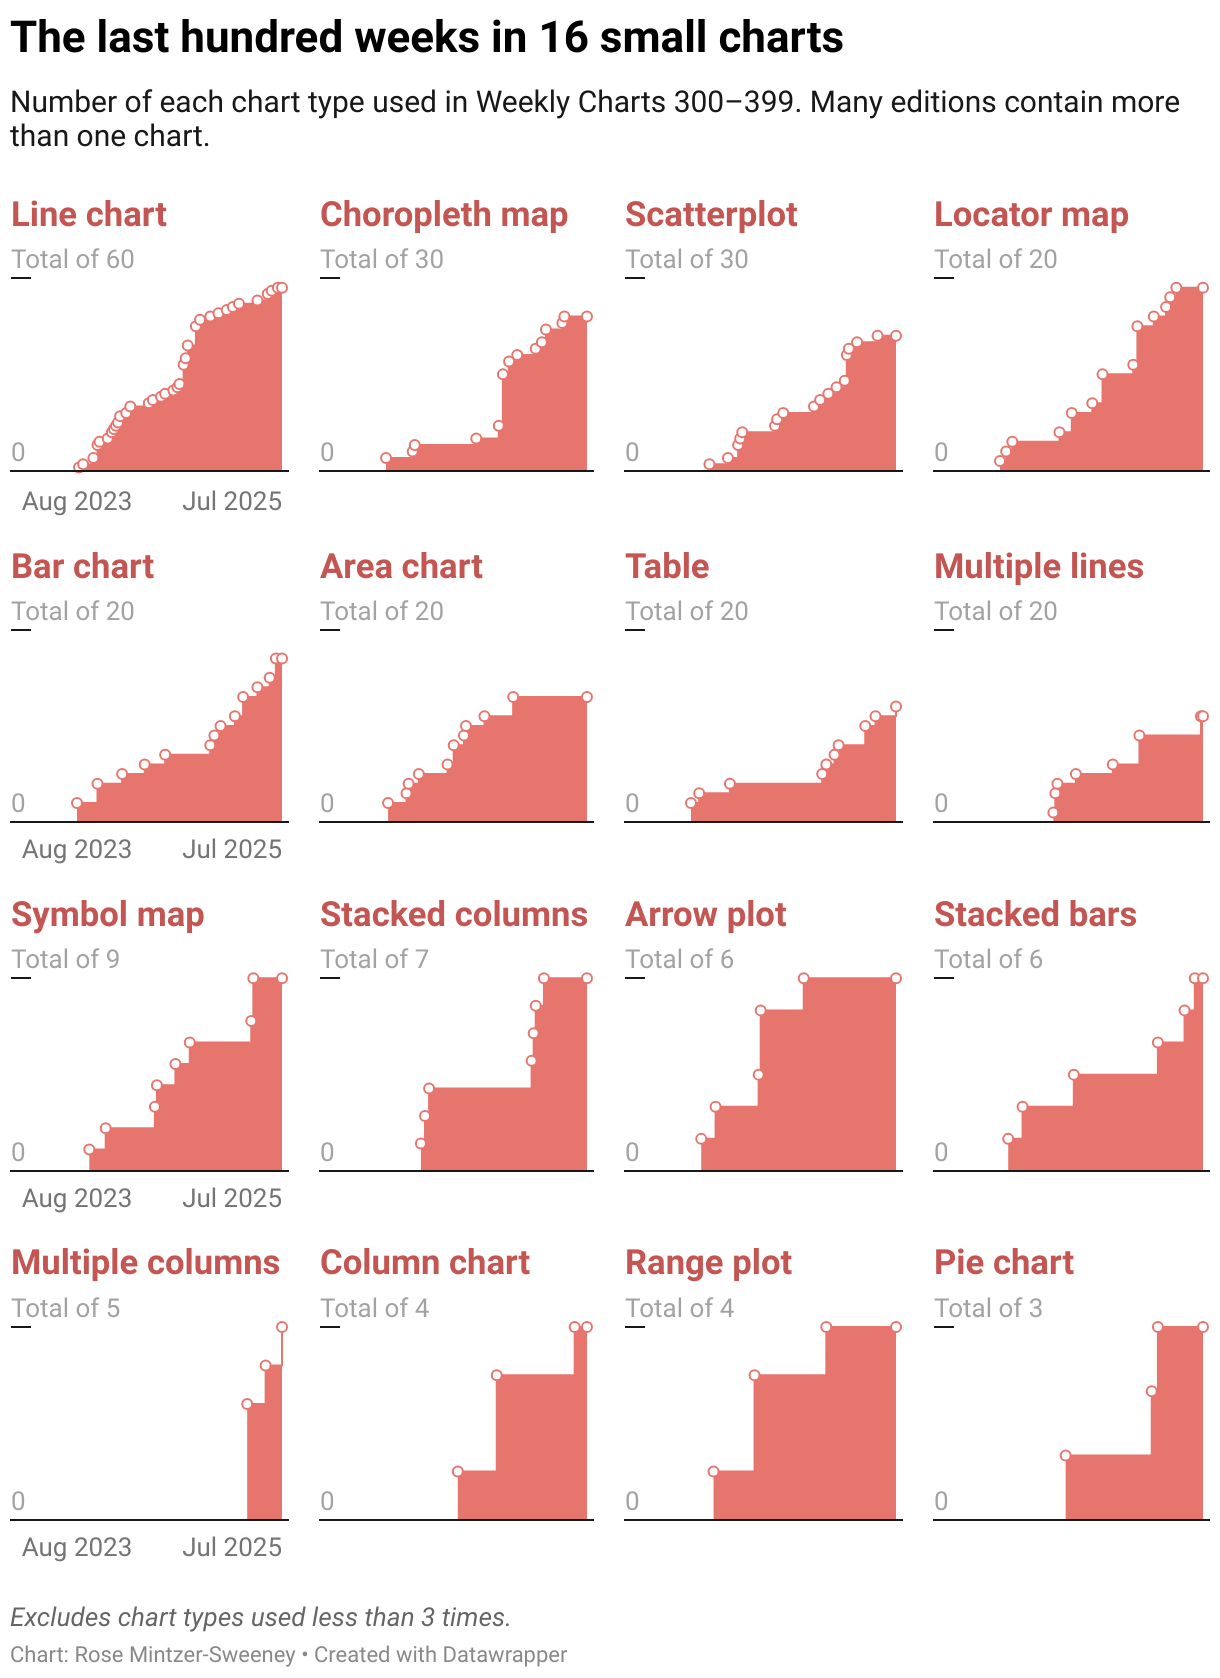
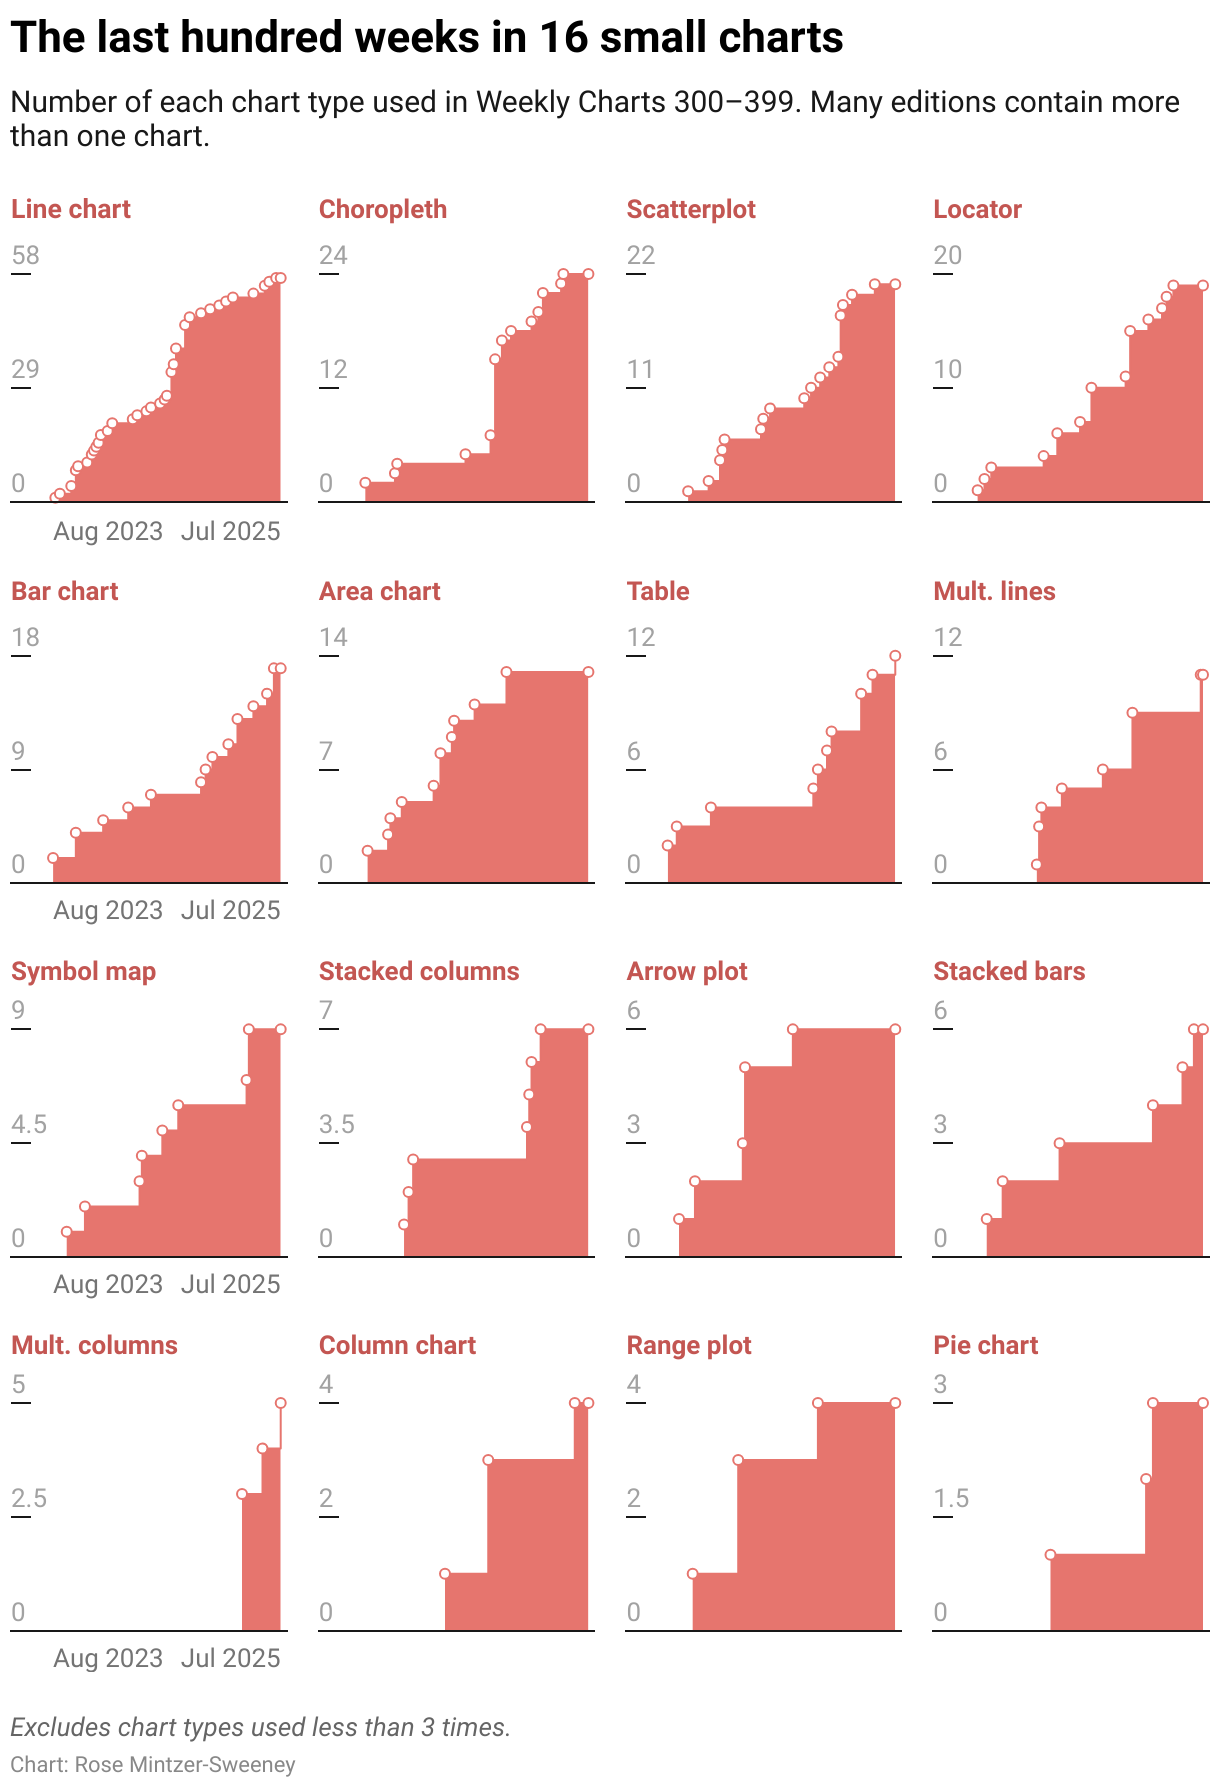
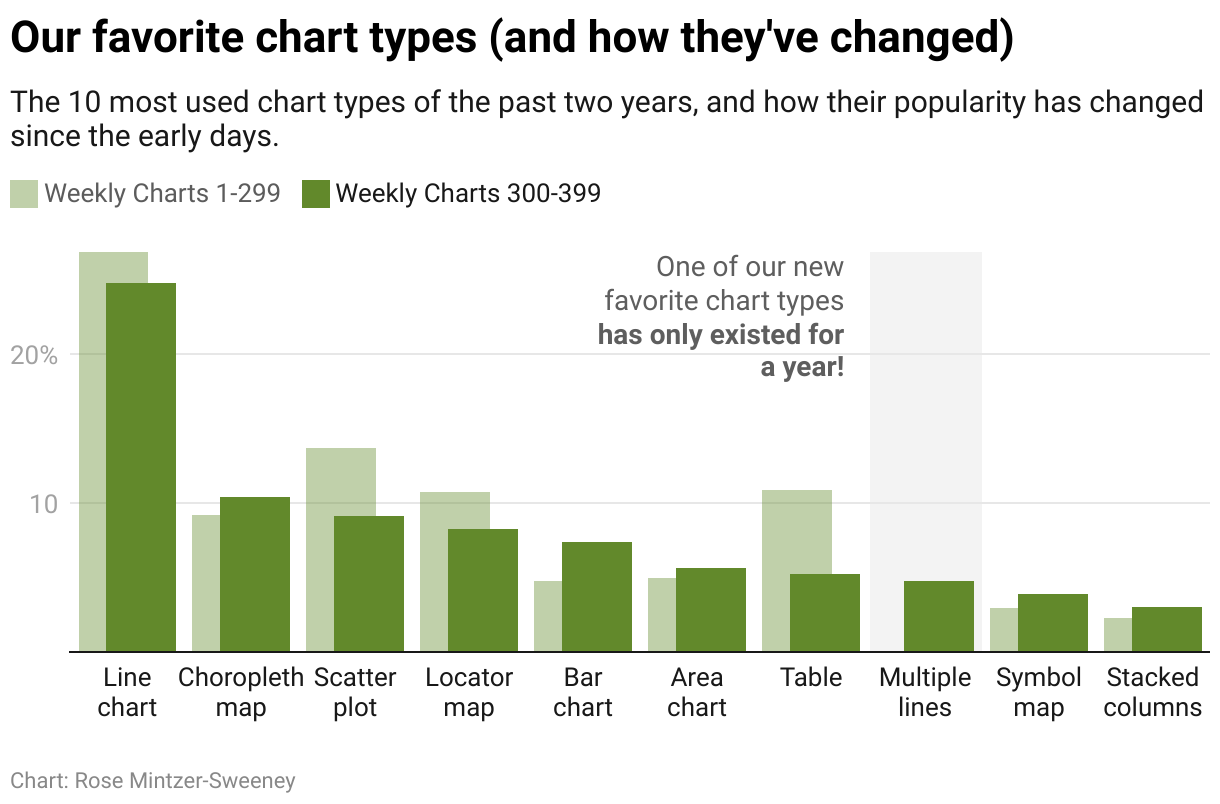
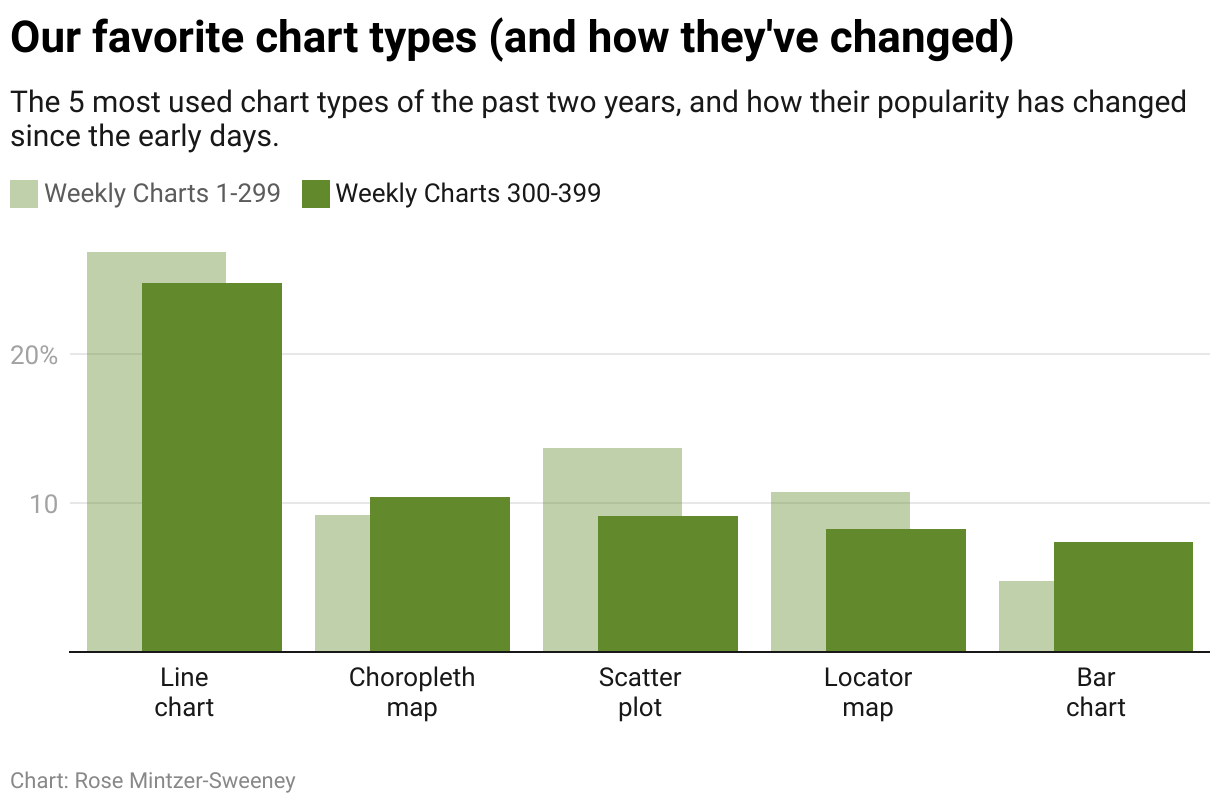
Our favorite chart types haven’t changed much: nine out of our top ten favorite charts were the same in both periods. But their rankings shuffled a bit — choropleth maps, for example, climbed from fifth place to second — and one notable newcomer has already elbowed its way to the top.
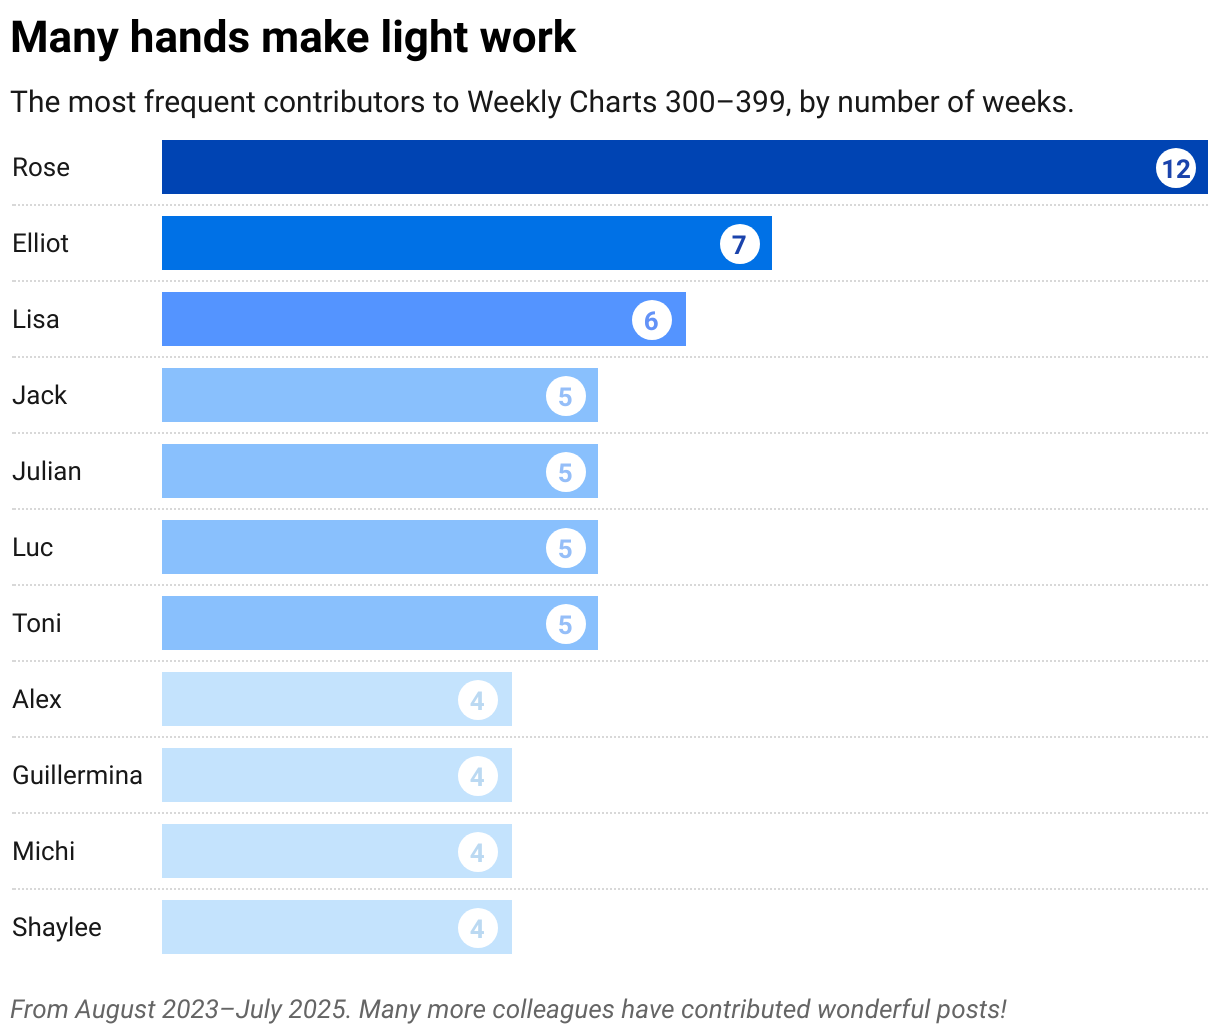
The Weekly Chart would never have made it this long if the work weren’t shared. As the team has grown, we often have more eager authors than there are weeks in the year — so consider these numbers a floor, not a ceiling, on our Weekly Chart enthusiasm!
And finally, thanks to all the loyal readers — there wouldn't be a Weekly Chart without you! Come back next week for number four hundred and one.


