Alex Hamilton, Dealroom.co, about building products with Datawrapper’s live functionality


Alex Hamilton from Dealroom.co spoke at our Unwrapped conference about "Building popular new products utilizing Datawrapper's live functionality." Alex is the data visualisation lead at Dealroom.co, a startup intelligence platform based in Amsterdam. Having worked with Datawrapper for over three years, he also often acts as customer support on the tool for the rest of the Dealroom.co team.
Watch his talk here:
02:00 – About Dealroom.co
03:24 – Benefits of using Datawrapper when building reports
05:23 – Use of live-updating visualizations
07:42 – Datawrapper tables as databases
09:02 – Connecting to Google Sheets
14:32 – Q: Transferring knowledge?
15:50 – Q: Pro tips for beginners?
Full transcript
Introduction
[00:00:04] Alex Hamilton: Thank you very much for the introduction there, Michael. And, yeah, very delighted to be here today following some very great speakers who'll be also presenting over today and tomorrow. I'm going to be talking today about the transformative impact that Datawrapper's had on our work here at Dealroom, presenting our startup insights and how to leverage the live- updating functionality in order to be able to build impactful tools and products.
So yeah, just as an introduction. Michael's already done a little bit. I explained that I already have a little bit of experience with Datawrapper previously and I'm going to take you a little bit on that sort of journey bringing that into Dealroom and talk about the sort of transformative effect that sort of had with the work.
I'm the data visualization lead at Dealroom. My job is to build data visualizations and products that help communicate startup insights at scale. As part of my introduction, I just give this a little bit of an overview of my economics background and then the work that I've done on a side project with some friends, trying to visualize data visualization insights for Northern Irish politics. And for this project, we needed a tool to be able to present these insights with the public and came across Datawrapper on a Medium article, and just found the tool very user intuitive, very easy to be able to pick up, with really good documentation and we're able to embed these really professional looking visualizations and charts onto the website.
So that was my background there a little bit. And I was able to bring a lot of the sort of experience I had on building Datawrapper sort of tools in this sort of website into the work at Dealroom. And it's also where I gained all sorts of knowledge for the different settings and adjustments that can be made in Datawrapper to my colleagues at Dealroom, acting as customer support there.
About Dealroom
[00:02:00] Alex Hamilton: But speaking of Dealroom. What is Dealroom, for those unfamiliar? So Dealroom is a data platform for market intelligence on startups and technology companies worldwide. We're based in Amsterdam and we act as a sort of central hub connecting lots of different players in the startup ecosystem. So this can include the likes of governments, startups, VC investors, job seekers, amongst others.
Each of these have their own unique interests and information needs. However, a common theme across all of them is that they will have the desire for up to date startup insights and want to know what's happening in the startup global ecosystem in order to inform them with their decision making.
And this is where Datawrapper has really proved instrumental in its ability to streamline a lot of our processes and present our live startup insights in a really coherent way. Continuing on that story of previously using Datawrapper as part of this POSIX project, I was able to bring this work into the job that I had at Dealroom in the intelligence unit.
So the main job that I had was to build startup insights research, covering lots of different European geographies and emerging tech trends. So this could be, for example, the state of startup jobs in the Netherlands or the Spanish startup ecosystem, as well as other industry segments.
Benefits of using Datawrapper when building reports
[00:03:24] Alex Hamilton:And we had some sort of challenges in our sort of workflows for the report building process, where Datawrapper was really supportive and being able to improve these tools. So I'll go over some of these here and then talk about the evolution of the use of Datawrapper on their own, and how it's been able to be fundamental in us being able to present startup insights with the live updating chart functionality.
So prior to my time at Dealroom, I think a lot of the data visualizations that we were building in part of reports were manually created. And quite static by nature, which meant a lot of time being spent back and forth with the design team and the analysts in order to be able to build these visualizations.
So implementing Datawrapper in part of this report building process has really saved hundreds of hours, probably estimated on a yearly basis of just removing the sort of time being spent going back and forth in these issues and allows us to be able to also repurpose these visualizations.
So not only in a PNG or an image format for reports, but also online as a Datawrapper has really fast and dynamic visualization benefits once embedded online. So it means that we don't need to repurpose and rebuild a lot of visualizations or ask the design team to be able to build these specific graphics.
And it really improves the sort of user experience and allows them to really dive into the insights there. As anyone who's ever embedded a Datawrapper visualization onto a website, it's just an example of some of the charts that we have online, and how it allows the users to be able to dive a little bit more into the data itself, and uncover trends that they may not have been able to do just with a static screenshot. Working with Datawrapper at Dealroom first came as a point of how can we improve the report building process? So that it isn't time consuming or manual for certain parts.
Use of live-updating visualizations
[00:05:23] Alex Hamilton: And obviously with the ability to embed the charts into the website or online and with the live functionality, how are we able to present up to date live information with our audience so that they can see the most current trends in the startup ecosystem.
So this is where we strive to implement the functionality of the live chart visualizations into the products that we were building. I'm going to cover some of the live updating chart functionalities that we've been using here at Dealroom, the value that this brings, and, also later on, cover just a short segment on how that sort of works at a very high level, along with some Datawrappers for resources, if you're interested.
One of the sort of products that we've been developing ourselves have been these deep dives, which are free user friendly guides covering technology and startup topics, featuring live updating charts, which provide users with all the sort of up-to-date, need-to-know information about segments such as generative AI or the startup ecosystem in various different countries.
We're able to do the analysis, present the information and leverage the live updating functionality, as well as the API, to be able to bring this information in. So whenever journalists, users, people interested in the tech ecosystem read these guides, they can know that they're getting the most up to date numbers.
So a couple of examples can be seen here. So we have guides on all different types of topics seen on the left hand side and a couple of visualizations that would be embedded on the page on the right. And the different topics. So these could be tables on leading investors into a certain area or segments, maps showing a venture capital distribution across a country or region, and all these up to date numbers and bar charts and all the different chart types that Datwrapper offers.
The fact that we're able to live connect a lot of this data from already having a database and being able to present the same information that is available on the platform is super beneficial and with the API, being able to manage this, is super helpful. I know there'll be other speakers talking about how to leverage the API, so I will give a little bit of a very brief overview, as I talk about it in my speech.
Datawrapper tables as databases
[00:07:42] Alex Hamilton: Another sort of tool that we've developed in order to be able to help our users to, search for these emerging startups and all these sort of sub niches is that we have this dashboard, which essentially allows people to use natural language to be able to search for startups across different segments.
So even working in a specific segment, it can be quite hard to track all the different startups and the niches that exist within that. And since we have data on the over 3 million different companies, it can be hard to be able to find where all these different niches are.
And using a lightweight tool like Datawrapper's table, it's really easy for us to be able to showcase how to be able to find these types of startups across 500 different industries, sub industries, segments, et cetera. This is like a really good sort of use case that we've been able to build with Datawrapper's technology.
And yeah, just as mentioned in the guides, we're able to distribute these live charts that are updated in real time across the platform and on the website. So we're able to customize these to our needs or leverage different templates that we've already built and, yeah, the live updating side of things and the API really makes this a very streamlined process.
Connecting to Google Sheets
[00:09:02] Alex Hamilton: So in this segment, I'm just going to demonstrate a little bit about, on a very high level, how this works, with some information that you can get on the Datawrapper website for the documentation. So I'll talk about how to set up a single Datawrapper chart which automatically links to a Google Sheet Spreadsheets. I'll talk about what a pipeline of creating various data visualizations would look like with the Google Sheets option and the Datawrapper API. And, yeah, in this example, I'm going to go over using the easier methodology of using Datawrapper's own servers and using them to fetch the data periodically, which can also be done yourself, but I'll show the easier methods this way.
So the first question is: How is the data itself connected? How can we make this a live chart per se? So in this sort of graphic from the Datawrapper website, it shows that you will upload a CSV file, an Excel file, somewhere on the internet. And Datawrapper will fetch the information from that dataset once you've given it the permissions, and we'll use that to update the chart.
This way there's no complications, it's very straightforward and easy to be able to do. And the link on the right hand side will be able to give a little bit more of a step by step process and guide on how to be able to do this. So this is the sort of methodology that I'll go over.
In terms of how this is done, this is just a very simplified sort of way. For Datawrapper users who are already familiar, you want to prepare your data already in Google Sheets, that's already cleaned and formatted in the right way. Then you go to the Upload Data tab and the Datawrapper Create a Chart section, and then you link the URL with the permissions that have been granted, for Datawrapper to be able to fetch that information into the search box seen on the far left hand side. And then once you have two green ticks showcasing that you've got a positive connection, that means that you can move on to the next step, which is the Check and Describe, and then making all the different sort of visual annotation changes that way.
How often is this information updated? It's updated pretty often and more than enough for what we need. It's on a daily and a minute basis for the first day.
And then after the first day it's updated every hour until the end of the month. And then it needs to be republished. Again, as mentioned, this can be hosted on your own end if this isn't suitable for your own needs, but it's great. And the fact that Datawrapper is able to pull this information and give a very easy option for this to be able to be done.
And yeah, just at a very high level, I'm sure the API people later on will be able to give this in a bit more detail. But this is just generally speaking how one would make many charts from a database to a Google Sheets using the API. And basically from left to right you want to query your database with one dataset and build a connection between the database and the Google Sheets.
Once you get the data into the Google Sheets, just as you would for any other chart, you'd want to transform it in a way that can be used for other properly into the chart without having to make the changes in the Check and Describe tab of Datawrapper, as Datawrapper will be able to pull the information from one specific sheet.
You'll want to make sure that you have one sheet for each of the charts that you would want to make if you want to make multiple charts. So once you've split the dataset into the smaller sub dataset, which will have its own dedicated charts, you can create a Python or an R script and leverage the API to be able to batch create, edit and publish tens or hundreds of charts.
So this general process has been really helpful. And I think it's a really beneficial tool to be able to manage data visualizations at scale with Datawrapper. The fact that this is also part of the Free plan whenever I was working with this in my previous project, it meant that It's not necessarily a difference between the Enterprise plan and the Free plan, and it's a really big beneficial thing to have.
In summary, I just wanted to conclude and say that it's been a real pleasure to learn a lot more about data visualization with Datawrapper. And it's brought a lot of benefits working at Dealroom and using this technology to be able to streamline our report process, making a lot less manual, we can be more creative and we can repurpose a lot of the insights that we have in the reports into online methods.
And using the live updating functionality and the API, there's lots of different new cases, from updating maybe one specific Google Sheets and connecting that online or making this whole sort of pipeline of live charts distributed across your own website. I hope this is a general overview about how Datawrapper can be used for various different ways, not just for presenting one individual insight, but sometimes as part of a dashboard, sometimes just to build like this big sort of live library of data visualizations. I hope that's been useful, and I'm going to link here the deep dives that we have across all these different tech segments and geographies that would be of interest.
Thank you very much for listening. Feel free to connect on LinkedIn, if you have any questions as well.
Q: Transferring knowledge?
[00:14:32] Michi (host): Amazing. Thanks so much, Alex. It was on your slides at one point, but dealroom.co/guides is where you can find more of these deep dives where a lot of Datawrapper charts are used. I was really impressed by the variety of charts that you use and chart types that you use. So that was very nice to see.
We have one question here from Arianna Brown. They say, great example, Alex, thank you for your clear explanation and usage. Will you describe this as an example of transferable knowledge and adding value to the company through other tools? They also add that you did a great job, or great work adding value to the organization.
[00:15:07] Alex Hamilton: That's very kind. Yeah, I think it's important with any role you go into to be able to share the information and the knowledge that you have, be that with programming or with Google Sheets or Excel or data visualization. And that's something that I feel I've been able to bring to Dealroom. But it's just been very exciting to be able to. Having worked with Datawrapper beforehand in a very small scale,
and then really to be able to work with the insights team and the intelligence unit at Dealroom to be able to build and distribute startup insights across a really big audience, in a way that's visible for a lot of users. So yeah, that sort of answers the question.
Q: Pro tips for beginners?
[00:15:50] Michi (host): I think I have a follow up question, also with regards to the fact that you've been using Datawrapper for quite a while. You're obviously quite skilled at it. And then there's also a lot of people that are watching now who either have never used Datawrapper or are only using it or beginning their journey, so to speak. What would you as a seasoned pro give them as a pro tip for people that are starting out?
[00:16:14] Alex Hamilton: Yeah, when I started using Datawrapper, I didn't really have the biggest experience with data visualization and analysis in that sort of specific niche. I did find the documentation and just the explainer articles on Datawrapper's own website that I've linked in the speech to be really helpful, because that's where I was able to learn a little bit about how to annotate different charts or the HTML and CSS little tips and tricks. Datawrapper has a really good library with the Datawrapper River, with different sorts of examples. The Dispatch, that you do on a weekly basis. So using a lot of these charts and sometimes duplicating existing charts where they're able to do so in Datawrapper. And then just try to reverse engineer what is that you want to do. And that's generally how I built a lot of the initial data visualizations that I've done.
And sometimes I see ones online and that's generally the process. Seeing the work that your team does at Datawrapper, you see all these extremely complex data visualizations. It can seem quite complex, but once you start to unpack it one piece at a time, it gets a little bit easier to be able to do.
[00:17:21] Michi (host): I think that's a great answer. I'm biased, but I would definitely echo that in terms of the Academy and also the River being perhaps very underrated resources for learning Datawrapper. Thank you very much for being with us today.
[00:17:35] Alex Hamilton: Thank you. Yeah. Cheers.
We asked him some questions:
Alex, what did you talk about?
Dealroom.co is a global data platform for intelligence on startups, innovation, high-growth companies, ecosystems, and venture capital investment. We also publish reports on startup trends on our website using Dealroom data.
Prior to adopting Datawrapper in 2021, we faced certain limitations in efficiency of showcasing our data effectively to existing/potential clients:
- Our in-house data visualization tools required pulling on our development team for any tweaks to functionality at the cost of other product development time.
- Customizing charts for PDF reports required more input from our designers.
- In some cases, insights produced would be buried (only) in a PDF rather than having the versatility to embed the insights in other formats on webpages.
Effectively, using a tool like Datawrapper has enabled us to decouple insights product development from our developer and designer time, empowering analyst to iterate more quickly and flexibly. The tool has allowed us to bring new efficiencies to our report and marketing workflow thanks to its flexibility and easy-to-learn interface. For example, it has enabled us to streamline our report and marketing workflow and reduce the time spent on manual graphic creation.
Implementing Datawrapper in the report-building process has really saved hundreds of hours on a yearly basis. Alex Hamilton, Dealroom.co, in minute 4:07 of his talk at Unwrapped 2024
In my talk, I discussed how we used the option to live-connect Google Sheets to Datawrapper to build two brand new client-facing products (Guides and Charts) that help us demonstrate so many insights and create interactive visualizations that allow users to understand the value of our data easily. We used the Datawrapper API to build and live-connect hundreds of new charts efficiently.
What kind of visualizations are you creating?
On the Dealroom website, we have curated deep dives on different innovation topics, leveraging interactive Datawrapper charts to provide all the need-to-know figures and insights on the global startup ecosystem and emerging tech trends. You can find the newest investment figures, emerging trends, technologies, and promising ideas here.
Here are two examples:
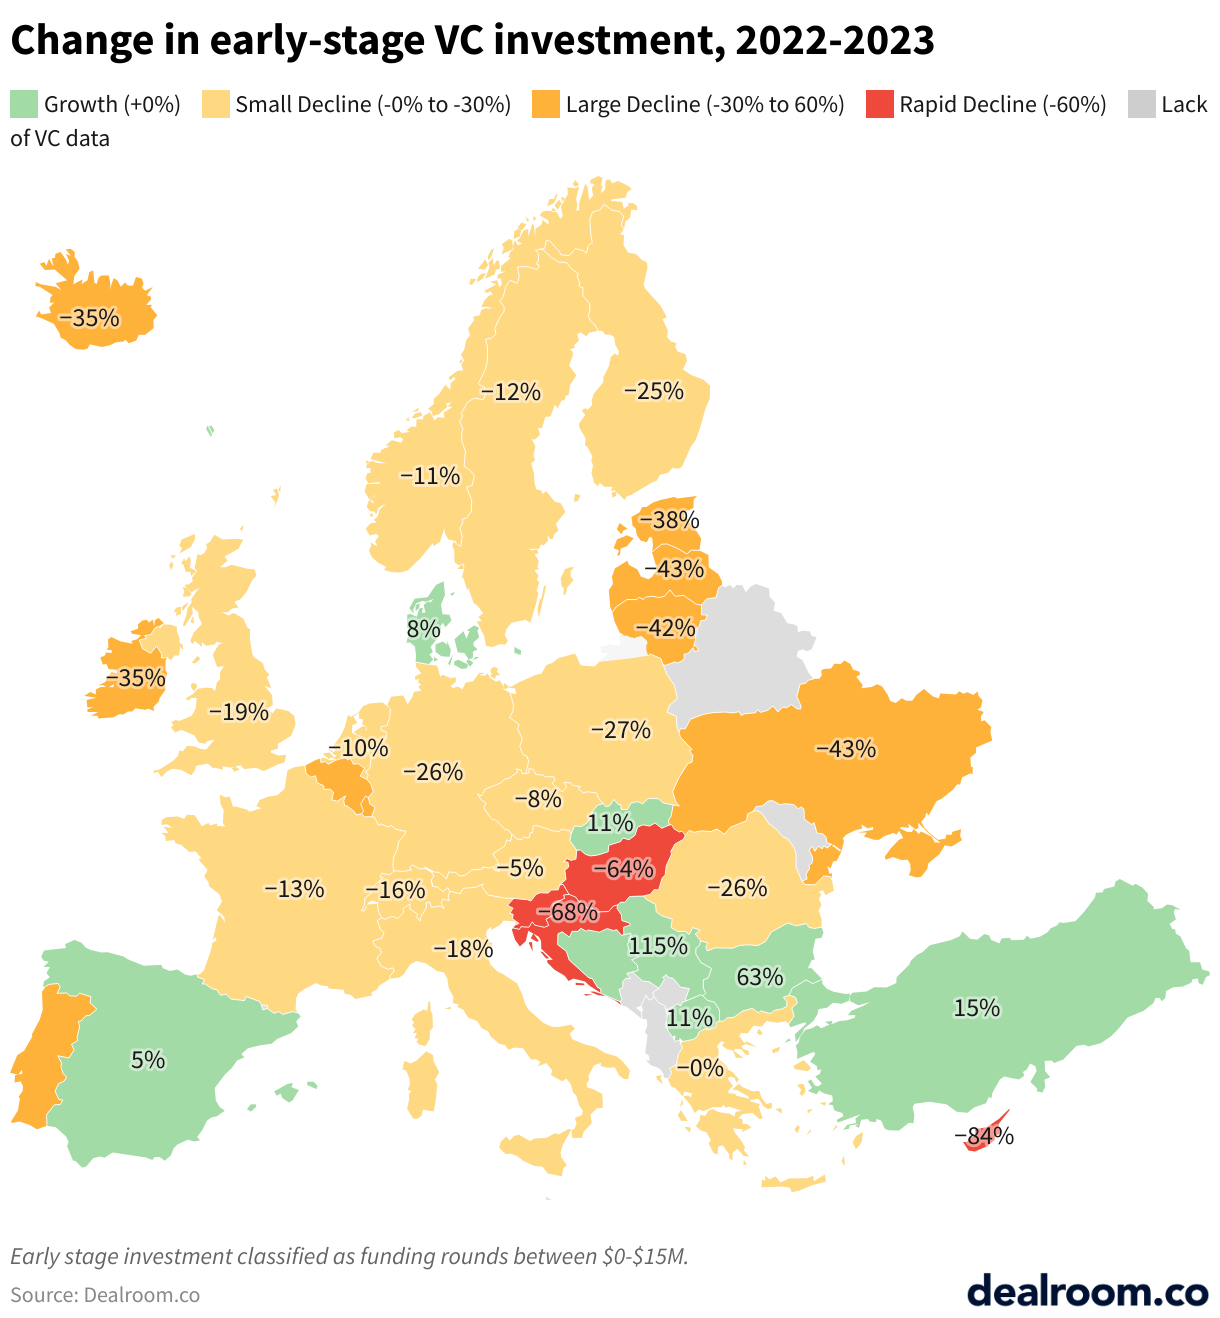
The choropleth map above shows the change in early-stage venture capital (VC) investment across Europe between 2022 and 2023. "Early-stage VC investment" refers to a type of financing that venture capitalists typically provide to startups and small businesses in their early stages of development.
Both 2021 and 2022 were exceptionally strong years for VC investment flows globally, so as 2023 ended, we observed that most European startup ecosystems and countries had seen different decrees of decline in VC investment with a few exceptions. The few notable exceptions to this trend included the likes of Denmark and Spain, two more mature startup ecosystems that saw their best year for early-stage funding in 2023.
Here's another visualization:
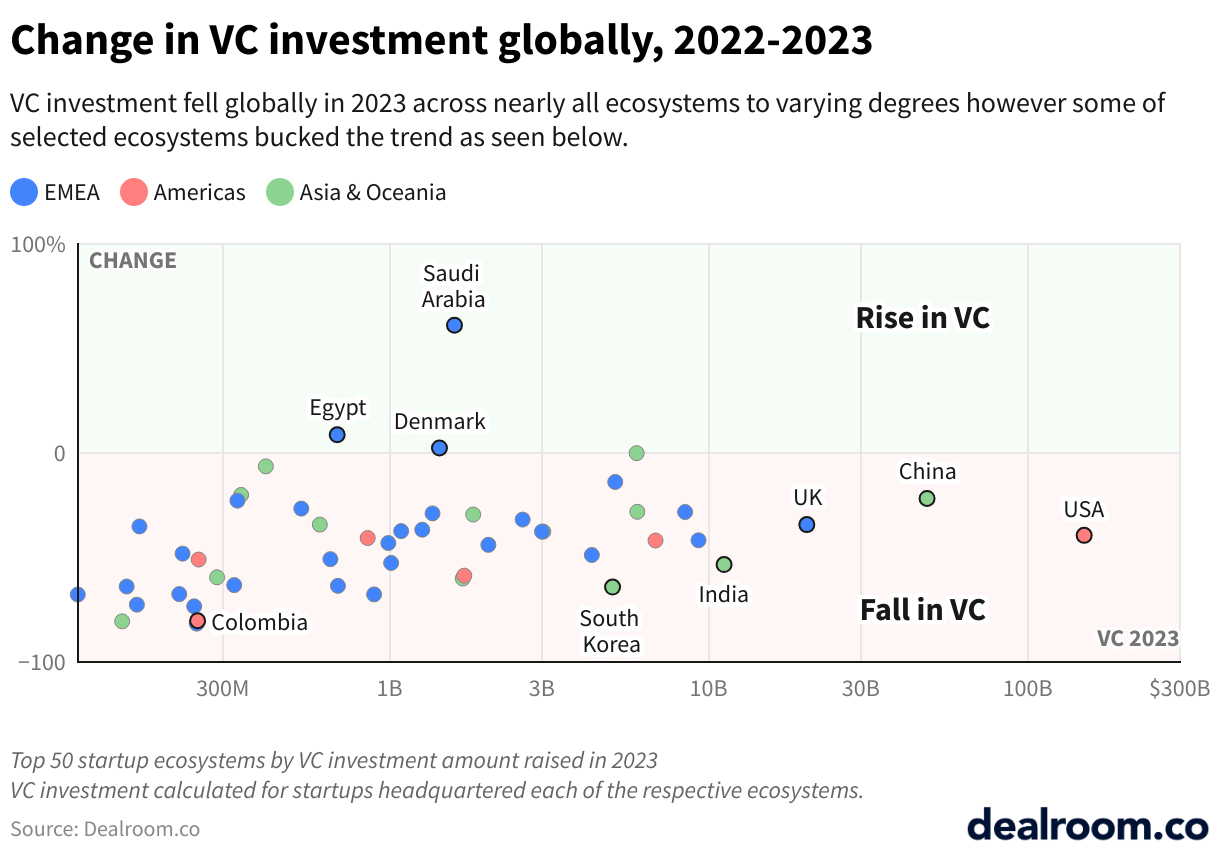
Similar to the first map, this scatterplot chart showcases the global trend in VC investment change from 2022-2023. This scatterplot allows us to focus on the 50 largest startup ecosystems by VC investment in 2023. Also, it shows the pattern and general trend of how nearly all startup ecosystems, with the exception of a few, experienced VC investment growth between 2022-2023.
Why did you start using Datawrapper?
While working on a politics website four years ago, I started using Datawrapper to help present voting patterns effectively through interactive visualizations. It was really easy to learn and allowed us to create compelling graphics that embedded seamlessly on our website. Now, working at a startup data platform Dealroom.co, I use Datawrapper daily with the Dealroom.co team to best communicate startup and tech data clearly to our clients and user base.
What’s your favorite Datawrapper feature?
The collaborative coworking design that allows multiple people to work in the same space is one of the best features of Datawrapper. It's extremely easy to create, share, and review visualizations in real-time, allowing us to be more productive and make changes quickly.
What advice would you give to other Datawrapper users?
Don't be afraid to play around with how you present your message. Experiment with different visualization tools like charts, tables, maps, and scatter plots. Each can be a powerful storytelling device, and finding the right fit is key. Personally, I love the data vis do's and don'ts section on the Datawrapper blog. I found it to be super helpful for learning about data visualization in general and when to use different visualizations depending on the communicated message and data. So experiment and see what resonates best with your audience!
You can find out more about Alex on LinkedIn. To read more about Unwrapped and other great speakers, visit our blog.


