The best of last week’s big and small data visualizations
Vivien Serve
Welcome back to the 165th edition of the Data Vis Dispatch! Every week, we publish a collection of the best small and large data visualizations we find, especially from news organizations — to celebrate data journalism, data visualization, simple charts, elaborate maps, and their creators.
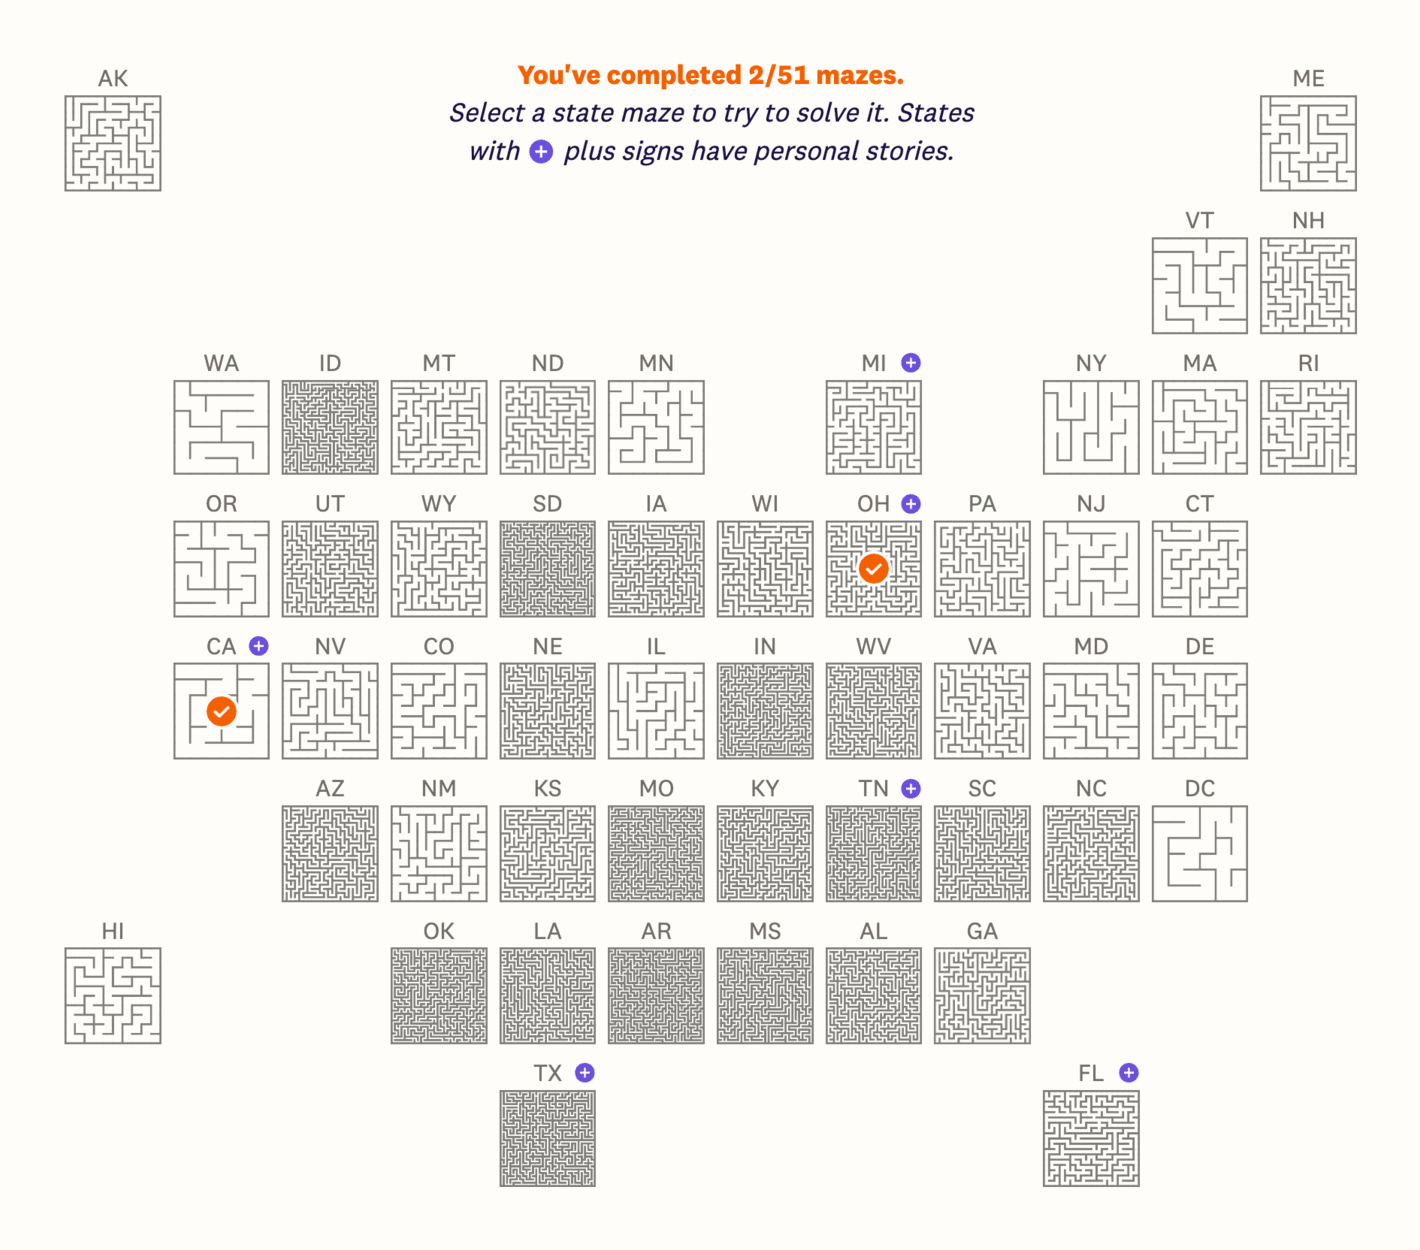
Recurring topics this week include mazes, organ donation, and Crokinole.
What goes through the mind of an information designer when they create a visualization? This week, Voilà caught our attention with an interesting challenge:
Voilà / Francis Gagnon: "What happens when two information designers who work at the same agency challenge themselves to rethink a set of charts they found on the Internet? [...]," October 16 (Bluesky)
Voilà / Francis Gagnon: "Their attention was focused on different things. Patricia’s notes show a focus on content, with questions such as 'Is 2% a lot?' [...]," October 16 (Bluesky)
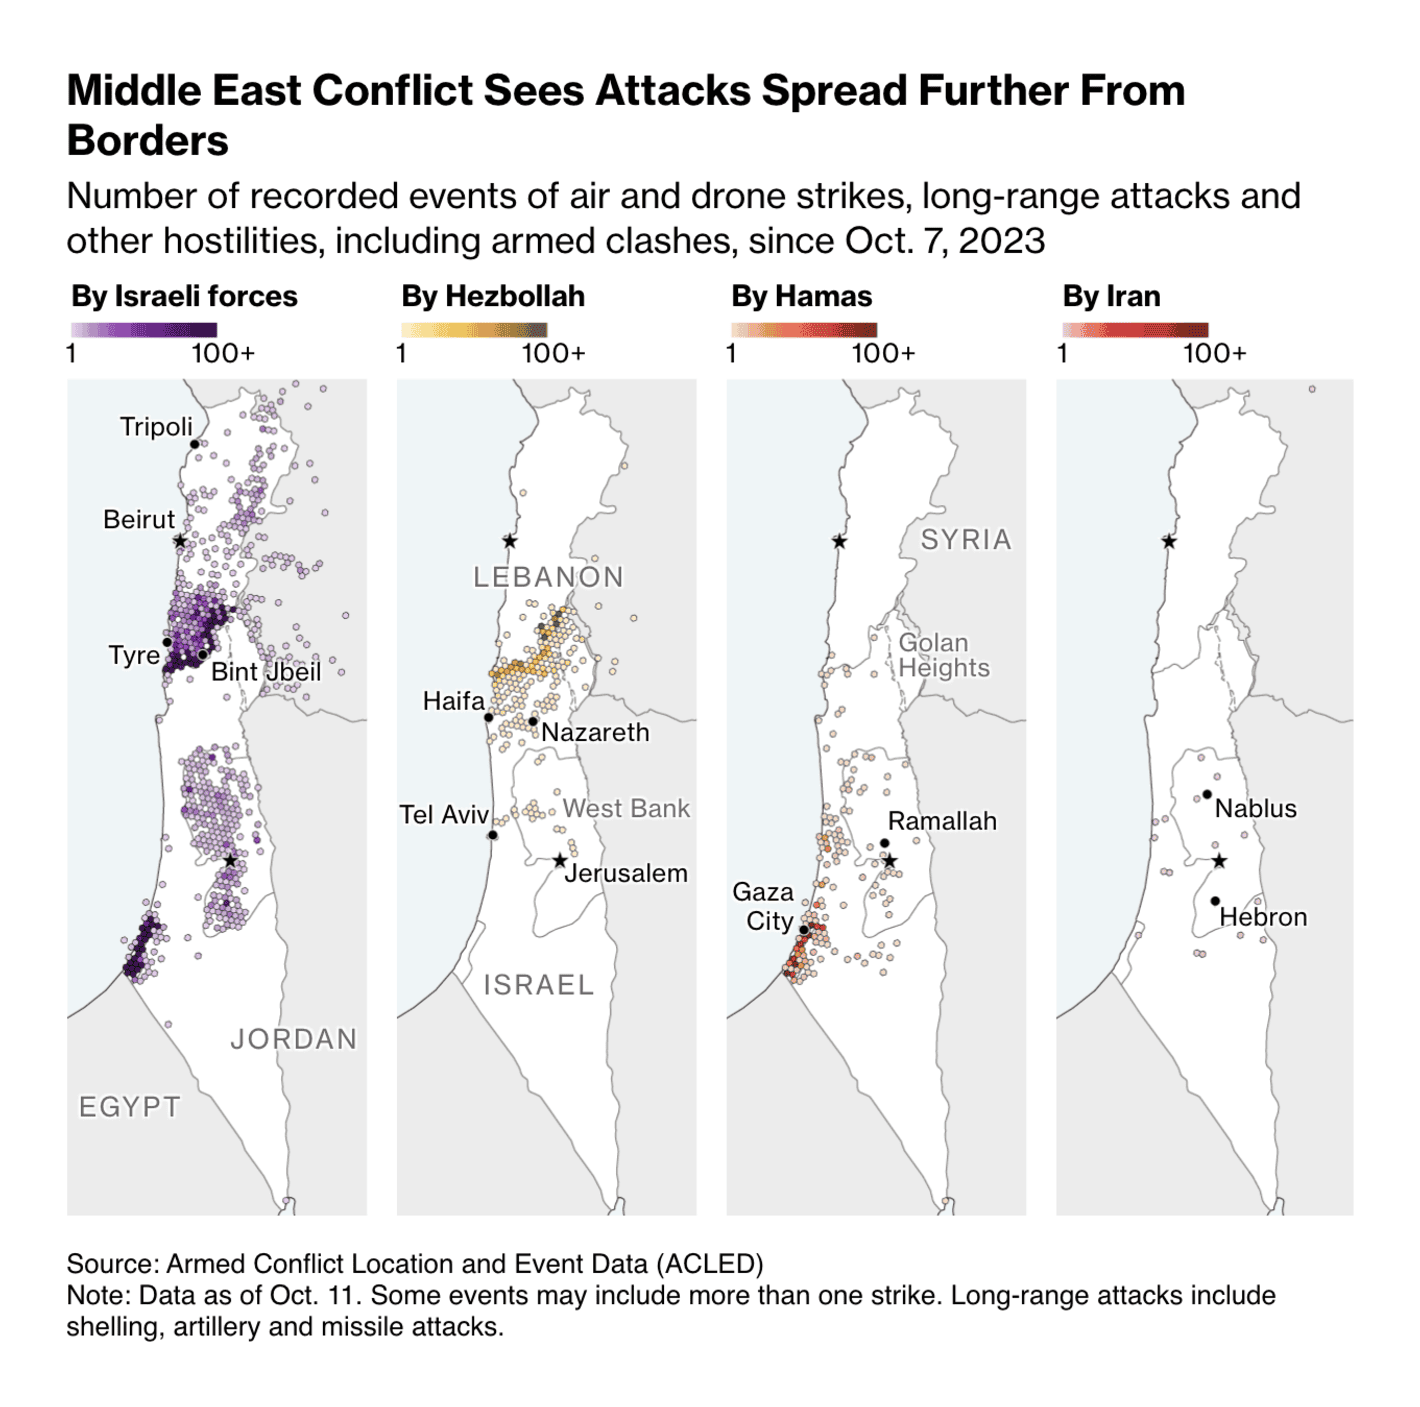
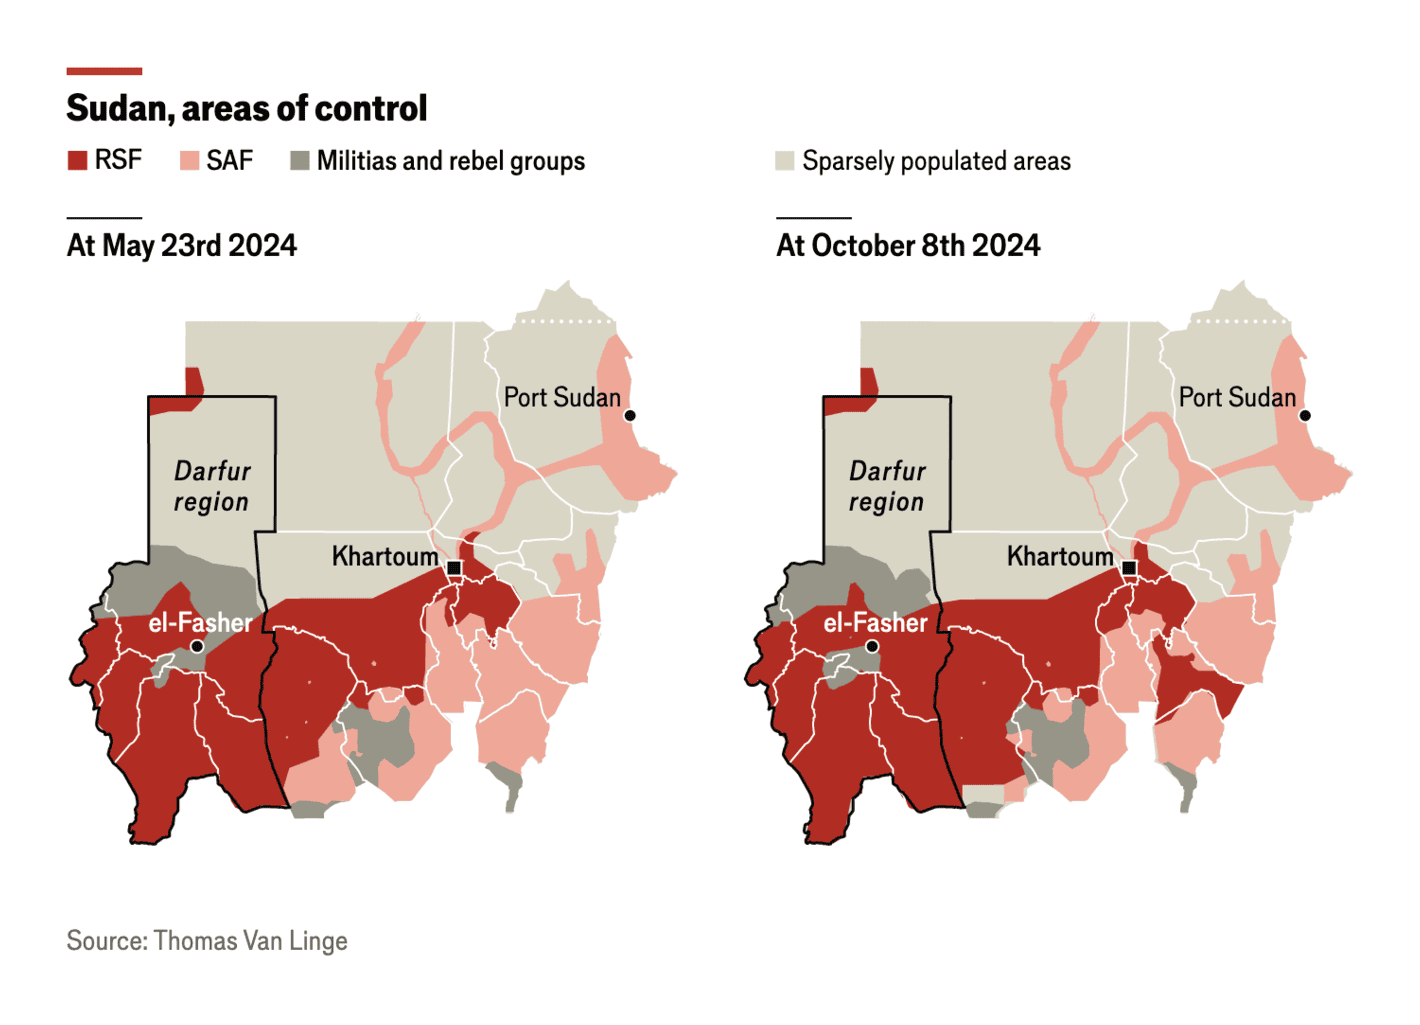
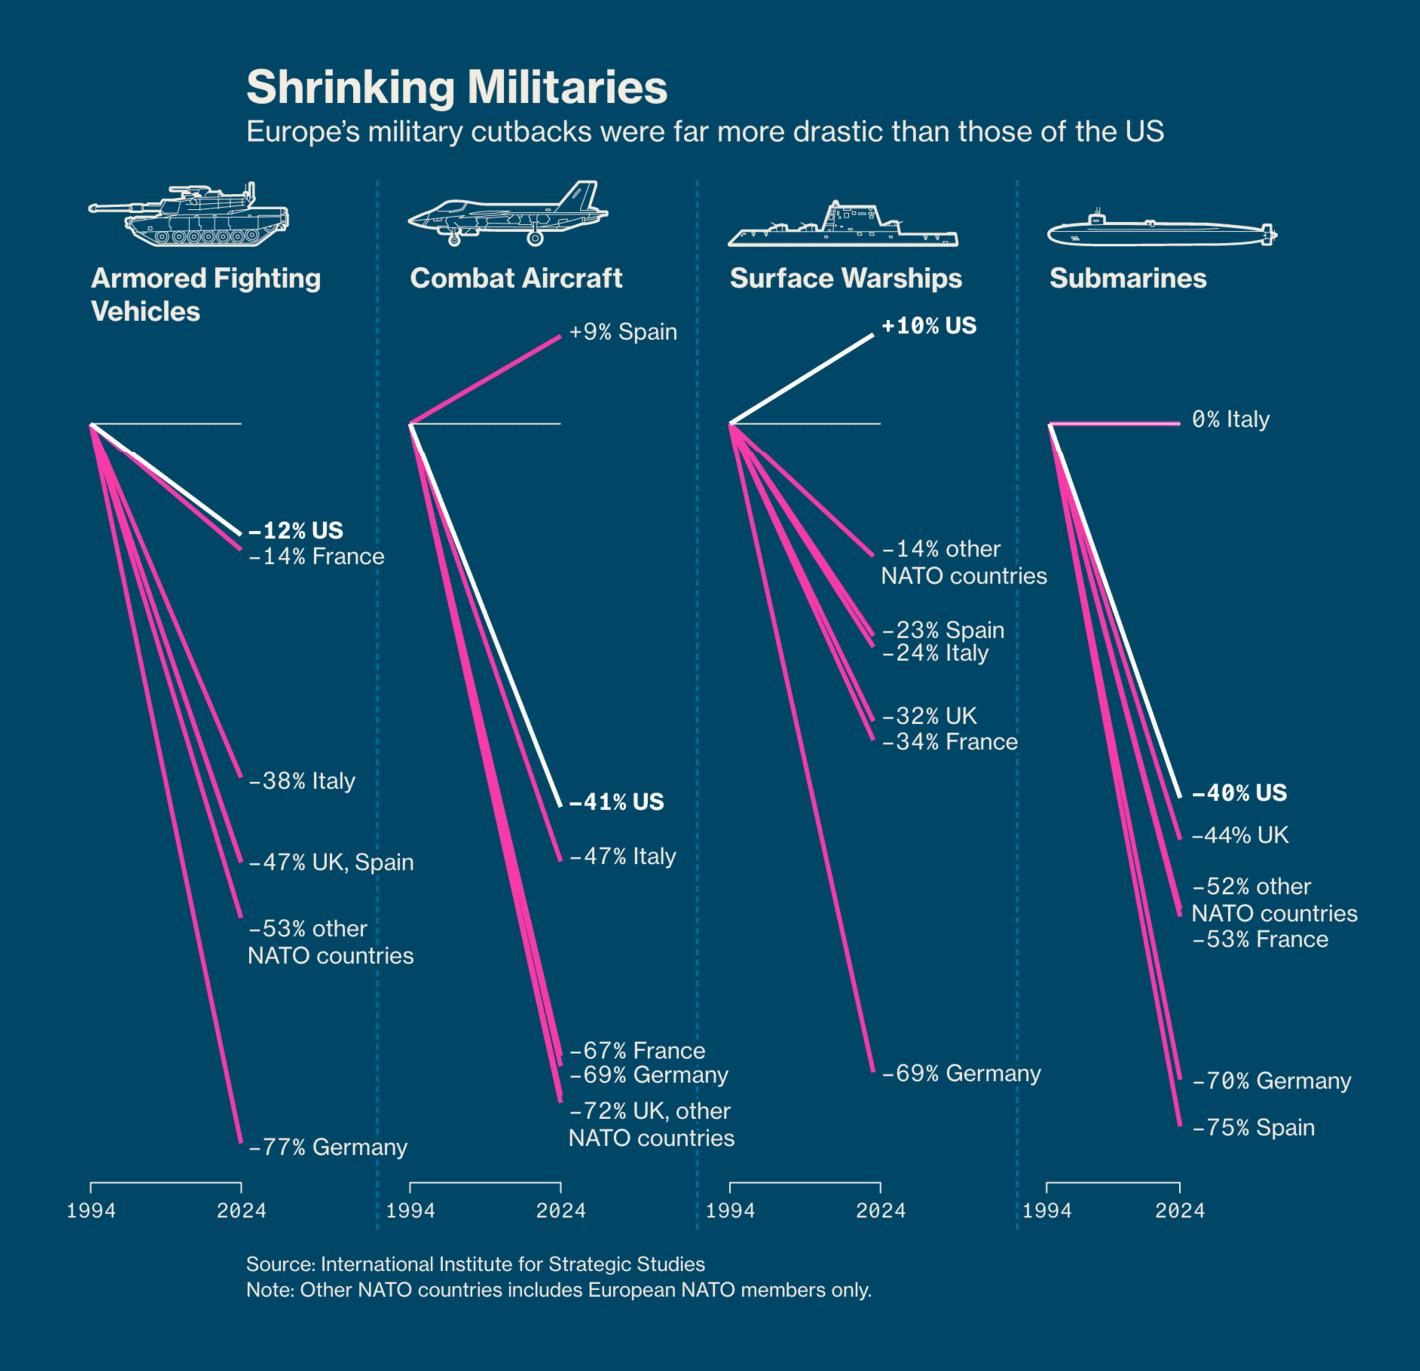
With each passing day, wars and conflicts seem only to spread. In the Middle East, Israeli airstrikes continue and the destruction in Gaza is immense.Ukraine battles pro-Russian narratives on Telegram; fighting in Sudan intensifies;European NATO members are unprepared to defend themselves:
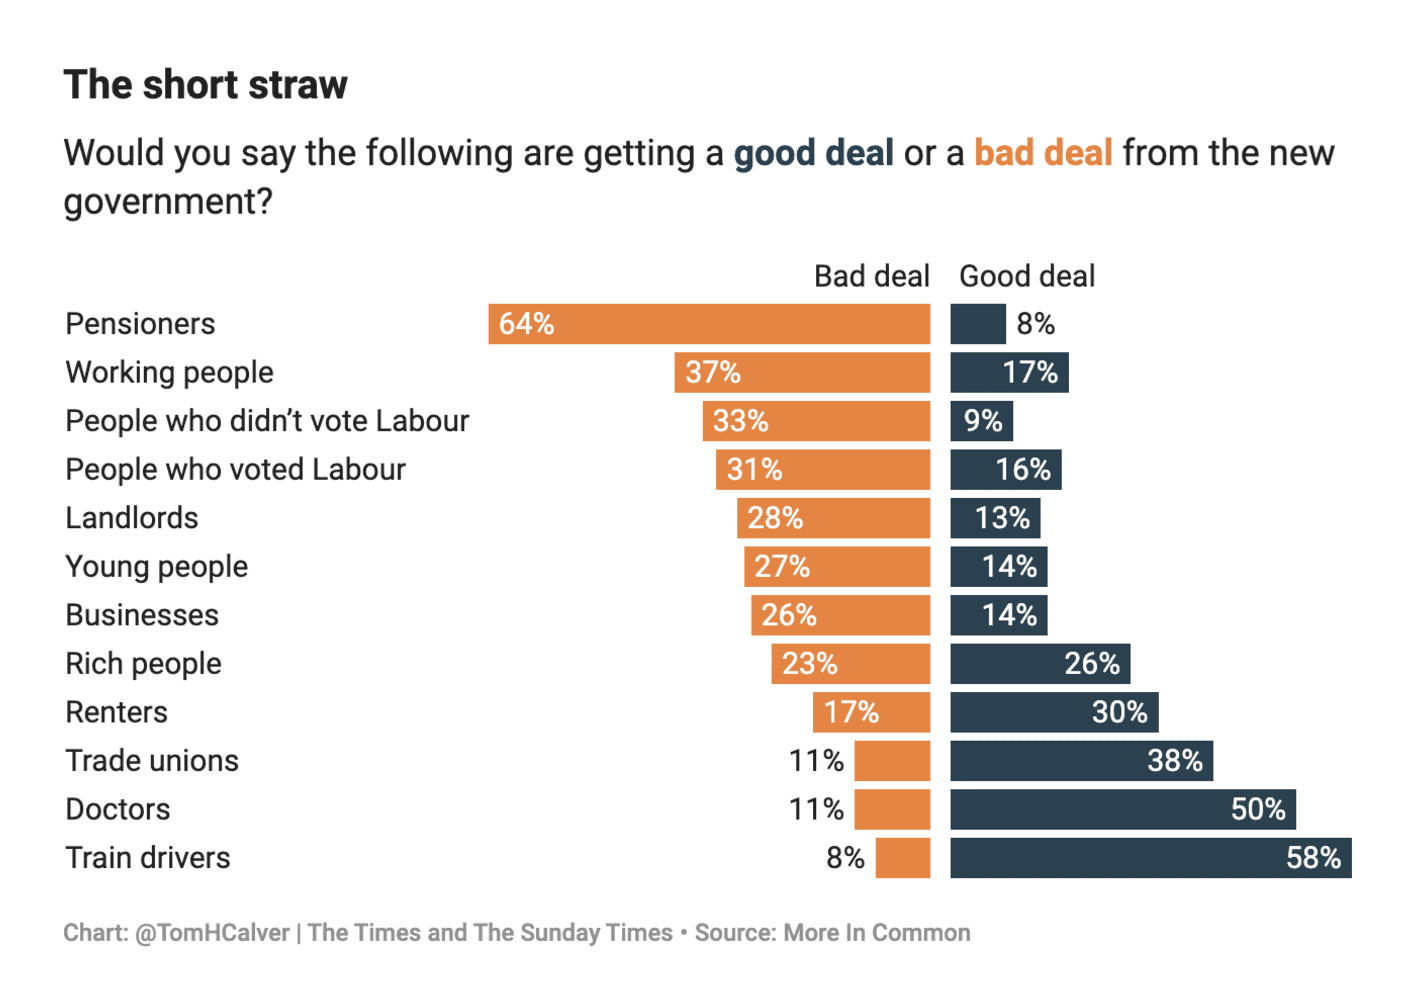
In politics, we take a look at public opinion in the U.K., where pensioners are not optimistic about the new government, and recent elections in Brazil, where women are still not winning an equal share of votes:
Withelections just around the corner, this visualization breaks down the structure of the Japanese House of Representatives. And did you know that almost half of allelected representatives in Germany have a paid part-time job?
Nikkei: 衆院選の仕組み [Chart title: The primary election has 289 seats], October 16Der Spiegel: Was verdient Ihr Bundestagsabgeordneter? [How much does your member of parliament earn?], October 19
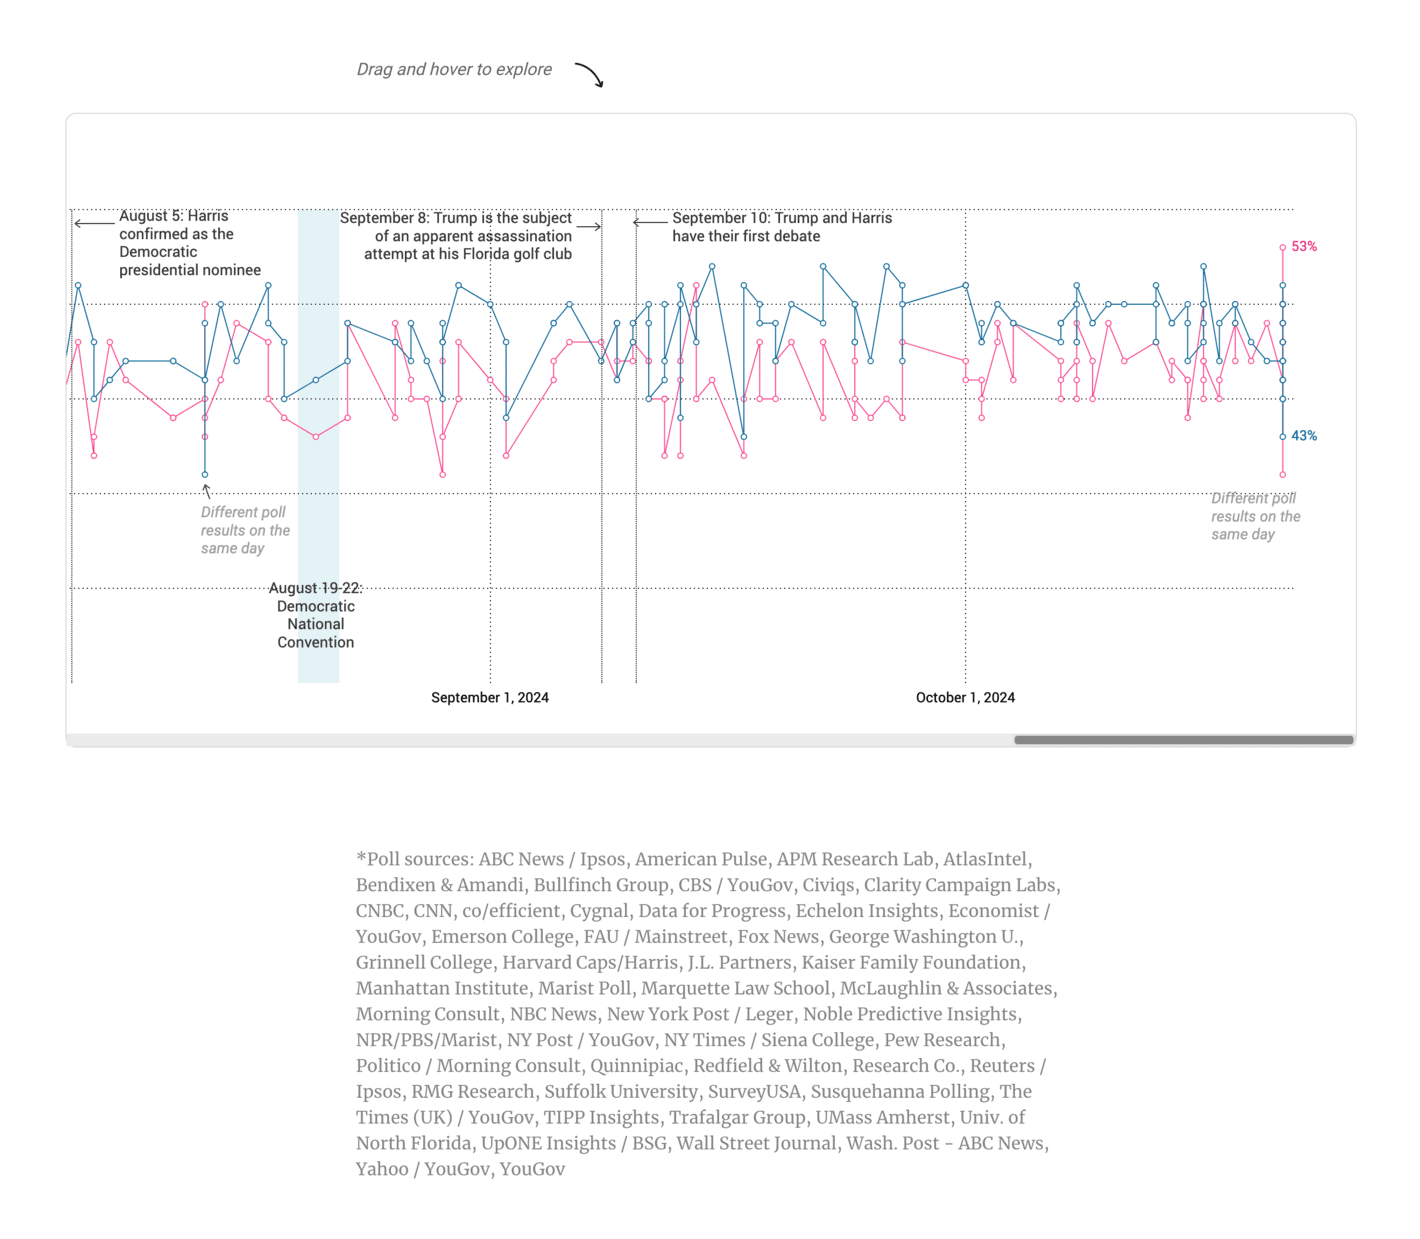
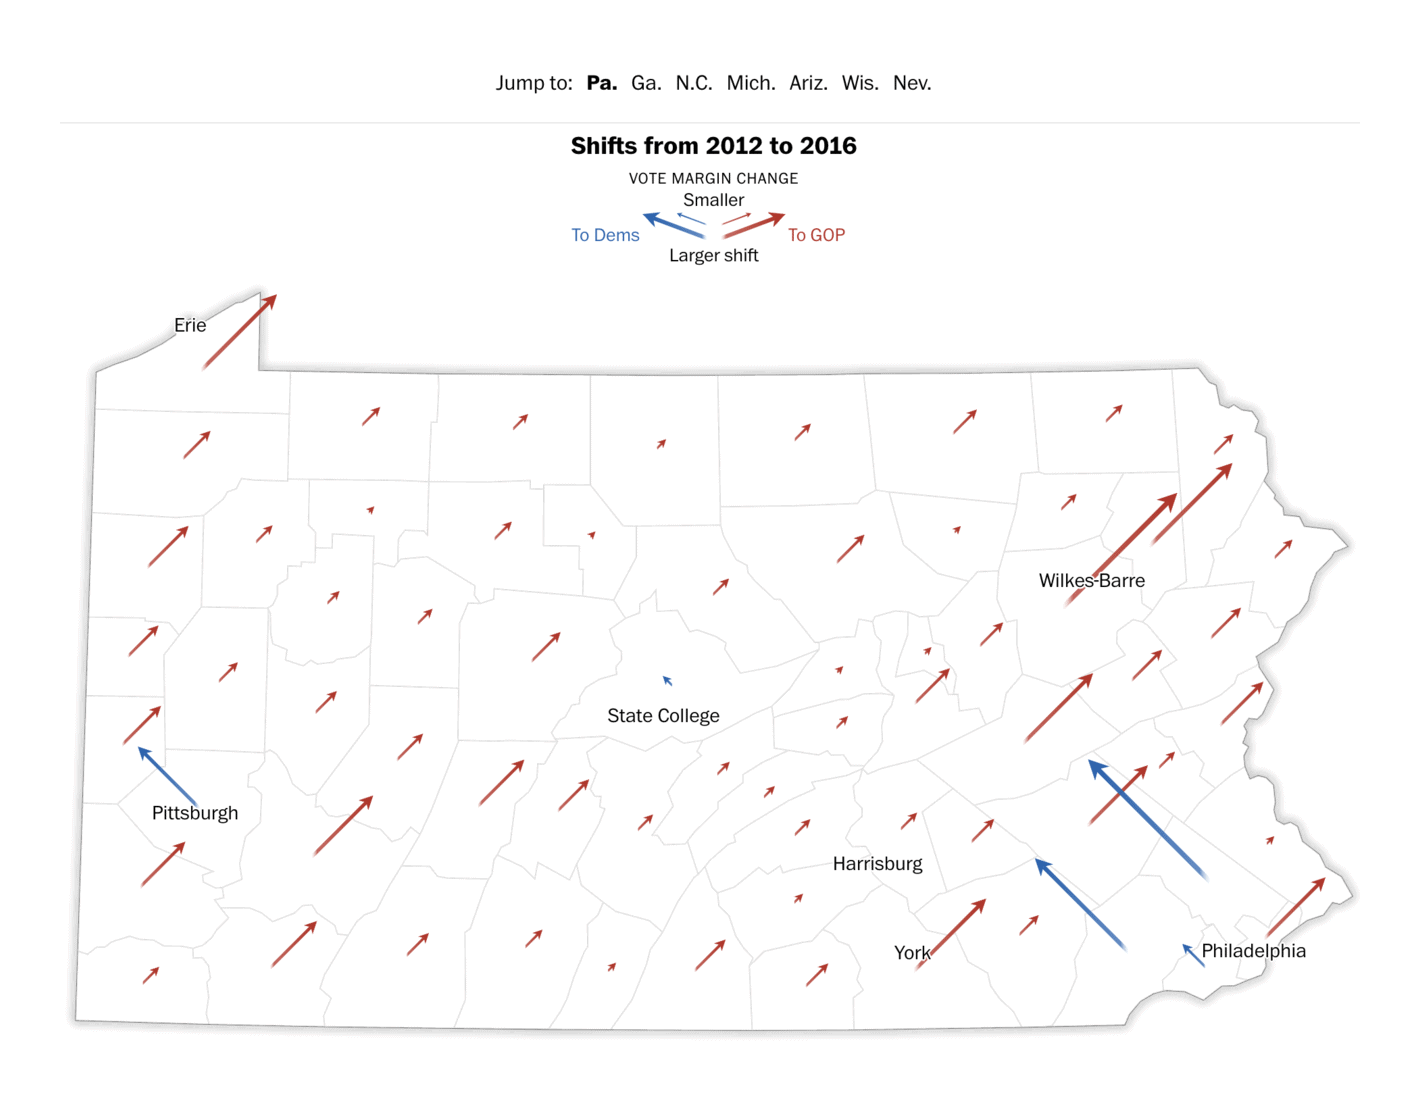
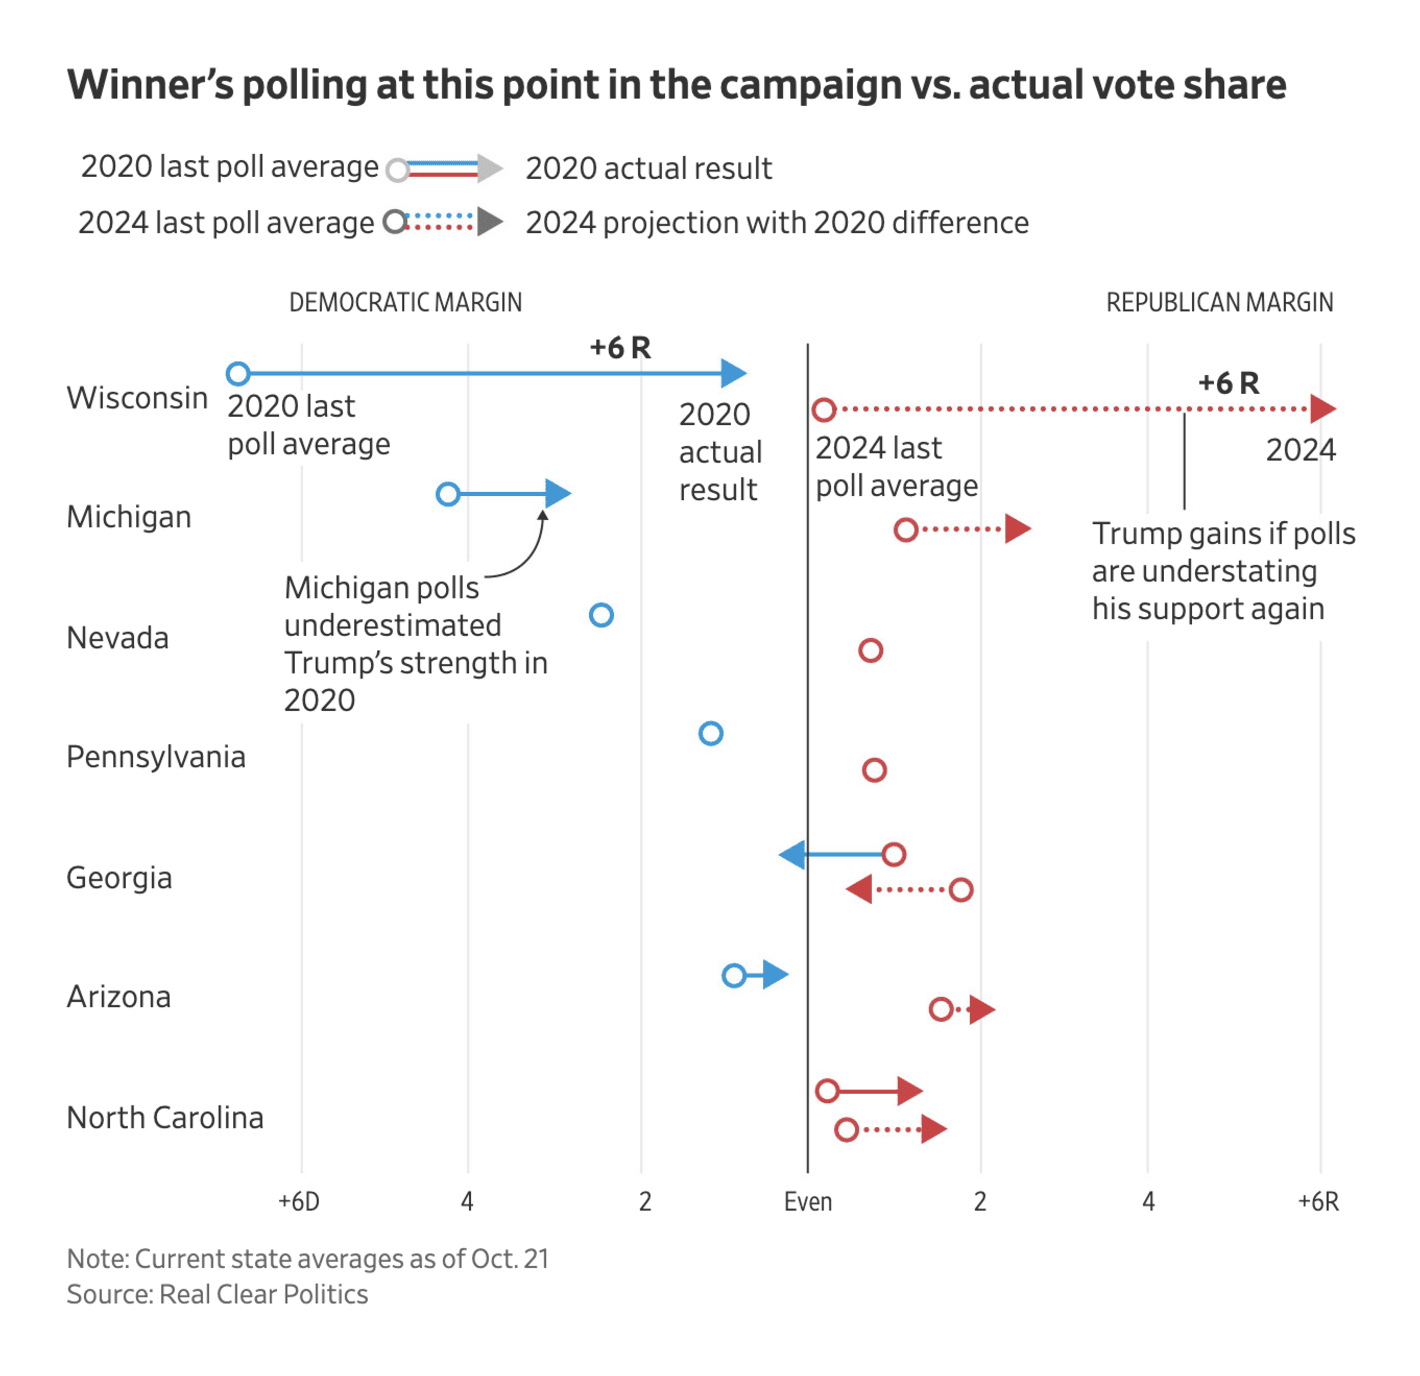
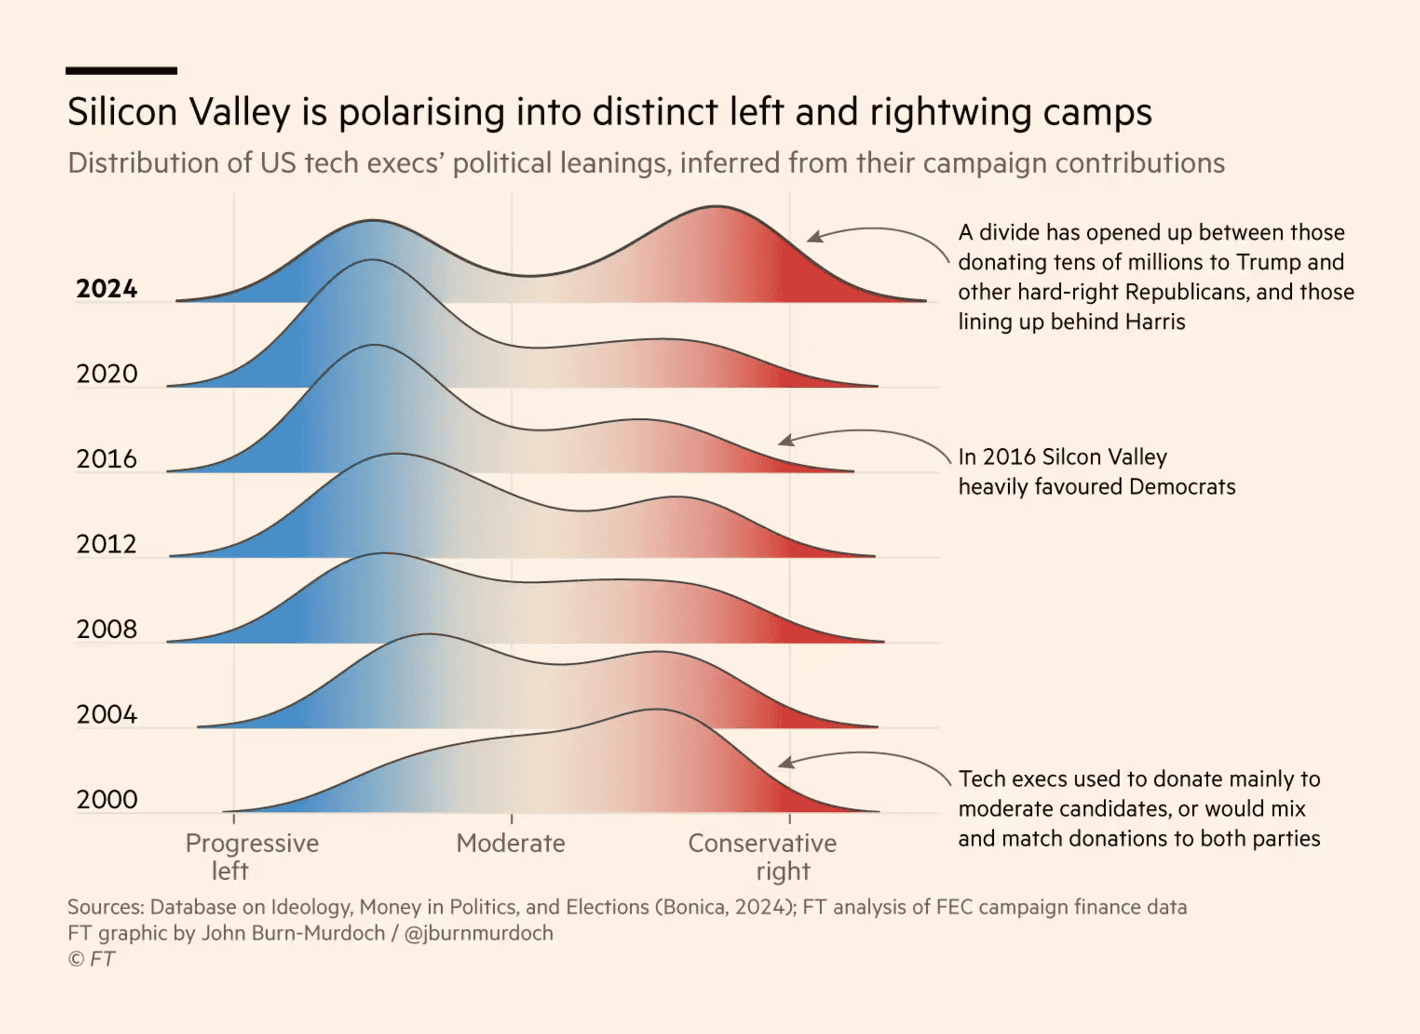
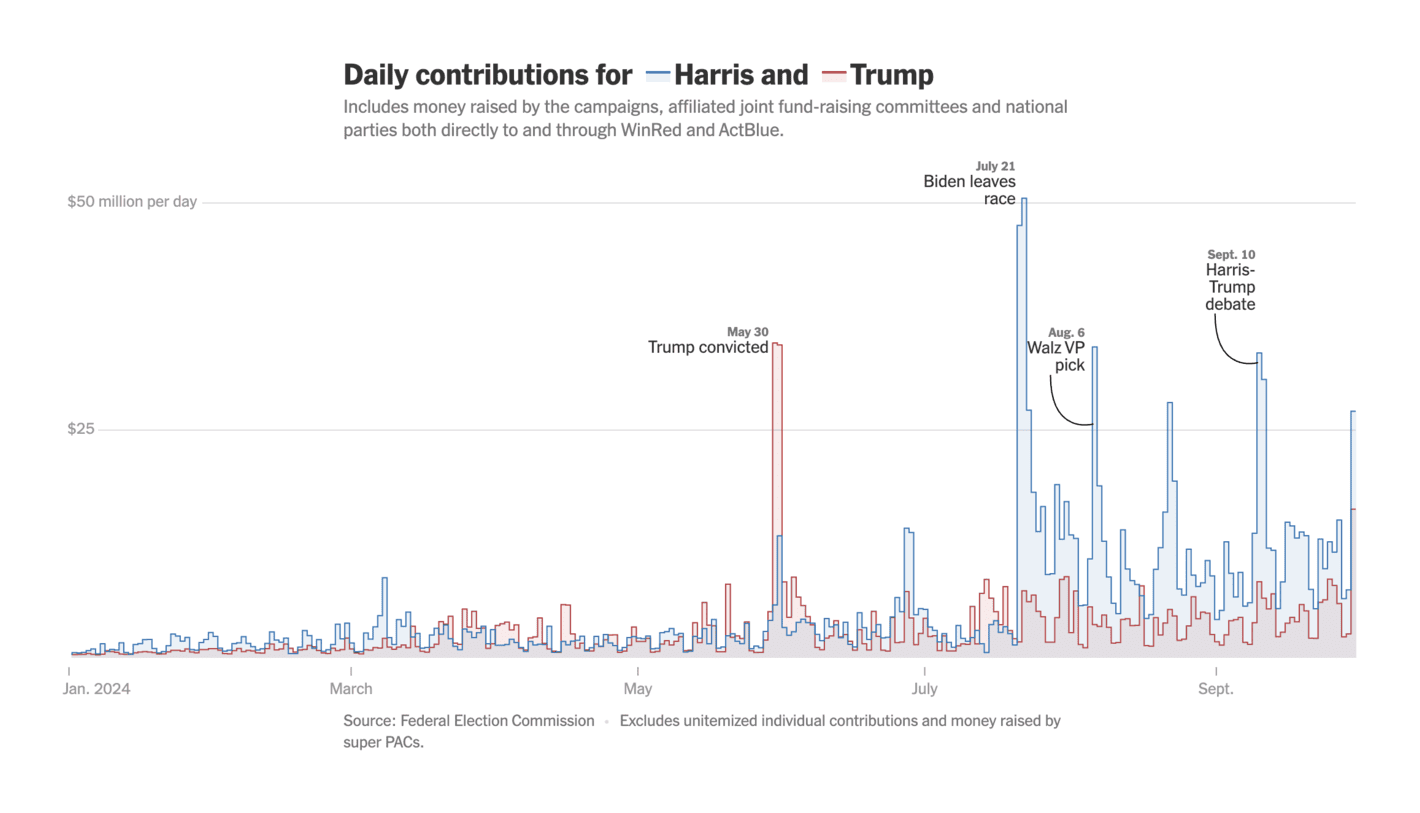
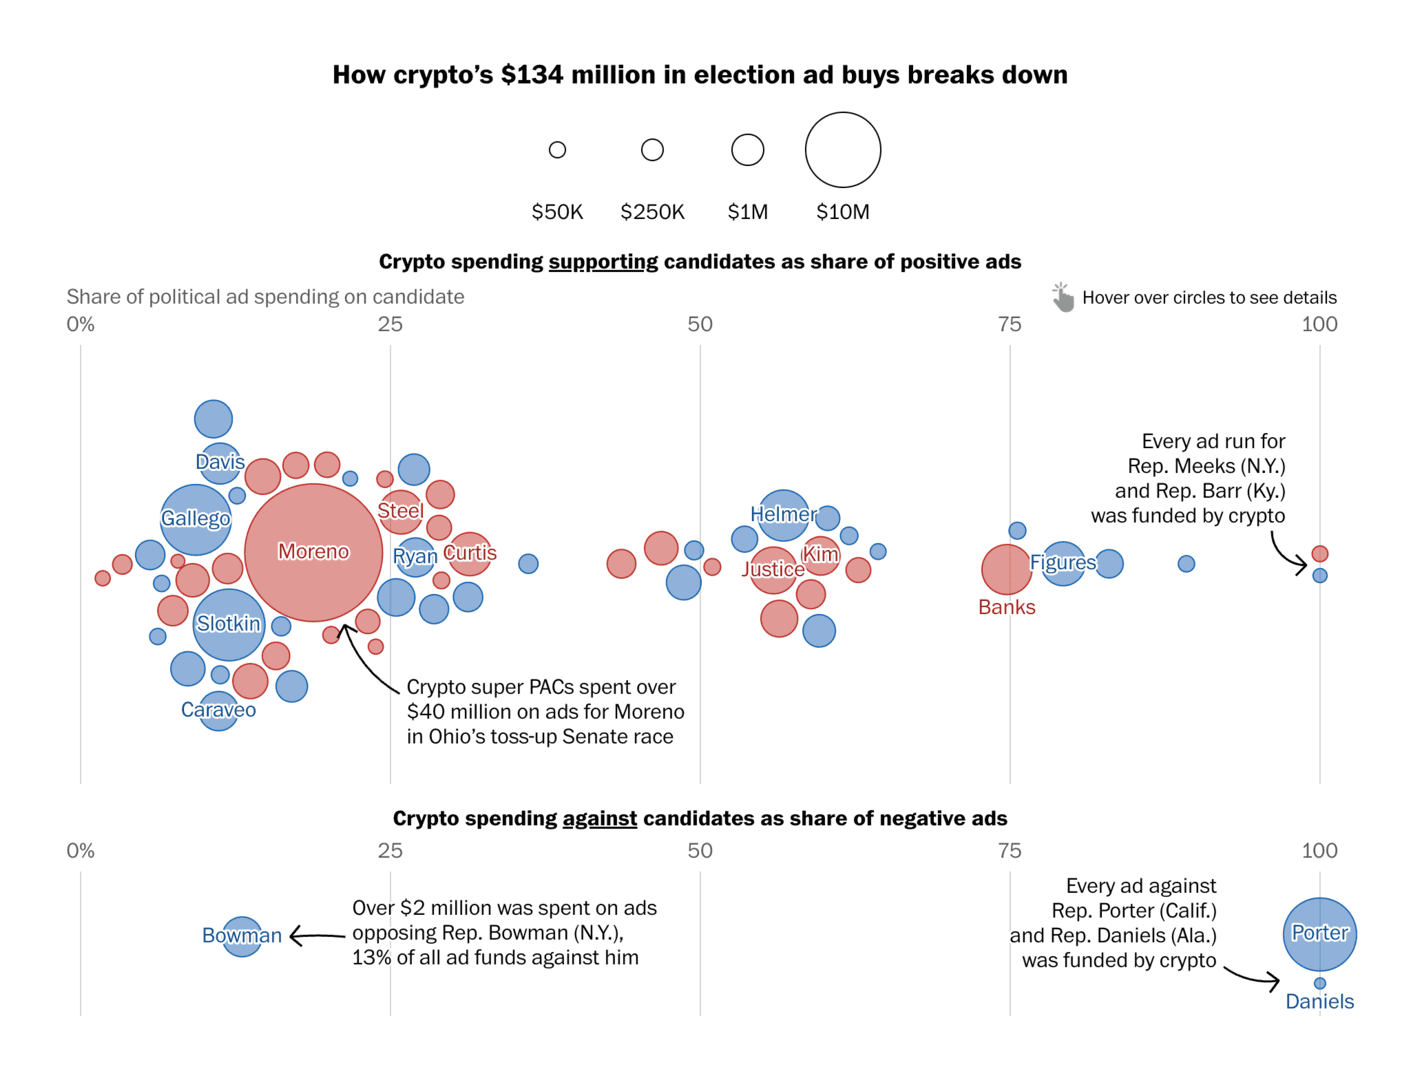
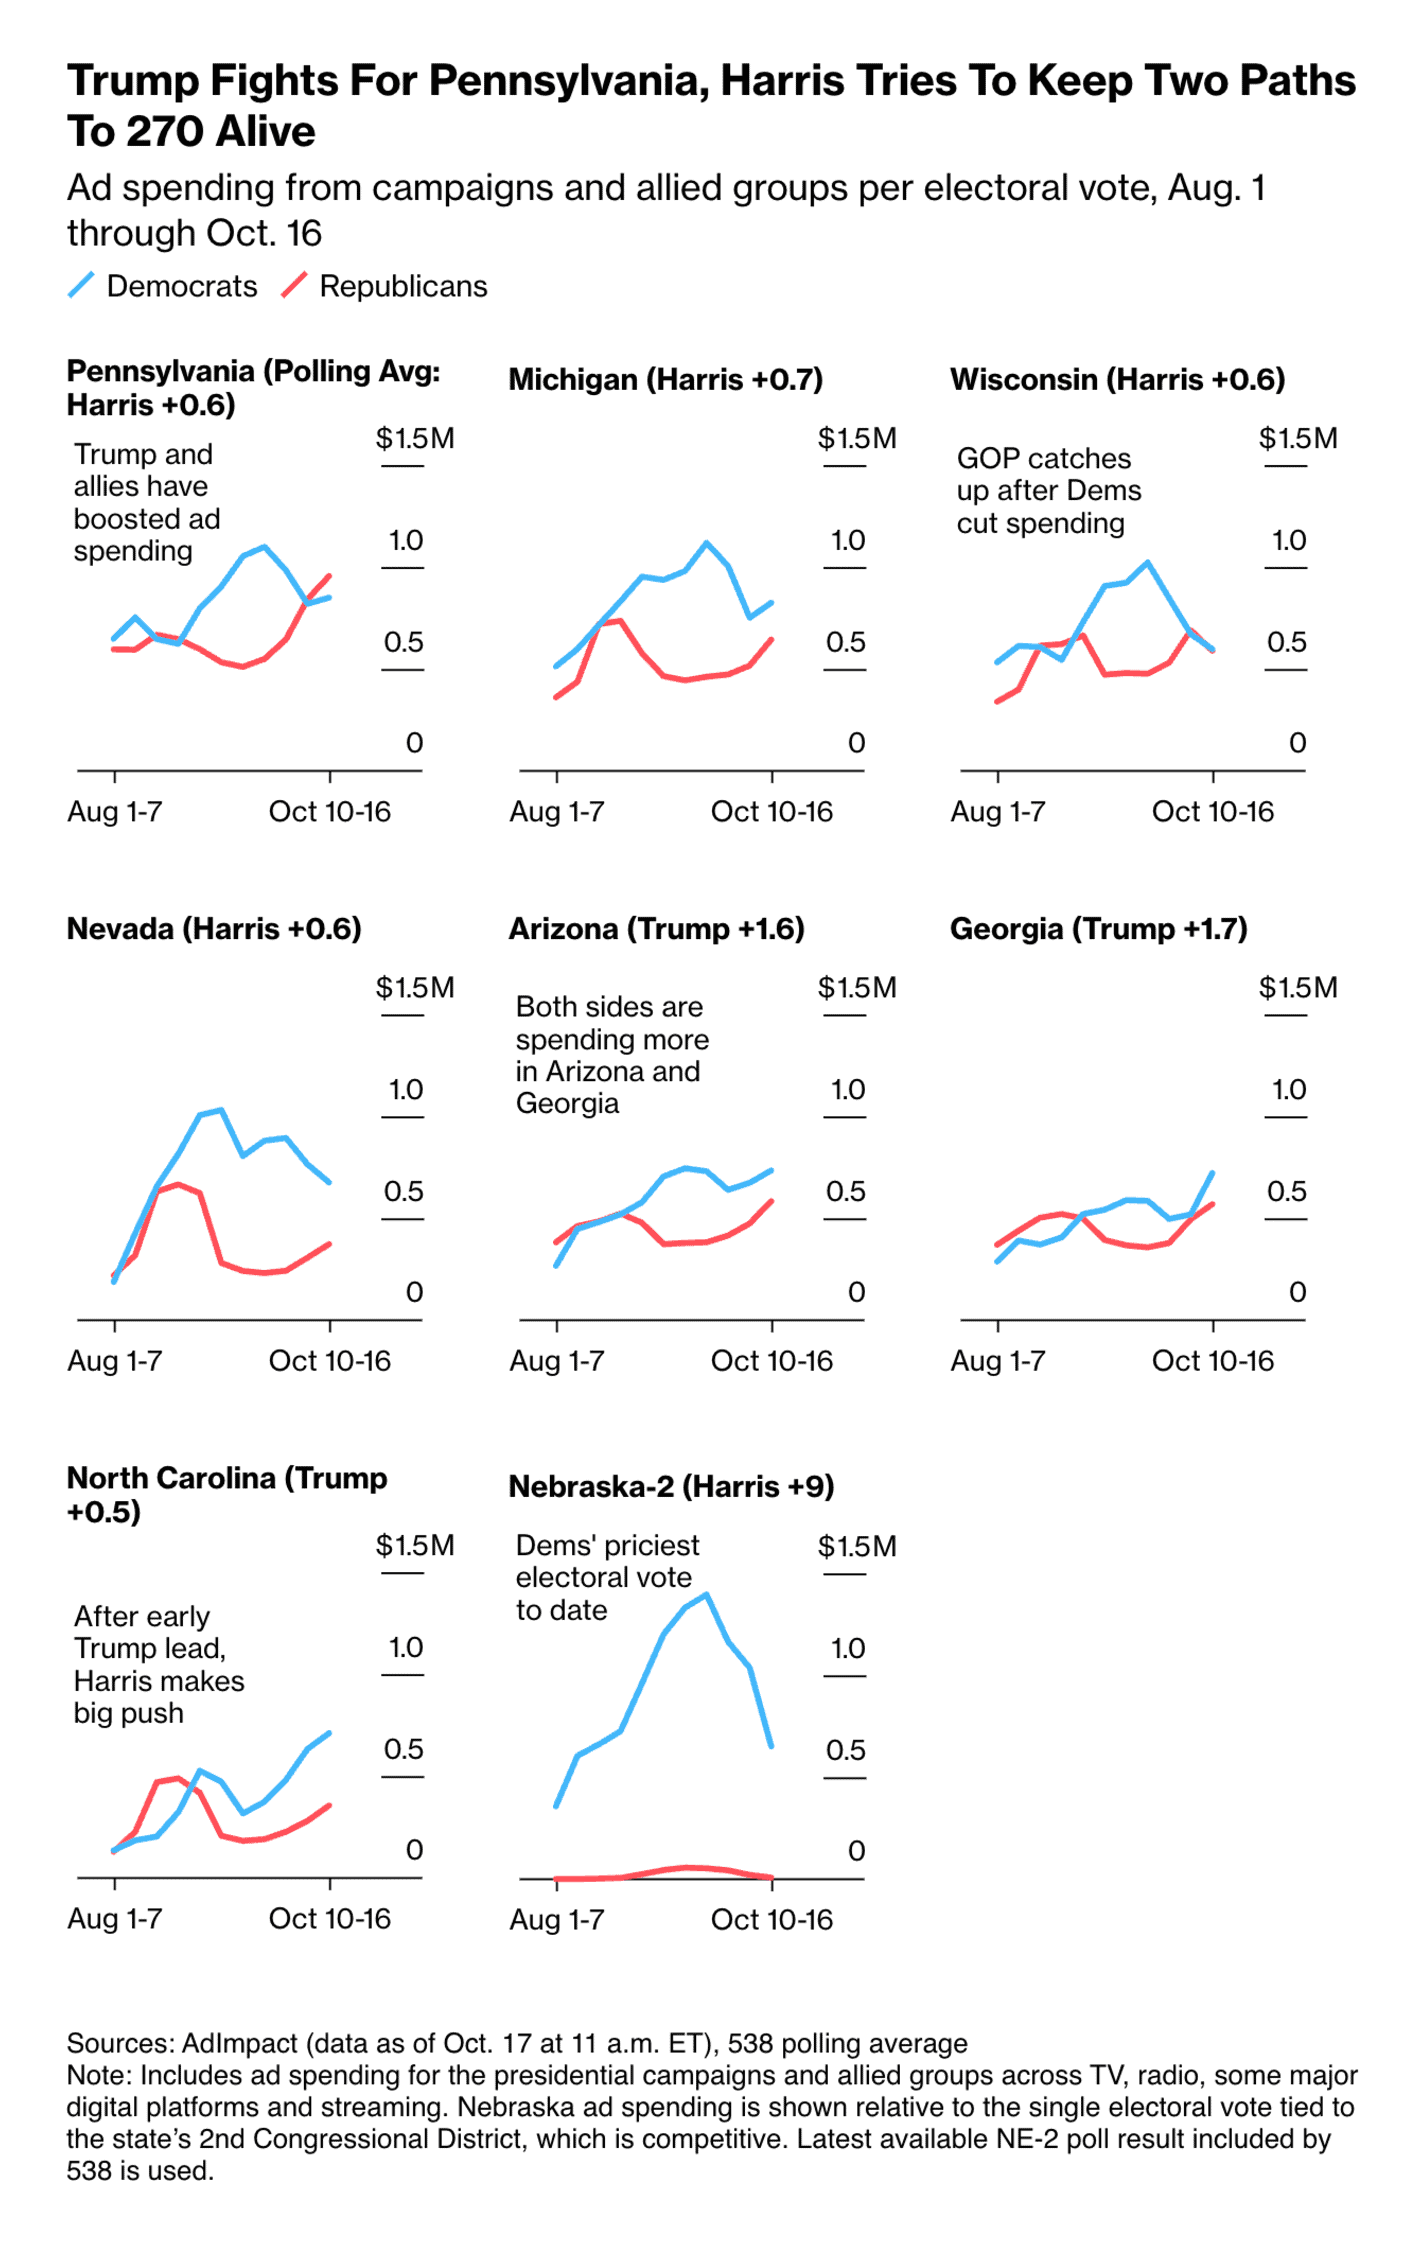
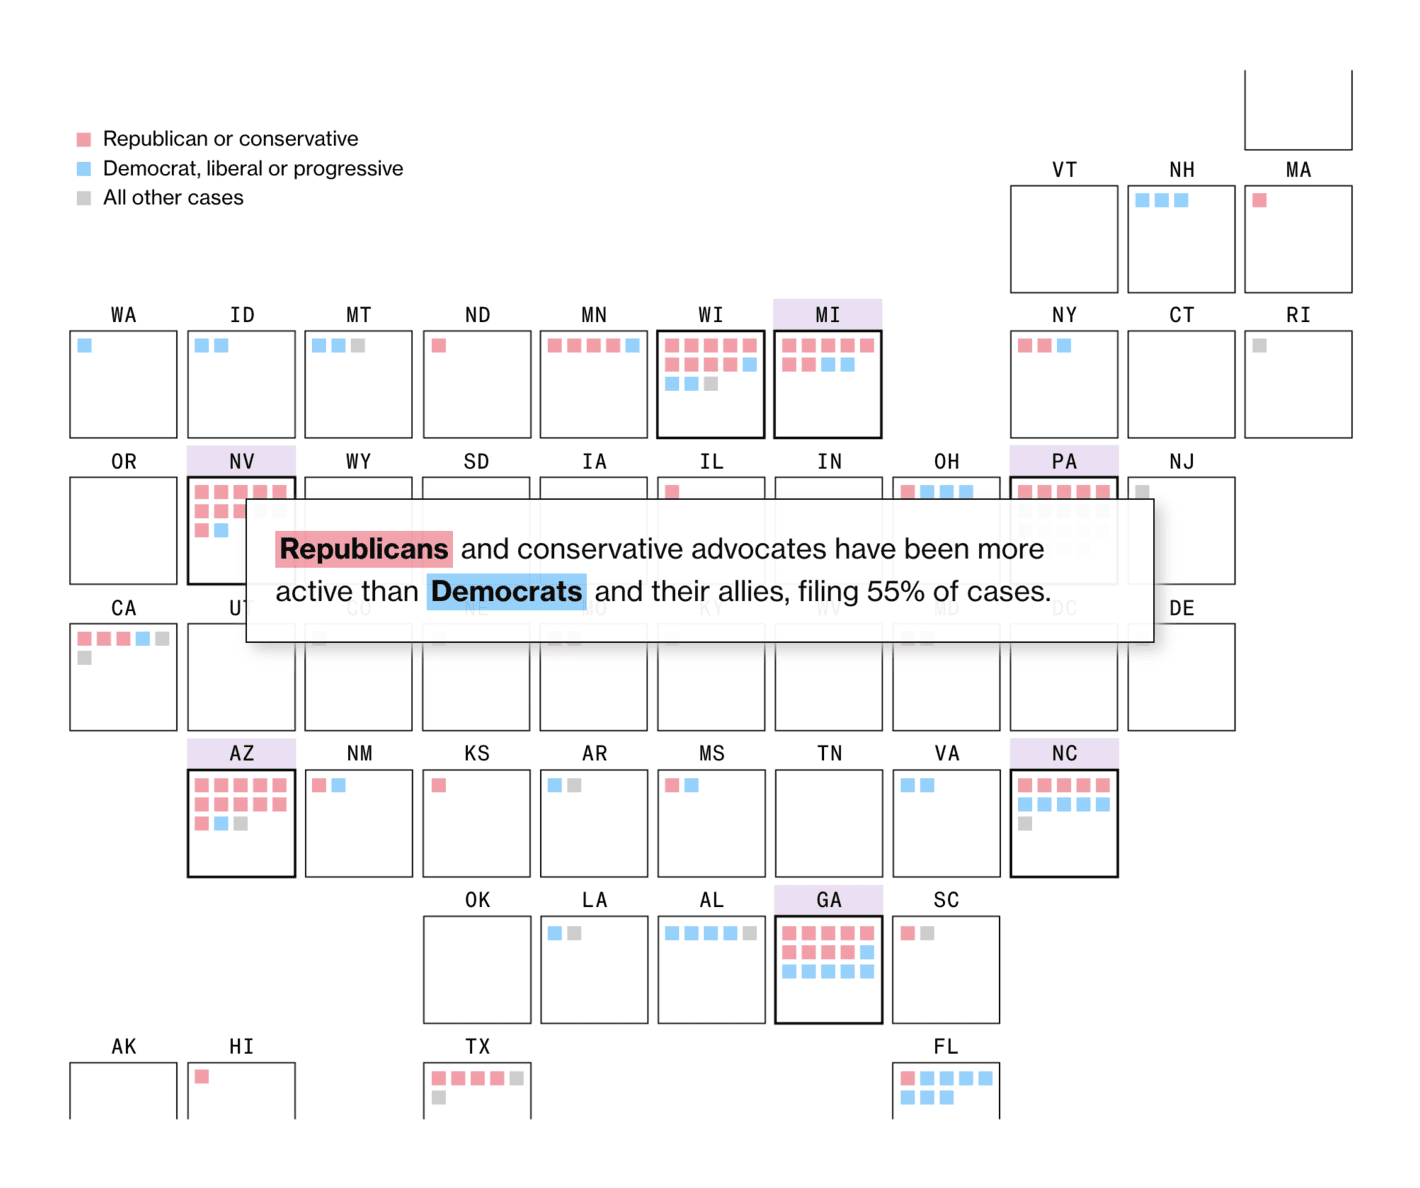
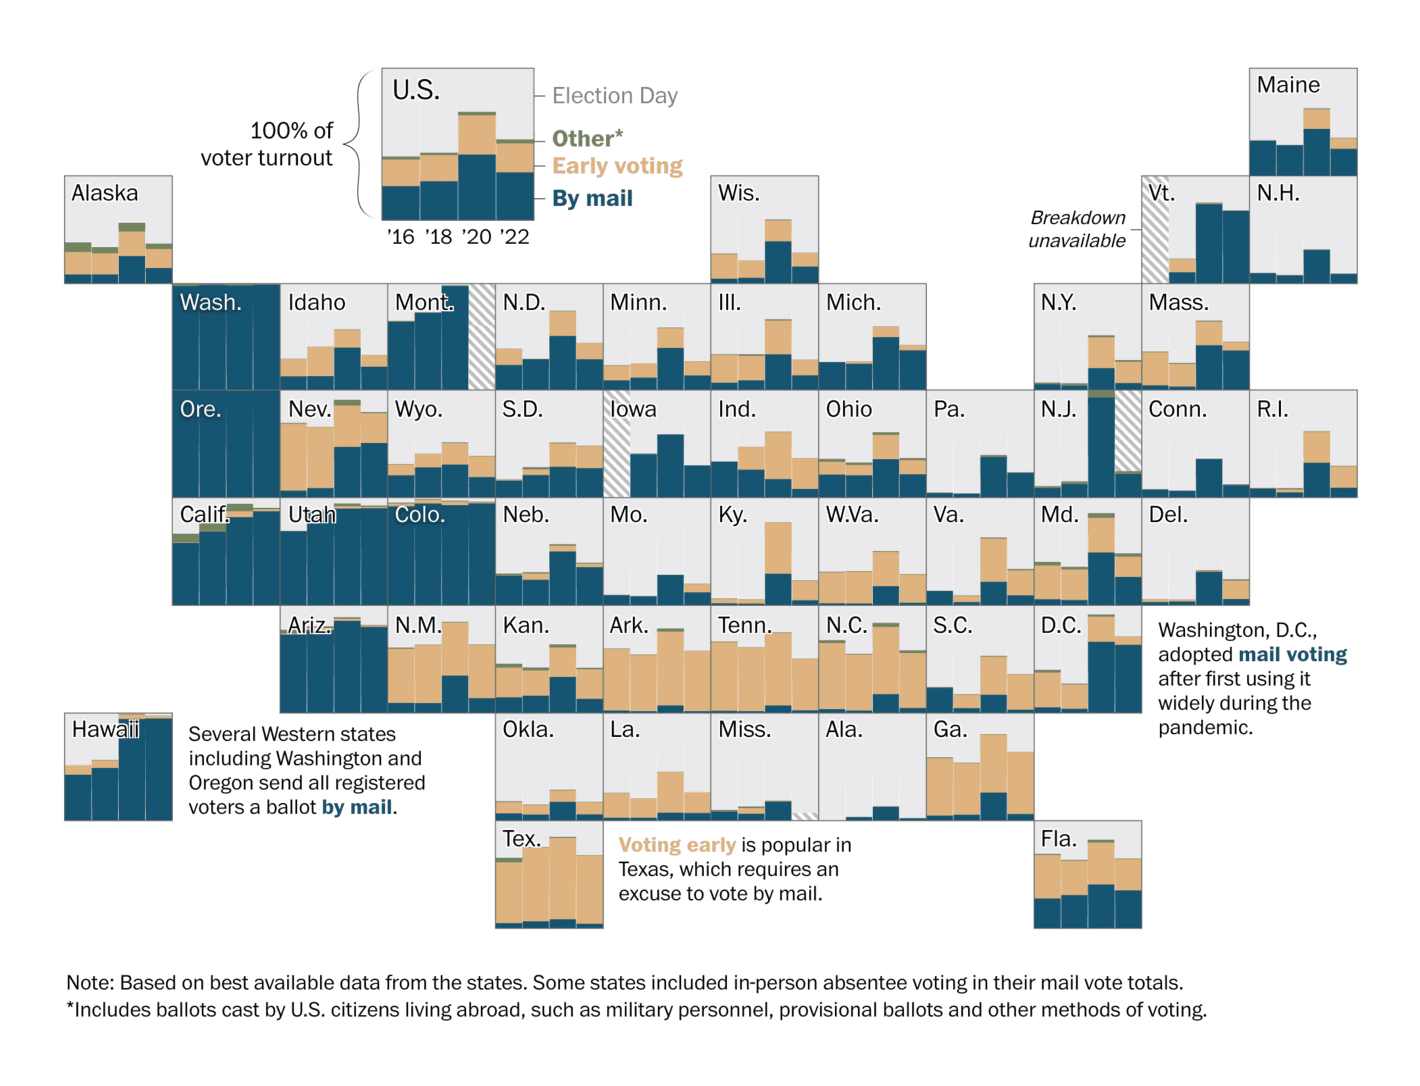
All elections this year are eclipsed by one — the race for the U.S. presidency:
One very important factor in politics is money. Who's collecting donations? Who's backing candidates with cryptocurrency? And where are candidates spending what they raise?
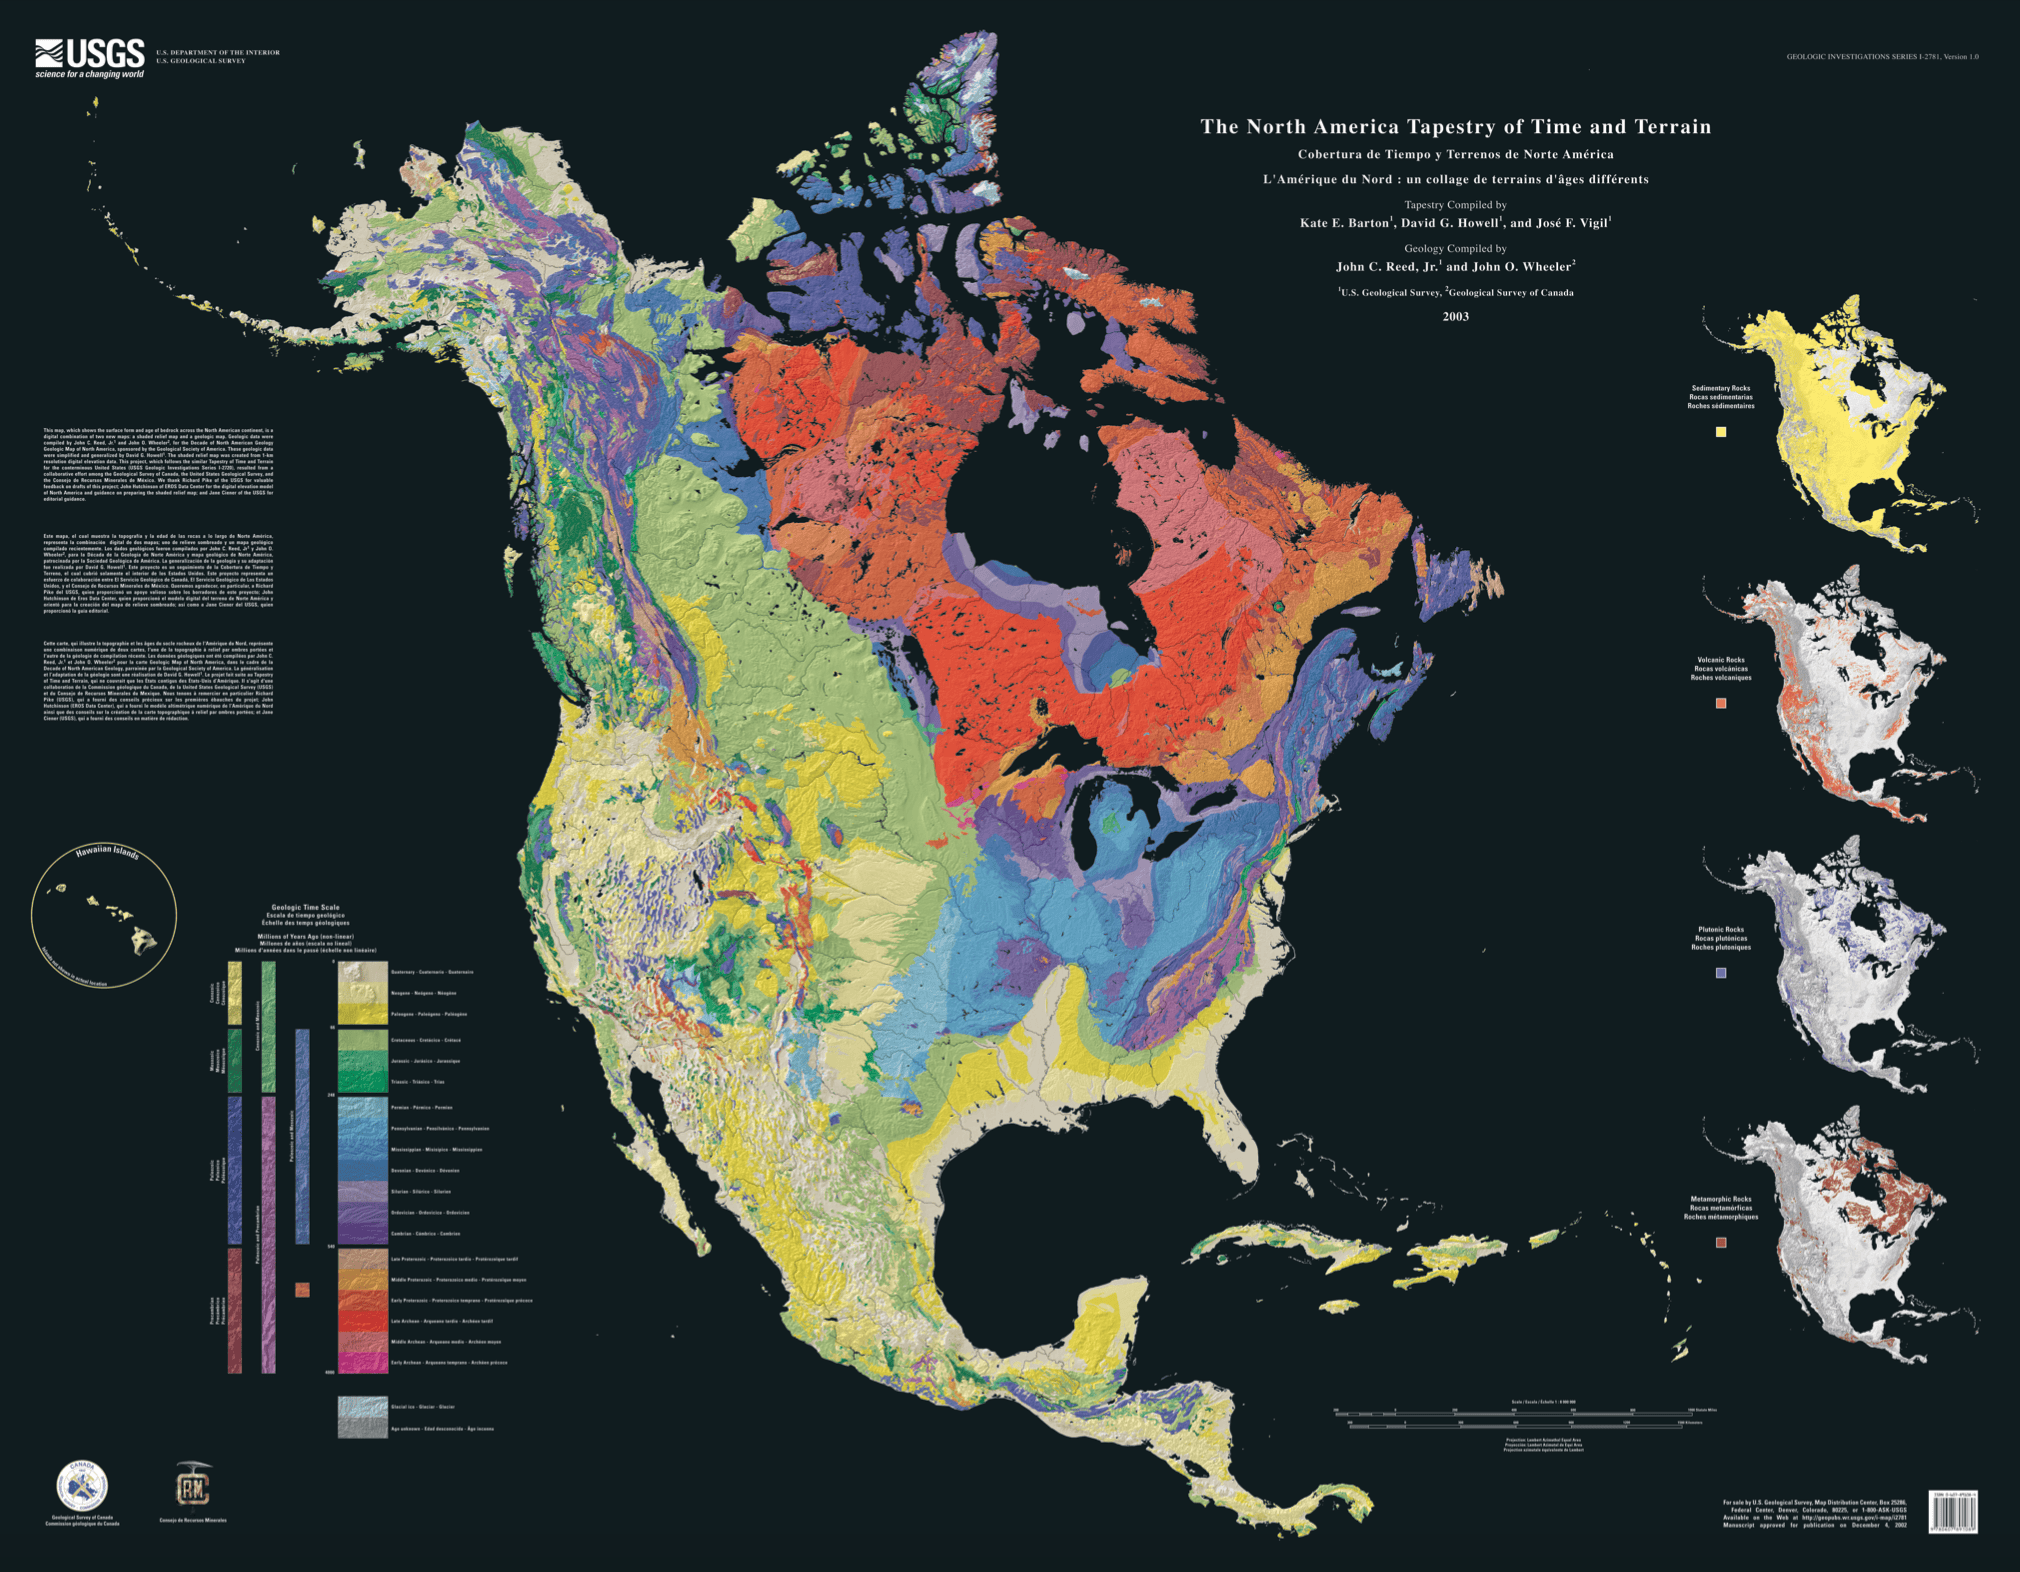
Next up, maps ofthe physical geography of North America, how it evolved over time, where the construction of border walls has put land in limbo, and where it's actually feasible to live:
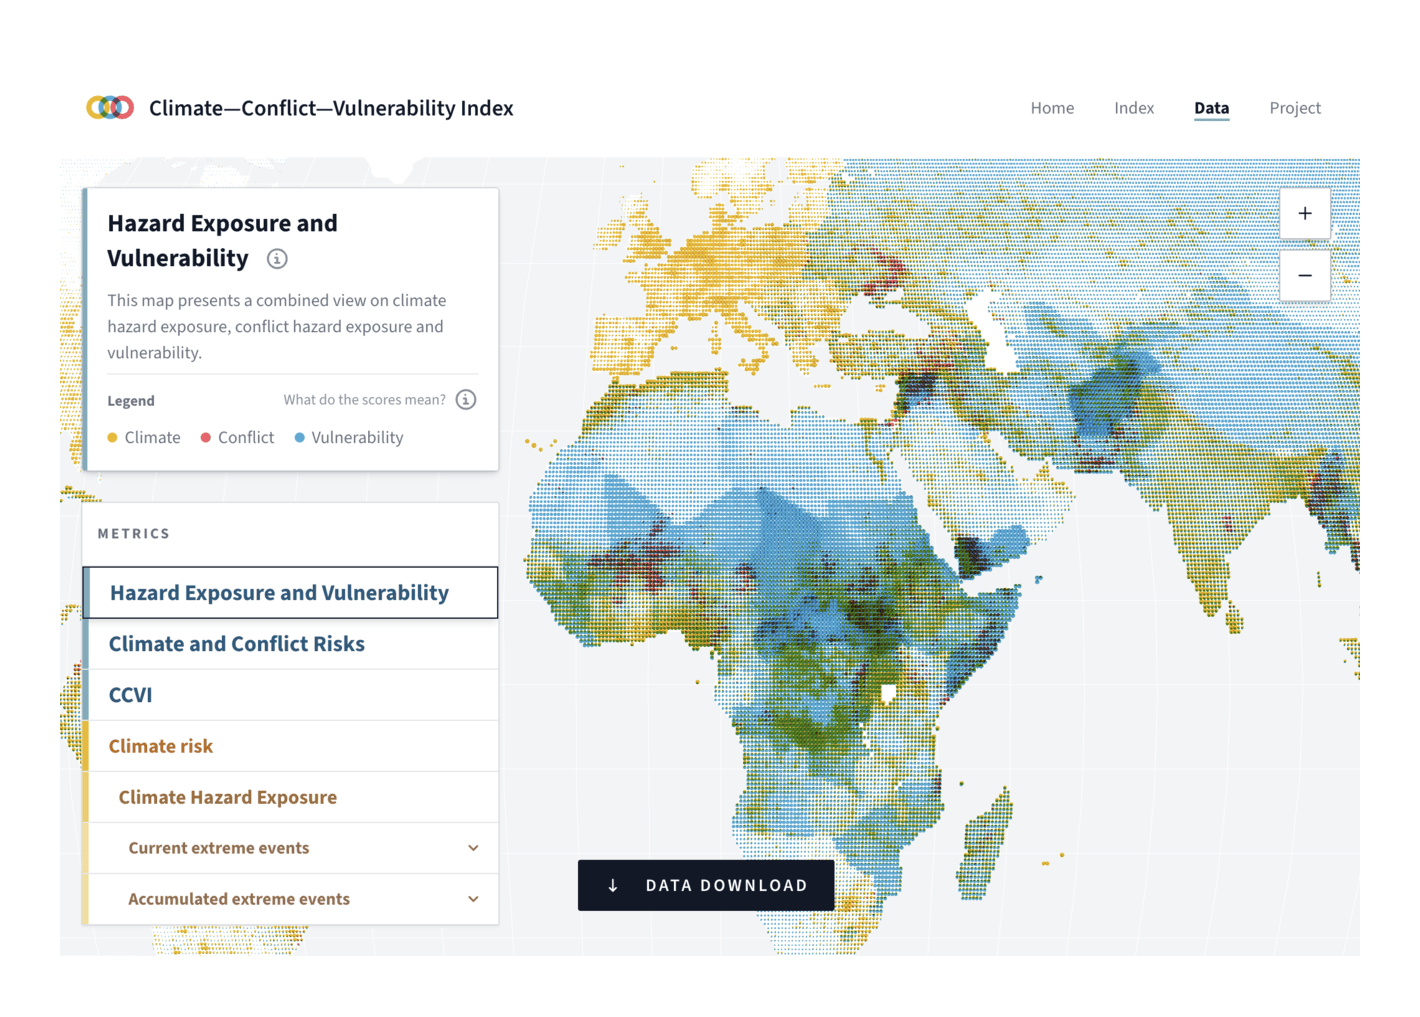
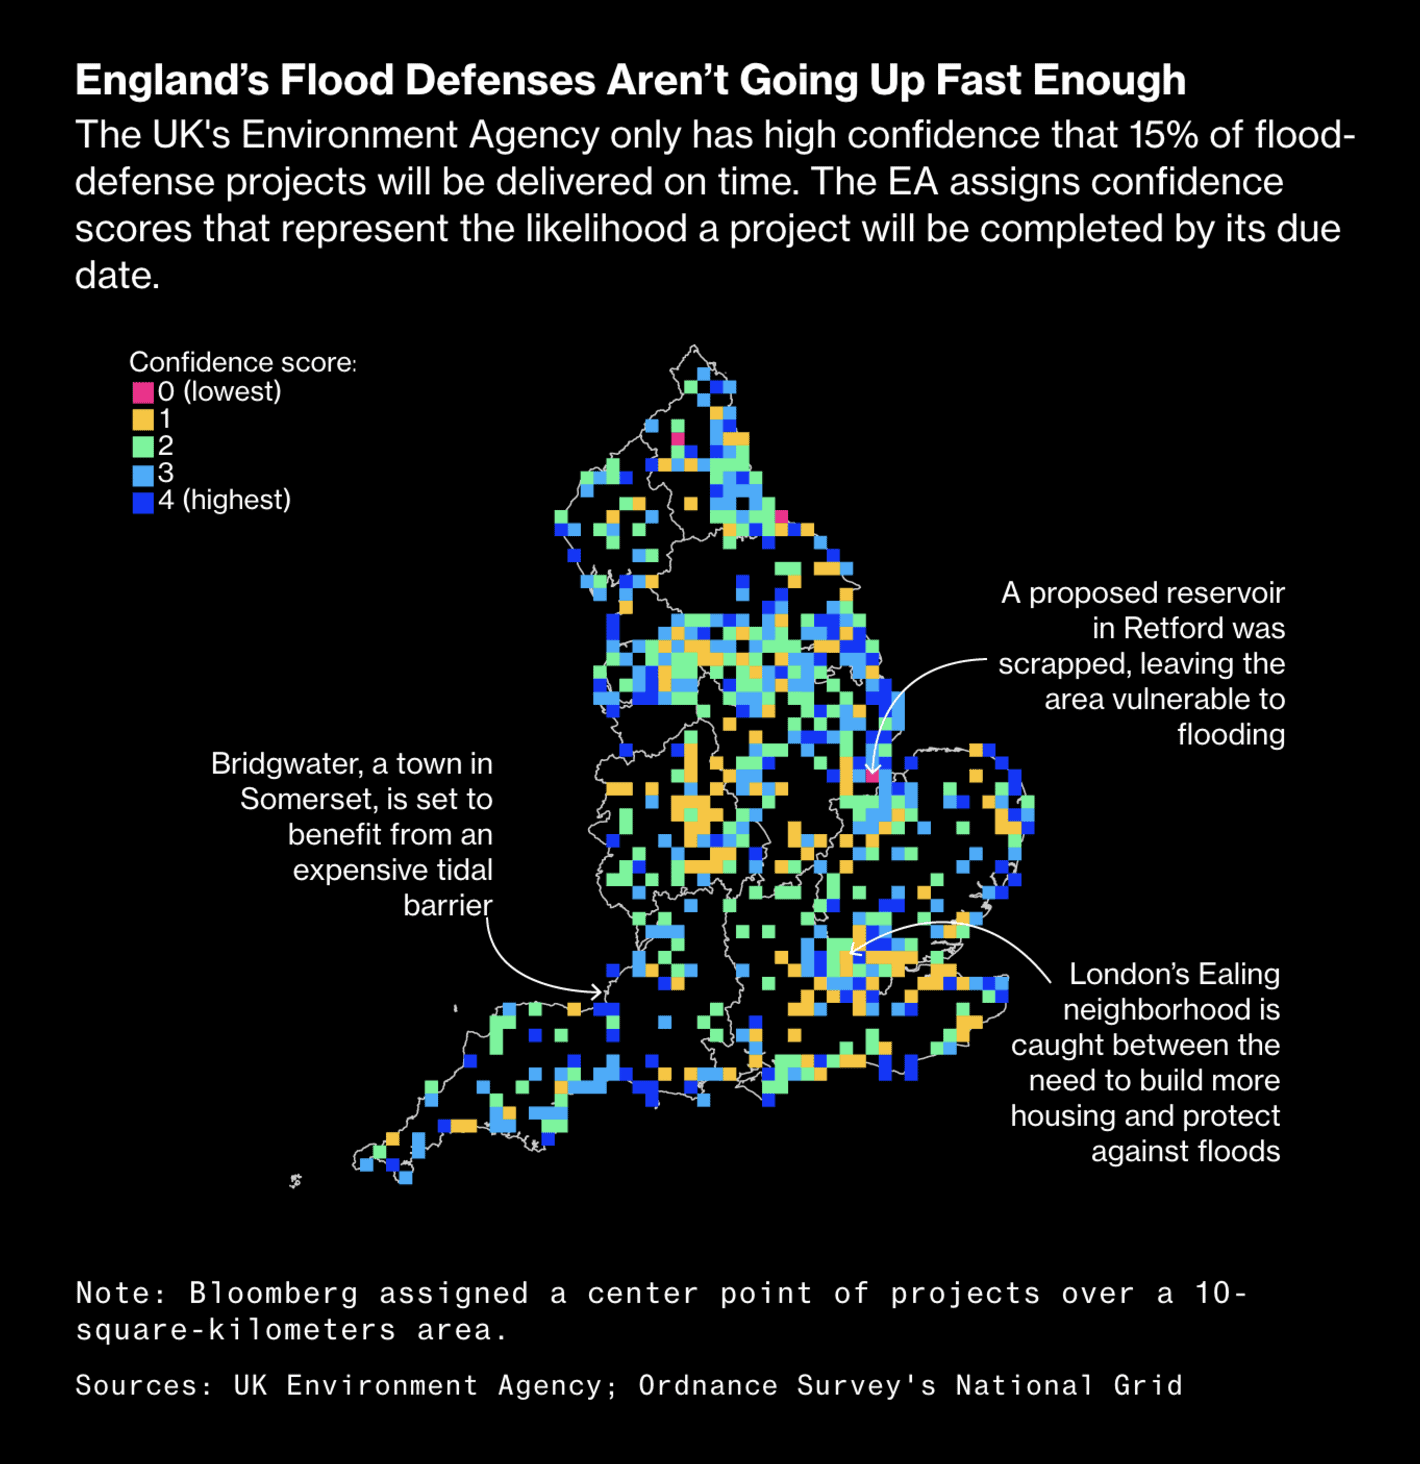
In environmental visualizations this week, the German Foreign Office released itsClimate Conflict Vulnerability Index, and the U.K. government launched an insurance program to boost flood defenses:
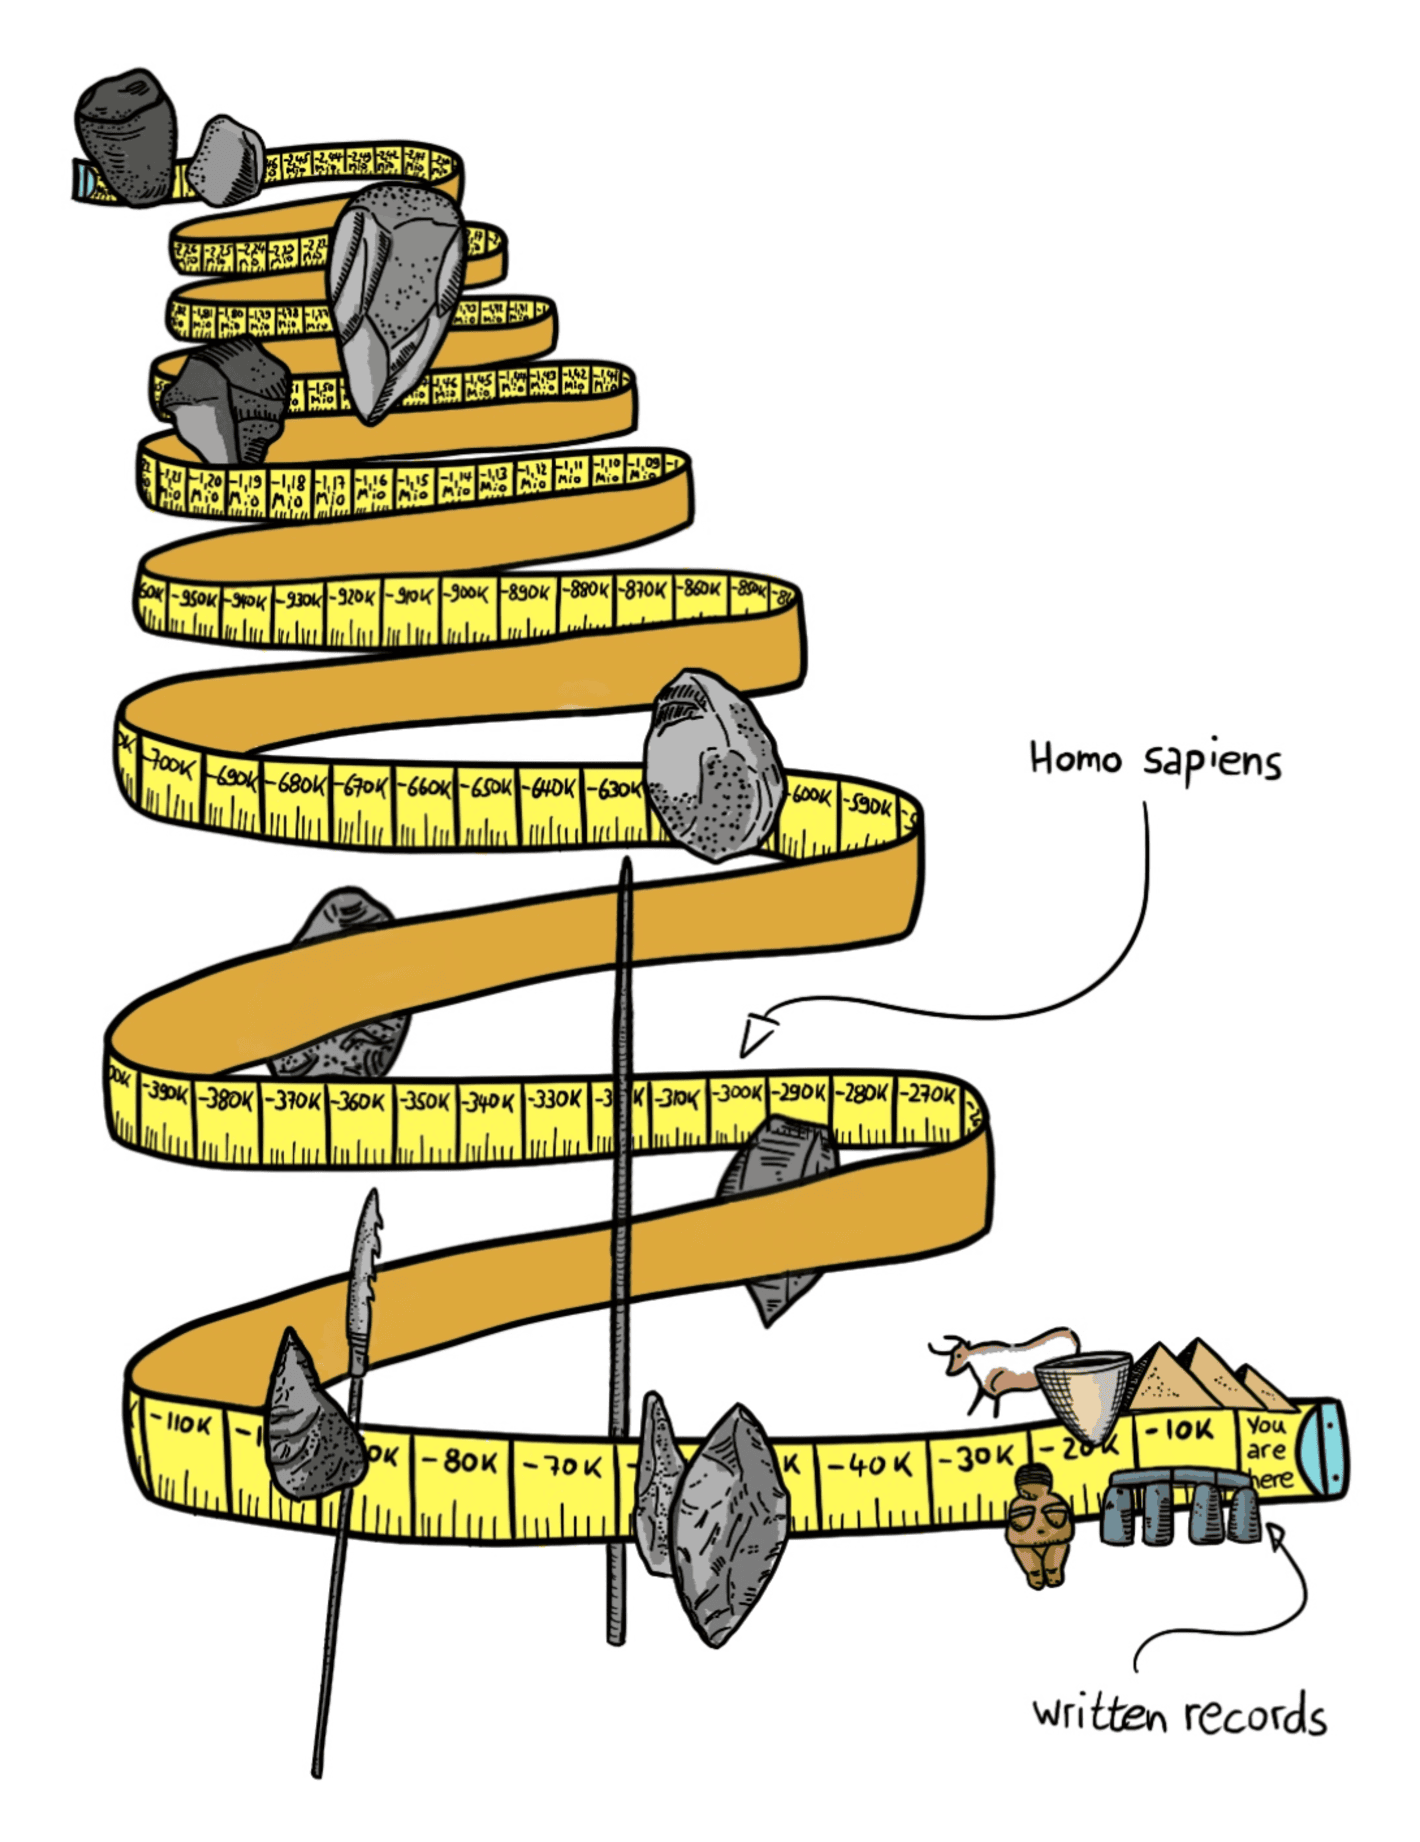
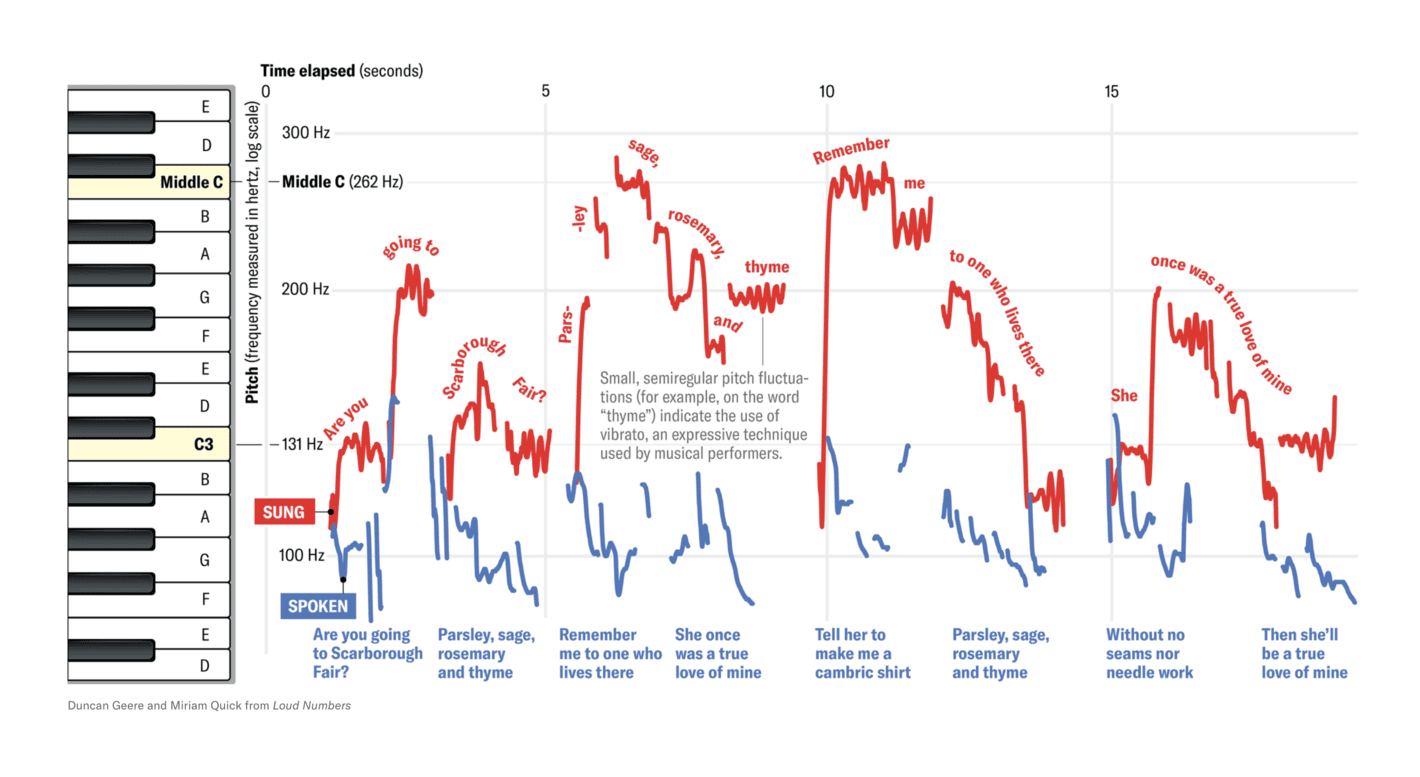
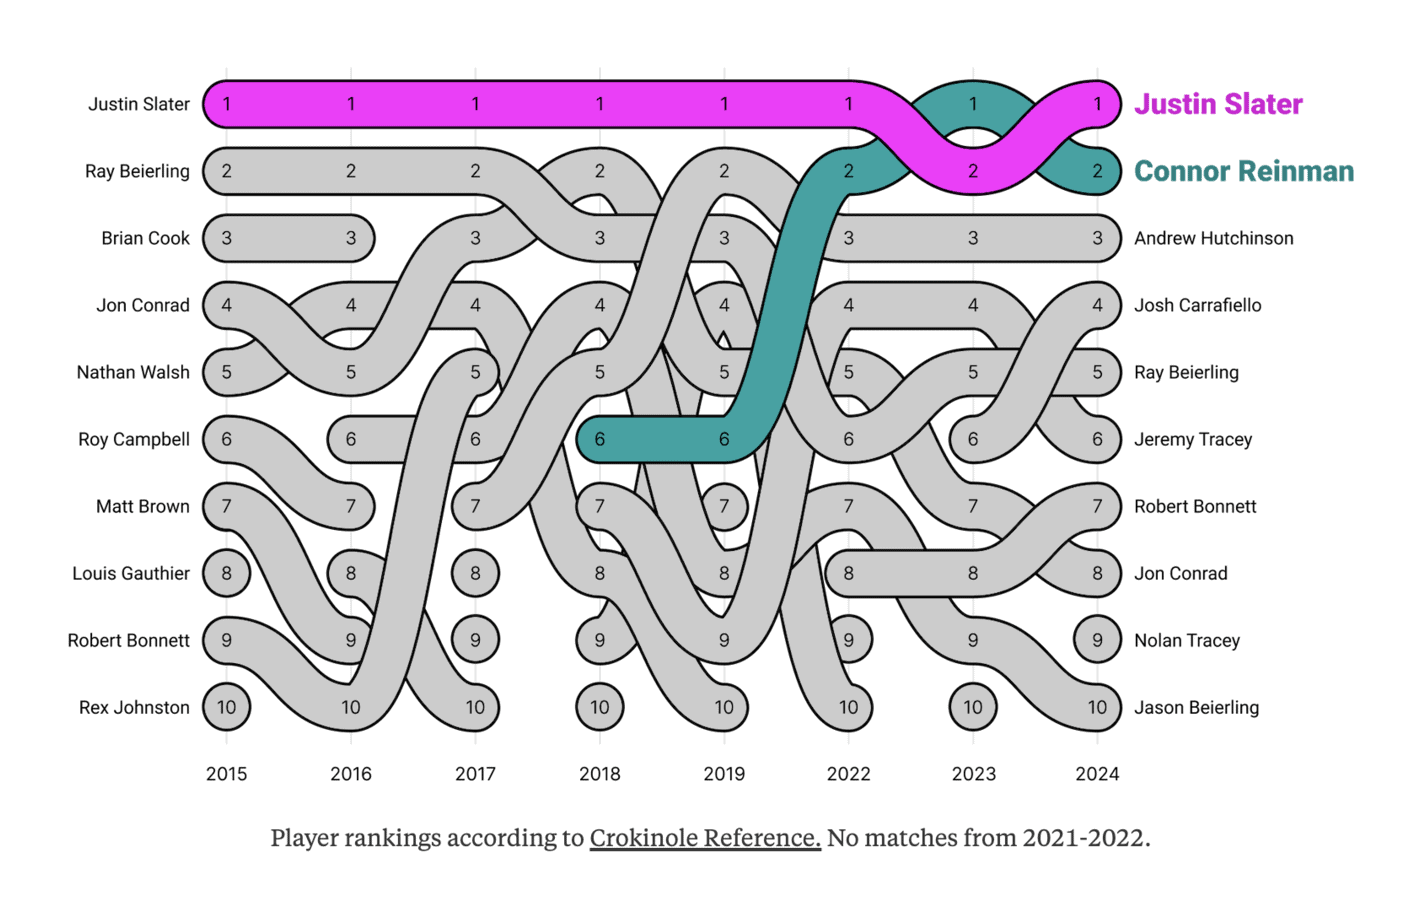
Last but not least, the (actually really long) stone age, the difference between singing and speaking, a game called Crokinole, and Nobel Prize winners:
Jens Notroff: "As useful as Thomsen's Three-Age system is, it also may have added to a disproportionate perception of how loooooong that period we usually sum up as #StoneAge really was," October 21 (Tweet)Scientific American: Hidden Patterns in Folk Songs Reveal How Music Evolved, October 15The Pudding: "Do you know about the game of Crokinole? No!? Well then, come learn how amazing the world's best competitive players are. Plus, we made a playable simulator!" October 17 (Tweet, Article)Der Spiegel: Nobelpreisträger: Die Genialsten Köpfe der Welt [Nobel Prize Winners: The Most Brilliant Minds in the World], October 15
What else we found interesting
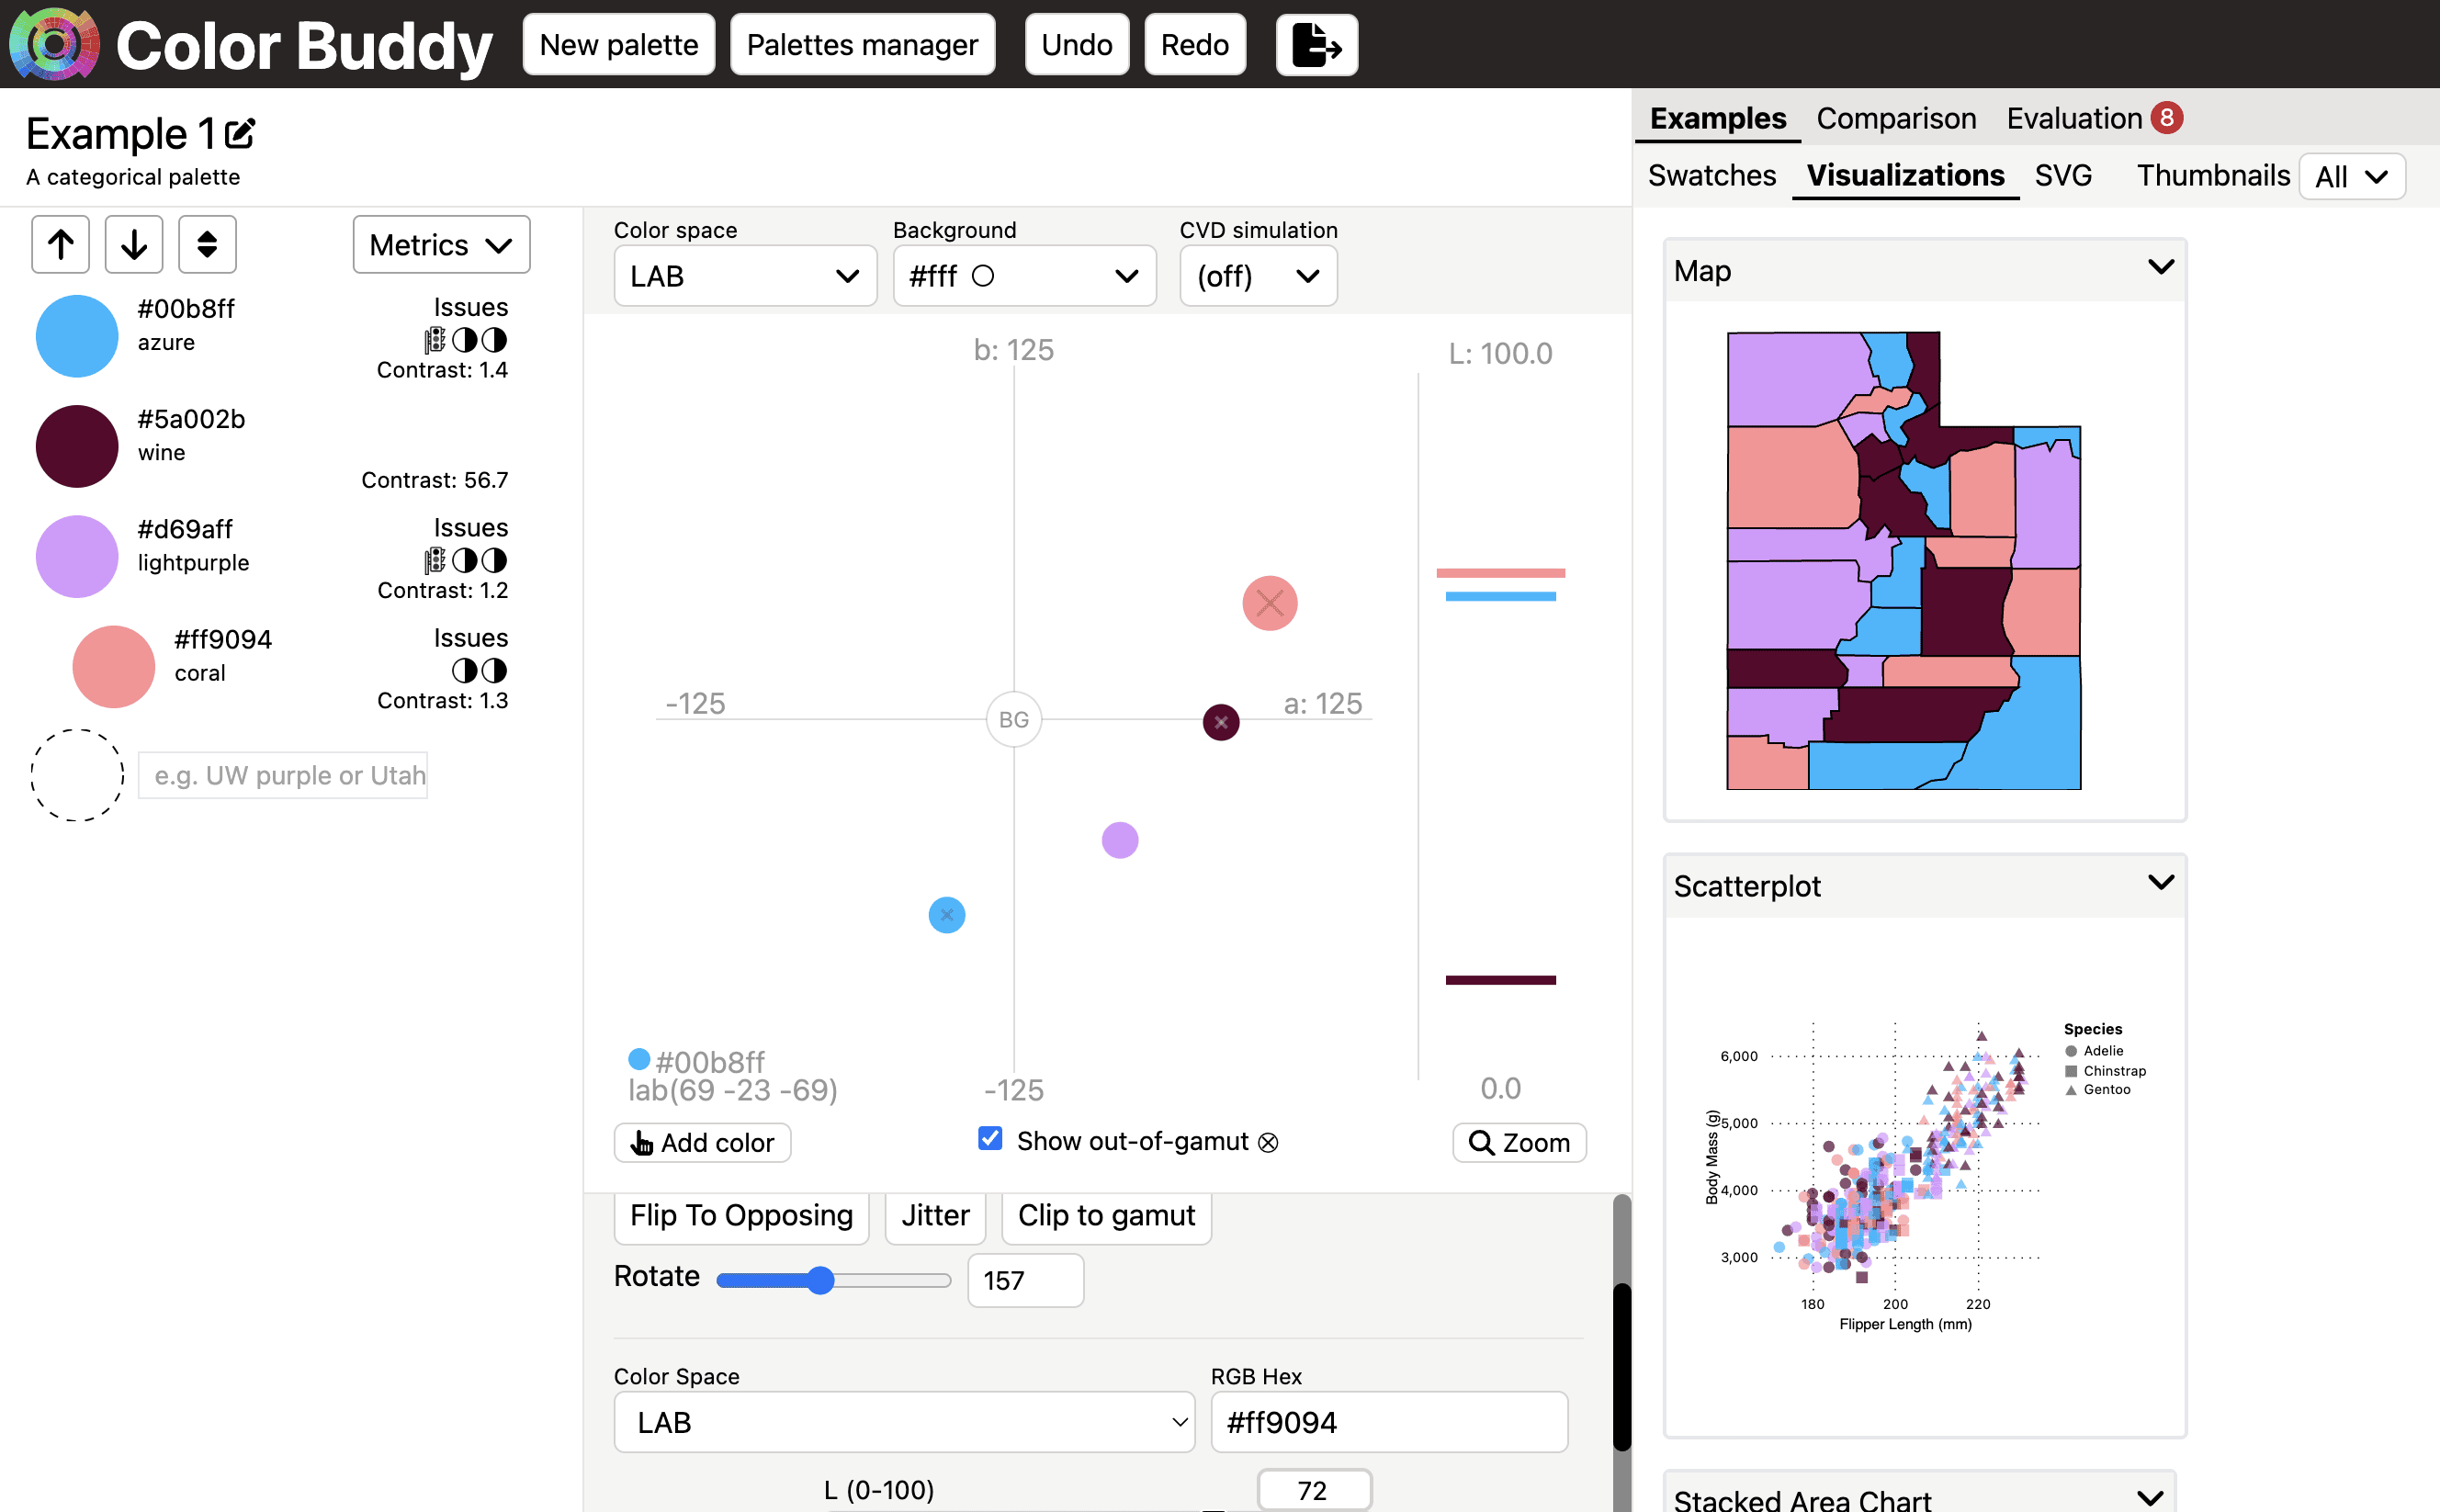
Dr. Annie CAIP FCRIC: Color Buddy, a tool for building color palettes for visualization, October 18 (Tweet, Color Buddy)
Help us make this dispatch better! We'd love to hear which newsletters, blogs, or social media accounts we need to follow to learn about interesting projects, especially from less-covered parts of the world (Asia, South America, Africa). Write us at hello@datawrapper.de or leave a comment below.

![Voilà / Francis Gagnon: "What happens when two information designers who work at the same agency challenge themselves to rethink a set of charts they found on the Internet? [...]," October 16 (<strong><a href="https://bsky.app/profile/chezvoila.com/post/3l6nne5hlgh2i">Bluesky</a></strong>)](https://datawrapper.de/cdn-cgi/image/quality=85,width=2000,f=auto,fit=cover/https://kirby.datawrapper.de/media/pages/blog/data-vis-dispatch-october-22-2024/be177671dd-1740123231/left.jpg)
![Voilà / Francis Gagnon: "Their attention was focused on different things. Patricia’s notes show a focus on content, with questions such as 'Is 2% a lot?' [...]," October 16 (<strong><a href="https://bsky.app/profile/chezvoila.com/post/3l6nogtopq22c">Bluesky</a></strong>)](https://datawrapper.de/cdn-cgi/image/quality=85,width=2000,f=auto,fit=cover/https://kirby.datawrapper.de/media/pages/blog/data-vis-dispatch-october-22-2024/a61bbb9387-1740123231/right.jpg)
![Texty: <strong><a href="https://texty.org.ua/projects/113607/karusel-emocij-riven-manipulyatyvnosti-movy-ukrayinskyh-telehram-kanaliv/?src=main">Карусель емоцій: Рівень маніпулятивності українських телеграм-каналів</a></strong> [<em>Carousel of emotions:The level of manipulativeness of Ukrainian Telegram channels</em>], October 21 <span class="badge">More to discover here</span>](https://datawrapper.de/cdn-cgi/image/quality=85,width=1418,f=auto,fit=cover/https://kirby.datawrapper.de/media/pages/blog/data-vis-dispatch-october-22-2024/8e552c6094-1740123231/image19-4.png)
![Gênero e Número: <strong><a href="https://www.generonumero.media/eleitas-2000-2024/">Sete eleições e poucos avanços</a></strong> [<em>Chart description: The bars show the proportion of female candidates elected to Municipal Chambers per year</em>], October 16](https://datawrapper.de/cdn-cgi/image/quality=85,width=1420,f=auto,fit=cover/https://kirby.datawrapper.de/media/pages/blog/data-vis-dispatch-october-22-2024/7051a71e19-1740123231/image21-3.png)
![Nikkei: <strong><a href="https://vdata.nikkei.com/newsgraphics/shuin-system/">衆院選の仕組み</a></strong> [<em>Chart title: The primary election has 289 seats</em>], October 16](https://datawrapper.de/cdn-cgi/image/quality=85,width=1420,f=auto,fit=cover/https://kirby.datawrapper.de/media/pages/blog/data-vis-dispatch-october-22-2024/9618af7043-1740123231/image6-3.png)
![Der Spiegel: Was verdient Ihr Bundestagsabgeordneter? [<em>How much does your member of parliament earn?</em>], October 19](https://datawrapper.de/cdn-cgi/image/quality=85,width=1420,f=auto,fit=cover/https://kirby.datawrapper.de/media/pages/blog/data-vis-dispatch-october-22-2024/631882a563-1740123231/image2-4.png)

![Le Monde: <strong><a href="https://www.lemonde.fr/les-decodeurs/article/2024/10/22/elections-americaines-2024-comment-le-gerrymandering-un-decoupage-electoral-partisan-modifie-le-resultat-d-une-election_6357909_4355770.html">Présidentielle américaine : comment le « gerrymandering », un découpage électoral partisan, modifie le résultat d’une élection</a></strong> [<em>Chart title: Partisan electoral redistricting, gerrymander-style</em>], October 22](https://datawrapper.de/cdn-cgi/image/quality=85,width=1420,f=auto,fit=cover/https://kirby.datawrapper.de/media/pages/blog/data-vis-dispatch-october-22-2024/e39b71a82b-1740123231/image14-2.png)

![Der Spiegel: <strong><a href="https://www.spiegel.de/gesundheit/organspende-register-was-deutschland-von-anderen-laendern-lernen-kann-a-d1eecb0f-27d0-4bc8-9d58-2c22bacf469a">Was Deutschland von anderen Ländern lernen kann</a></strong> [<em>Chart description: “Would you donate your organs to another person after your death?”</em>], October 21](https://datawrapper.de/cdn-cgi/image/quality=85,width=1420,f=auto,fit=cover/https://kirby.datawrapper.de/media/pages/blog/data-vis-dispatch-october-22-2024/afa73fc6c5-1740123231/image18-3.png)
![SBS News: <strong><a href="https://mabunews.stibee.com/p/265/">스위스의 안락사 캡슐, 구독자는 어떻게 생각해?</a></strong> [<em>What do subscribers think about the assisted suicide capsule in Switzerland?</em>], October 17](https://datawrapper.de/cdn-cgi/image/quality=85,width=1420,f=auto,fit=cover/https://kirby.datawrapper.de/media/pages/blog/data-vis-dispatch-october-22-2024/87aa673120-1740123231/image23-3.png)