Data Vis Dispatch, June 24: U.S. bombs Iran, energy reports, and rising temperatures

Welcome back to the 198th edition of Data Vis Dispatch! Every week, we’ll be publishing a collection of the best small and large data visualizations we find, especially from news organizations — to celebrate data journalism, data visualization, simple charts, elaborate maps, and their creators.
Recurring topics this week include developments in the ongoing Iran–Israel war, new reports on worldwide energy, and rising temperatures.
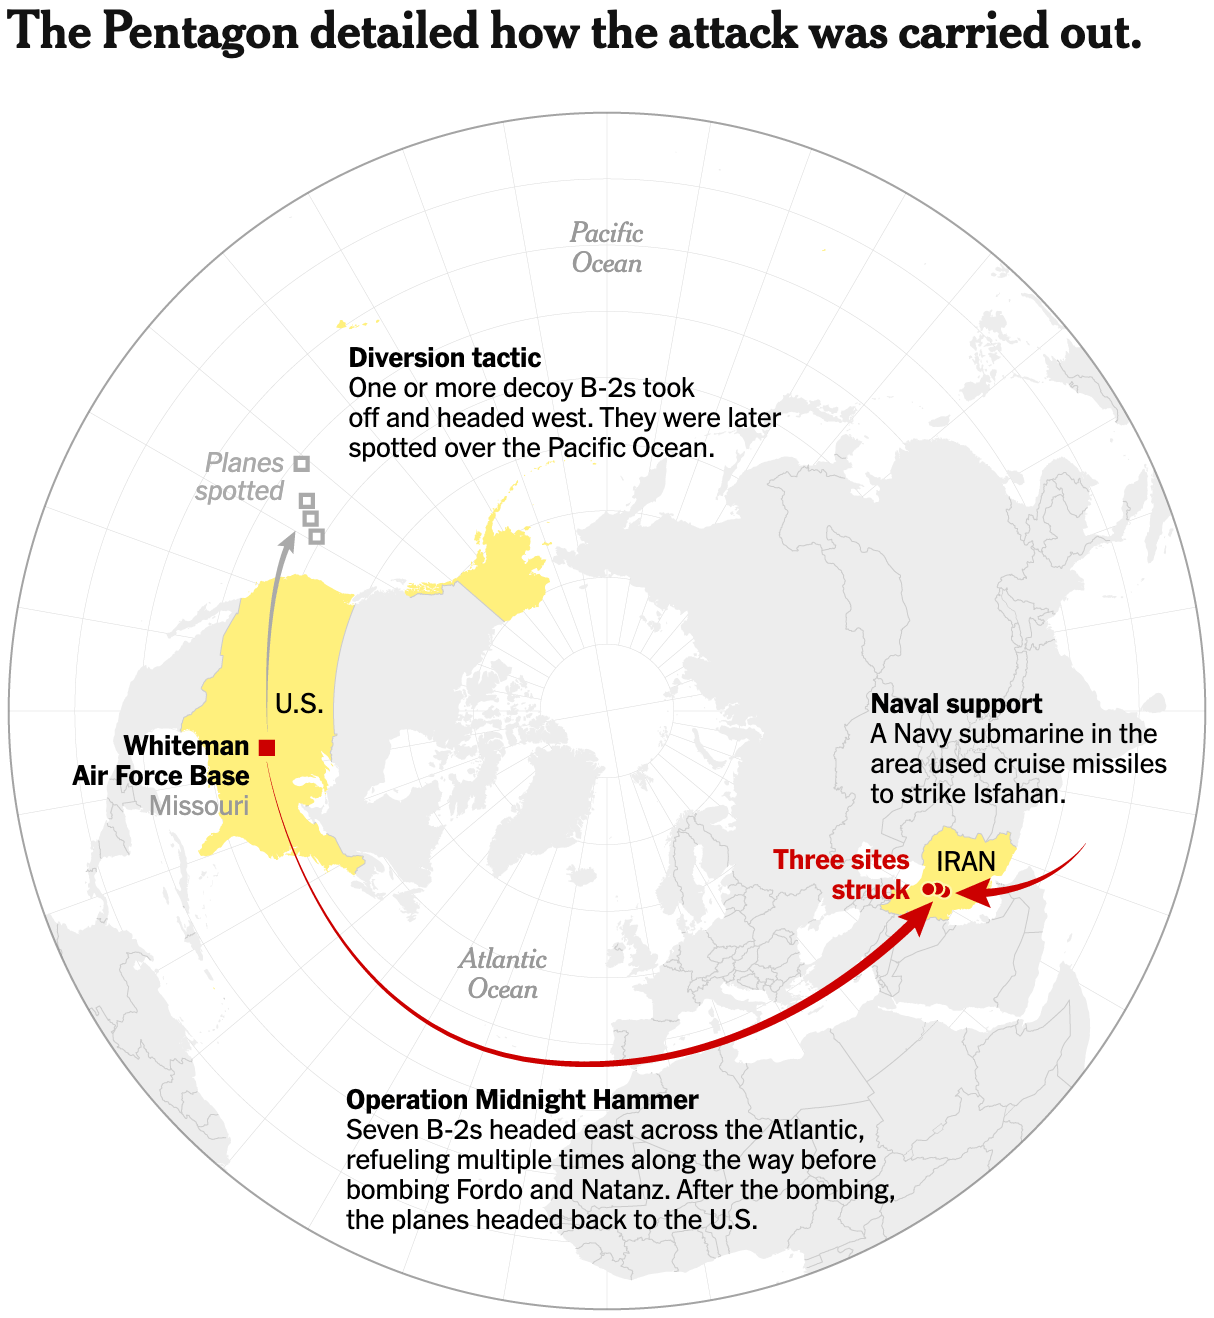
This weekend, the U.S. bombed Iranian nuclear sites, and Iran responded with strikes on a U.S base in Qatar. We'll start with visualizations about the international relations and weapons systems involved:

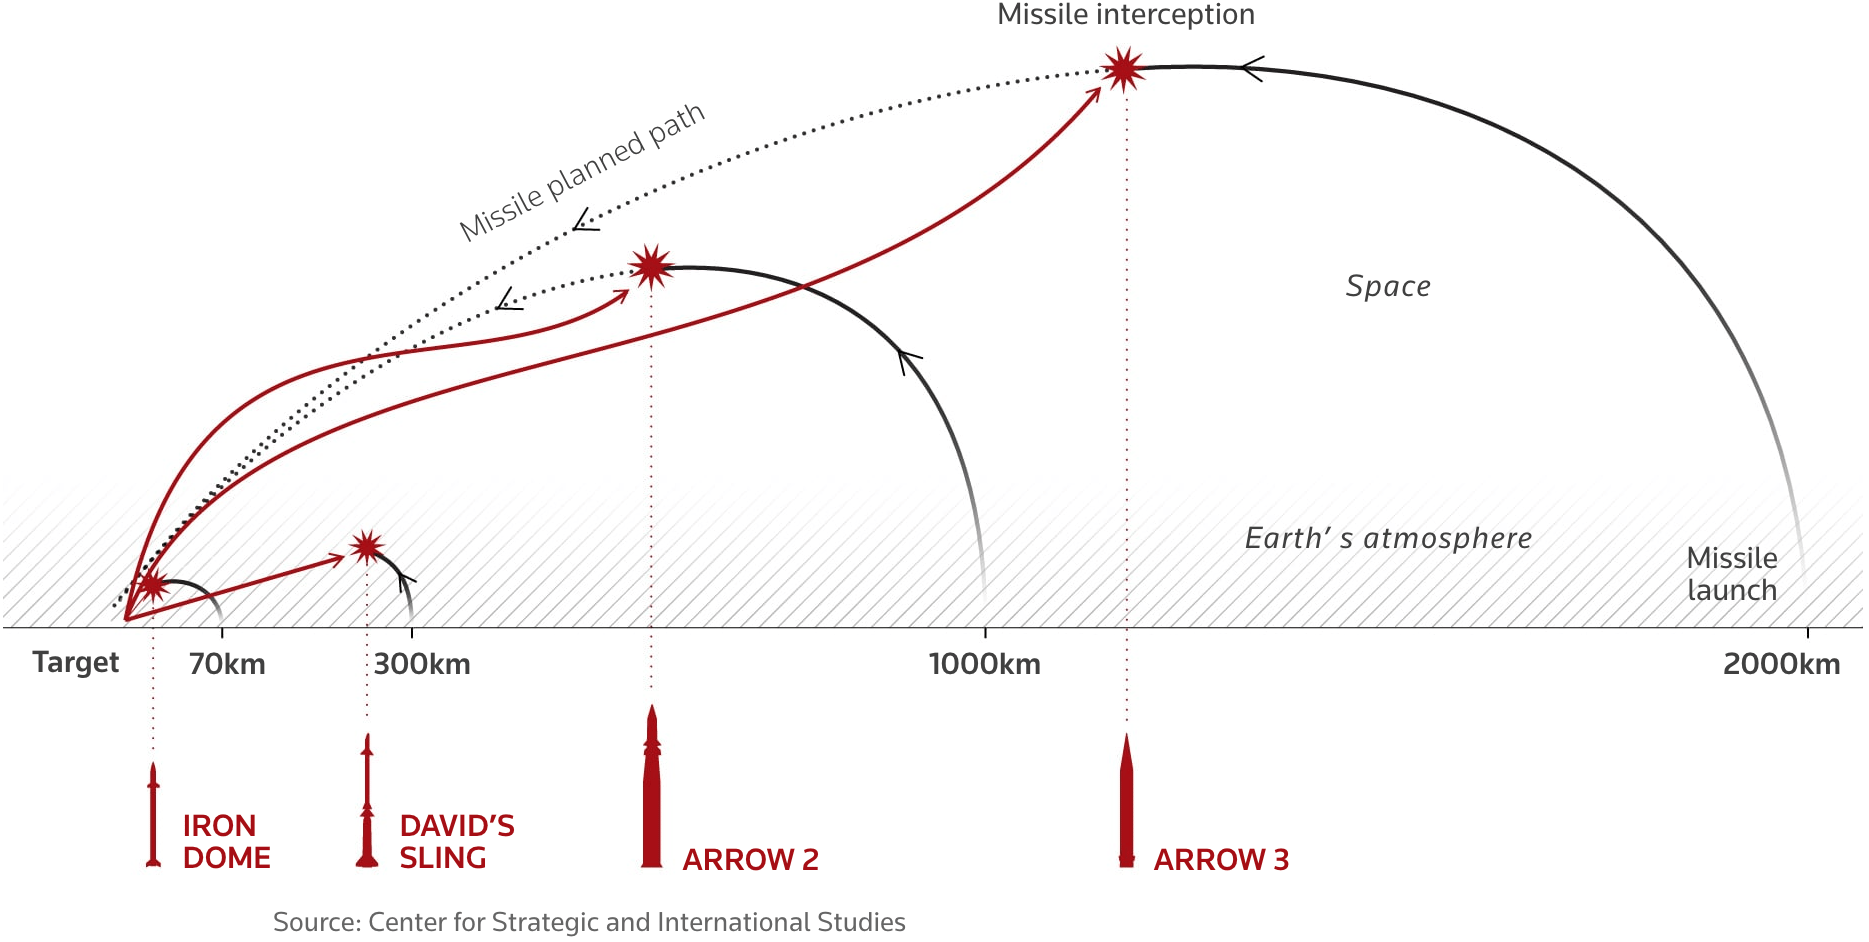
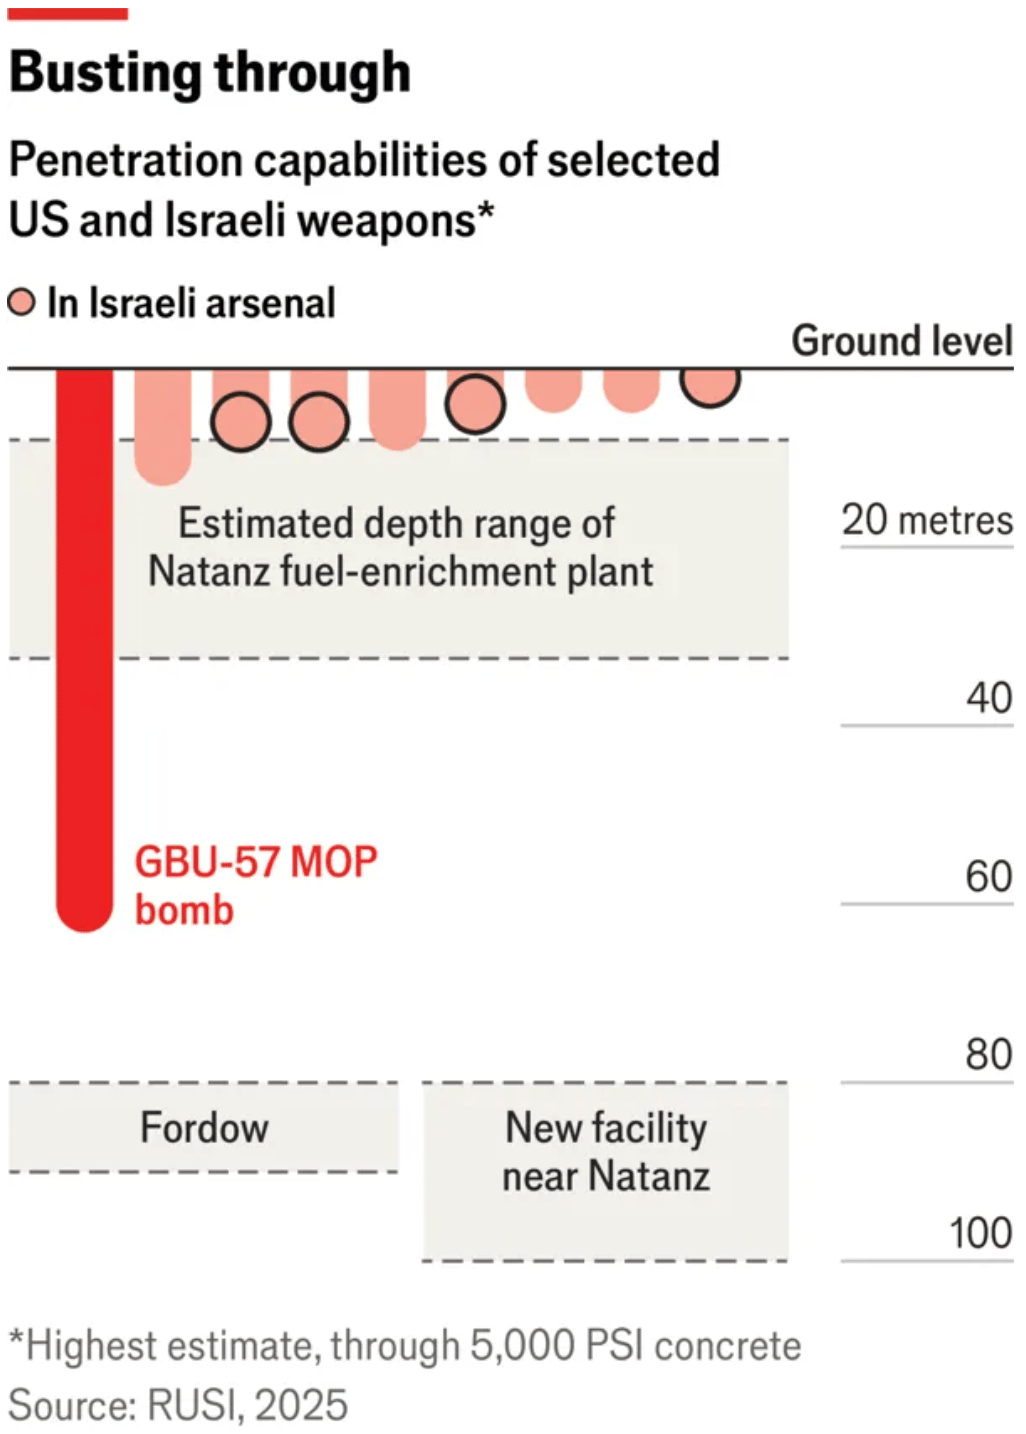

There was extensive coverage of U.S. strategic movements in the area, which culminated in "Operation Midnight Hammer":

![Diario Sur: <a href="https://www.diariosur.es/internacional/oriente-proximo/ataque-devastador-125-aviones-bombas-15000-kilos-20250622170013-ntrc.html"><strong>Un ataque 'devastador' con 125 aviones y bombas de 14.000 kilos</strong></a> [<em>A "devastating" attack with 125 aircraft and 14,000 kg bombs</em>], June 22](https://datawrapper.de/cdn-cgi/image/quality=85,width=1750,f=auto,fit=cover/https://kirby.datawrapper.de/media/pages/blog/data-vis-dispatch-june-24-2025/b8f34d5e39-1750756049/cleanshot-2025-06-24-at-11.06.57@2x.png)
Meanwhile, Trump's cuts to funding for science and foreign aid stayed in the news — as did his declining approval ratings:

![Alex Selby-Boothroyd: "These state-level approval ratings are a very cool new addition to our Trump Tracker […]," June 20 (<a href="https://bsky.app/profile/alexselbyb.bsky.social/post/3ls2lzotvuc2e"><strong>Bluesky</strong></a>, <a href="https://www.economist.com/interactive/trump-approval-tracker"><strong>Article</strong></a>)](https://datawrapper.de/cdn-cgi/image/quality=85,width=1256,f=auto,fit=cover/https://kirby.datawrapper.de/media/pages/blog/data-vis-dispatch-june-24-2025/0bf6504d4a-1750753730/cleanshot-2025-06-24-at-10.27.34@2x.png)
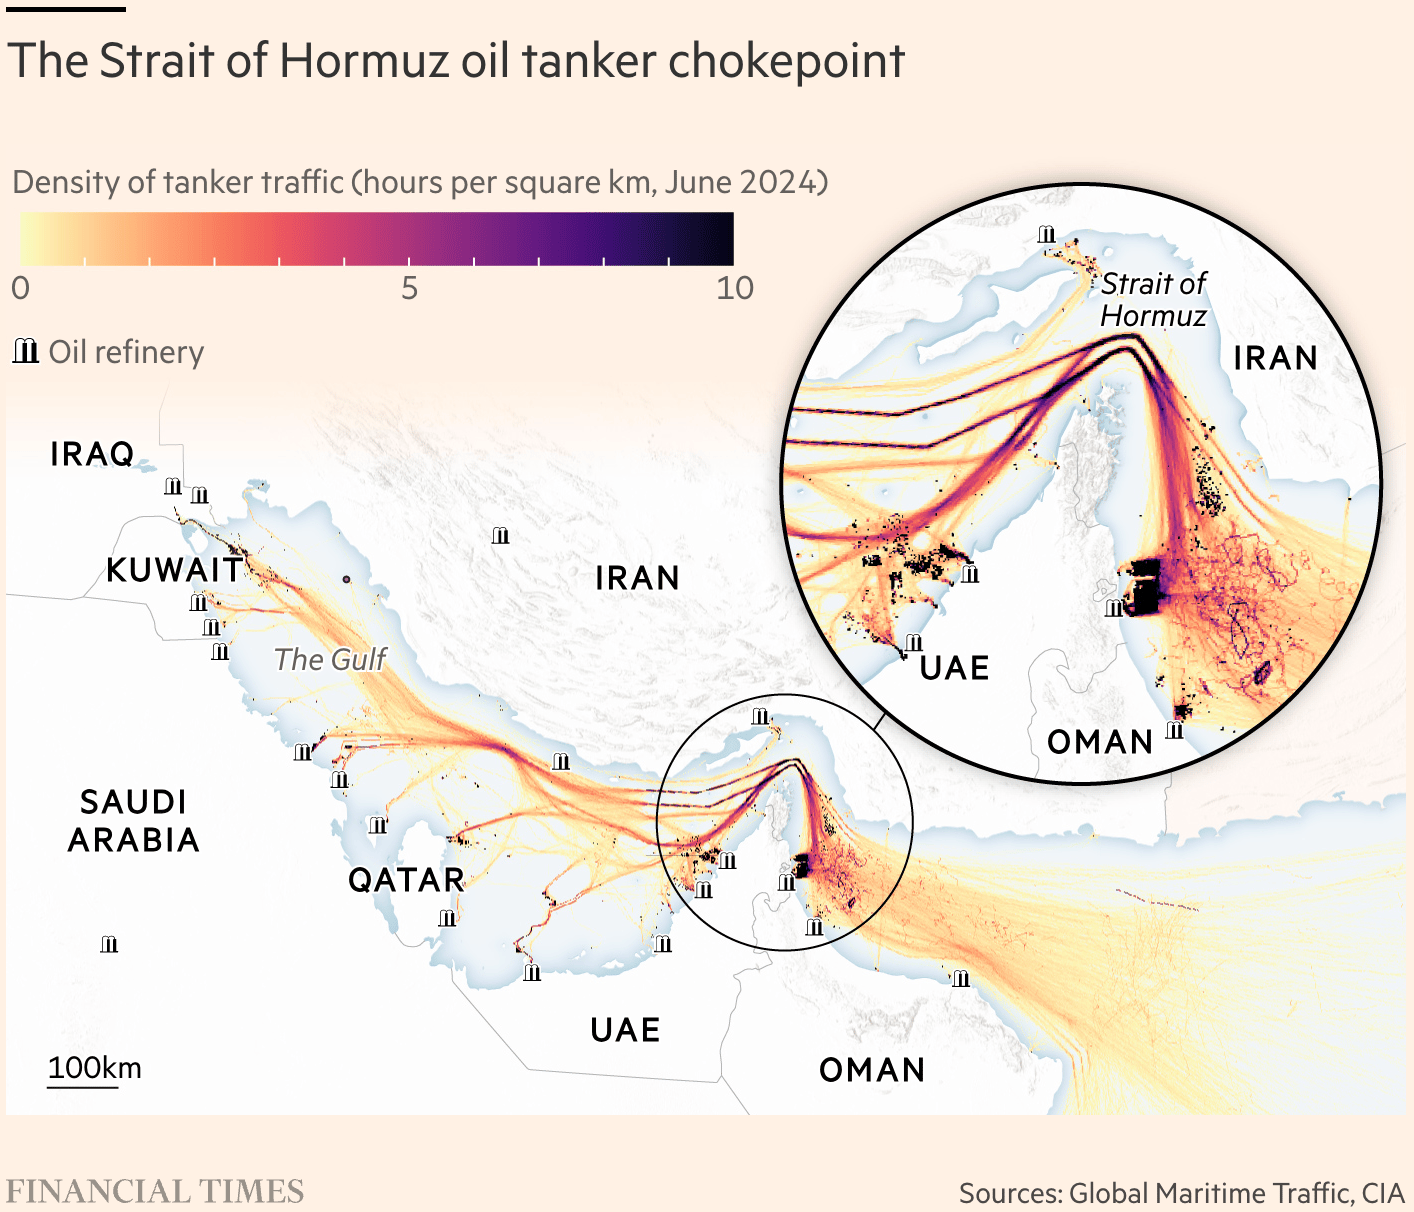
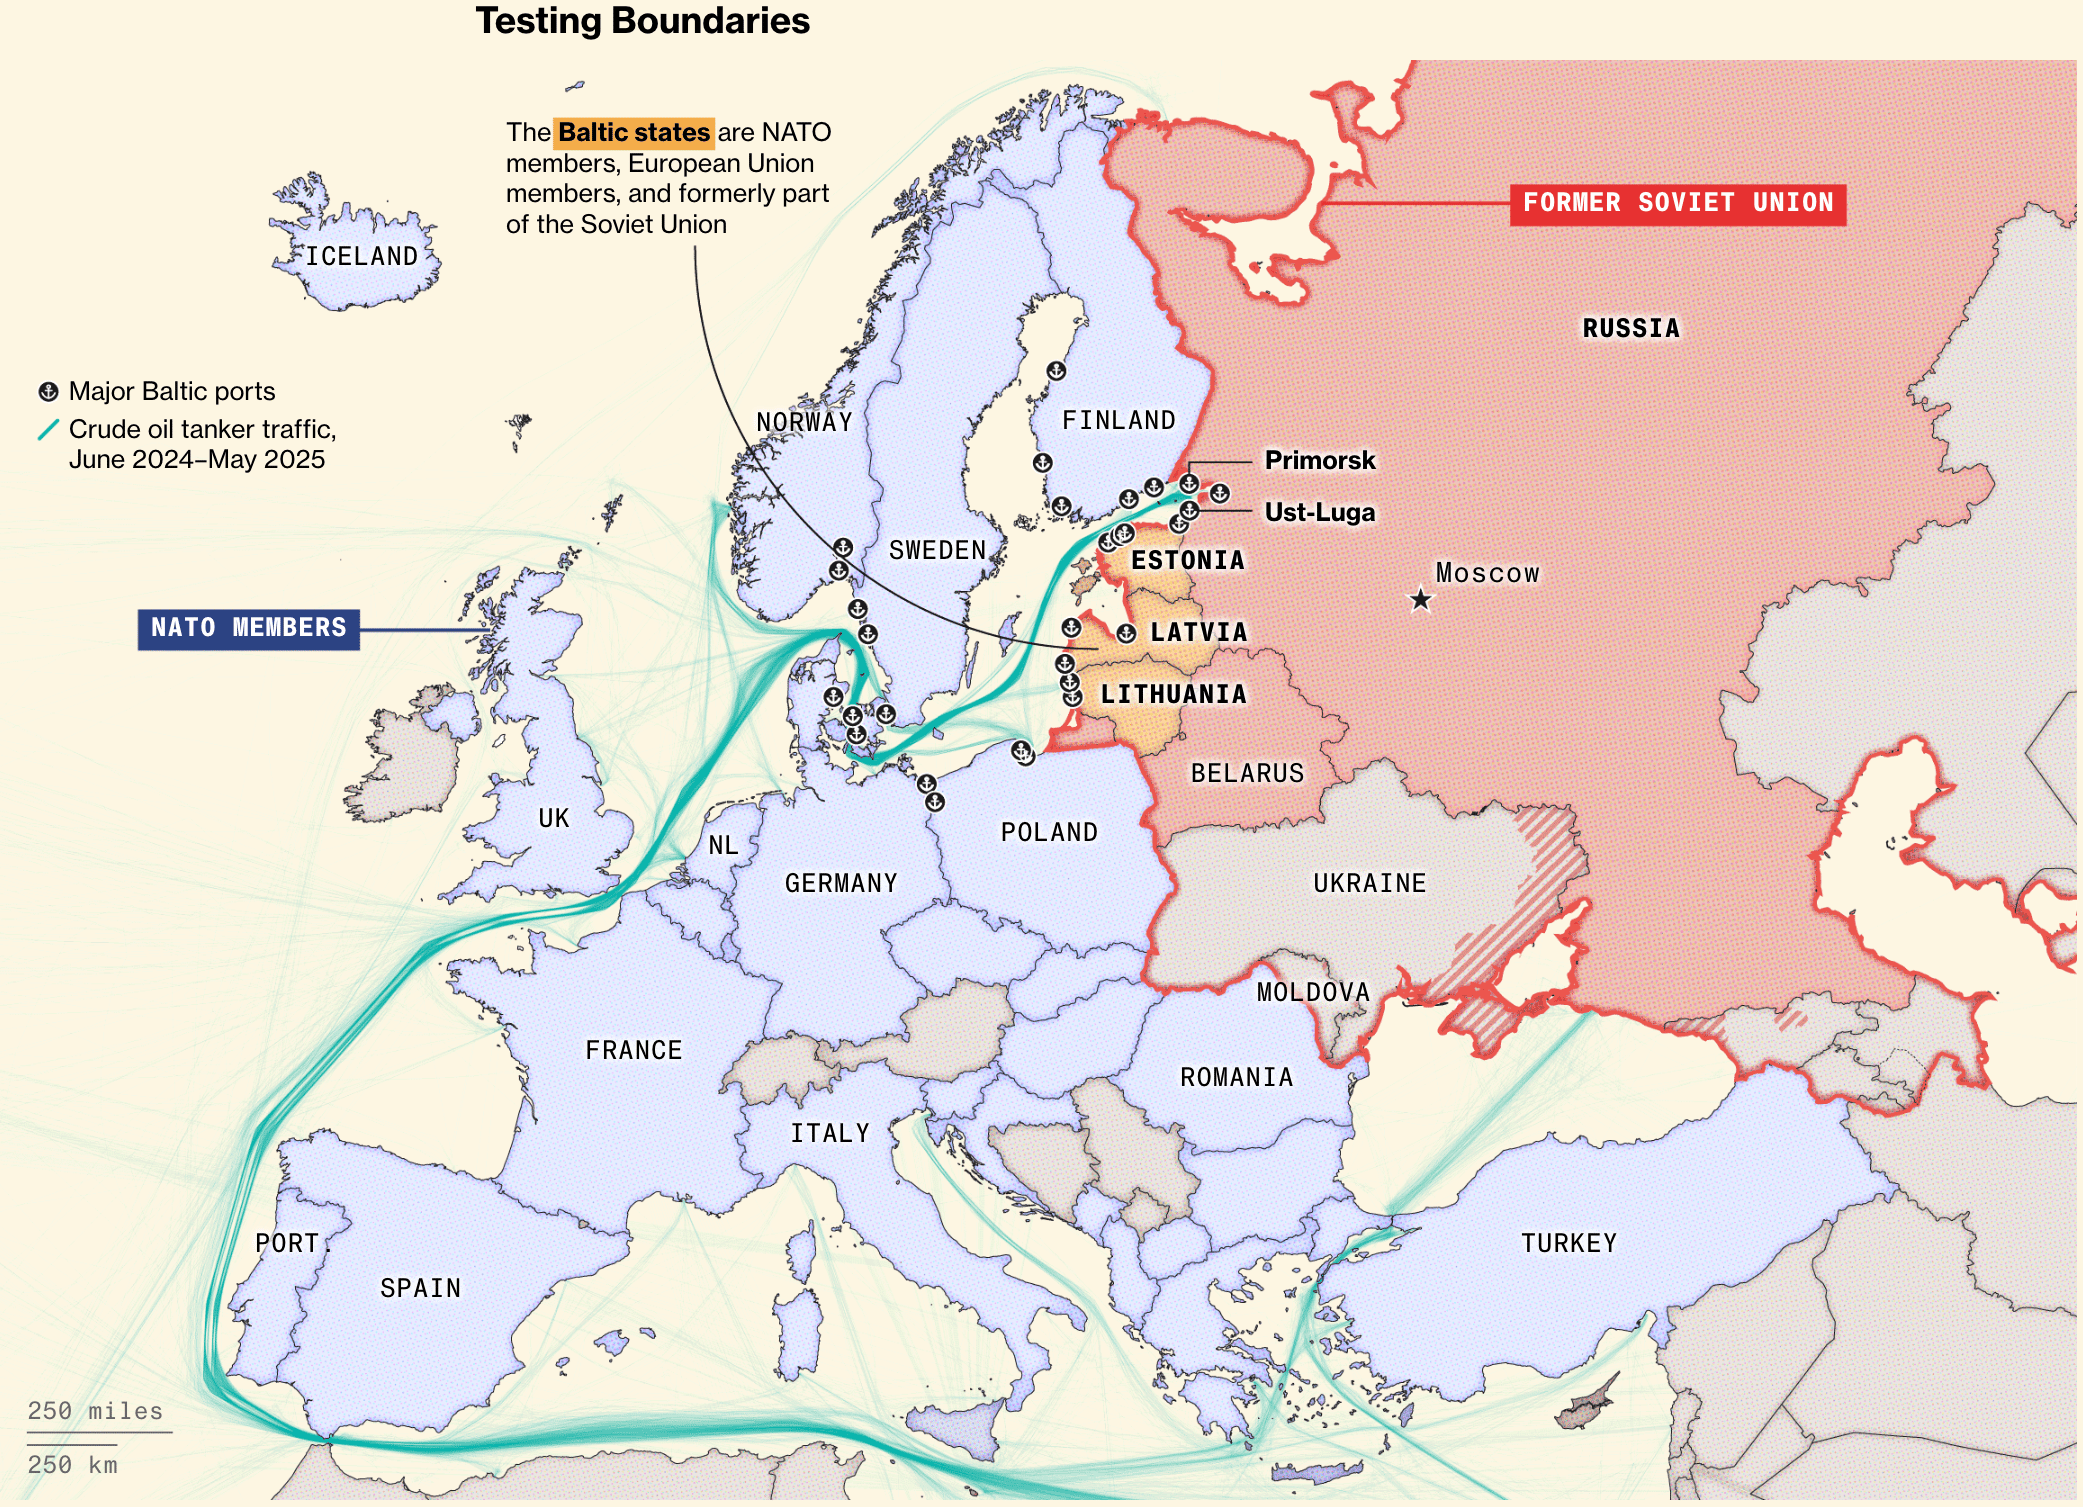
These two maps visualized the importance of oil tanker routes in real and potential conflicts:
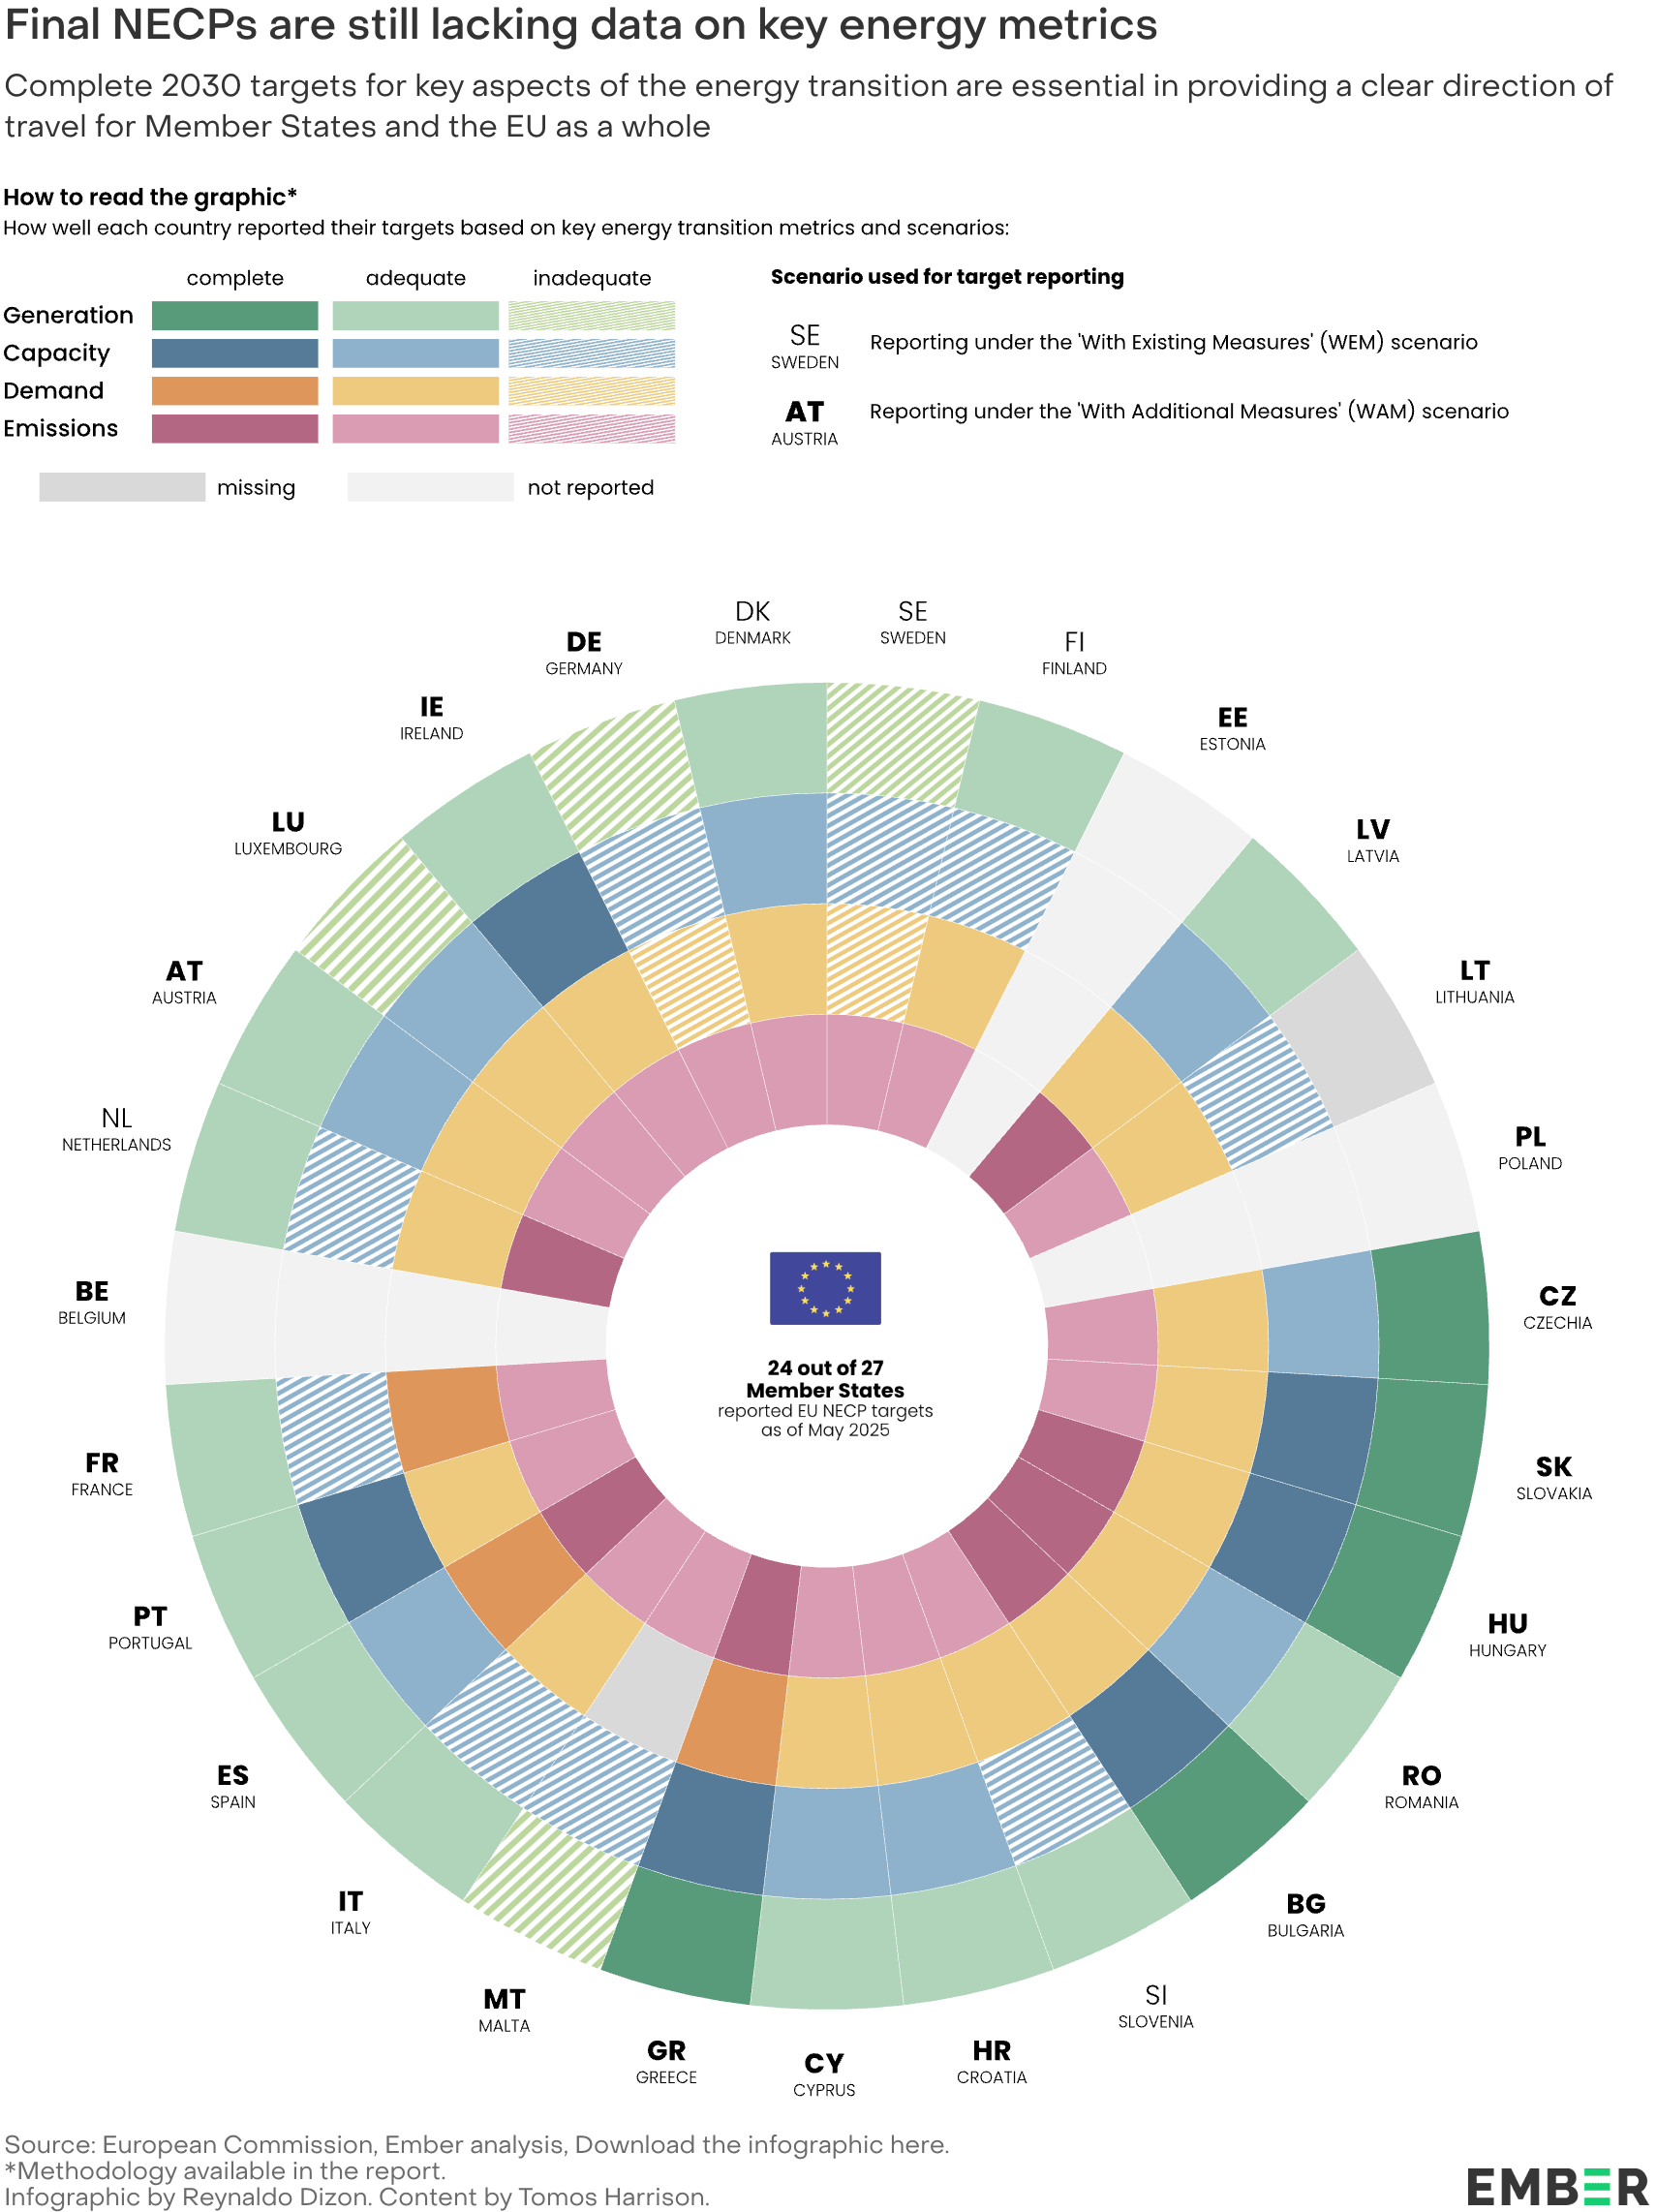
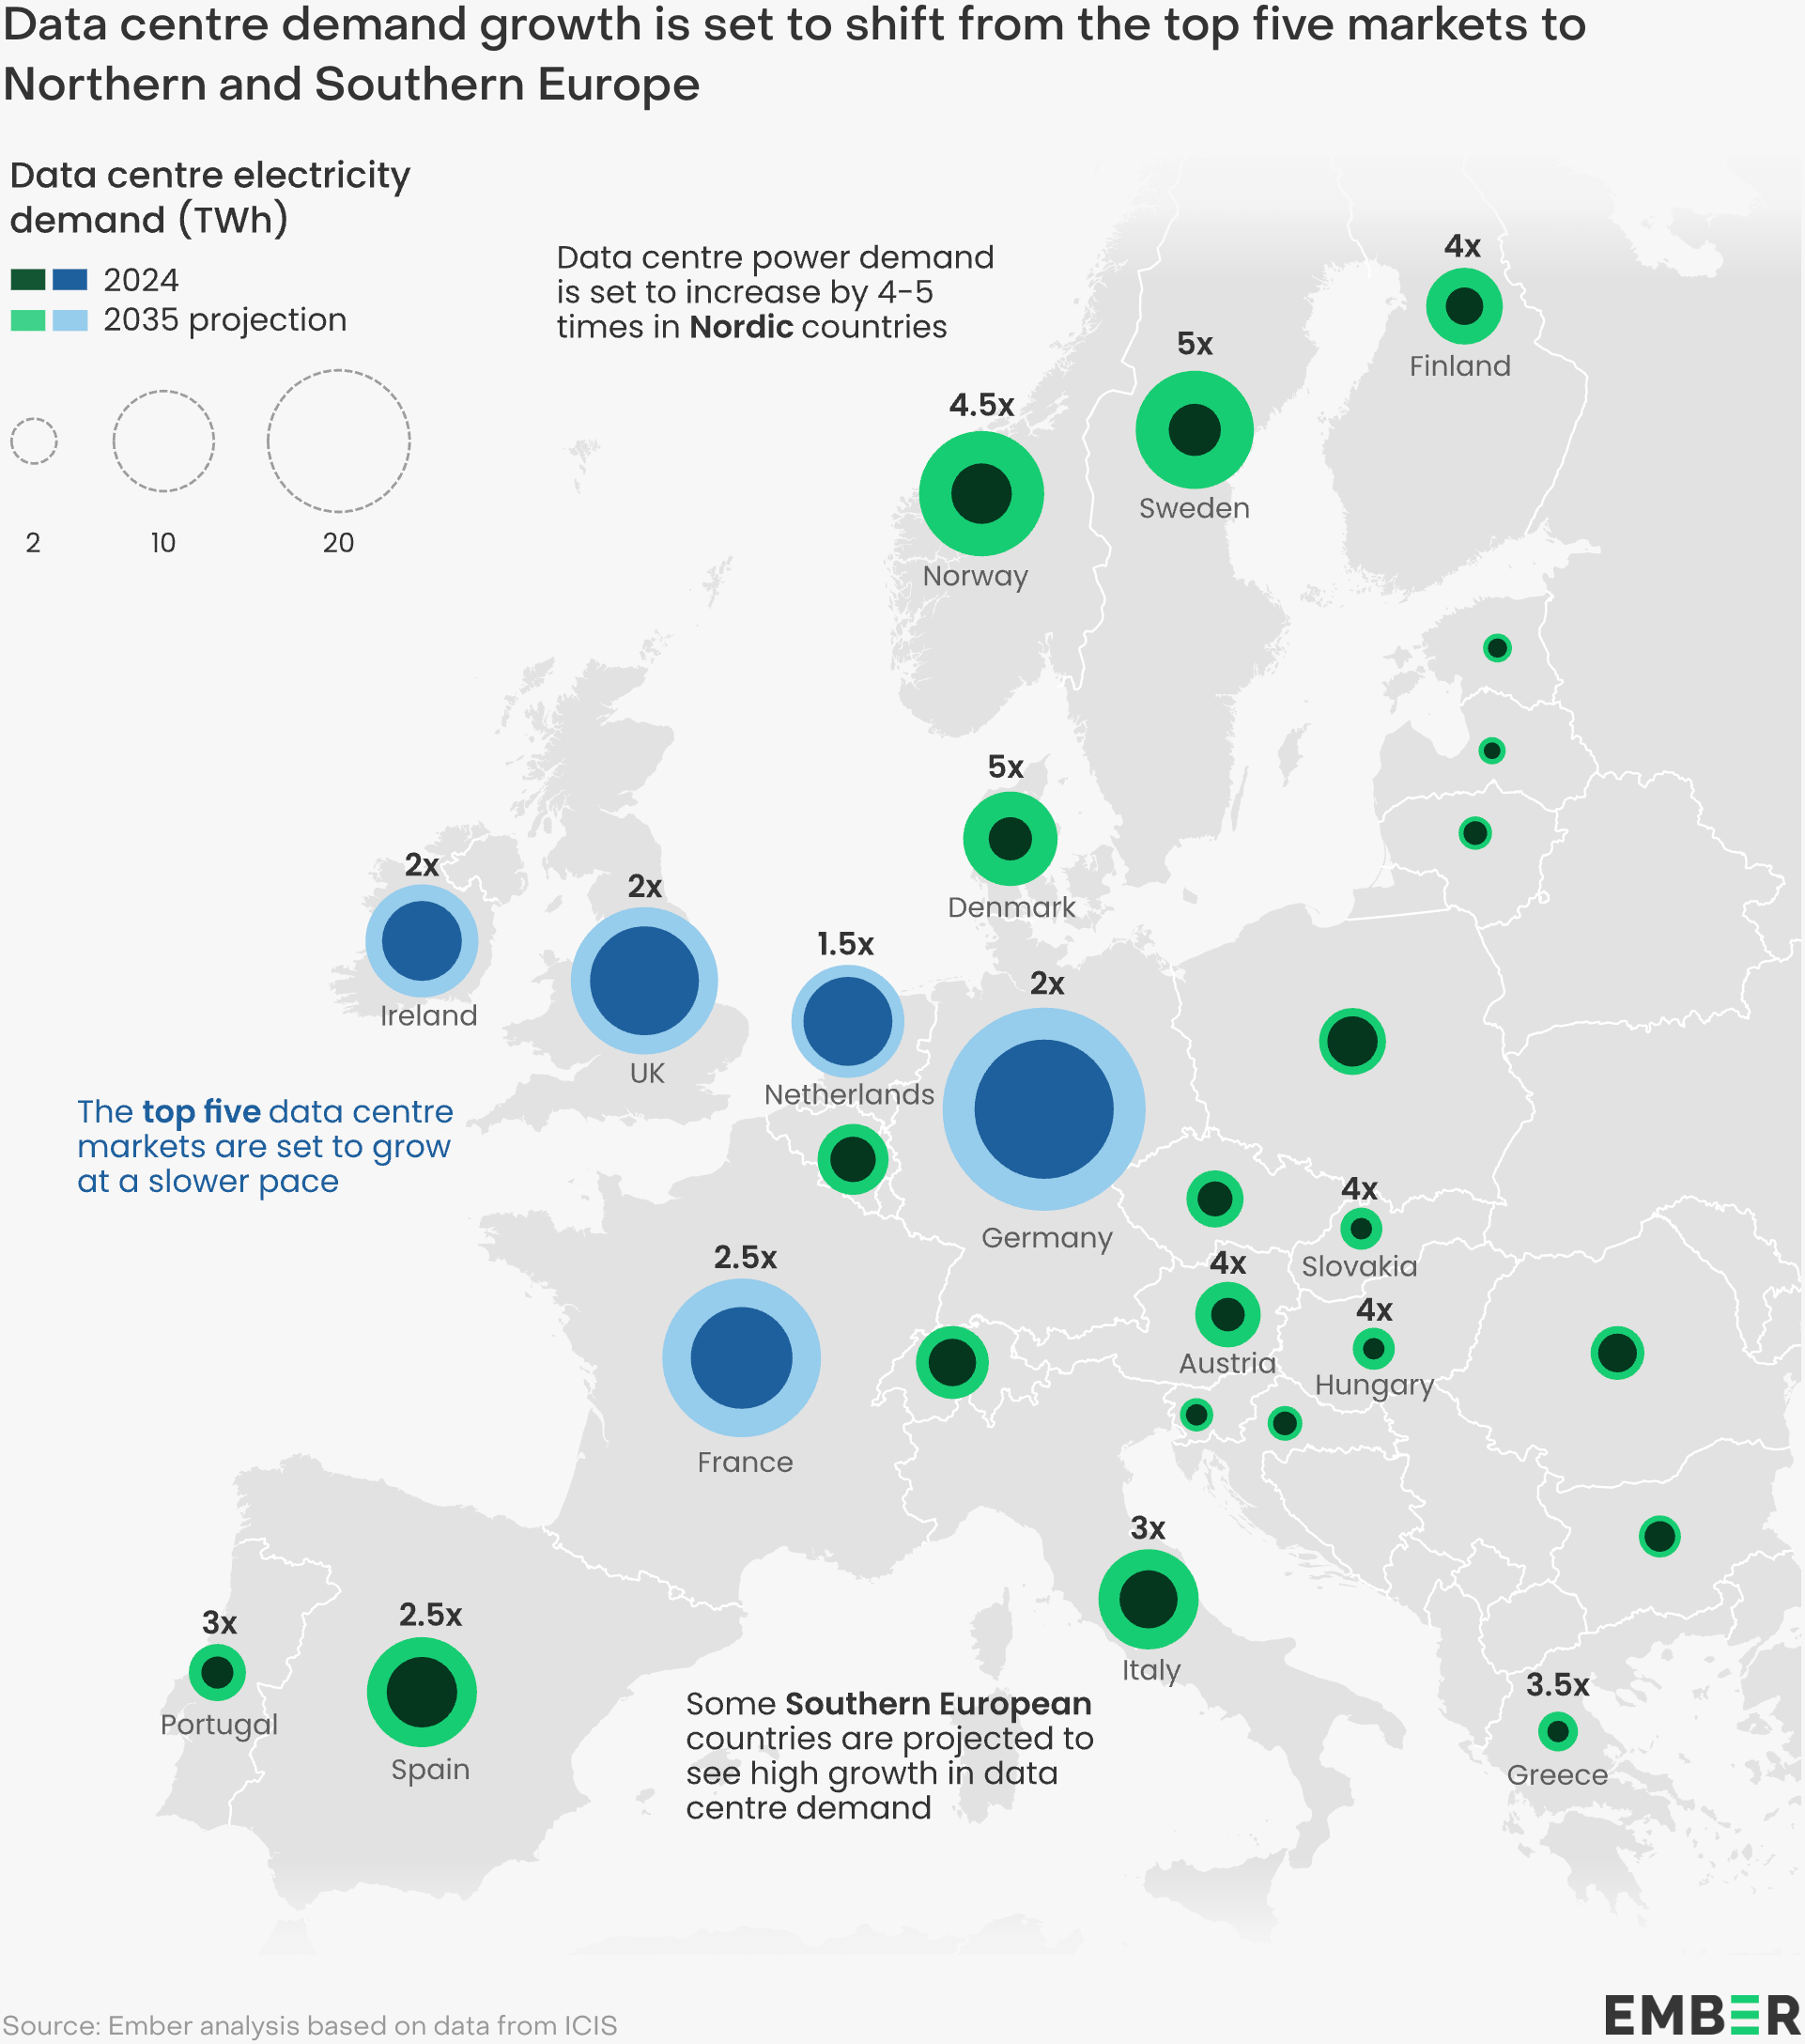
Moving from fossil fuels to clean energy with a selection of new charts from the think tank Ember:

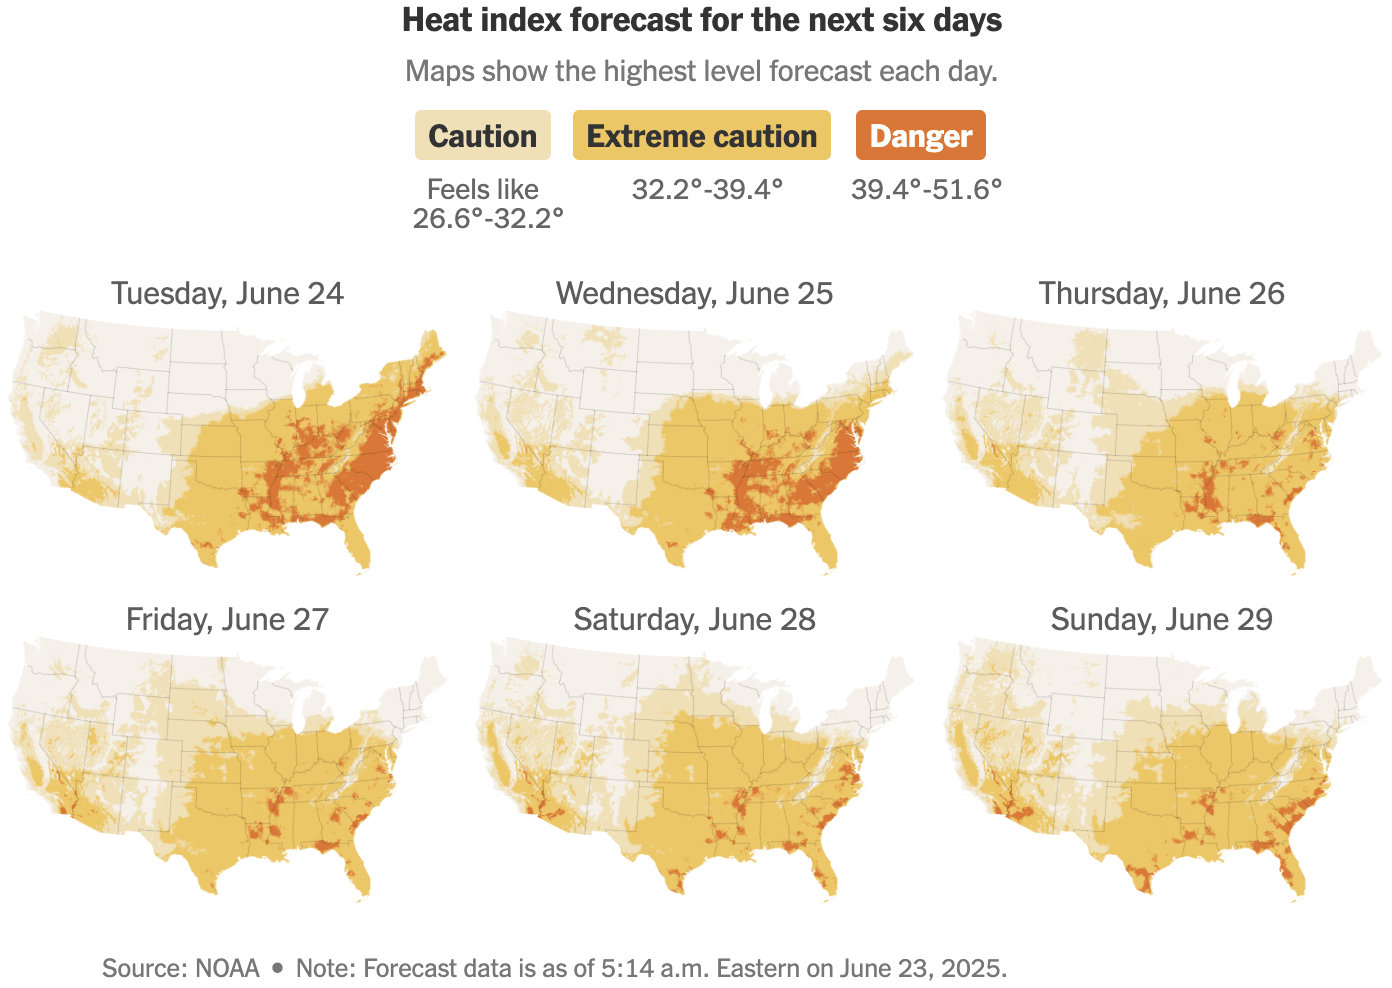
But progress with clean energy alone is not enough to stop rising temperatures — it looks like we are in for another record-breaking summer:
![Die Zeit: <a href="https://www.zeit.de/wissen/umwelt/2025-06/klimageschichte-veraenderung-temperatur-entwicklung-daten"><strong>Scrollen Sie sich durch 485 Millionen Jahre Erdgeschichte</strong></a> [<em>Scroll through 485 million years of the earth's history</em>], June 20](https://datawrapper.de/cdn-cgi/image/quality=85,width=1397,f=auto,fit=cover/https://kirby.datawrapper.de/media/pages/blog/data-vis-dispatch-june-24-2025/723fee6a85-1750690212/cleanshot-2025-06-23-at-16.49.36@2x.png)
![World Weather Attribution: "The heat above 32°C in southeast England tomorrow will be 100 times more likely due to fossil fuel-driven warming […]," June 20 (<a href="https://bsky.app/profile/wwattribution.bsky.social/post/3ls2eu37x2s2p"><strong>Bluesky</strong></a>)](https://datawrapper.de/cdn-cgi/image/quality=85,width=2220,f=auto,fit=cover/https://kirby.datawrapper.de/media/pages/blog/data-vis-dispatch-june-24-2025/36d1b83cfe-1750689357/cleanshot-2025-06-23-at-16.35.38@2x.png)
We managed to dig up two works on many people's favorite distraction, sports:
![Der Spiegel: <a href="https://www.spiegel.de/sport/fussball/klub-wm-2025-so-hoch-ist-die-belastung-der-fussball-stars-a-2b3c14ed-0e7c-4f15-91d9-9a20e21cc467"><strong>So hoch ist die Belastung der Fußballstars</strong></a> [<em>This is how much stress the soccer stars are under</em>], June 21](https://datawrapper.de/cdn-cgi/image/quality=85,width=1266,f=auto,fit=cover/https://kirby.datawrapper.de/media/pages/blog/data-vis-dispatch-june-24-2025/17dbd3c26d-1750756168/cleanshot-2025-06-24-at-11.08.58@2x.png)
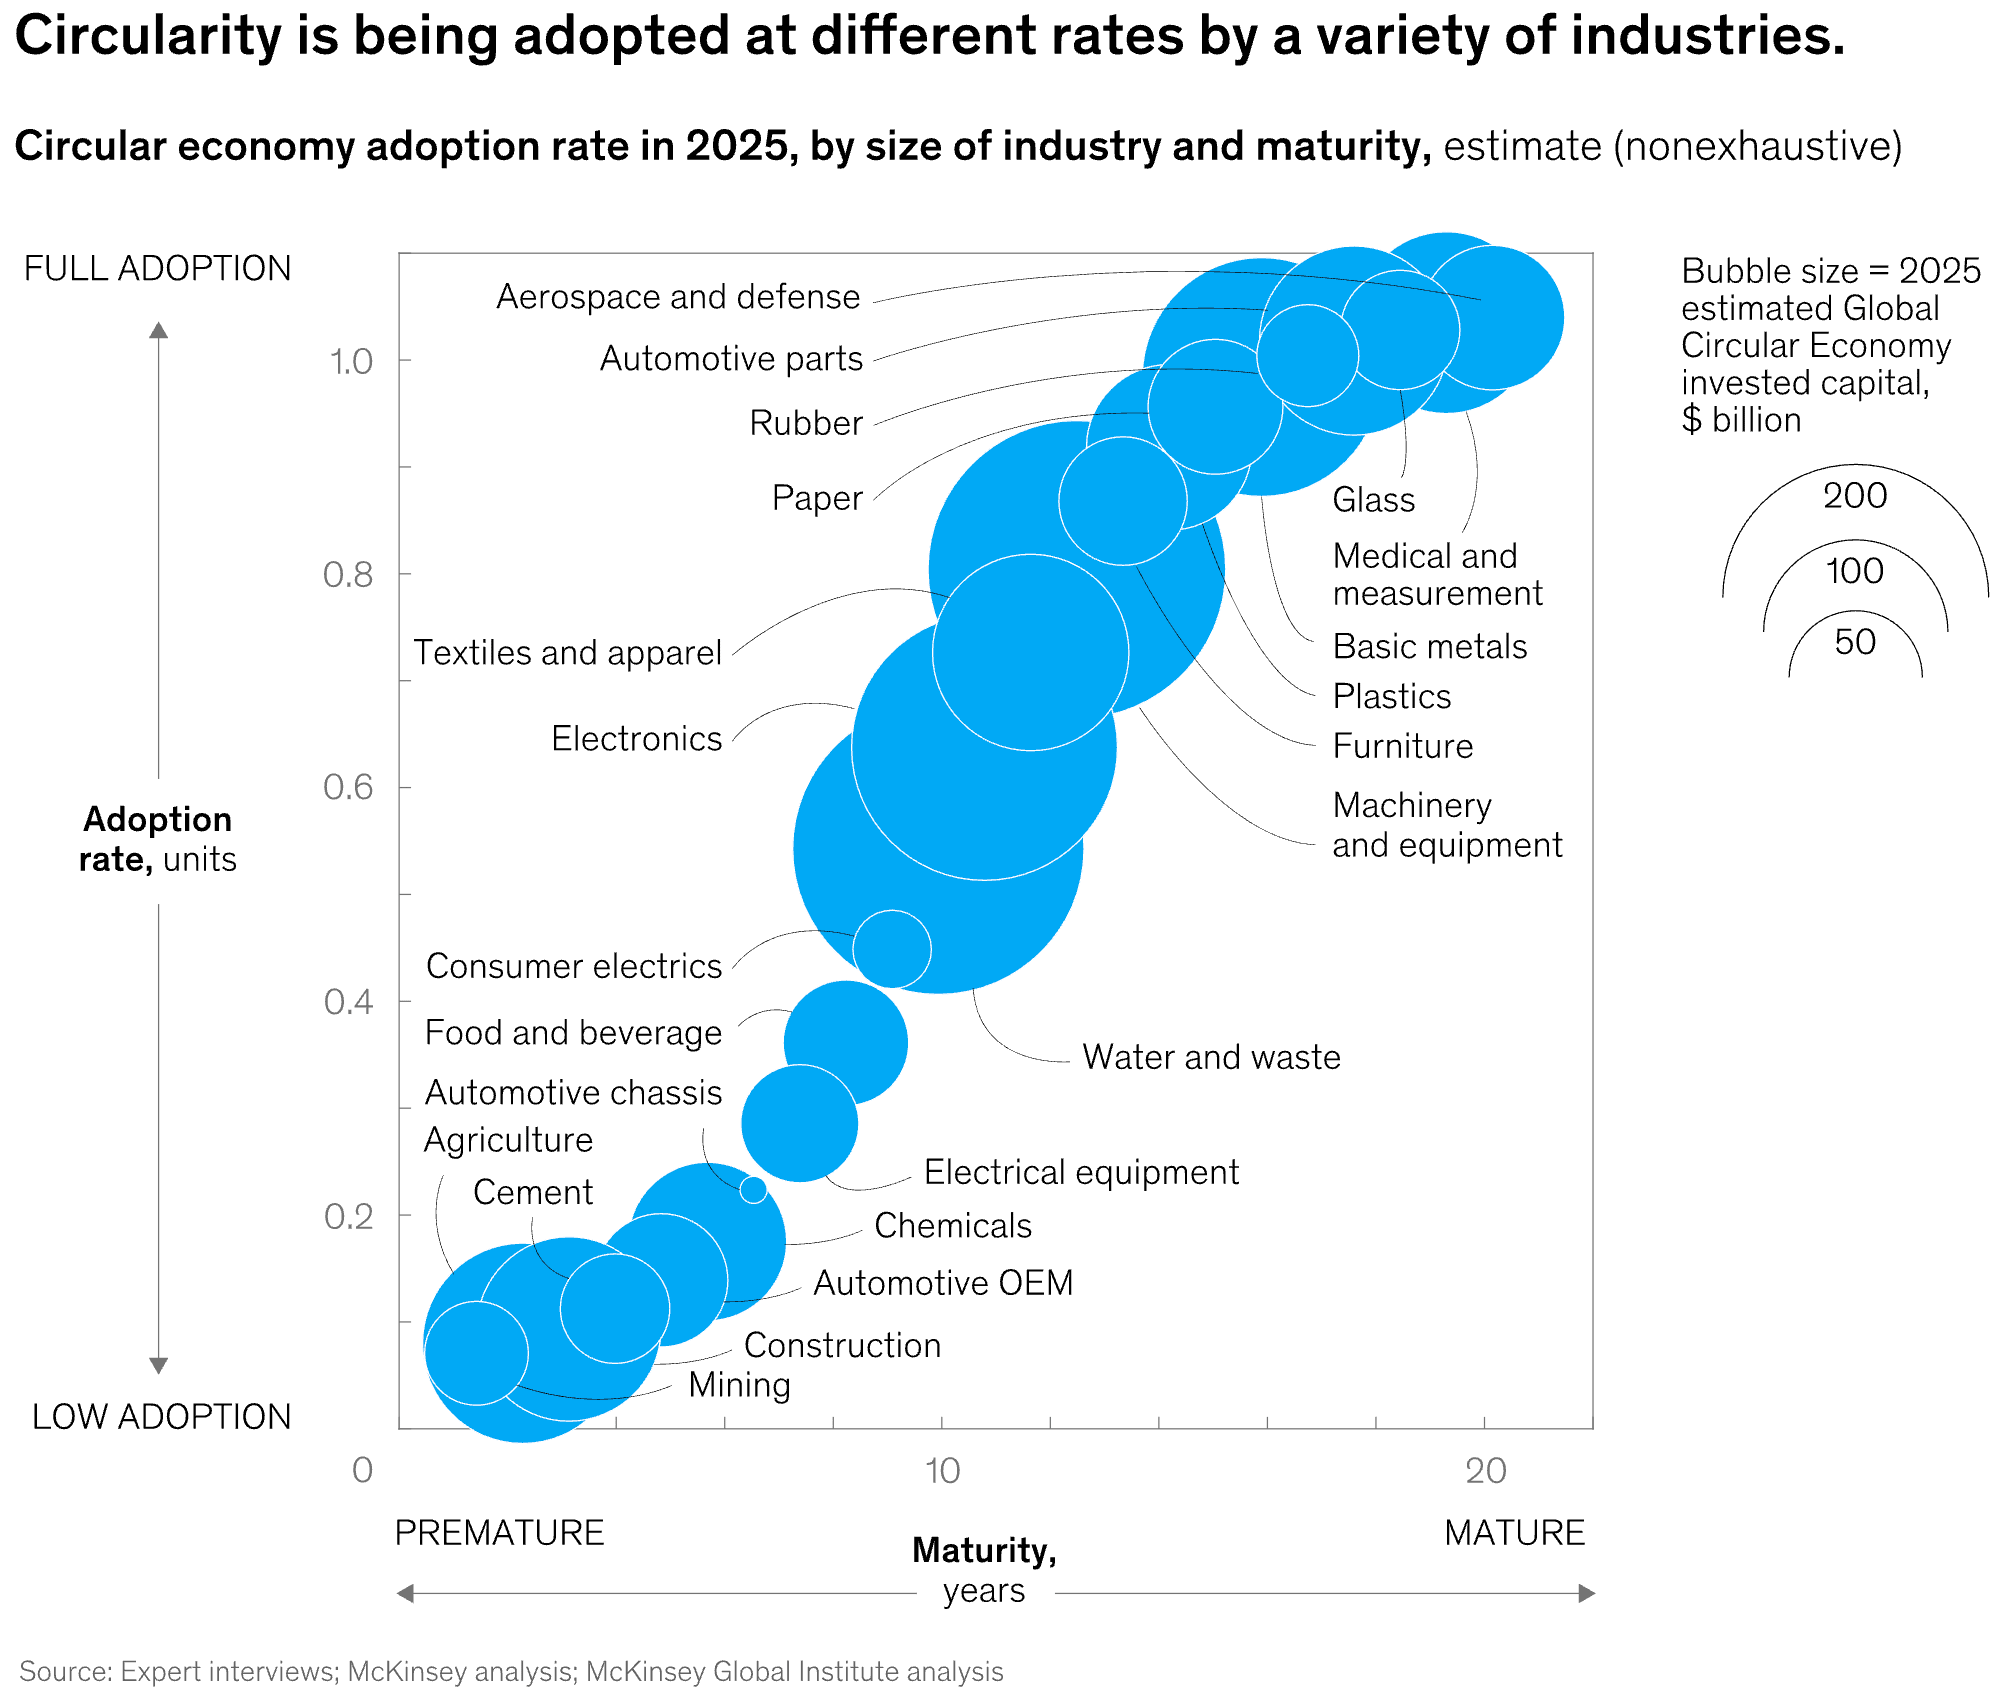
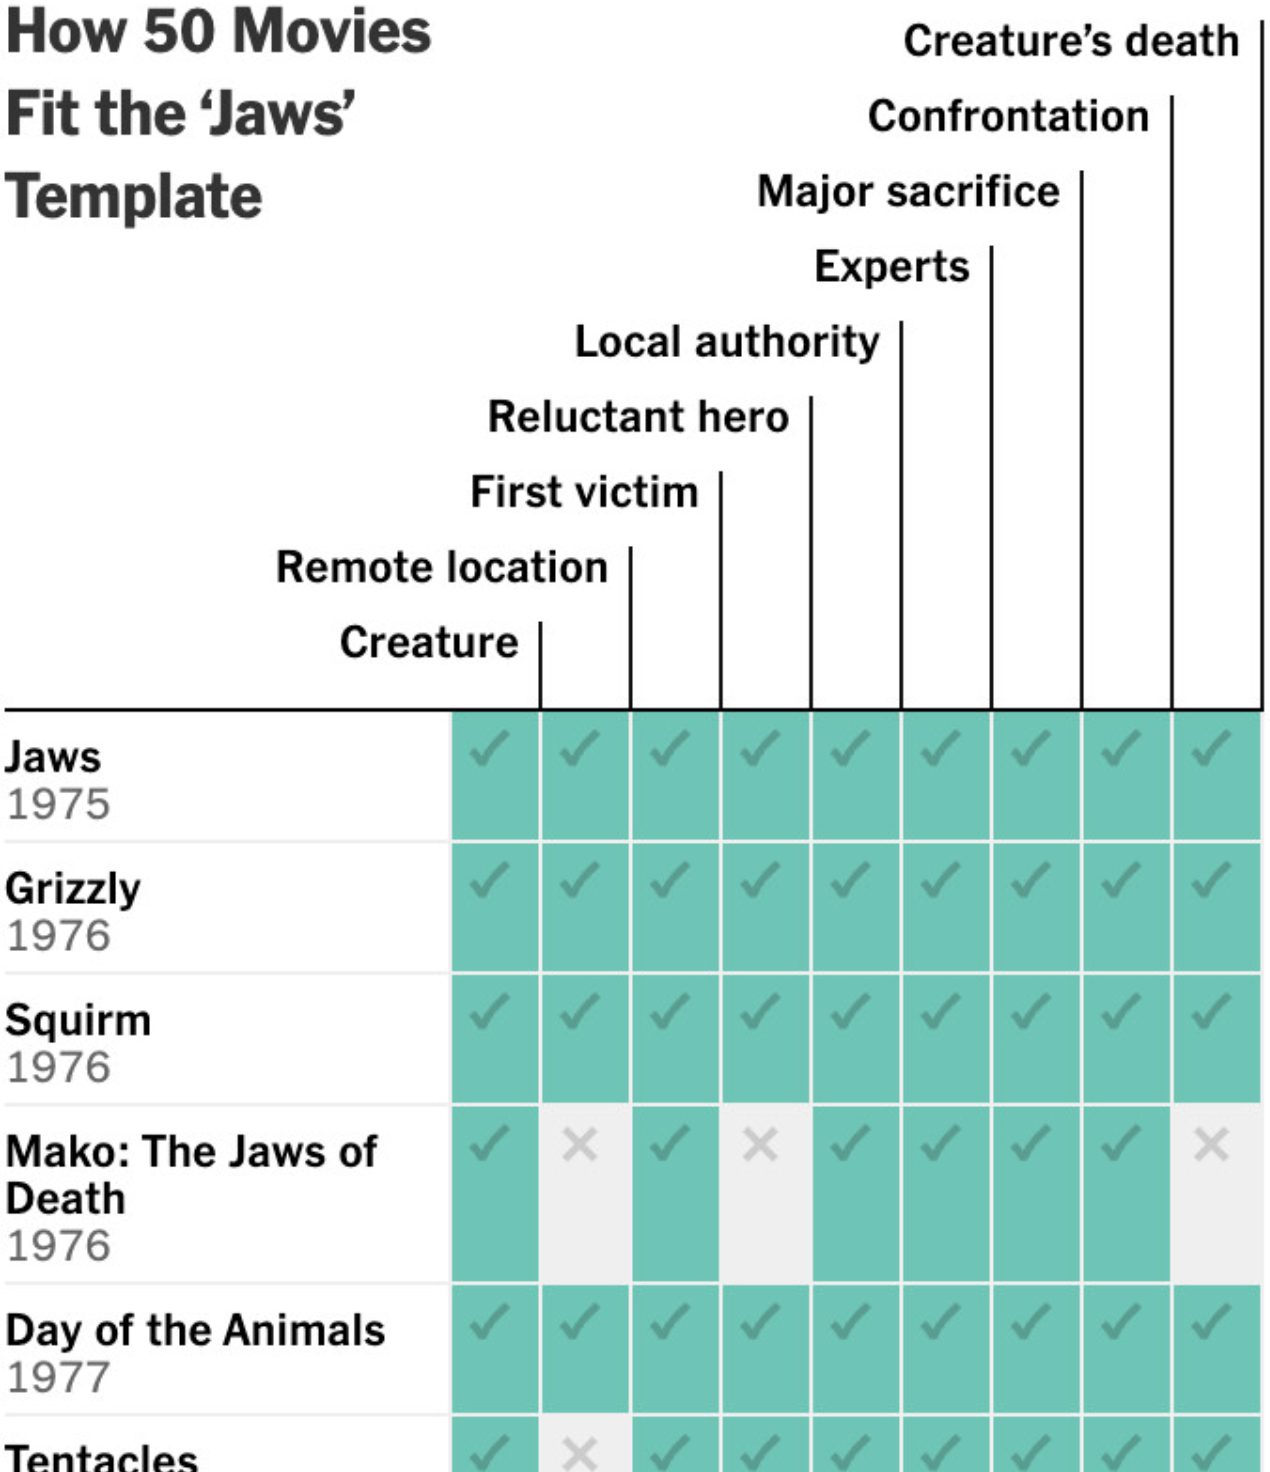
And to end this Data Vis Dispatch on a less serious note, please enjoy these works about German demography, the circular economy, and the movie Jaws:
![Marcel Pauly: "[…] how often each demographic group voted for different parties in the German federal election. This year, I’ve prepared the data as radar charts […]," June 23 (<a href="https://bsky.app/profile/marcelpauly.bsky.social/post/3lsbxc7yhi22x"><strong>Bluesky</strong></a>, <a href="https://www.spiegel.de/politik/deutschland/bundestagswahl-2025-repraesentative-wahlstatistik-zeigt-wie-friedrich-merz-die-wahl-gewonnen-hat-a-80894fc6-5cd3-4786-97c3-d3a9e88e8da2"><strong>Article</strong></a>)](https://datawrapper.de/cdn-cgi/image/quality=85,width=1314,f=auto,fit=cover/https://kirby.datawrapper.de/media/pages/blog/data-vis-dispatch-june-24-2025/f124909a18-1750753279/cleanshot-2025-06-24-at-10.20.31@2x.png)
What else we found interesting
![William Careri: "[…] An ever-growing library of personal and independent blogs and newsletters dedicated to data visualization," June 20 (<a href="https://bsky.app/profile/wcareri.com/post/3ls2earrrds2g"><strong>Bluesky</strong></a>, <a href="https://vizdexproject.com/"><strong>Tool</strong></a>) <span class="badge">Good resource</span>](https://datawrapper.de/cdn-cgi/image/quality=85,width=2370,f=auto,fit=cover/https://kirby.datawrapper.de/media/pages/blog/data-vis-dispatch-june-24-2025/a5a0d2b8d9-1750766162/cleanshot-2025-06-24-at-13.55.44@2x.png)
Applications are still open for…
A design principal at Clever Franke
A graphics/multimedia editor at The New York Times
A DC data reporter at The New York Times
Help us make this dispatch better! We’d love to hear which newsletters, blogs, or social media accounts we need to follow to learn about interesting projects, especially from less-covered parts of the world (Asia, South America, Africa). Write us at hello@datawrapper.de or leave a comment below. Want the Dispatch in your inbox every Tuesday? Sign up for our Blog Update newsletter!


