Data Vis Dispatch, January 6: Venezuela, New Year's resolutions, and 2025 assessments

Welcome back to the 226th edition of the Data Vis Dispatch, once again in its regular format after several weeks of special editions. We are looking forward to a year full of exciting and well-crafted visualizations! Every week, we’ll be publishing a collection of the best small and large data visualizations we find, especially from news organizations — to celebrate data journalism, data visualization, simple charts, elaborate maps, and their creators.
Recurring topics this week include the capture of Maduro in Venezuela, hopeful and tragic retrospectives on 2025, as well as resolutions for 2026.
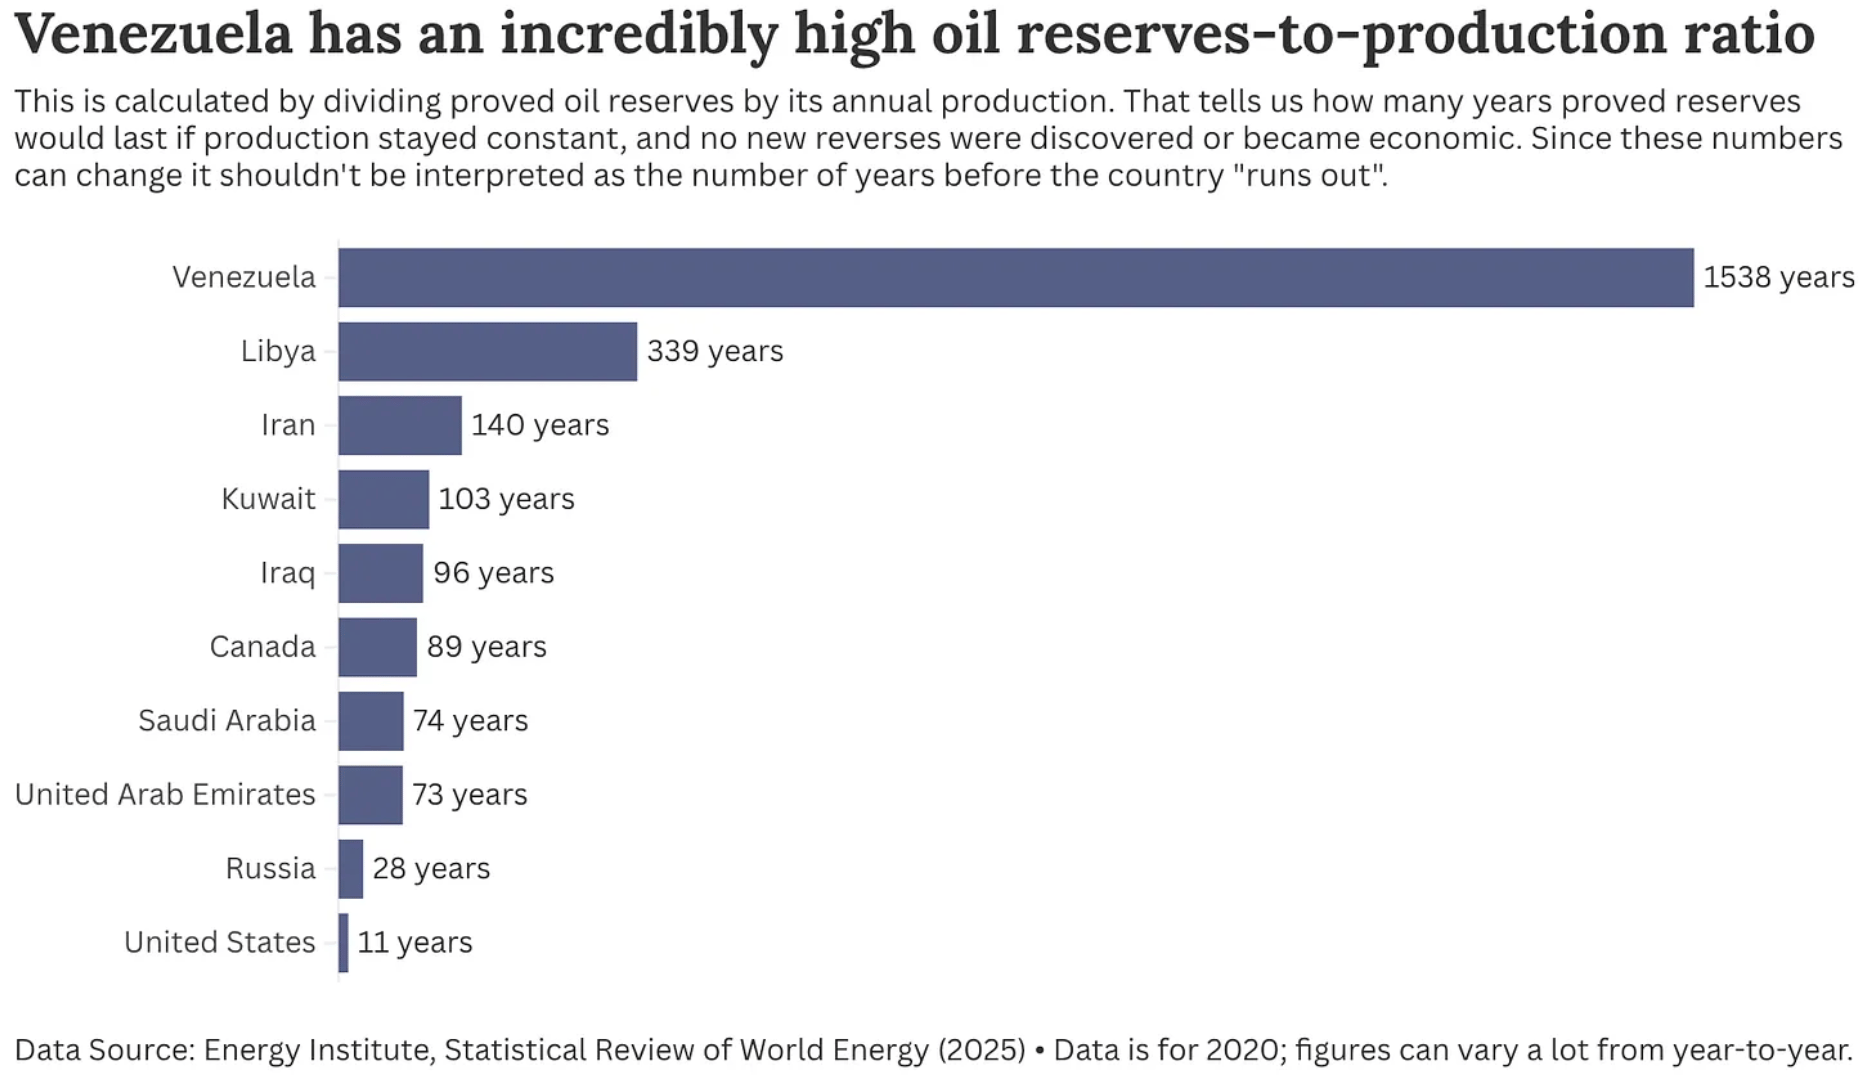
Over the weekend, the United States bombed Venezuela and captured the president, Nicolás Maduro. The operation has prompted widespread debate about its legality, future implications, and the role of oil, which appears to be a central motive in the attack. Visualizations documented the key moments of the attack and capture, as well as the preceding U.S. military buildup.
![DIE ZEIT: <a href="https://www.zeit.de/politik/ausland/2026-01/us-angriff-venezuela-rekonstruktion-militaer-festnahme-nicolas-maduro"><strong>Wie die USA Nicolás Maduro entführten</strong></a><strong> </strong>[<em>Chart description: </em>Aircraft and warships are targeting military objectives in and around the capital, Caracas.], January 4](https://datawrapper.de/cdn-cgi/image/quality=85,width=1474,f=auto,fit=cover/https://kirby.datawrapper.de/media/pages/blog/data-vis-dispatch-january-6-2026/273a3454d4-1767642154/cleanshot-2026-01-05-at-20.40.55@2x.png)

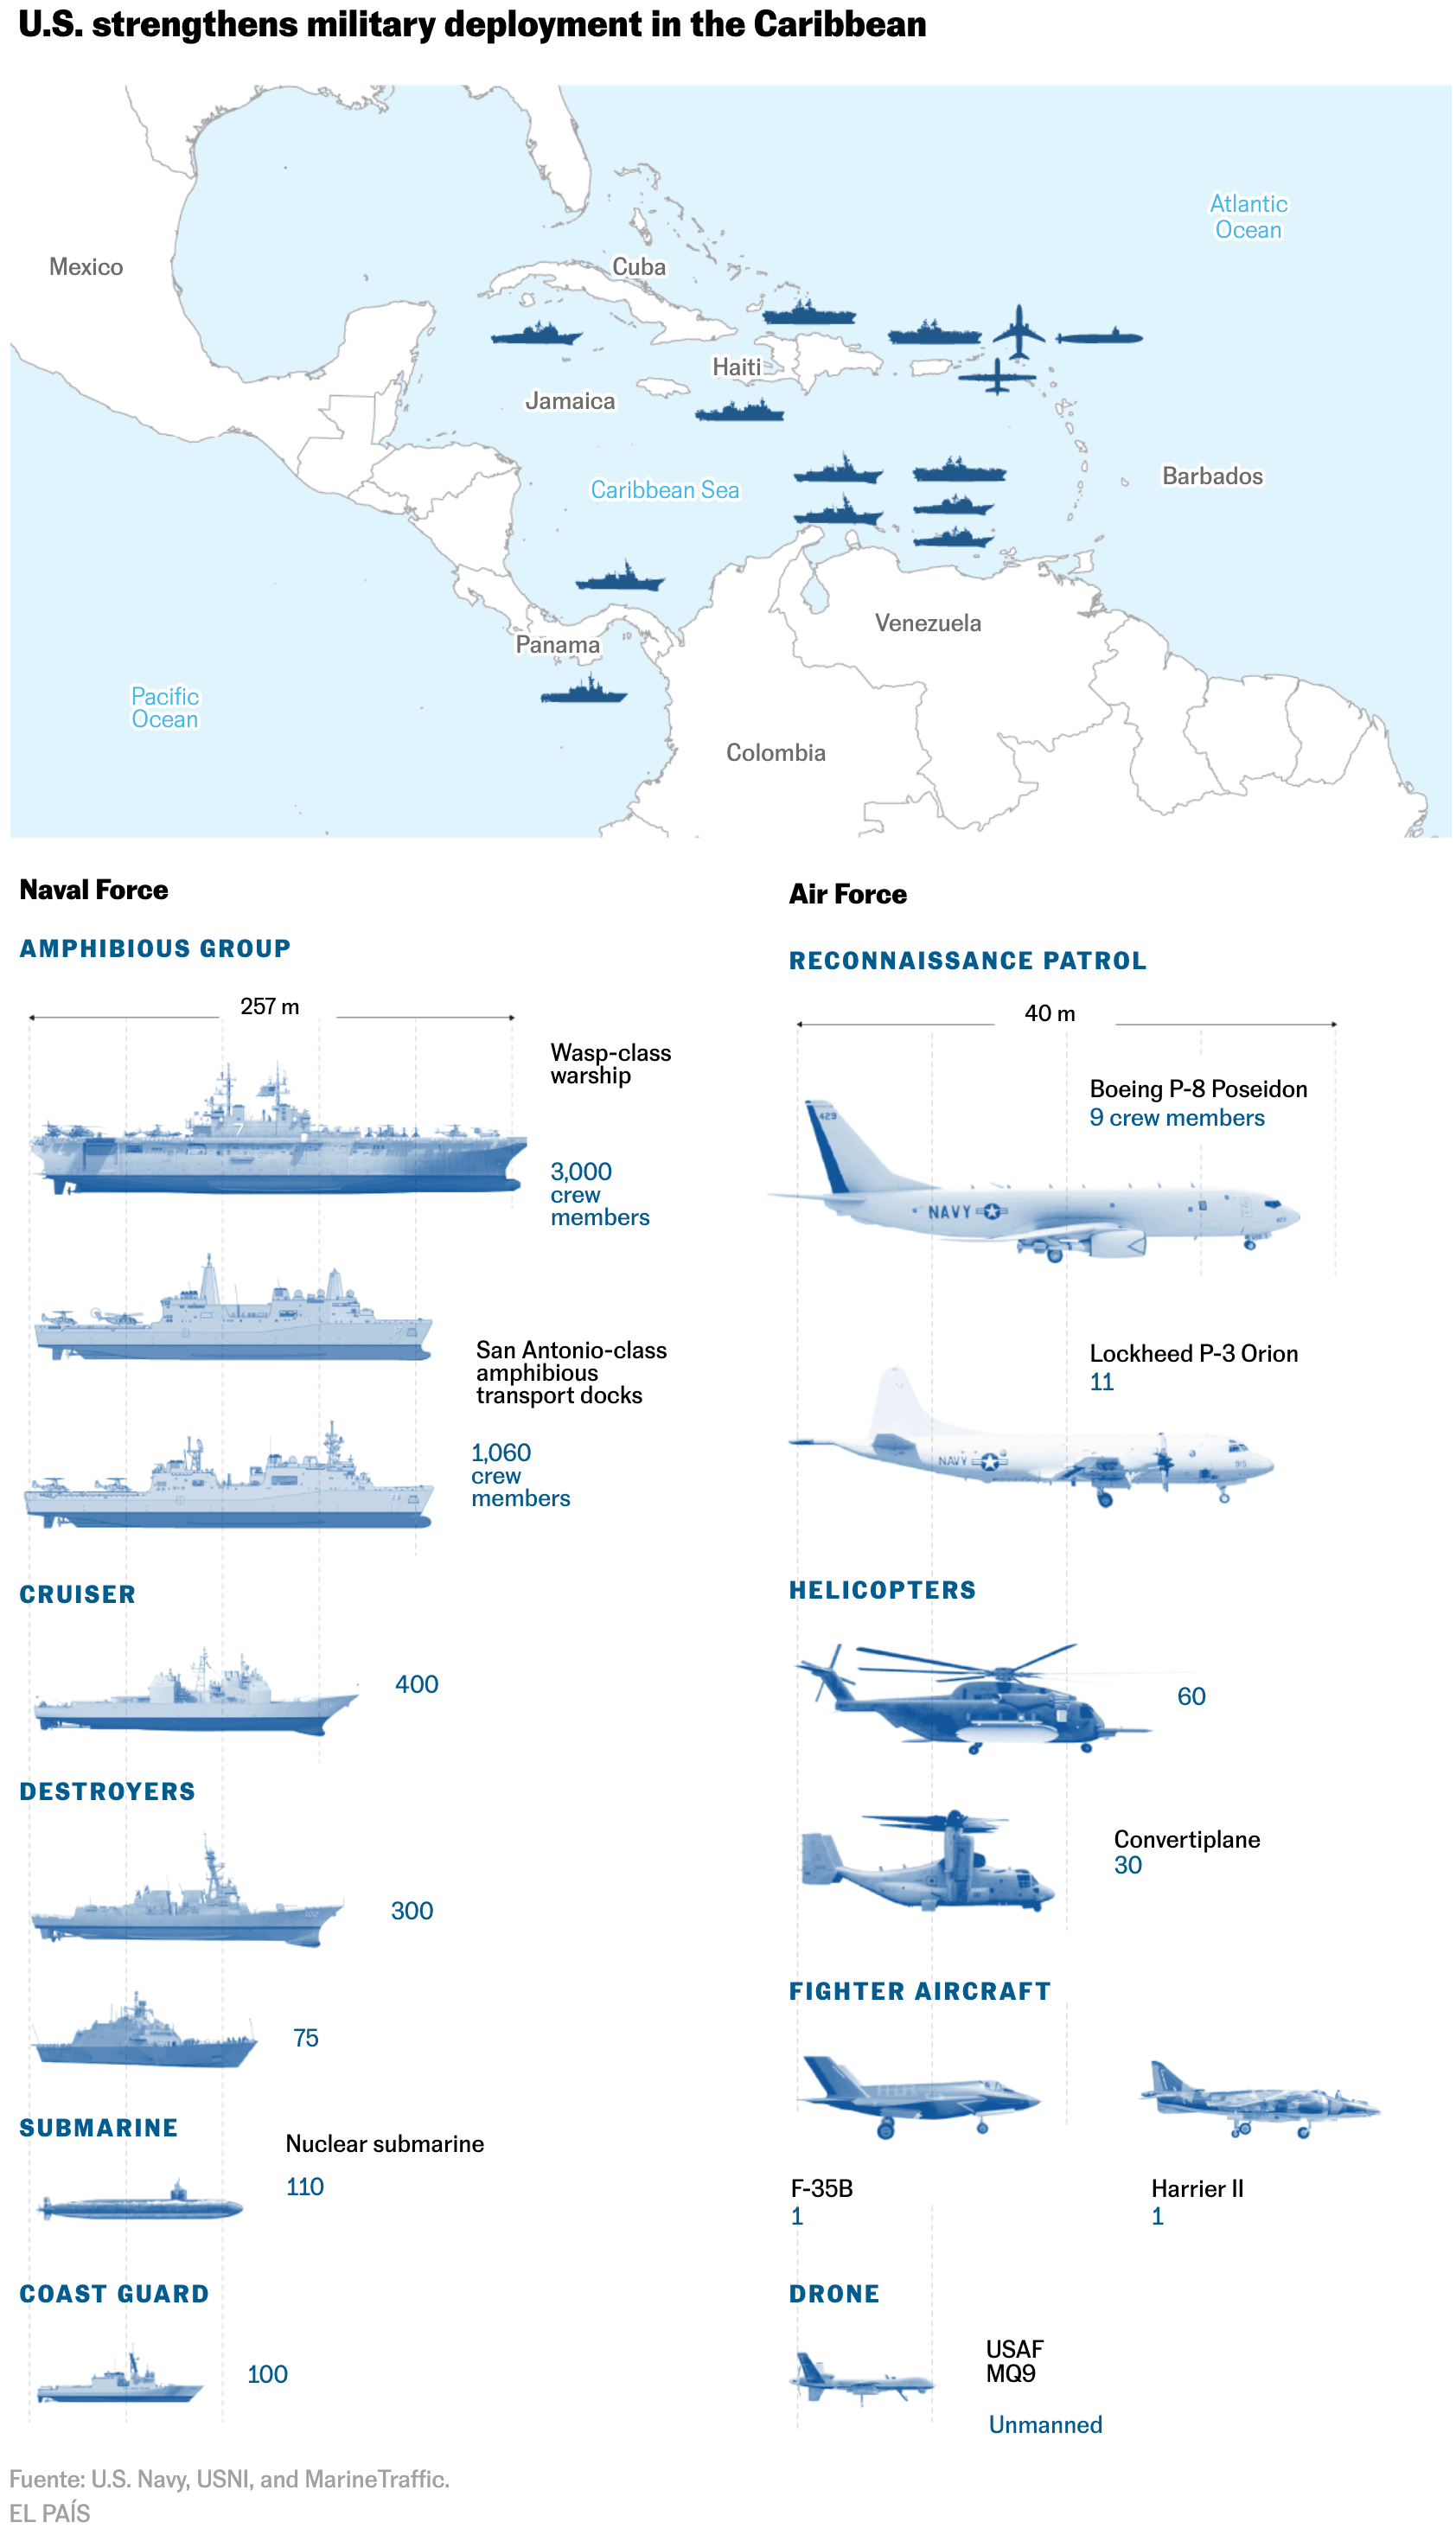
![El Diario Sur: <a href="https://www.diariosur.es/internacional/america-latina/imponente-despliegue-militar-norteamericano-mejor-superportaaviones-10000-20260103094854-ntrc.html"><strong>Así es el imponente despliegue militar norteamericano: su mejor superportaaviones y 10.000 soldados en el Caribe</strong></a> [<em>This is the impressive American military deployment: its best supercarrier and 10,000 soldiers in the Caribbean</em>], January 3](https://datawrapper.de/cdn-cgi/image/quality=85,width=2336,f=auto,fit=cover/https://kirby.datawrapper.de/media/pages/blog/data-vis-dispatch-january-6-2026/26b50c492b-1767703785/cleanshot-2026-01-06-at-13.49.09@2x.png)
![Radio y Televisión Española:<a href="https://www.rtve.es/noticias/20260106/petroleo-ataque-eeuu-venezuela-mercado/16882758.shtml"> <strong>El papel del petróleo en el ataque de EE.UU. a Venezuela: todo lo que puede pasar ahora, negro sobre blanco </strong></a>[<em>Chart title: Destinations of Venezuelan oil</em>], January 6](https://datawrapper.de/cdn-cgi/image/quality=85,width=1578,f=auto,fit=cover/https://kirby.datawrapper.de/media/pages/blog/data-vis-dispatch-january-6-2026/2191e33761-1767702954/cleanshot-2026-01-06-at-13.34.04@2x.png)
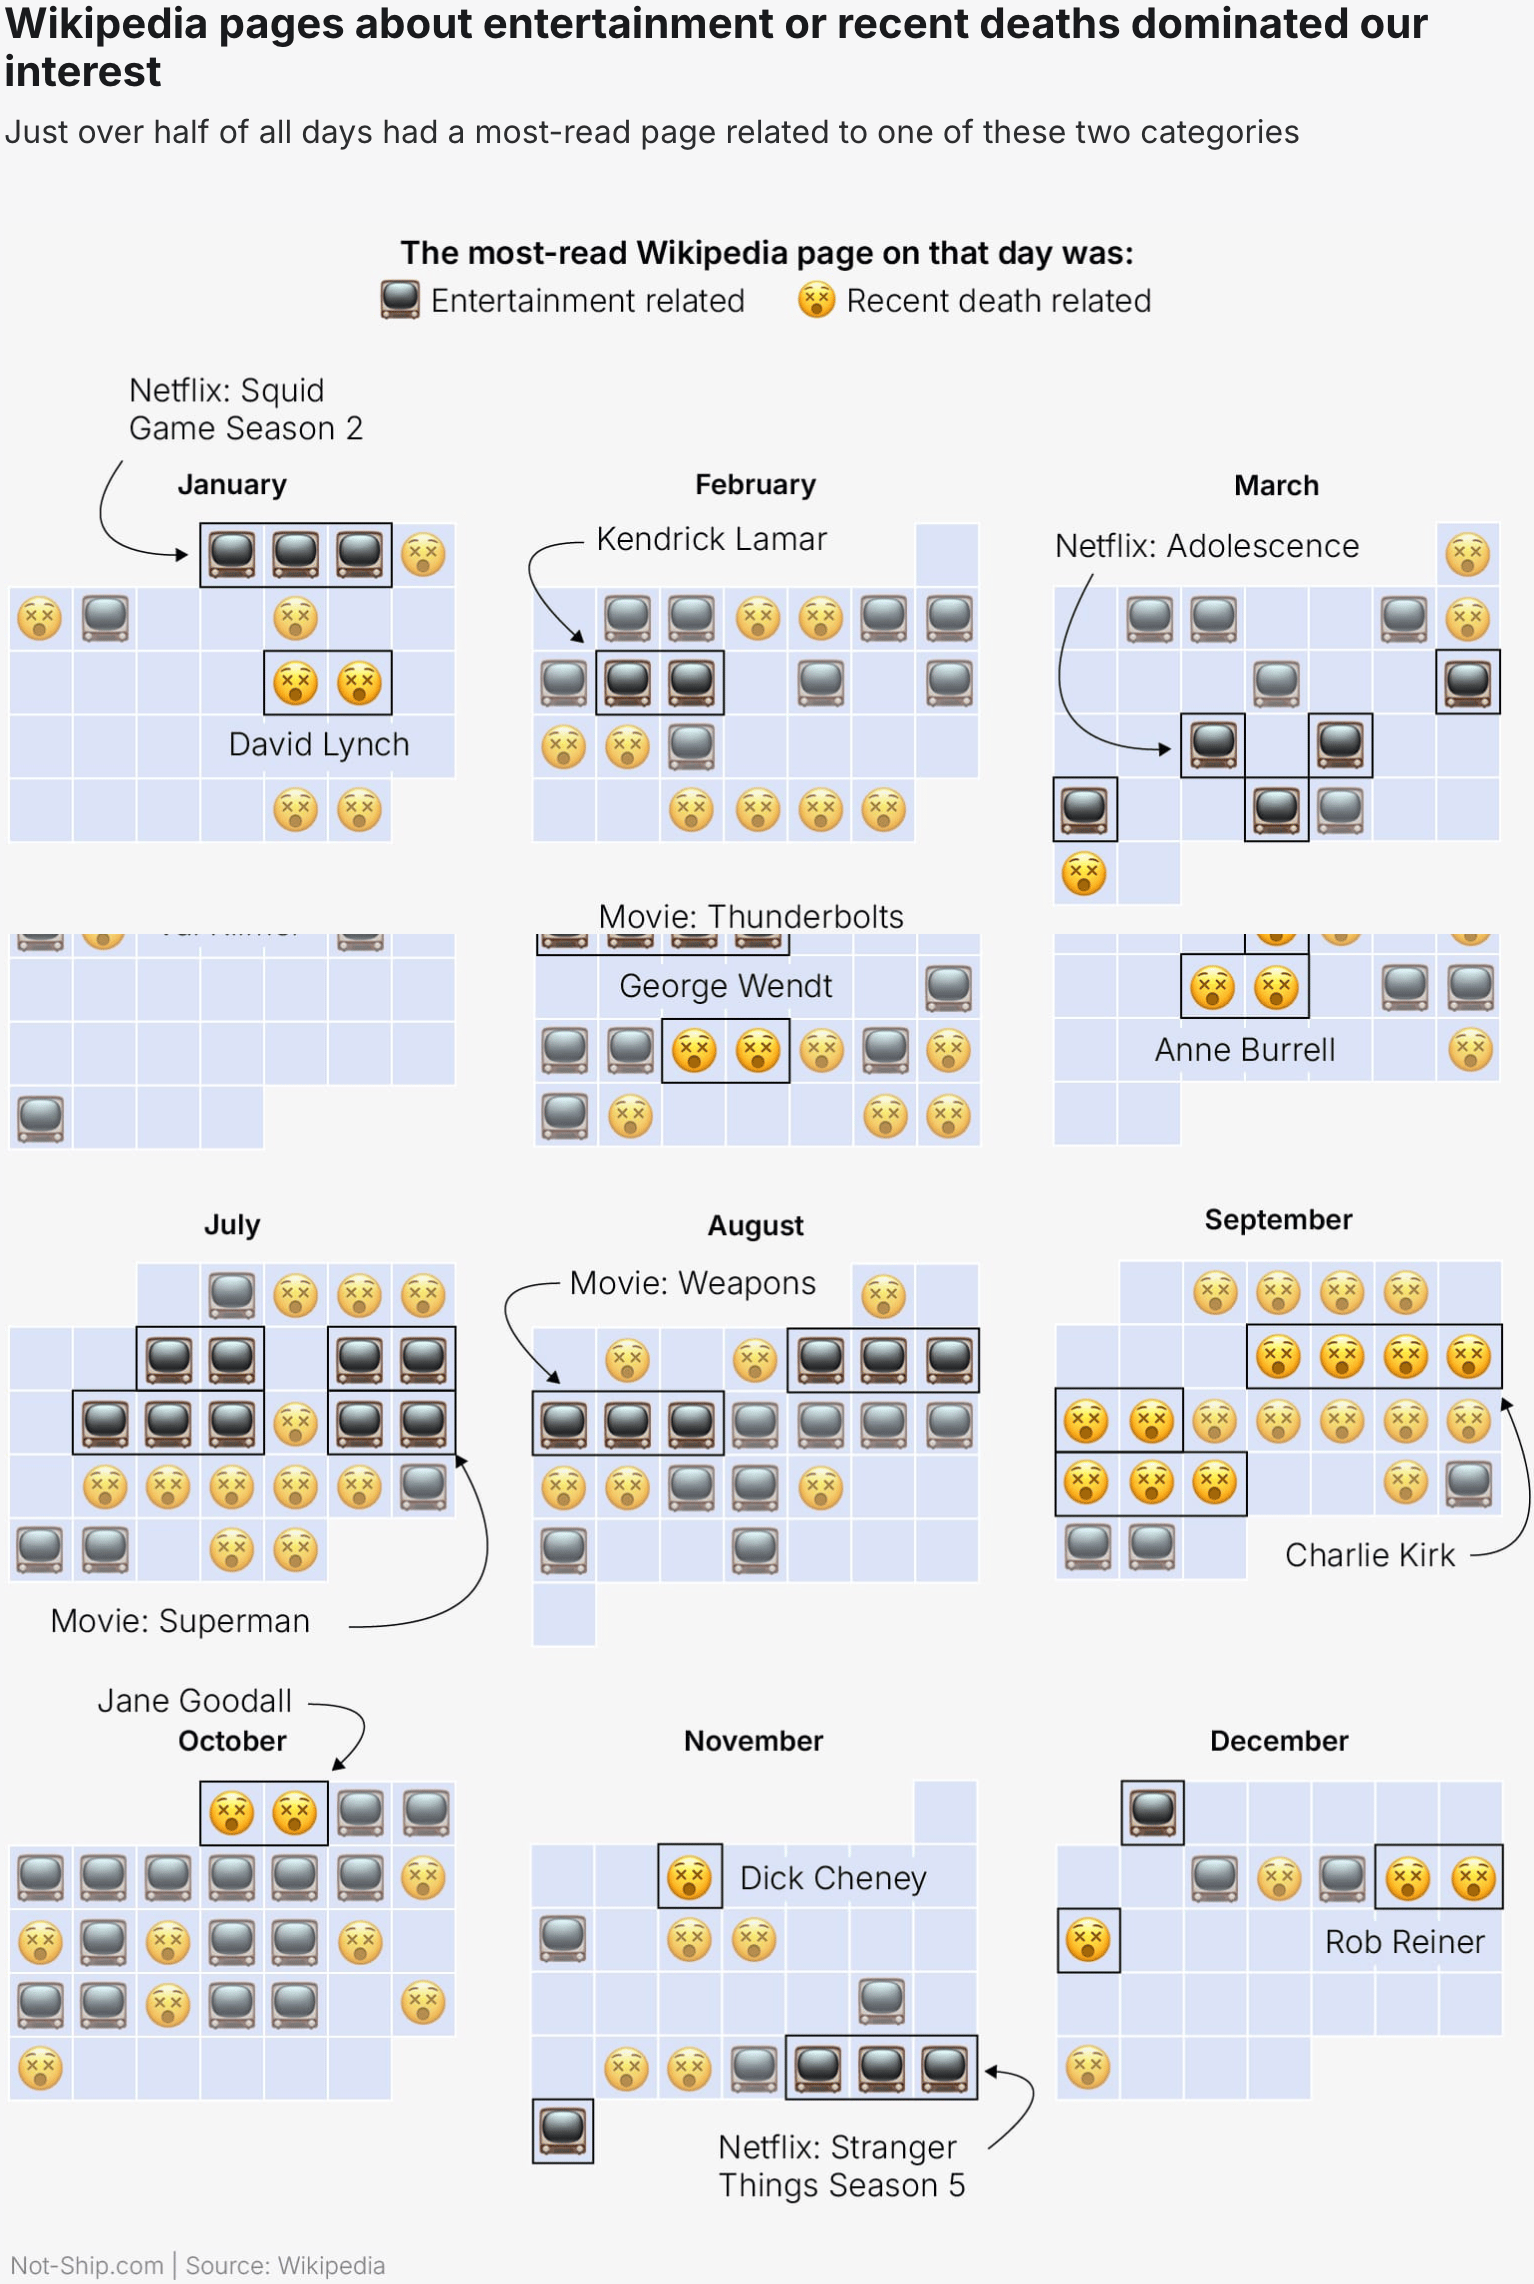
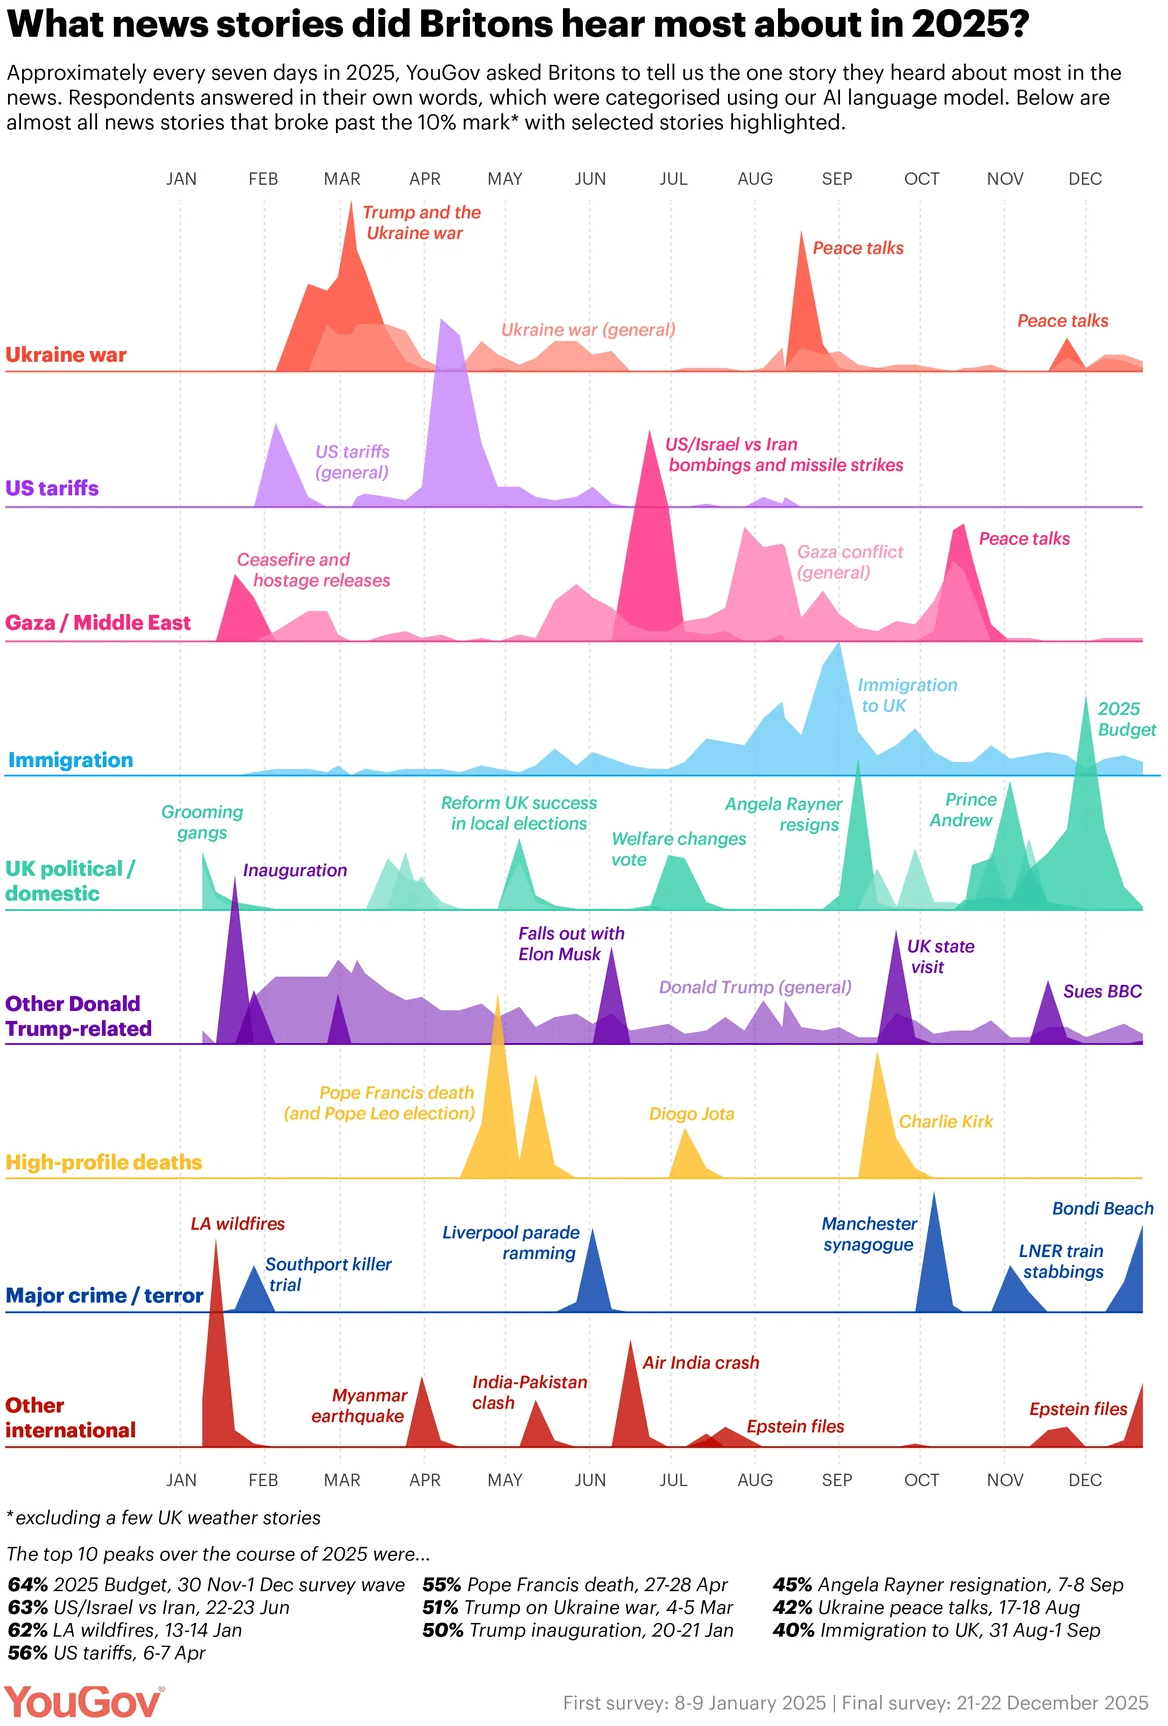
At the start of 2026, a plethora of visualizations reflecting on 2025 were released. Among them were assessments of media and search trends from the past year.
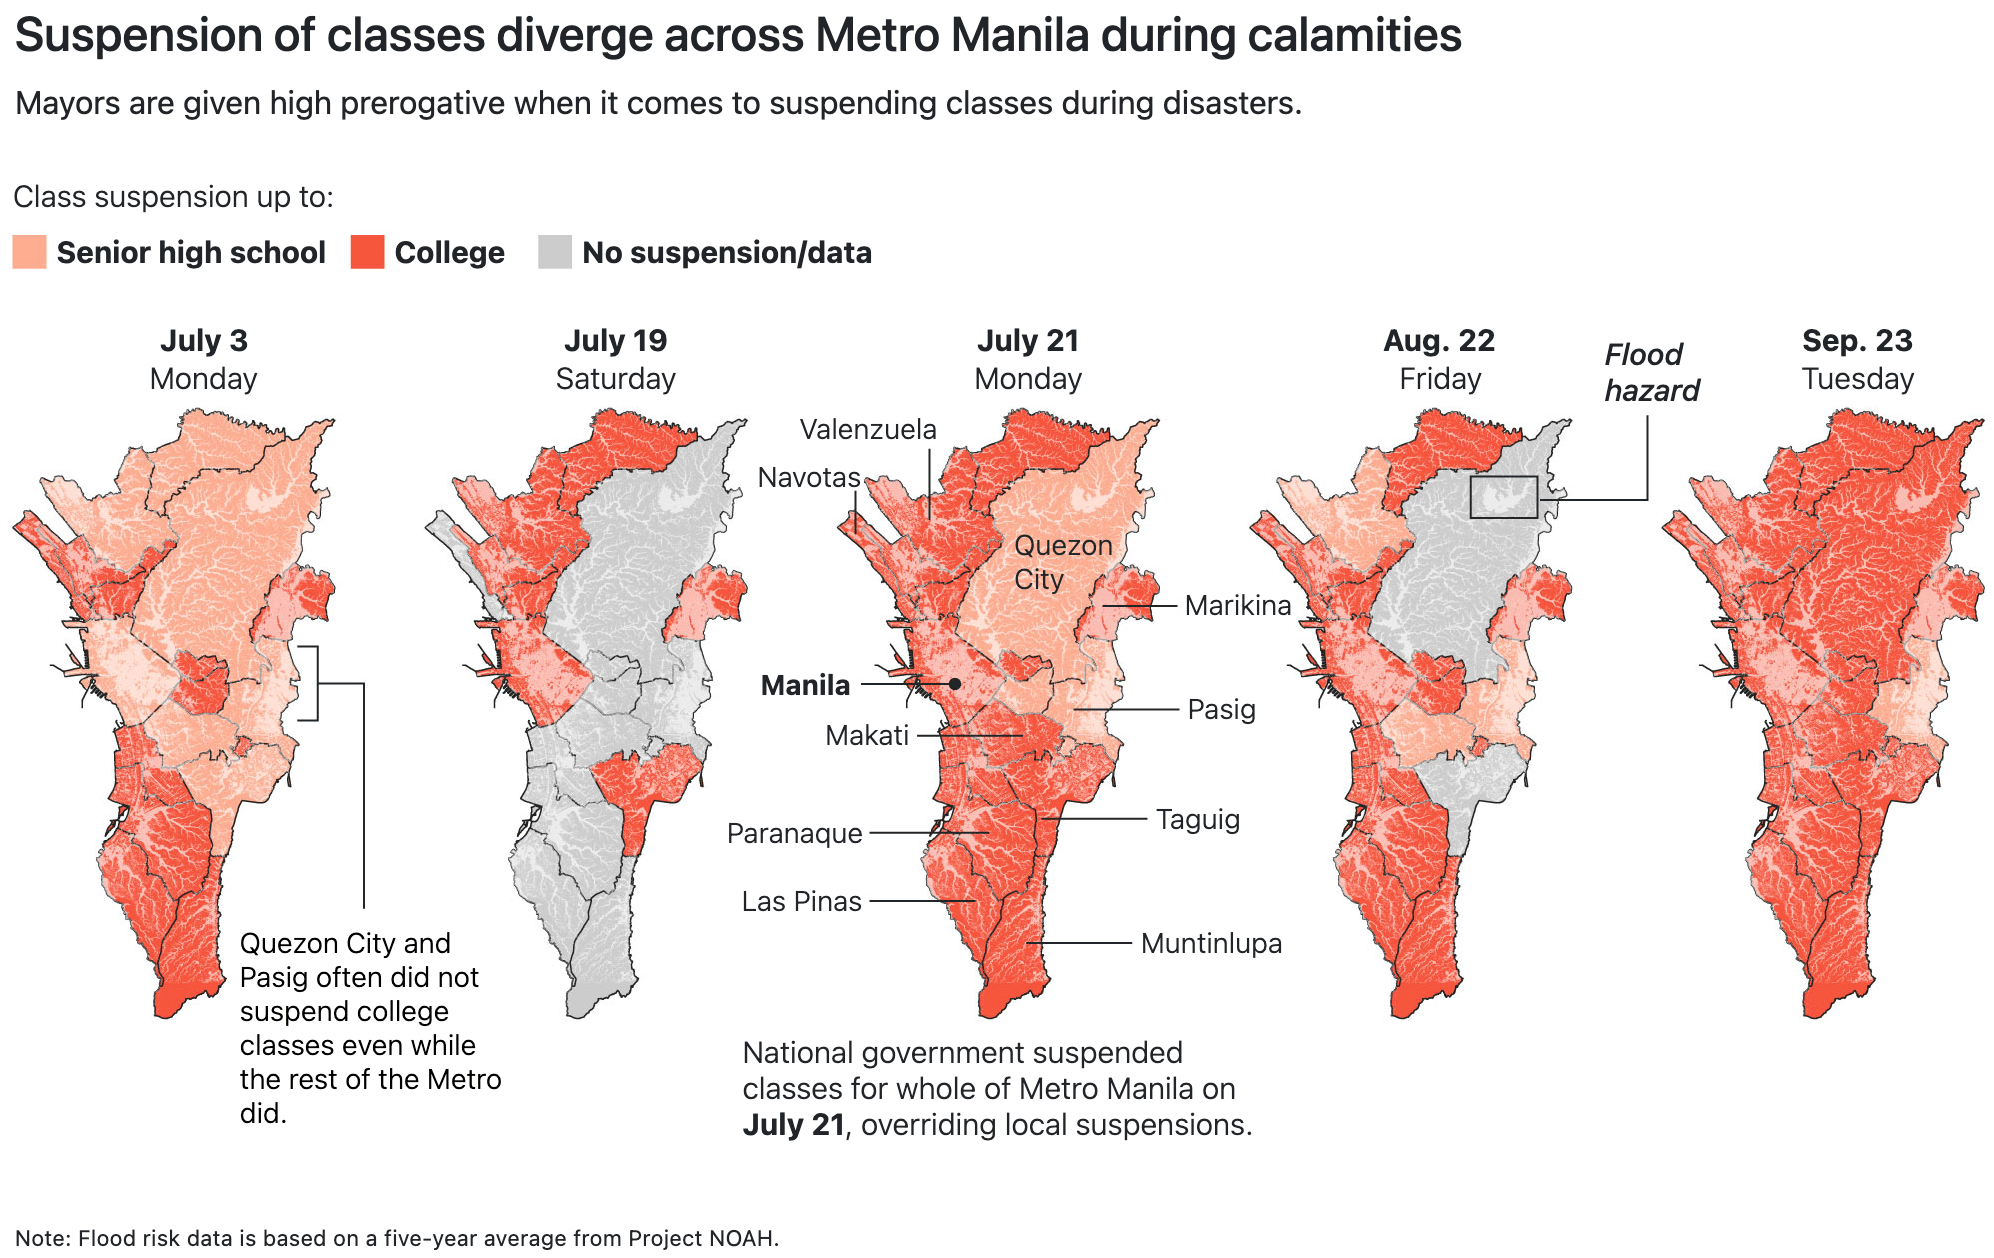
Other visualizations ultimately summarized the continuous tragedies of 2025: from the ongoing destruction in Gaza to deaths in the United States Immigration and Customs Enforcement (ICE) and the growing number of class suspensions in the Philippines due to natural disasters.


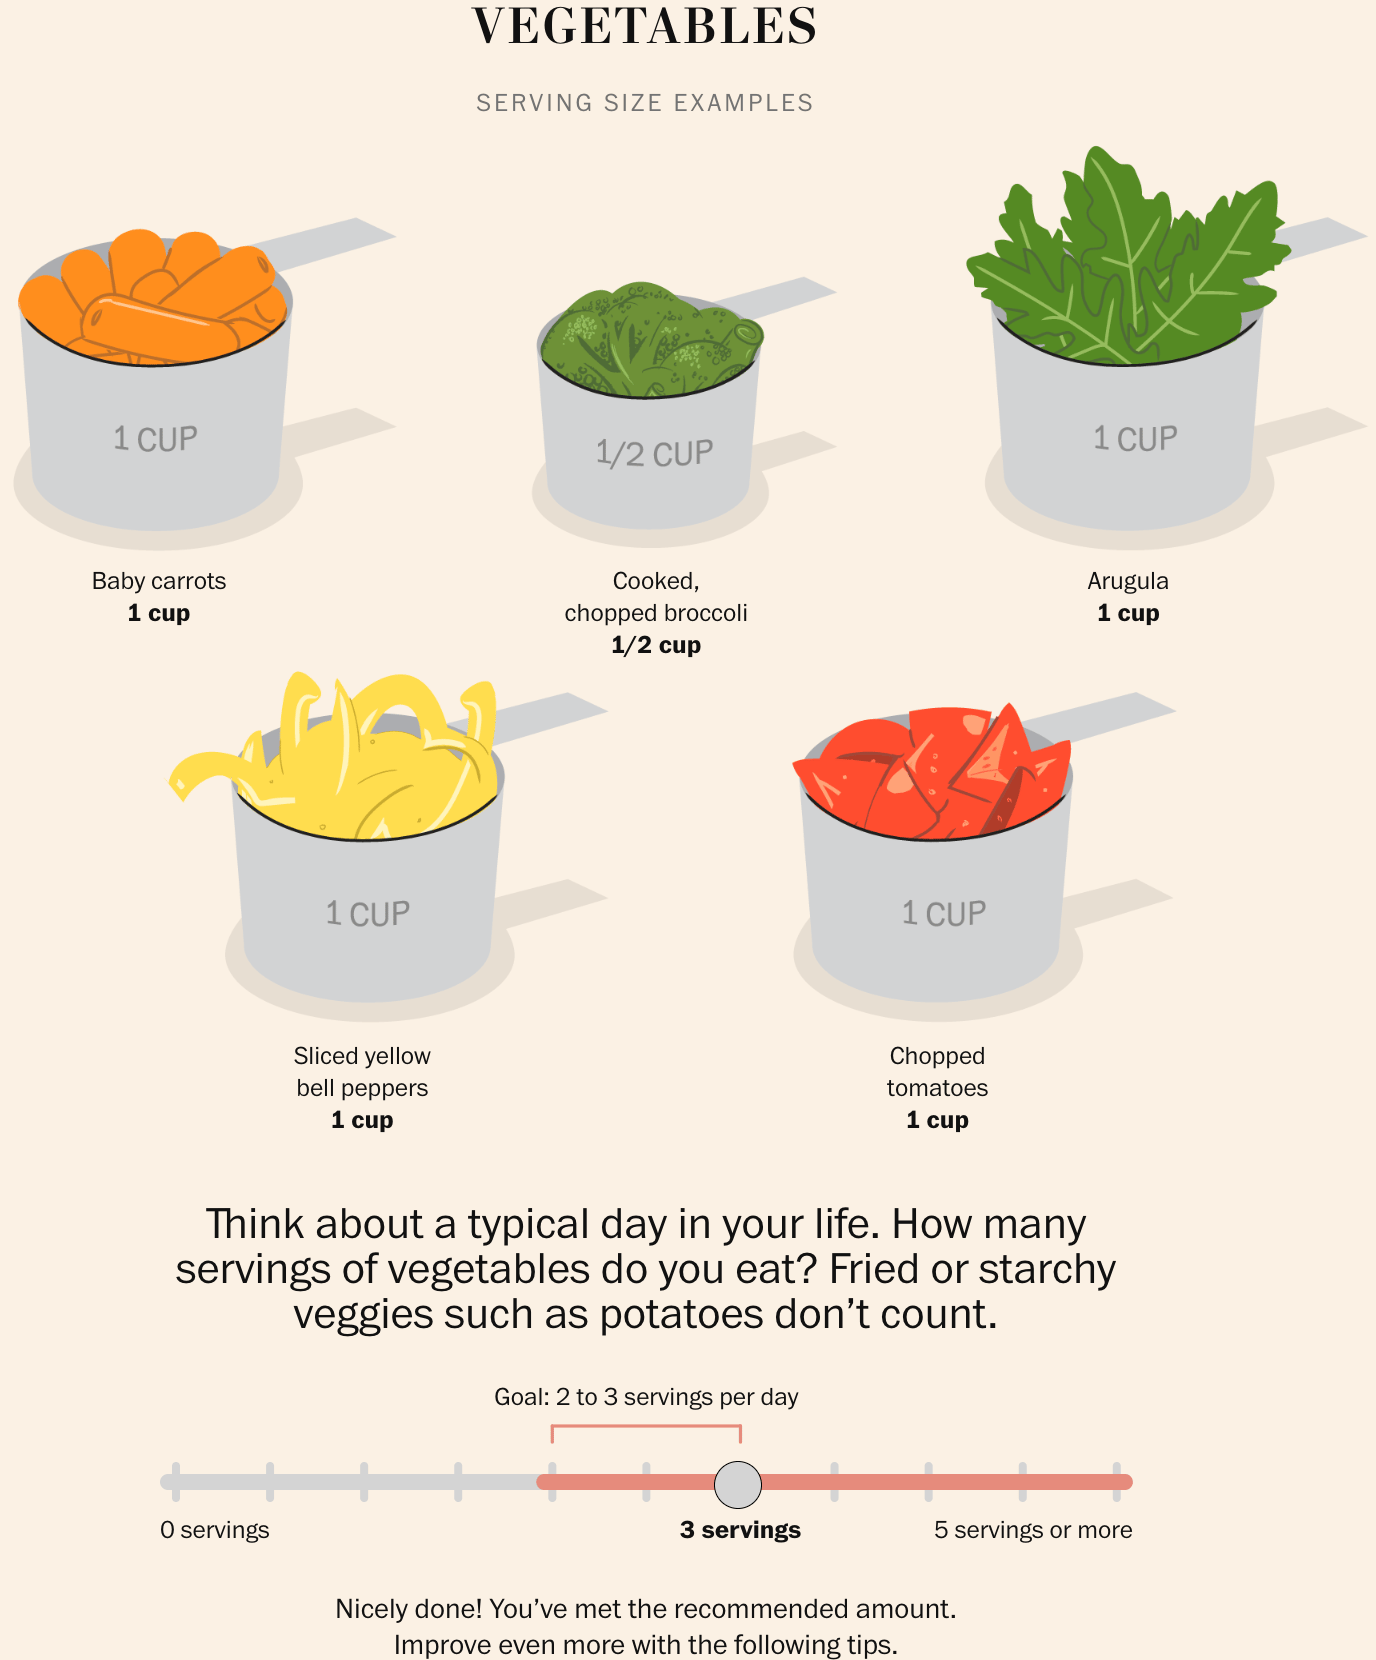
However, there are also visualizations about 2025 that allow us to look hopefully toward 2026.


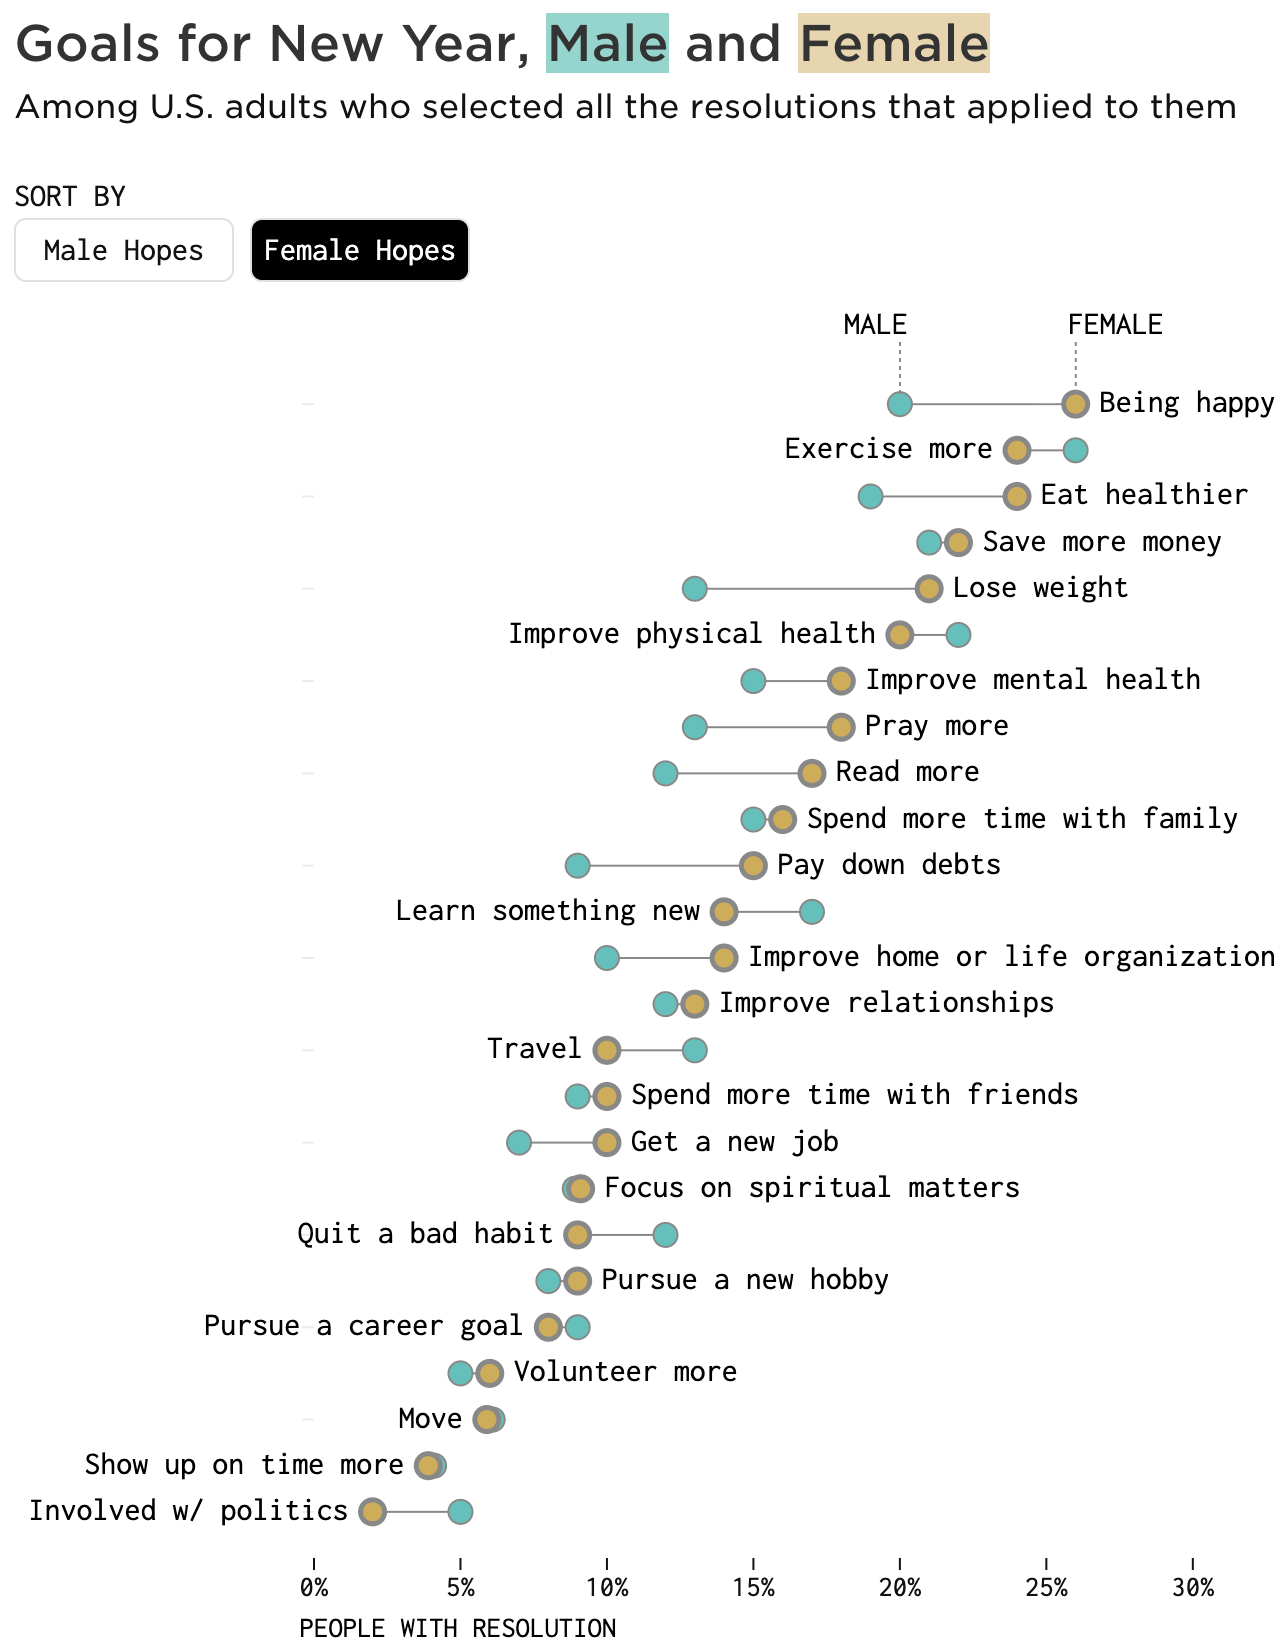
Of course, the new year brings new resolutions, and the classics are back: eating healthily, saving money, and exercising.

Donald Trump and his associates were mapped using circular charts. As were overweight animals in the United Kingdom.
![El Mundo: <a href="https://www.elmundo.es/internacional/2025/12/31/69525edd21efa04c4e8b4586.html"><strong>El clan Trump: un emporio insaciable con ínfulas de familia real</strong></a> [<em>The Trump clan: an insatiable empire with delusions of grandeur</em>], December 31](https://datawrapper.de/cdn-cgi/image/quality=85,width=1846,f=auto,fit=cover/https://kirby.datawrapper.de/media/pages/blog/data-vis-dispatch-january-6-2026/8d75d2d893-1767704317/cleanshot-2026-01-06-at-13.57.31@2x.png)


What else we found interesting

Applications are open for…
A cartographic design intern at Esri Creative Lab
A graphics reporter (deleted data project) at The Guardian
A data storyteller at Kontinentalist


