Data Vis Dispatch, August 18: Data art, low water levels, and 😂

Welcome back to the 258th edition of Data Vis Dispatch! Every week, we’re publishing a collection of the best small and large data visualizations we find, especially from news organizations — to celebrate data journalism, data visualization, simple charts, elaborate maps, and their creators.
Recurring topics this week include data art, low water levels, charts on (mental) health, and the 😂 emoji.
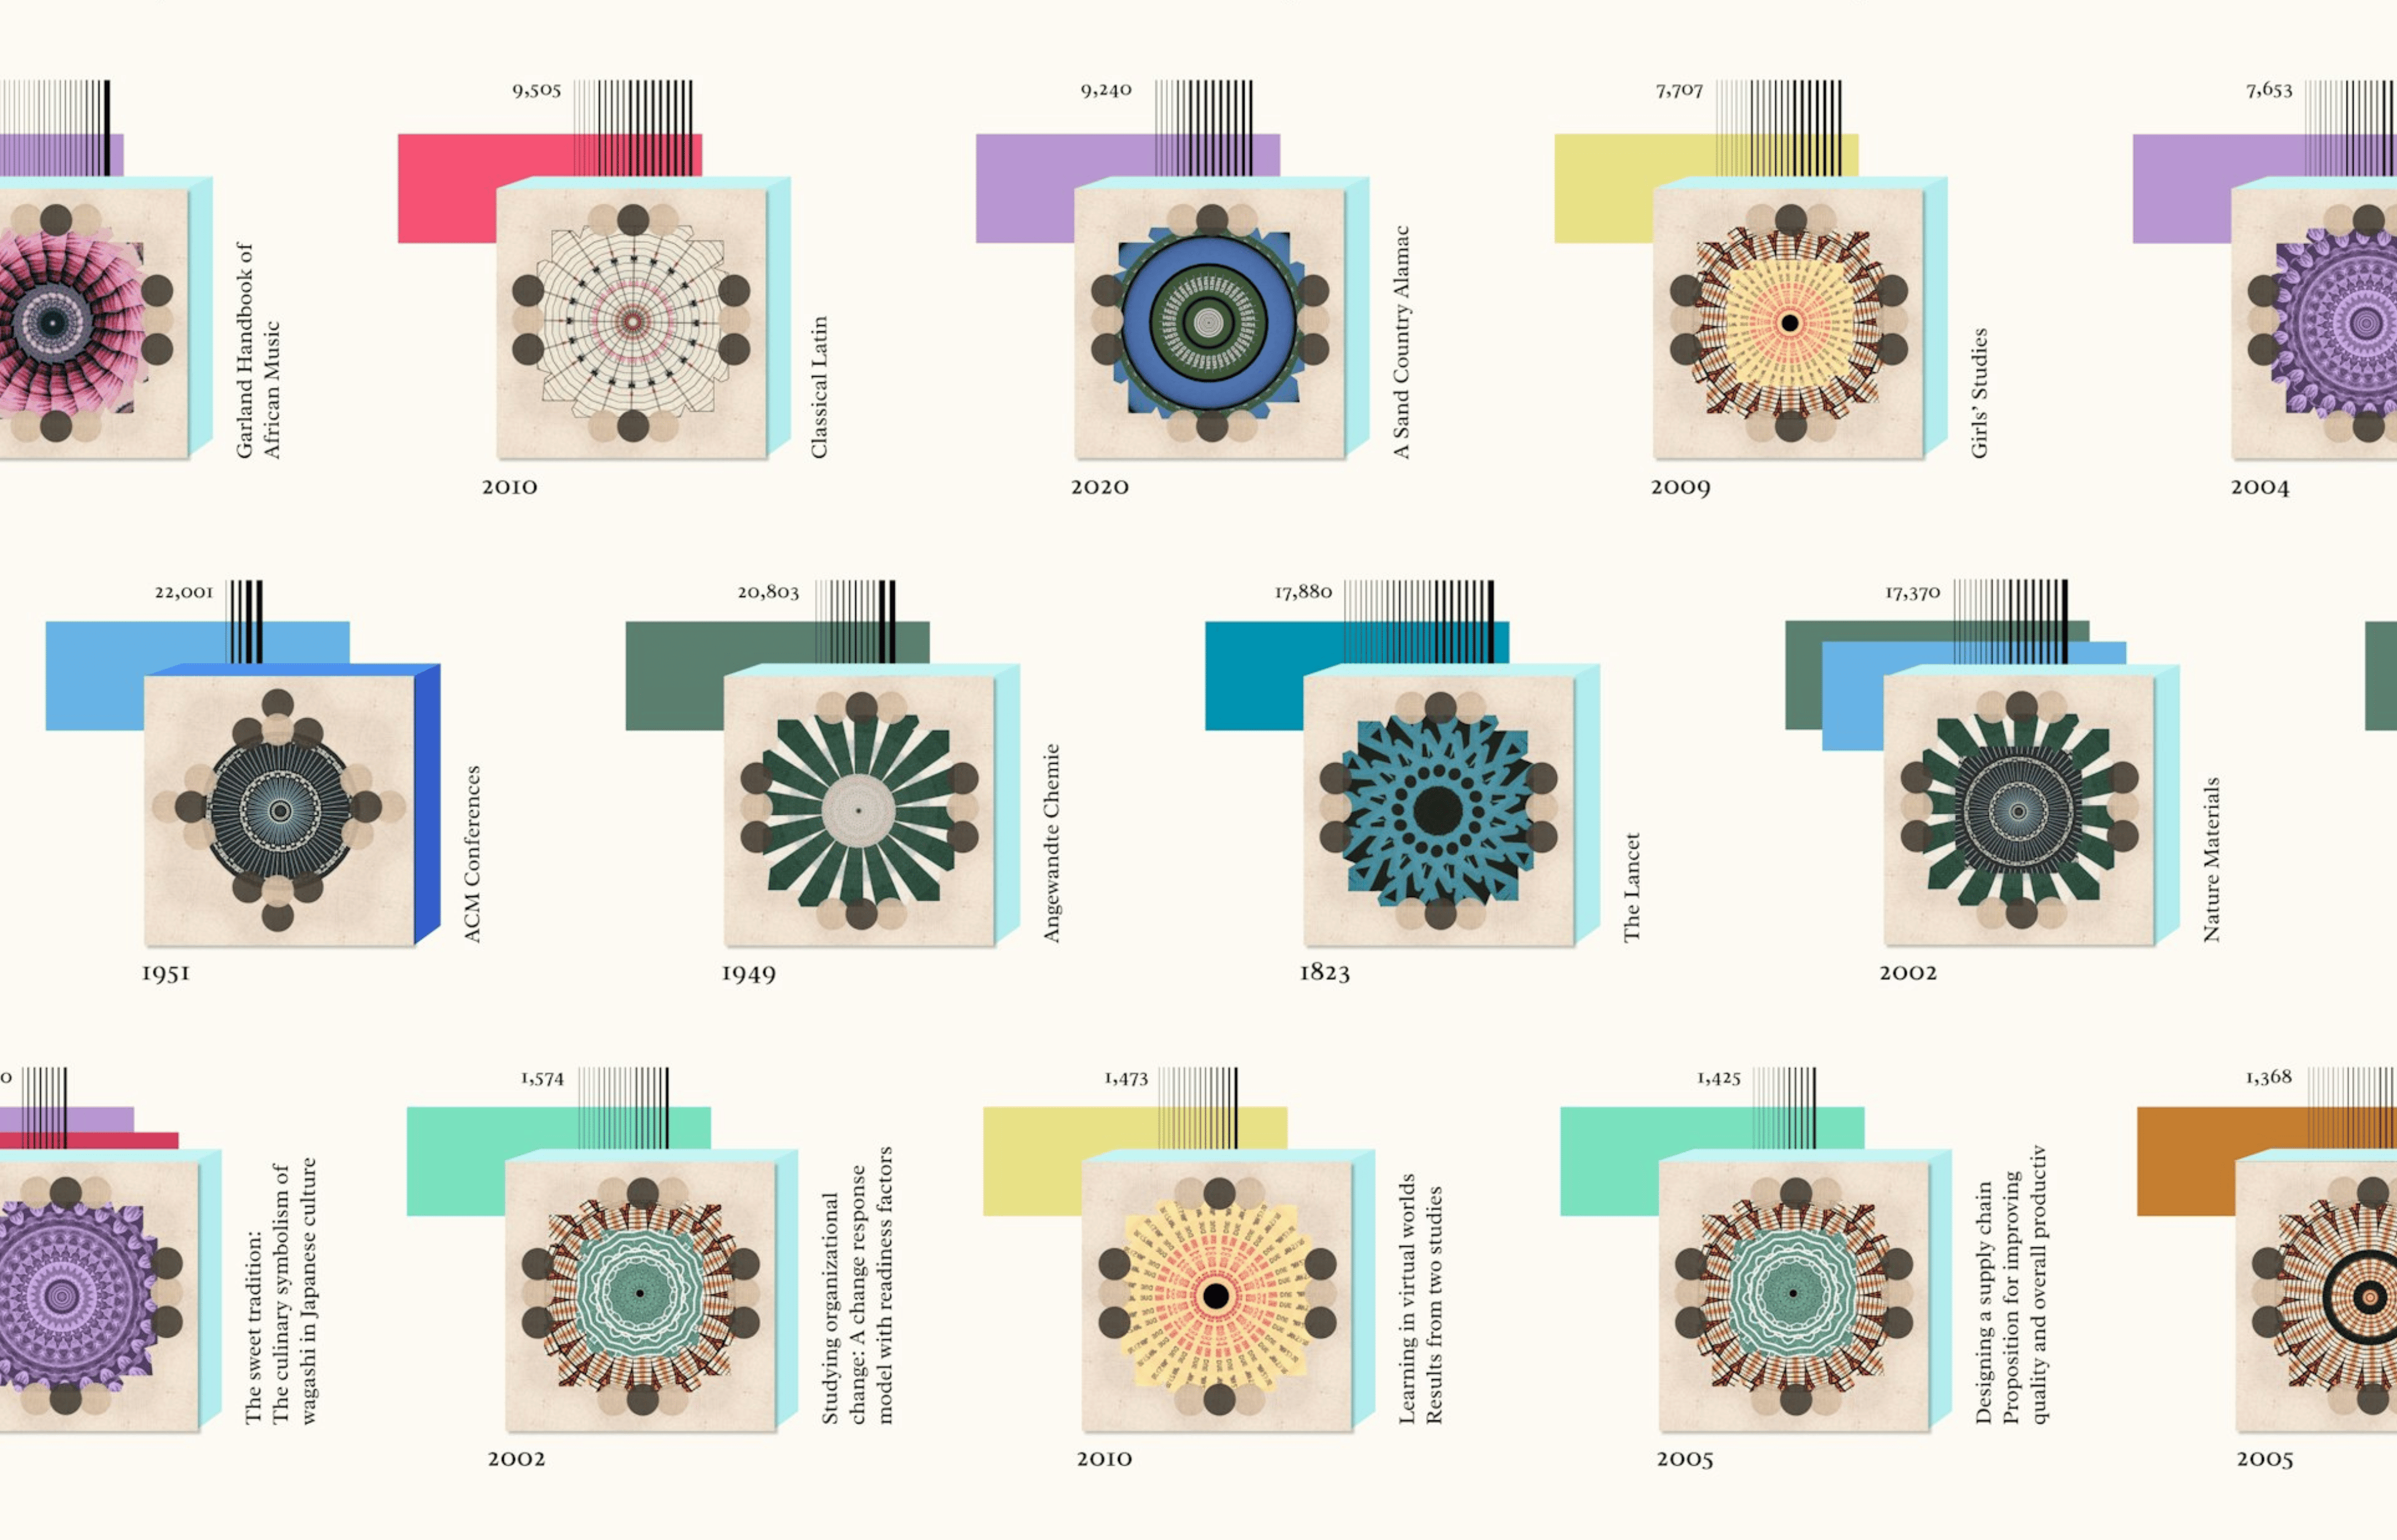
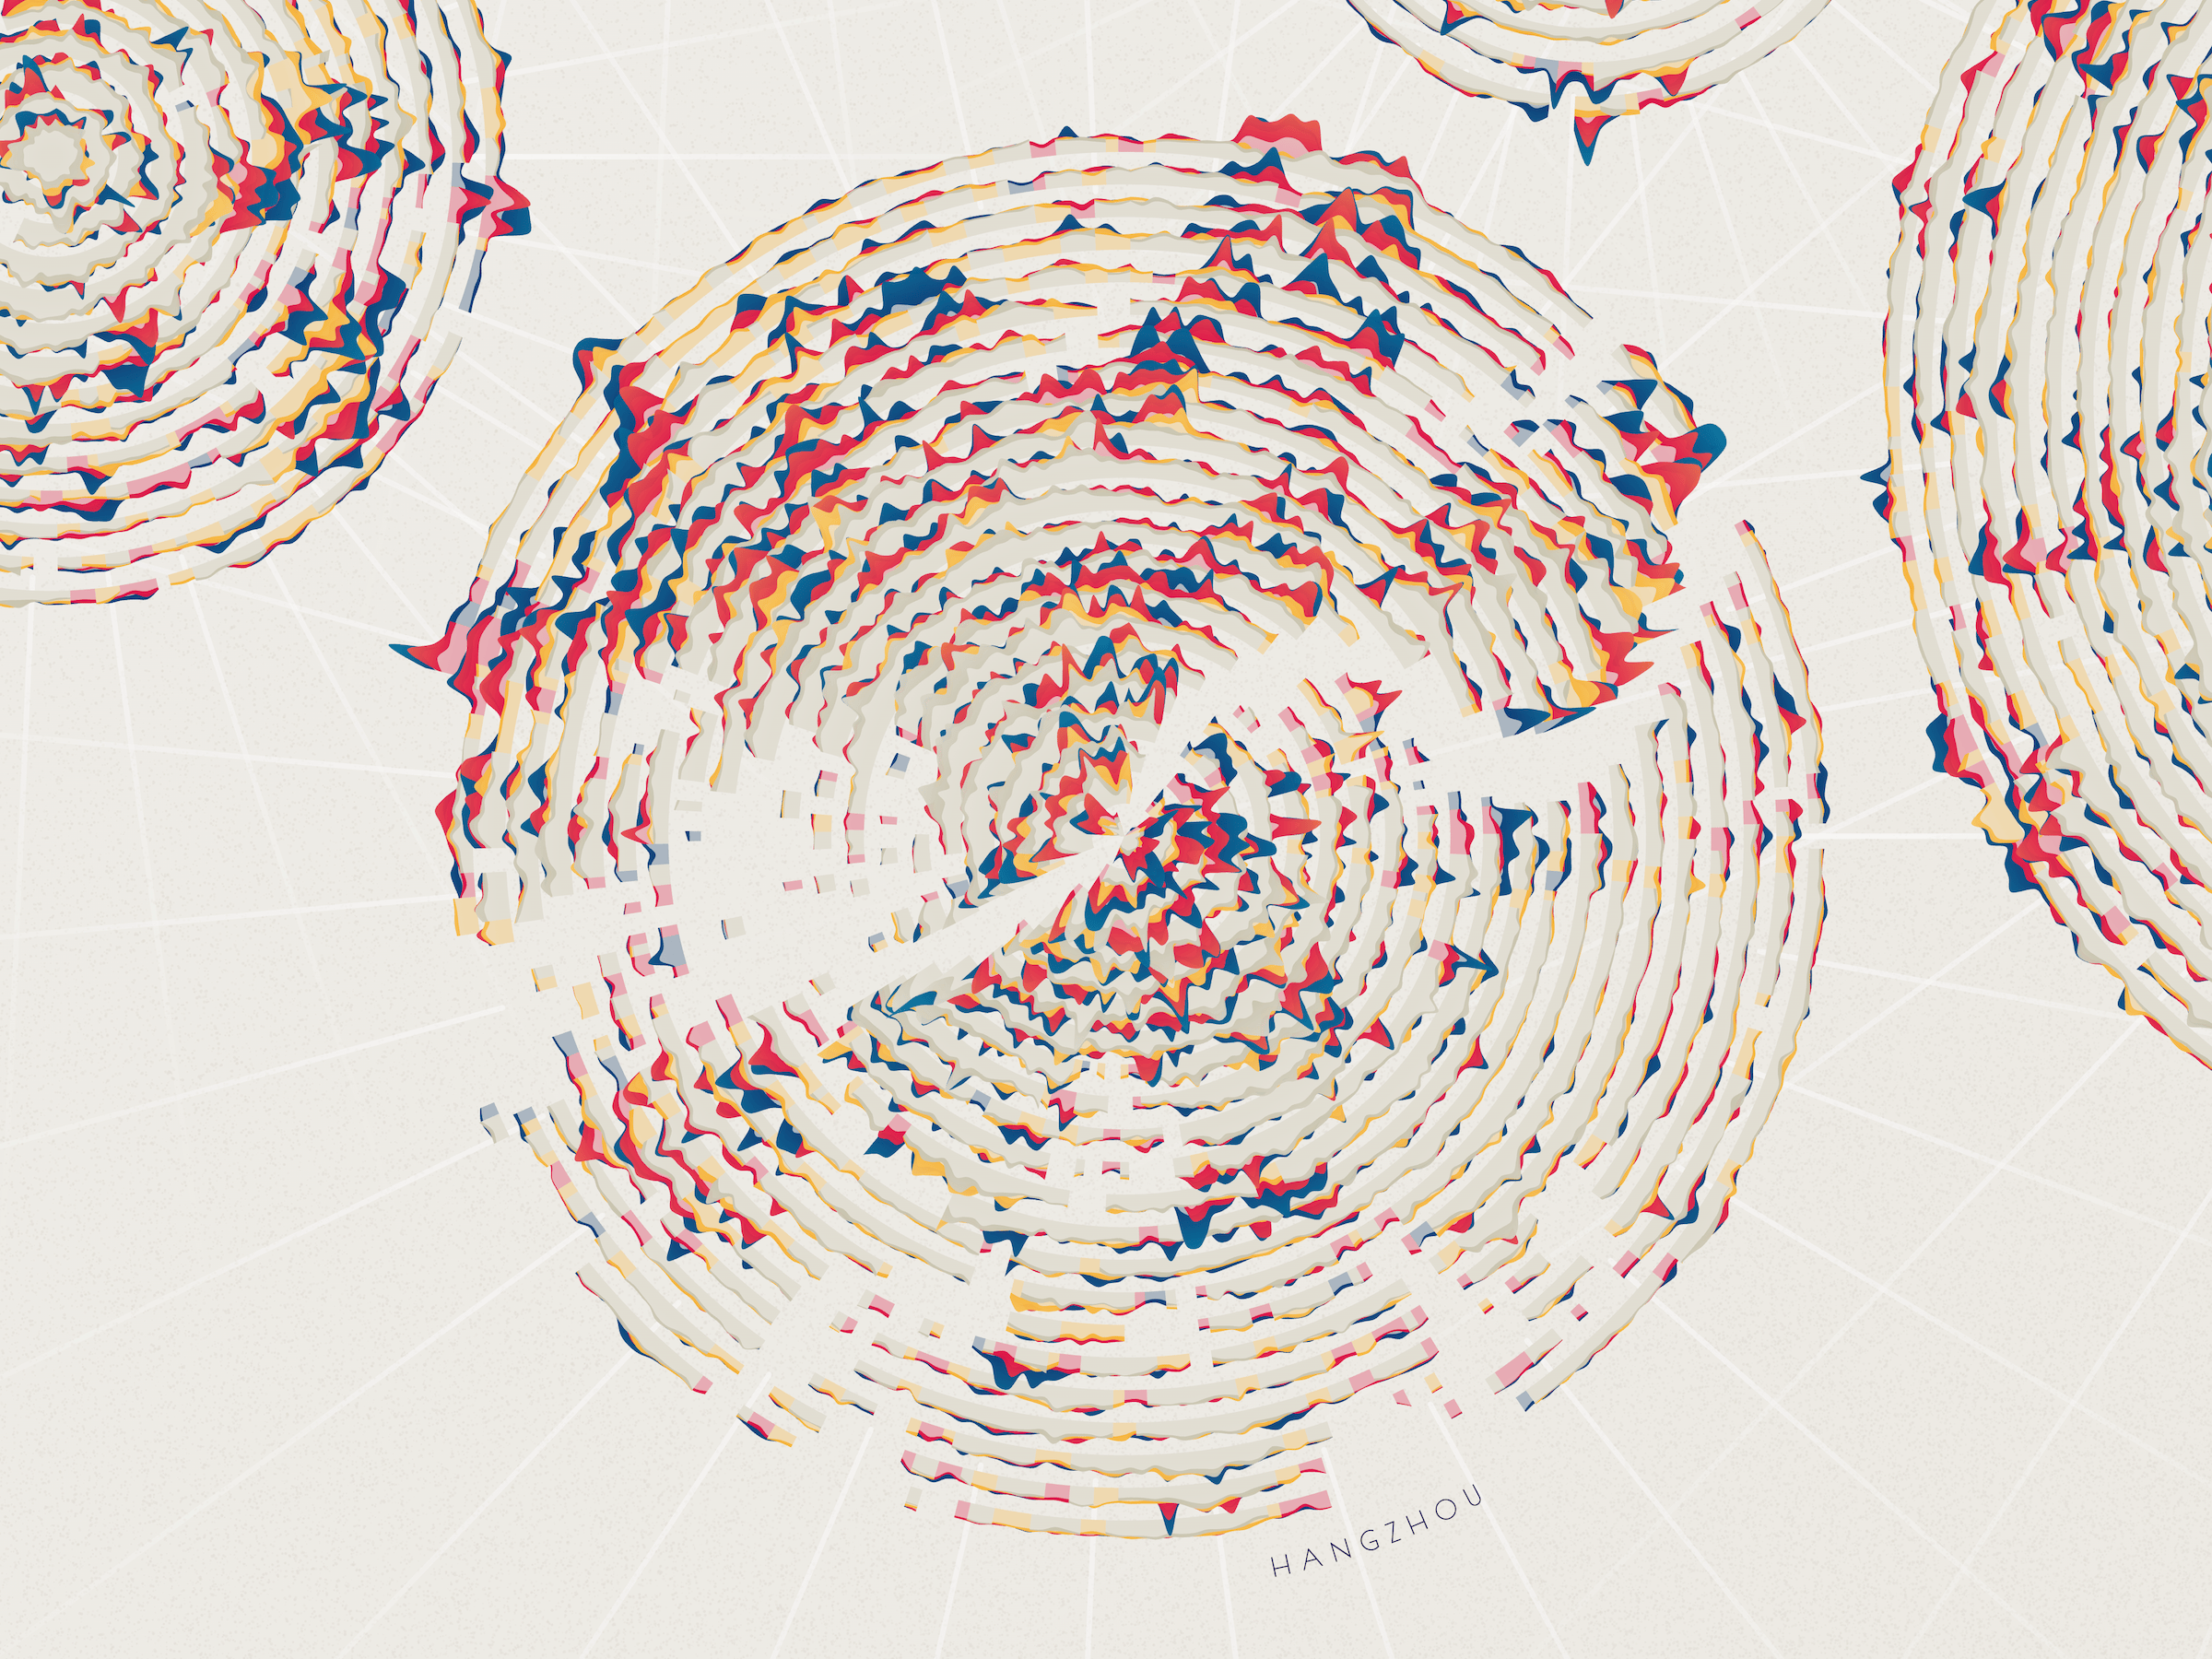
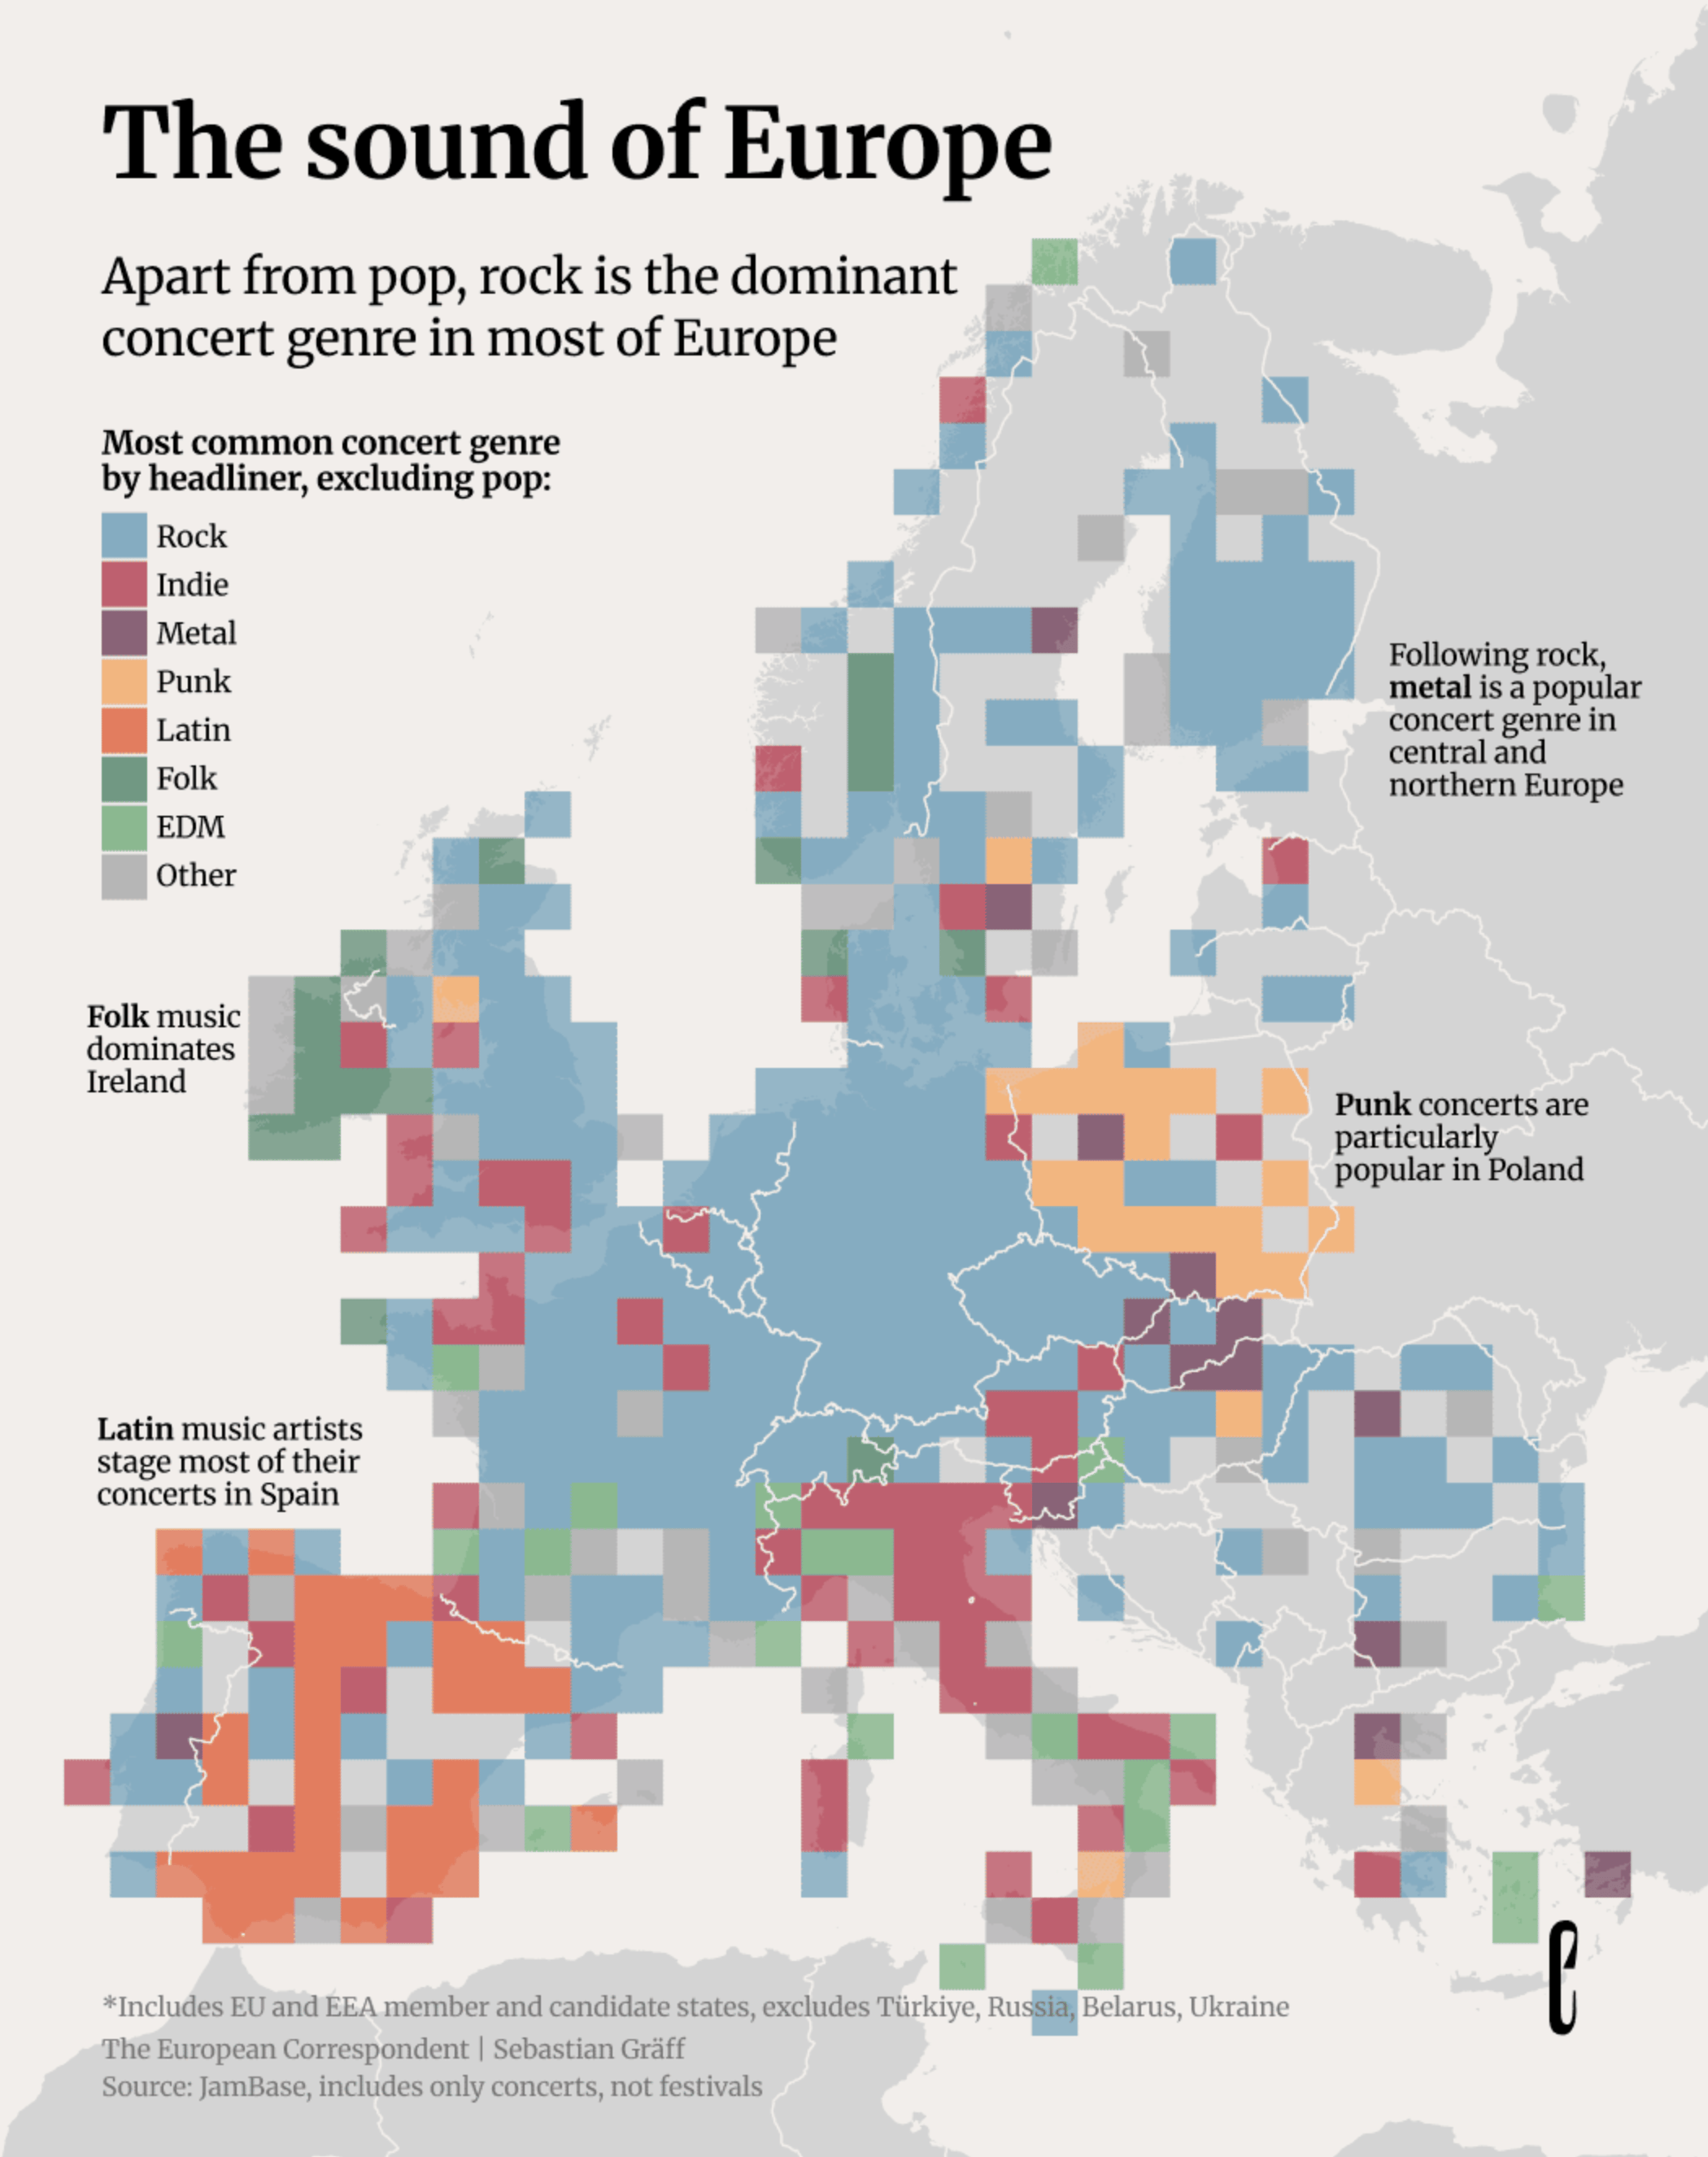
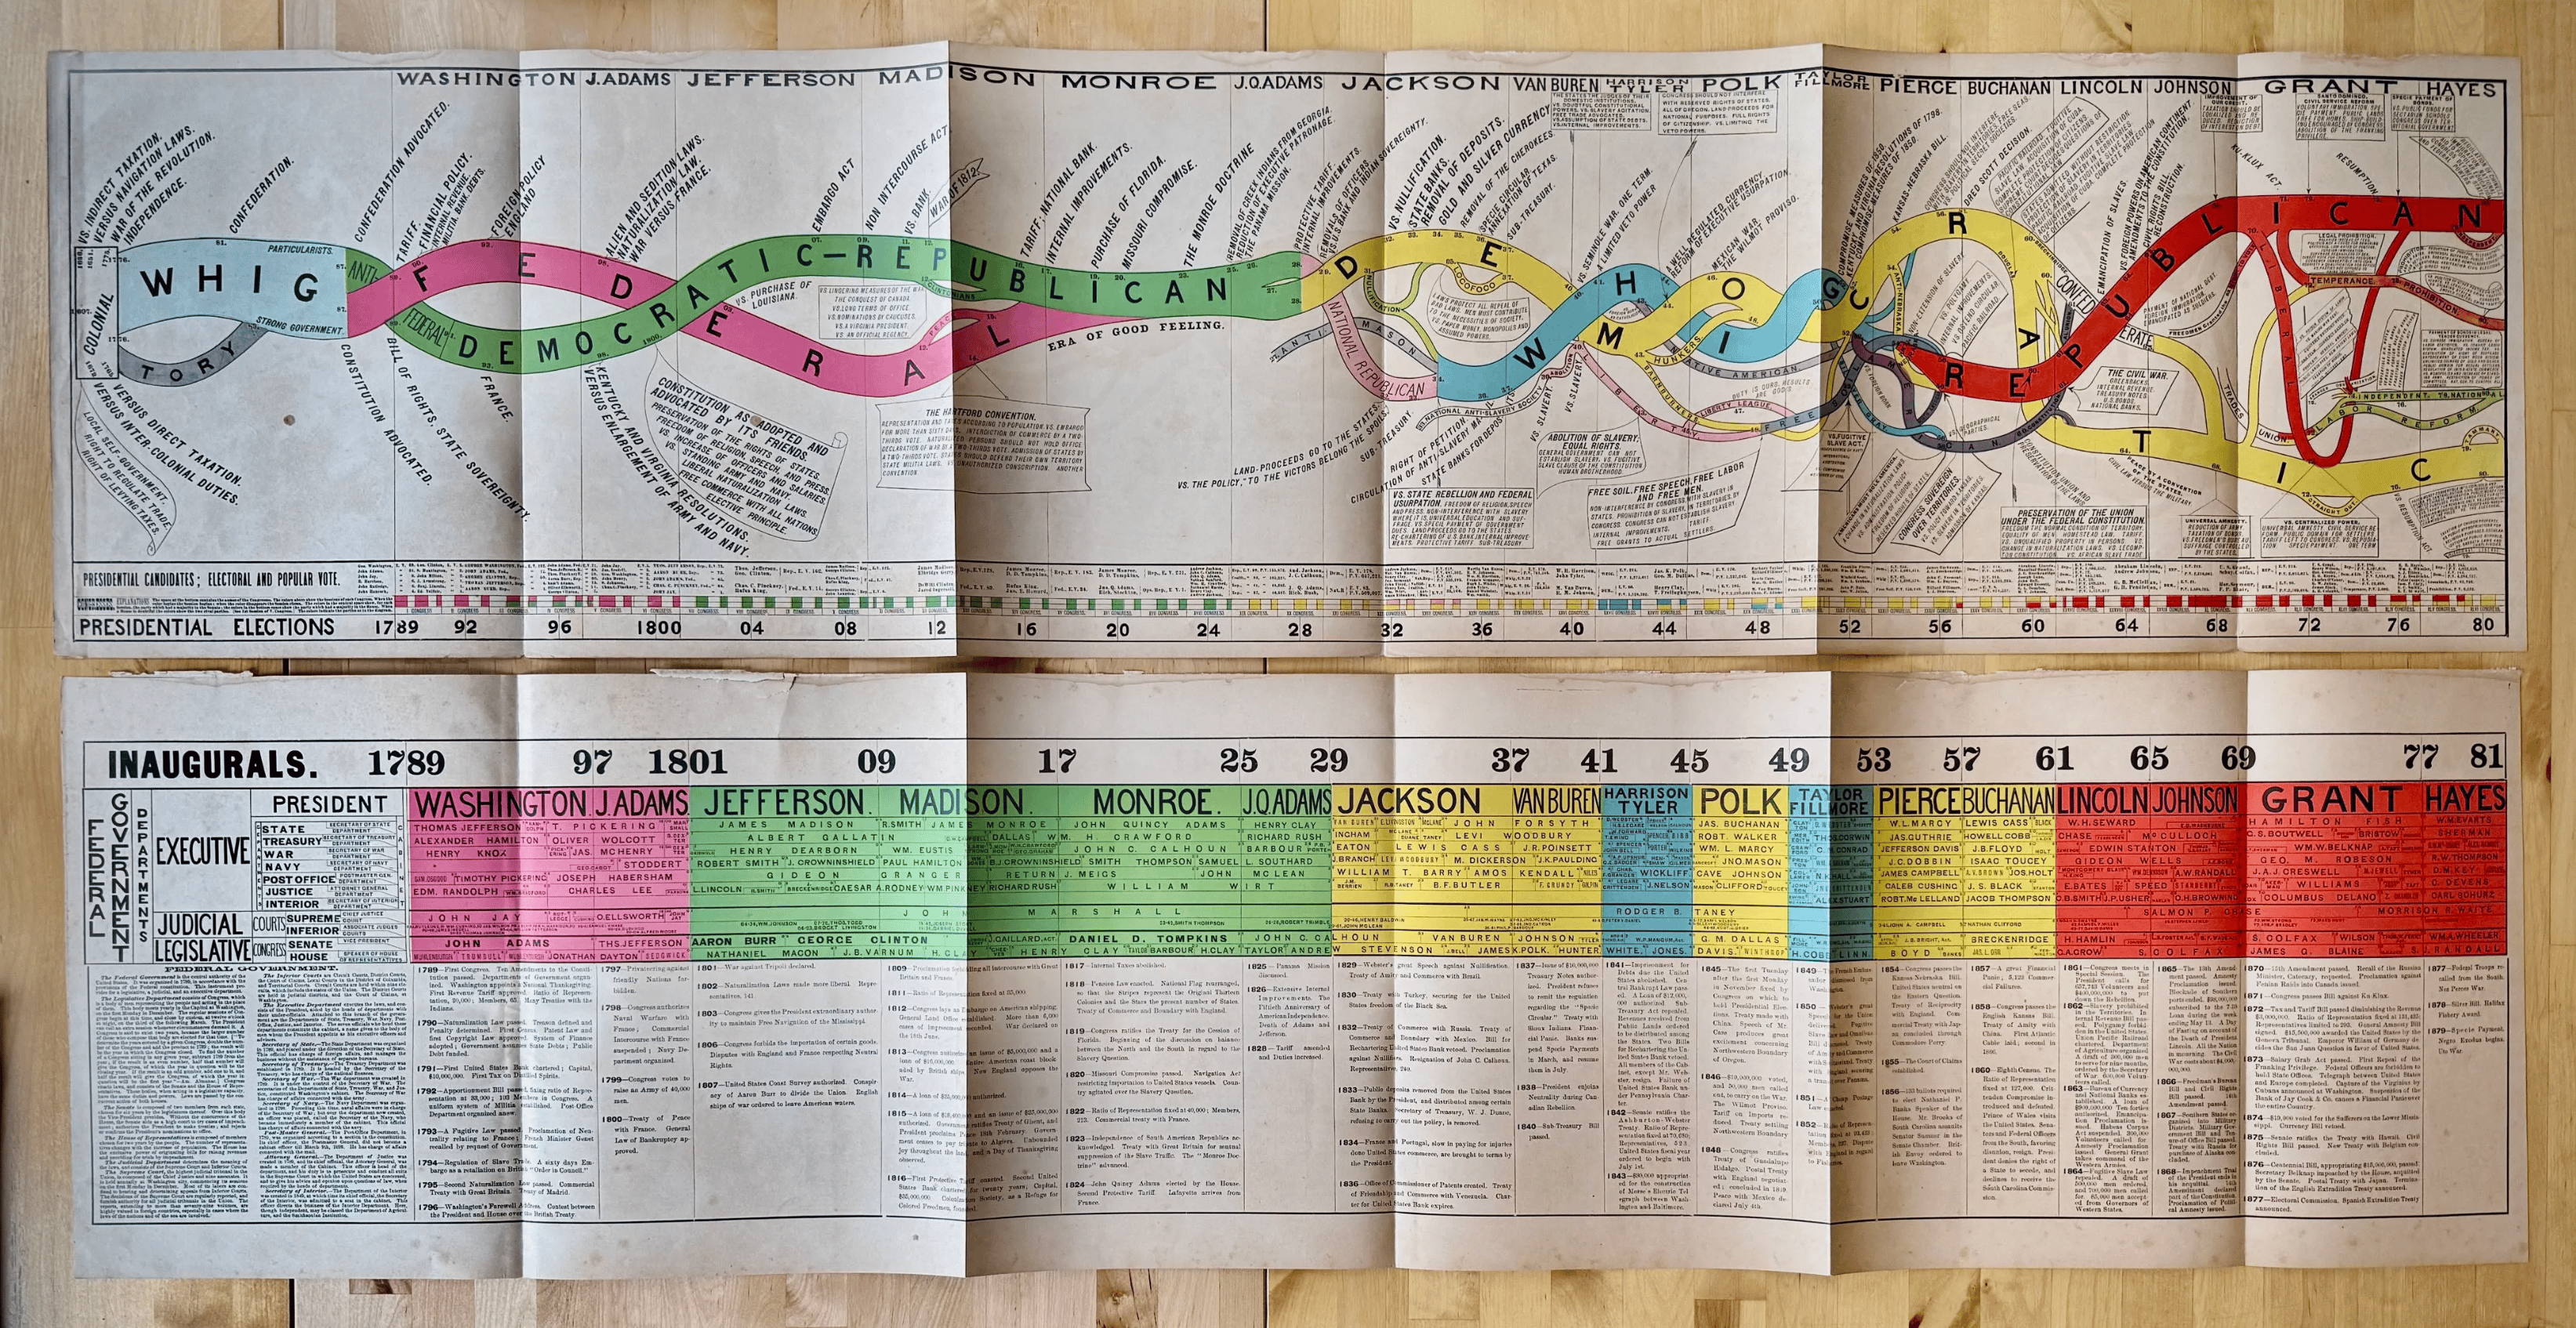
Let's start with something beautiful: two data art projects dropped in the past week, one by Giorgia Lupi and one by Nadieh Bremer. Plus a similarly colorful, pixelated Europe.
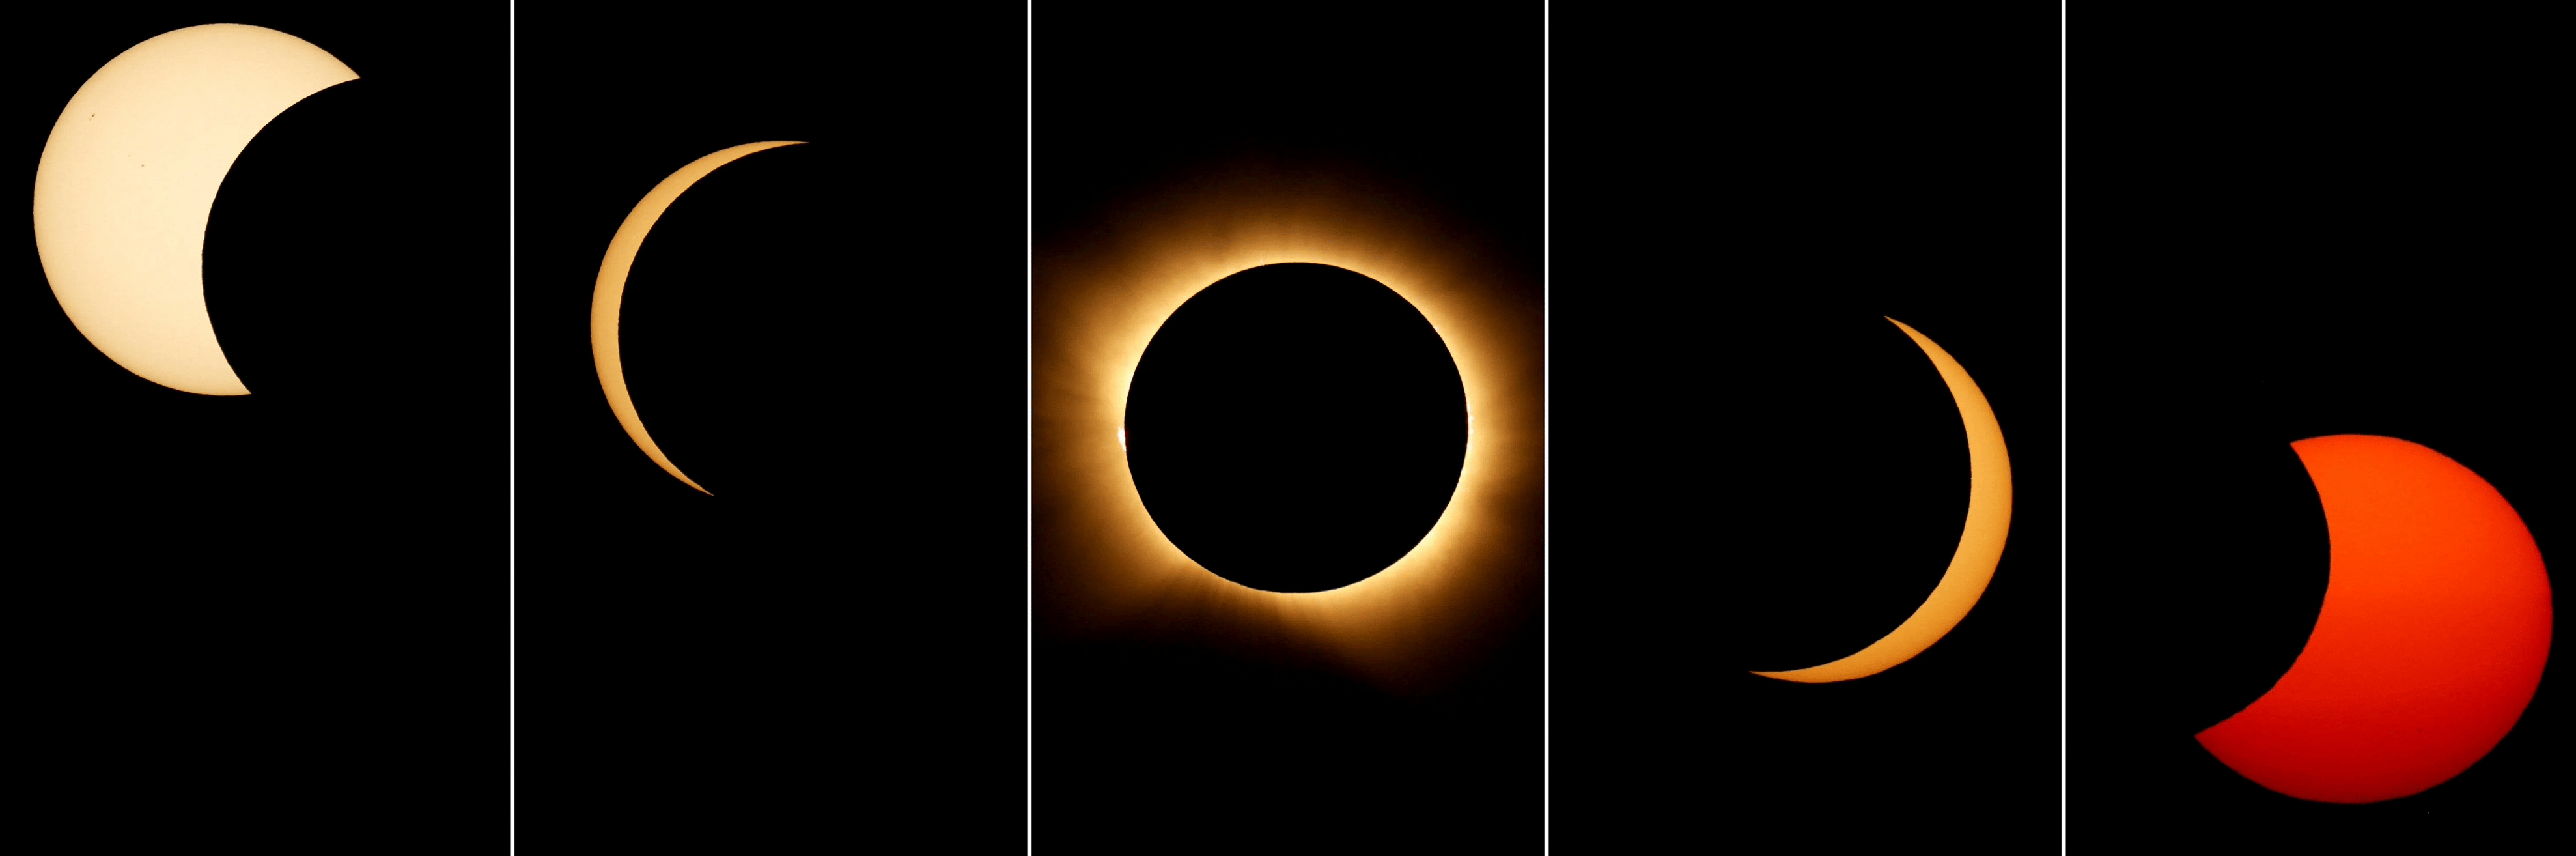
Apropos beautiful: Half of Europe could turn their eyes to the sky to watch the solar eclipse on August 12. El País stitched together what it looked like from space. And after the eclipse is before the eclipse! At least for Spain, which, as The European Correspondent explains, can expect two more (!) total eclipses in the next two years.
![El País: <a href="https://elpais.com/ciencia/2026-08-13/el-rastro-del-eclipse-en-datos-del-apagon-solar-a-las-busquedas-de-dolor-de-ojos.html"><strong>El rastro del eclipse en datos: del apagón solar a las búsquedas de “dolor de ojos”</strong></a> <em>[Chart title: Drop in Electricity Consumption]</em>, August 13](https://datawrapper.de/cdn-cgi/image/quality=85,width=1840,f=auto,fit=cover/https://kirby.datawrapper.de/media/pages/blog/data-vis-dispatch-august-18-data-art-low-water-levels-health/39cf045294-1787039485/screenshot-2026-08-18-at-09.50.49.png)
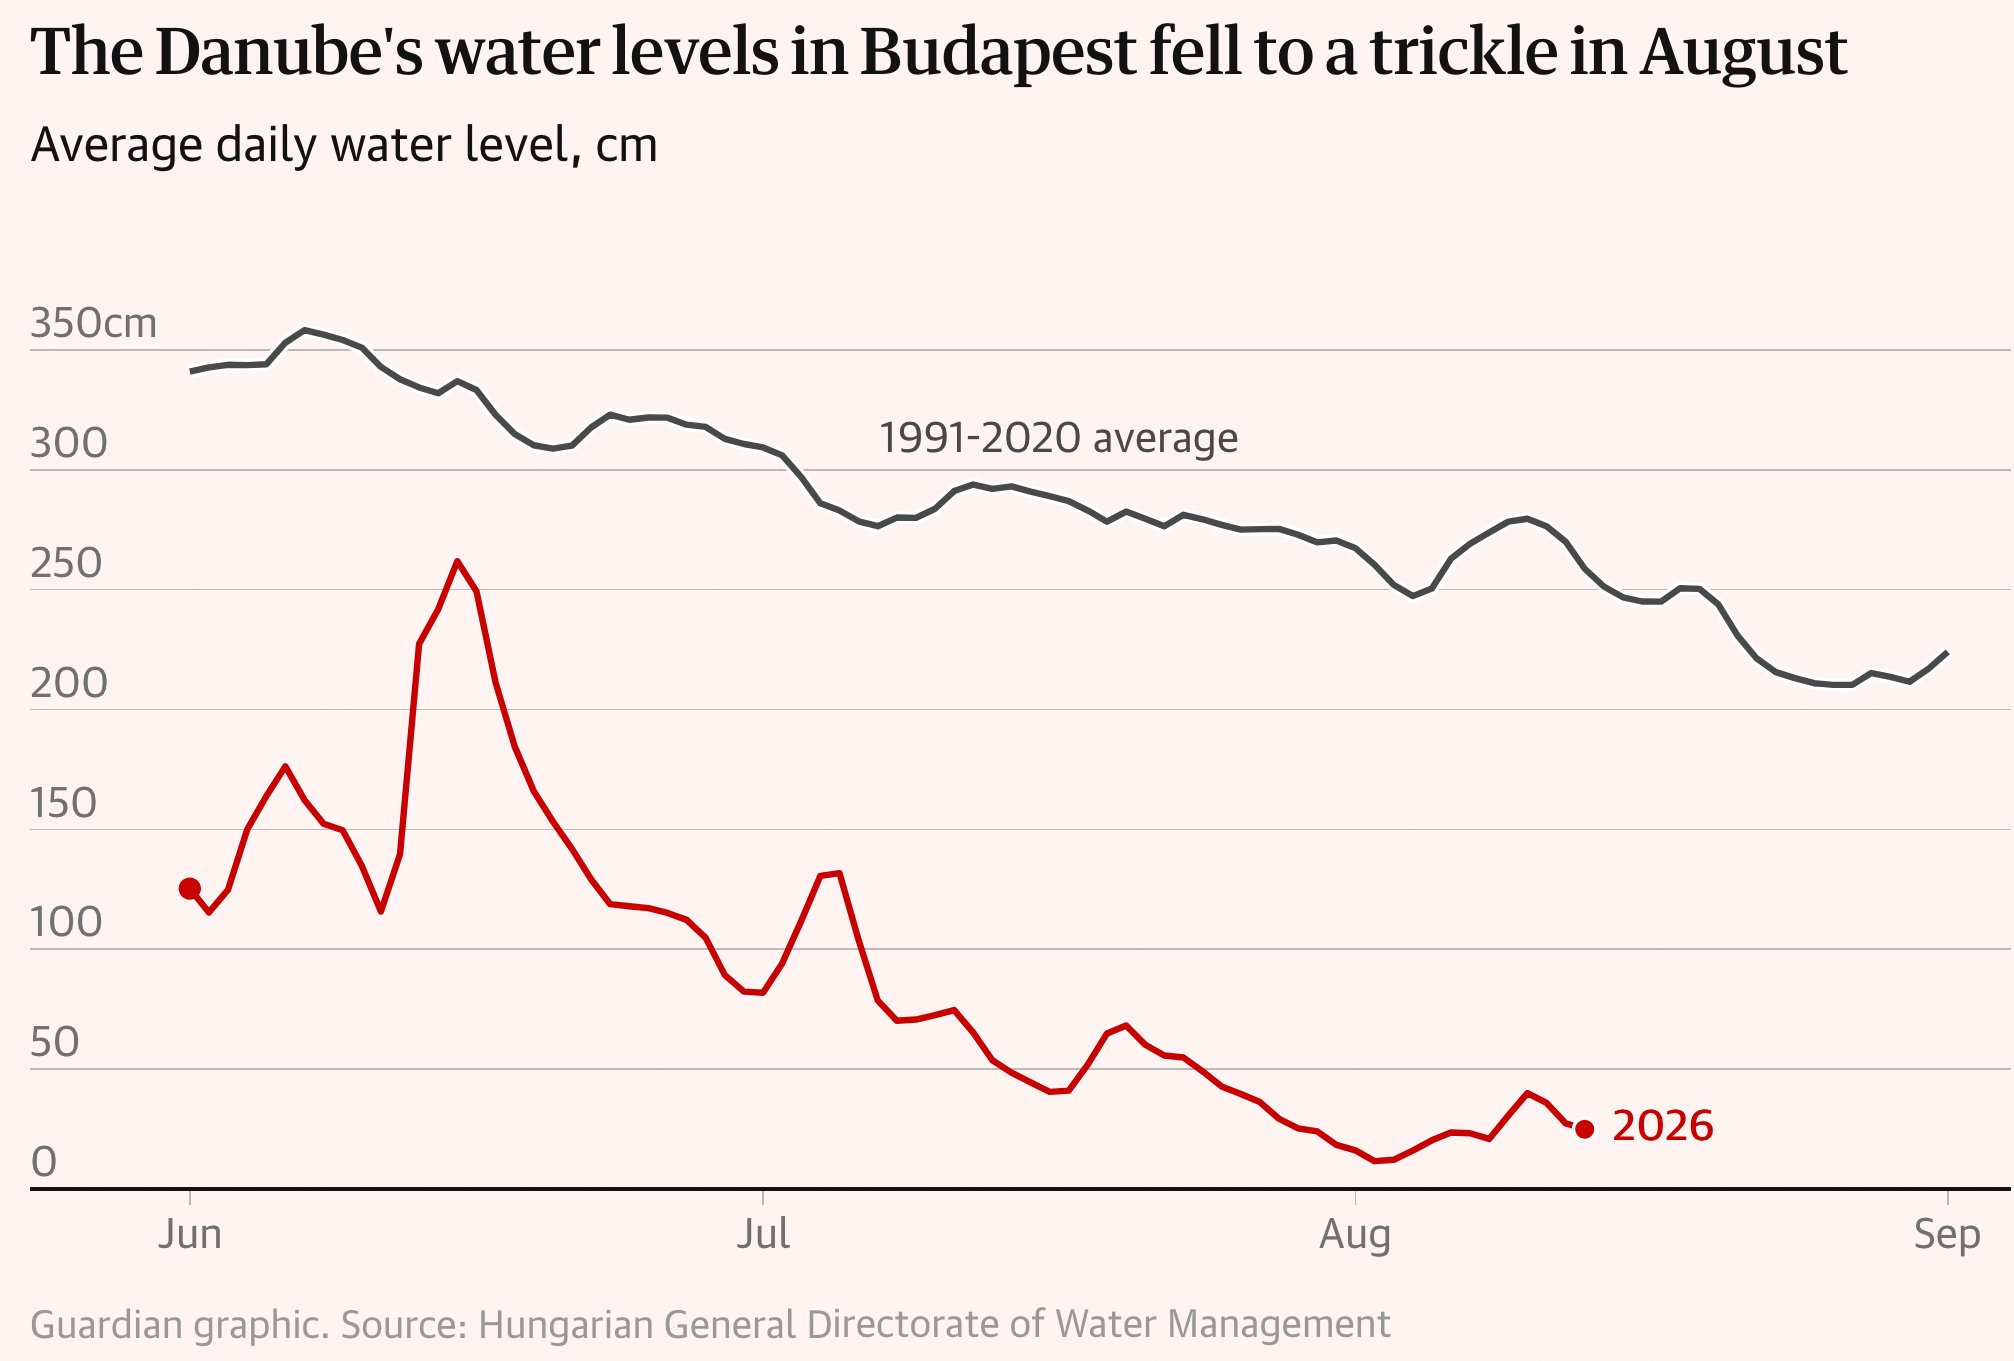
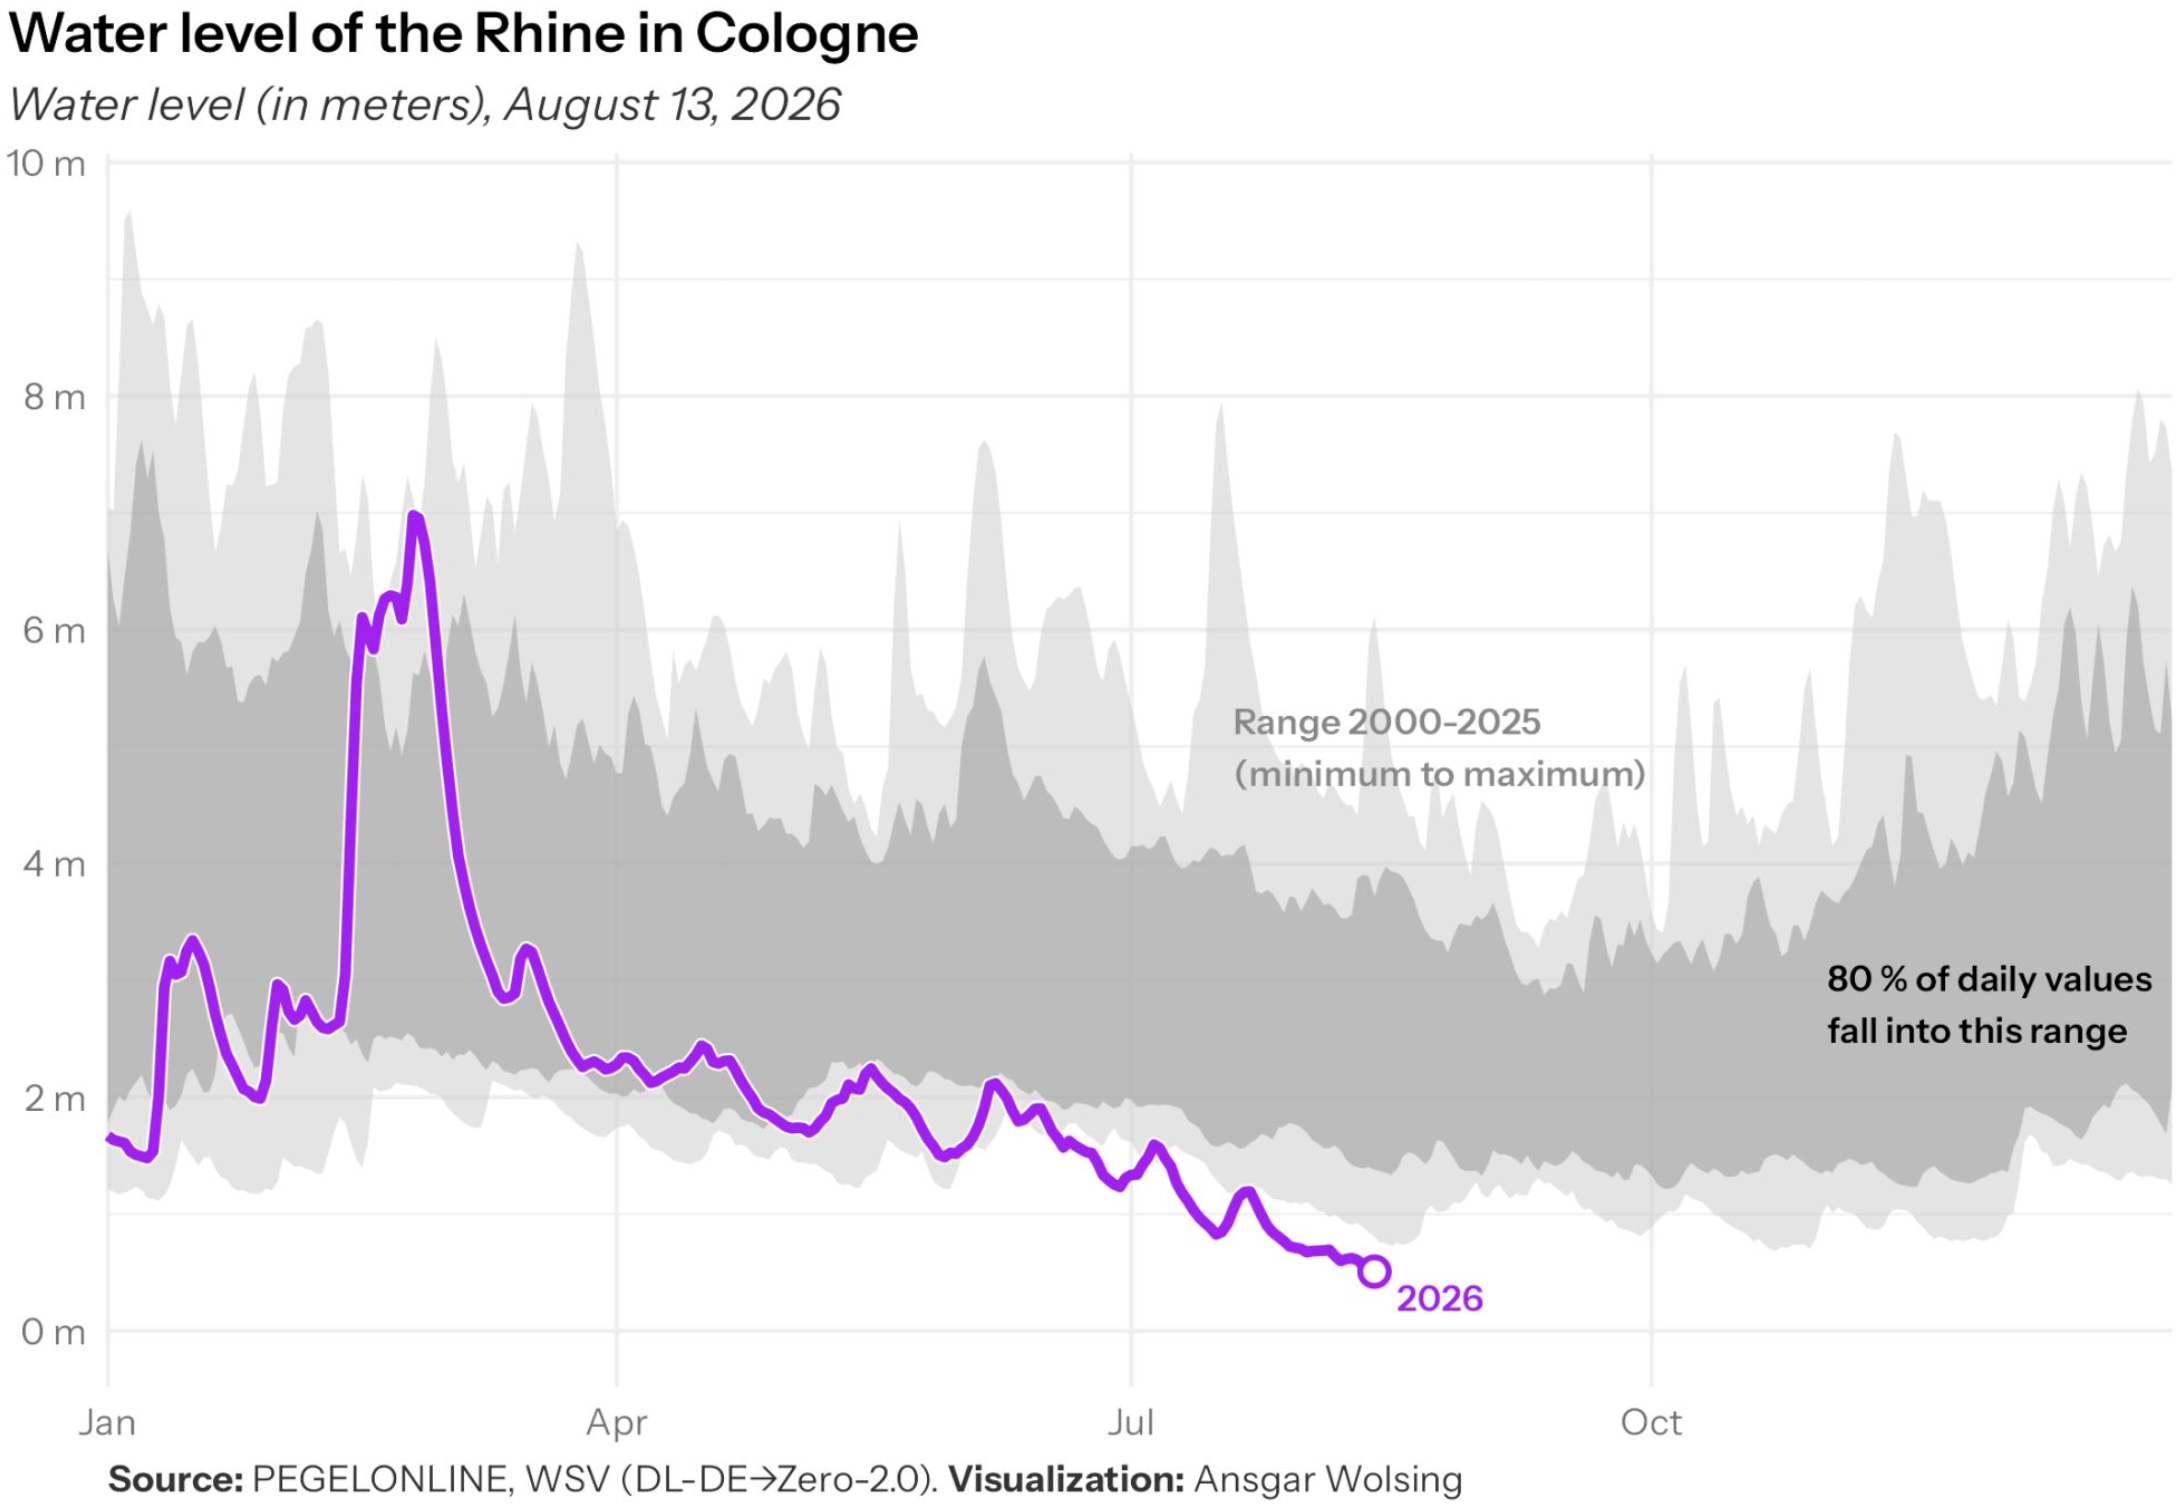
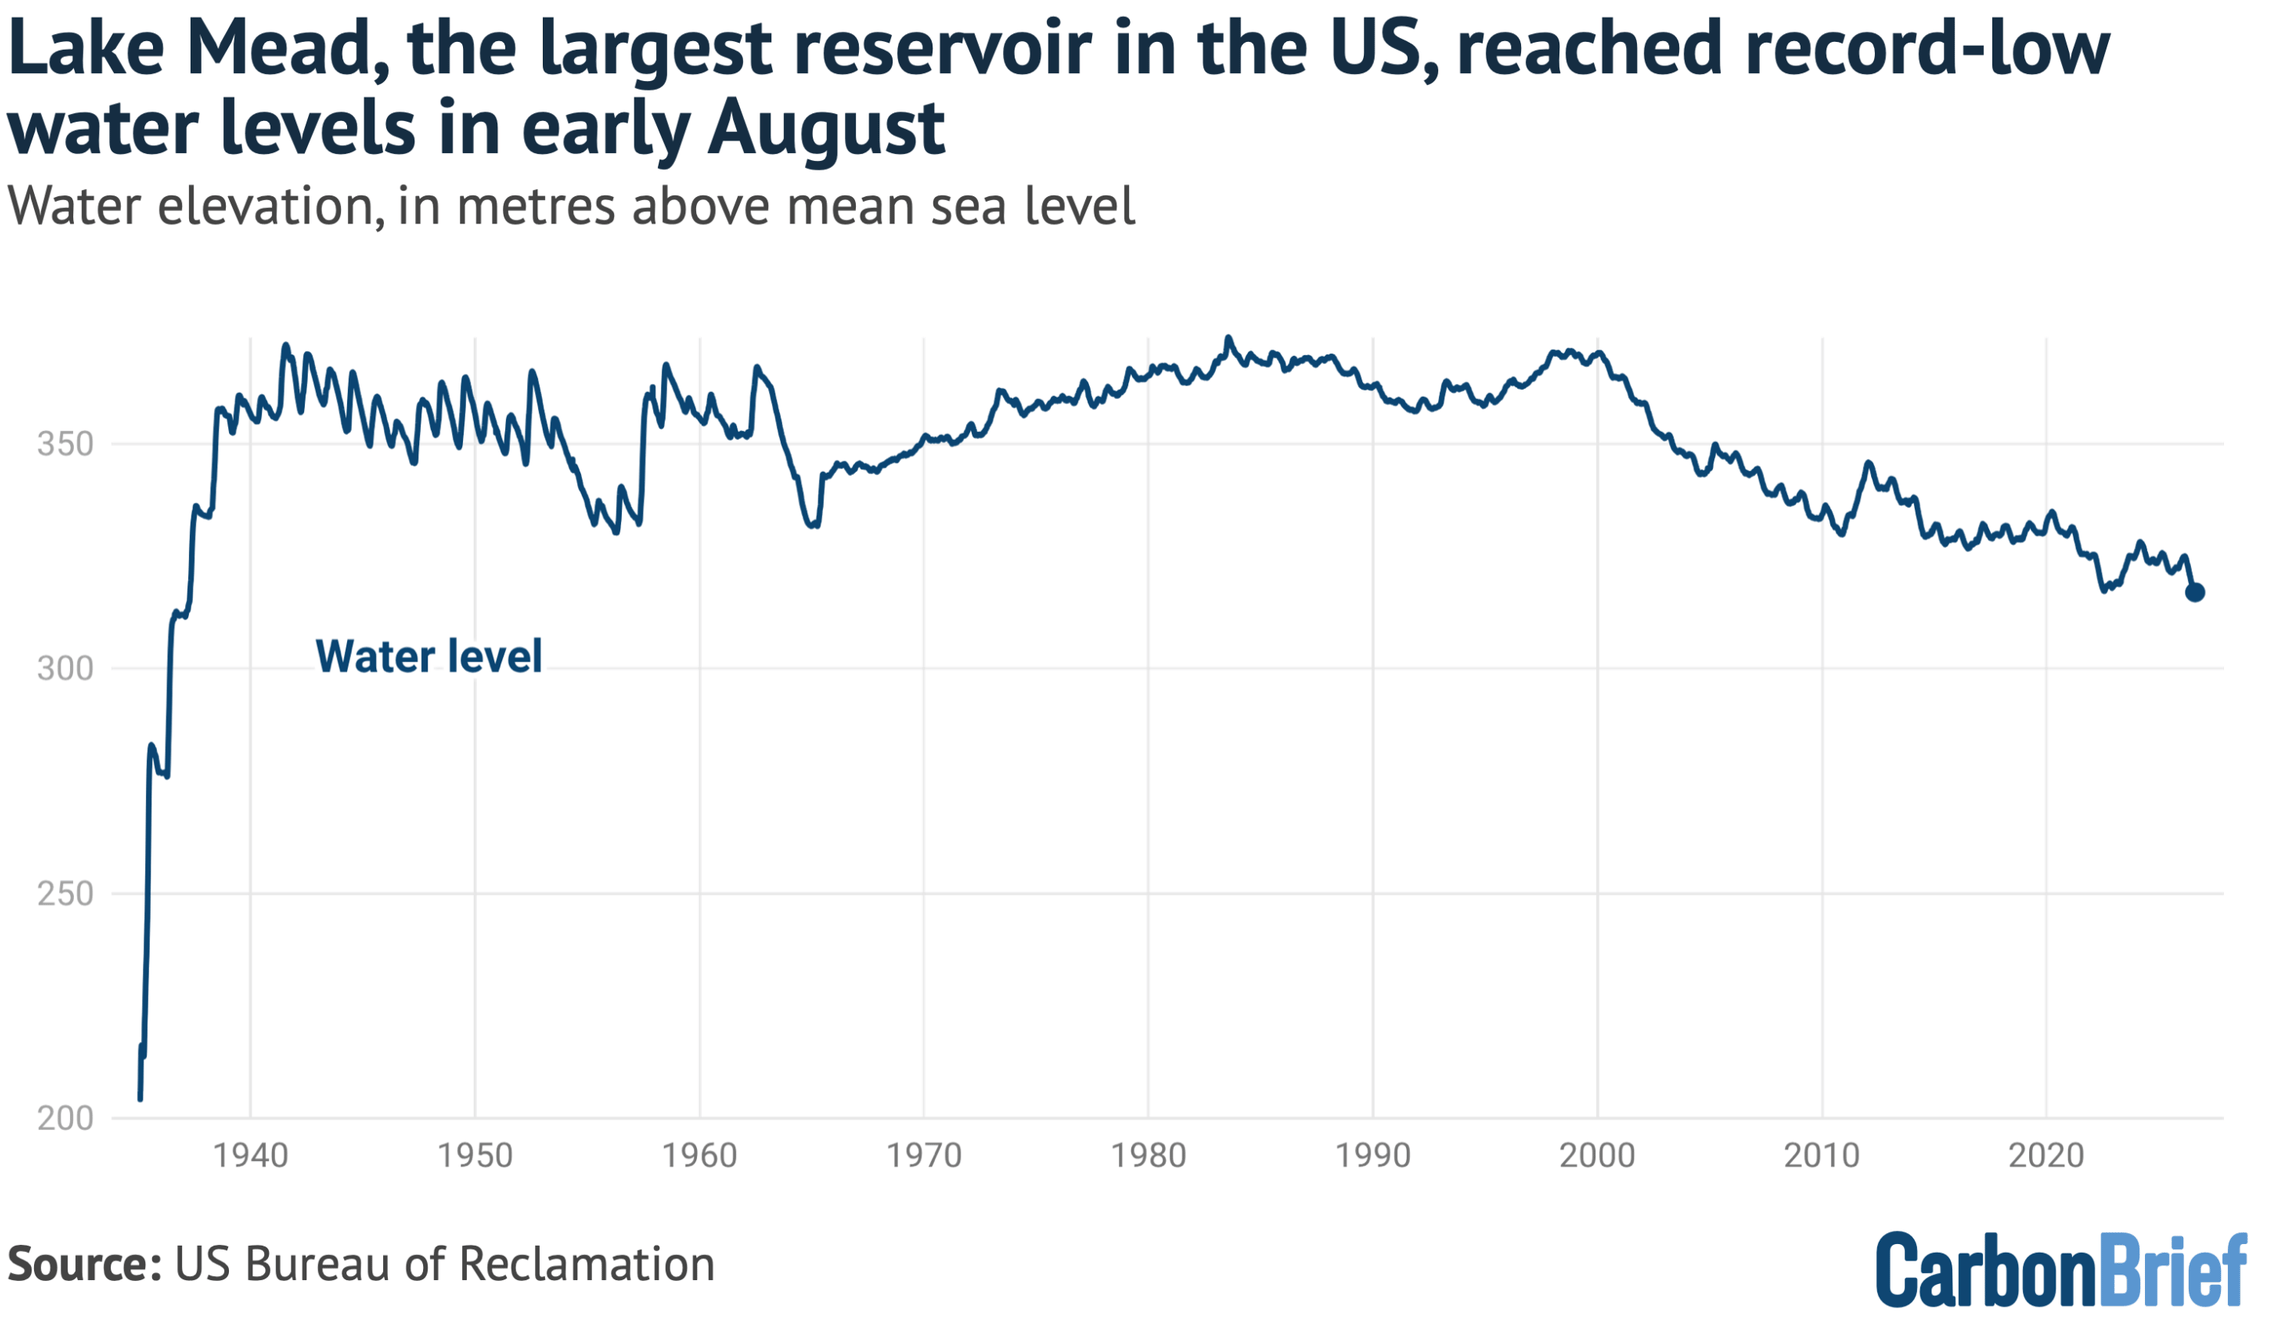
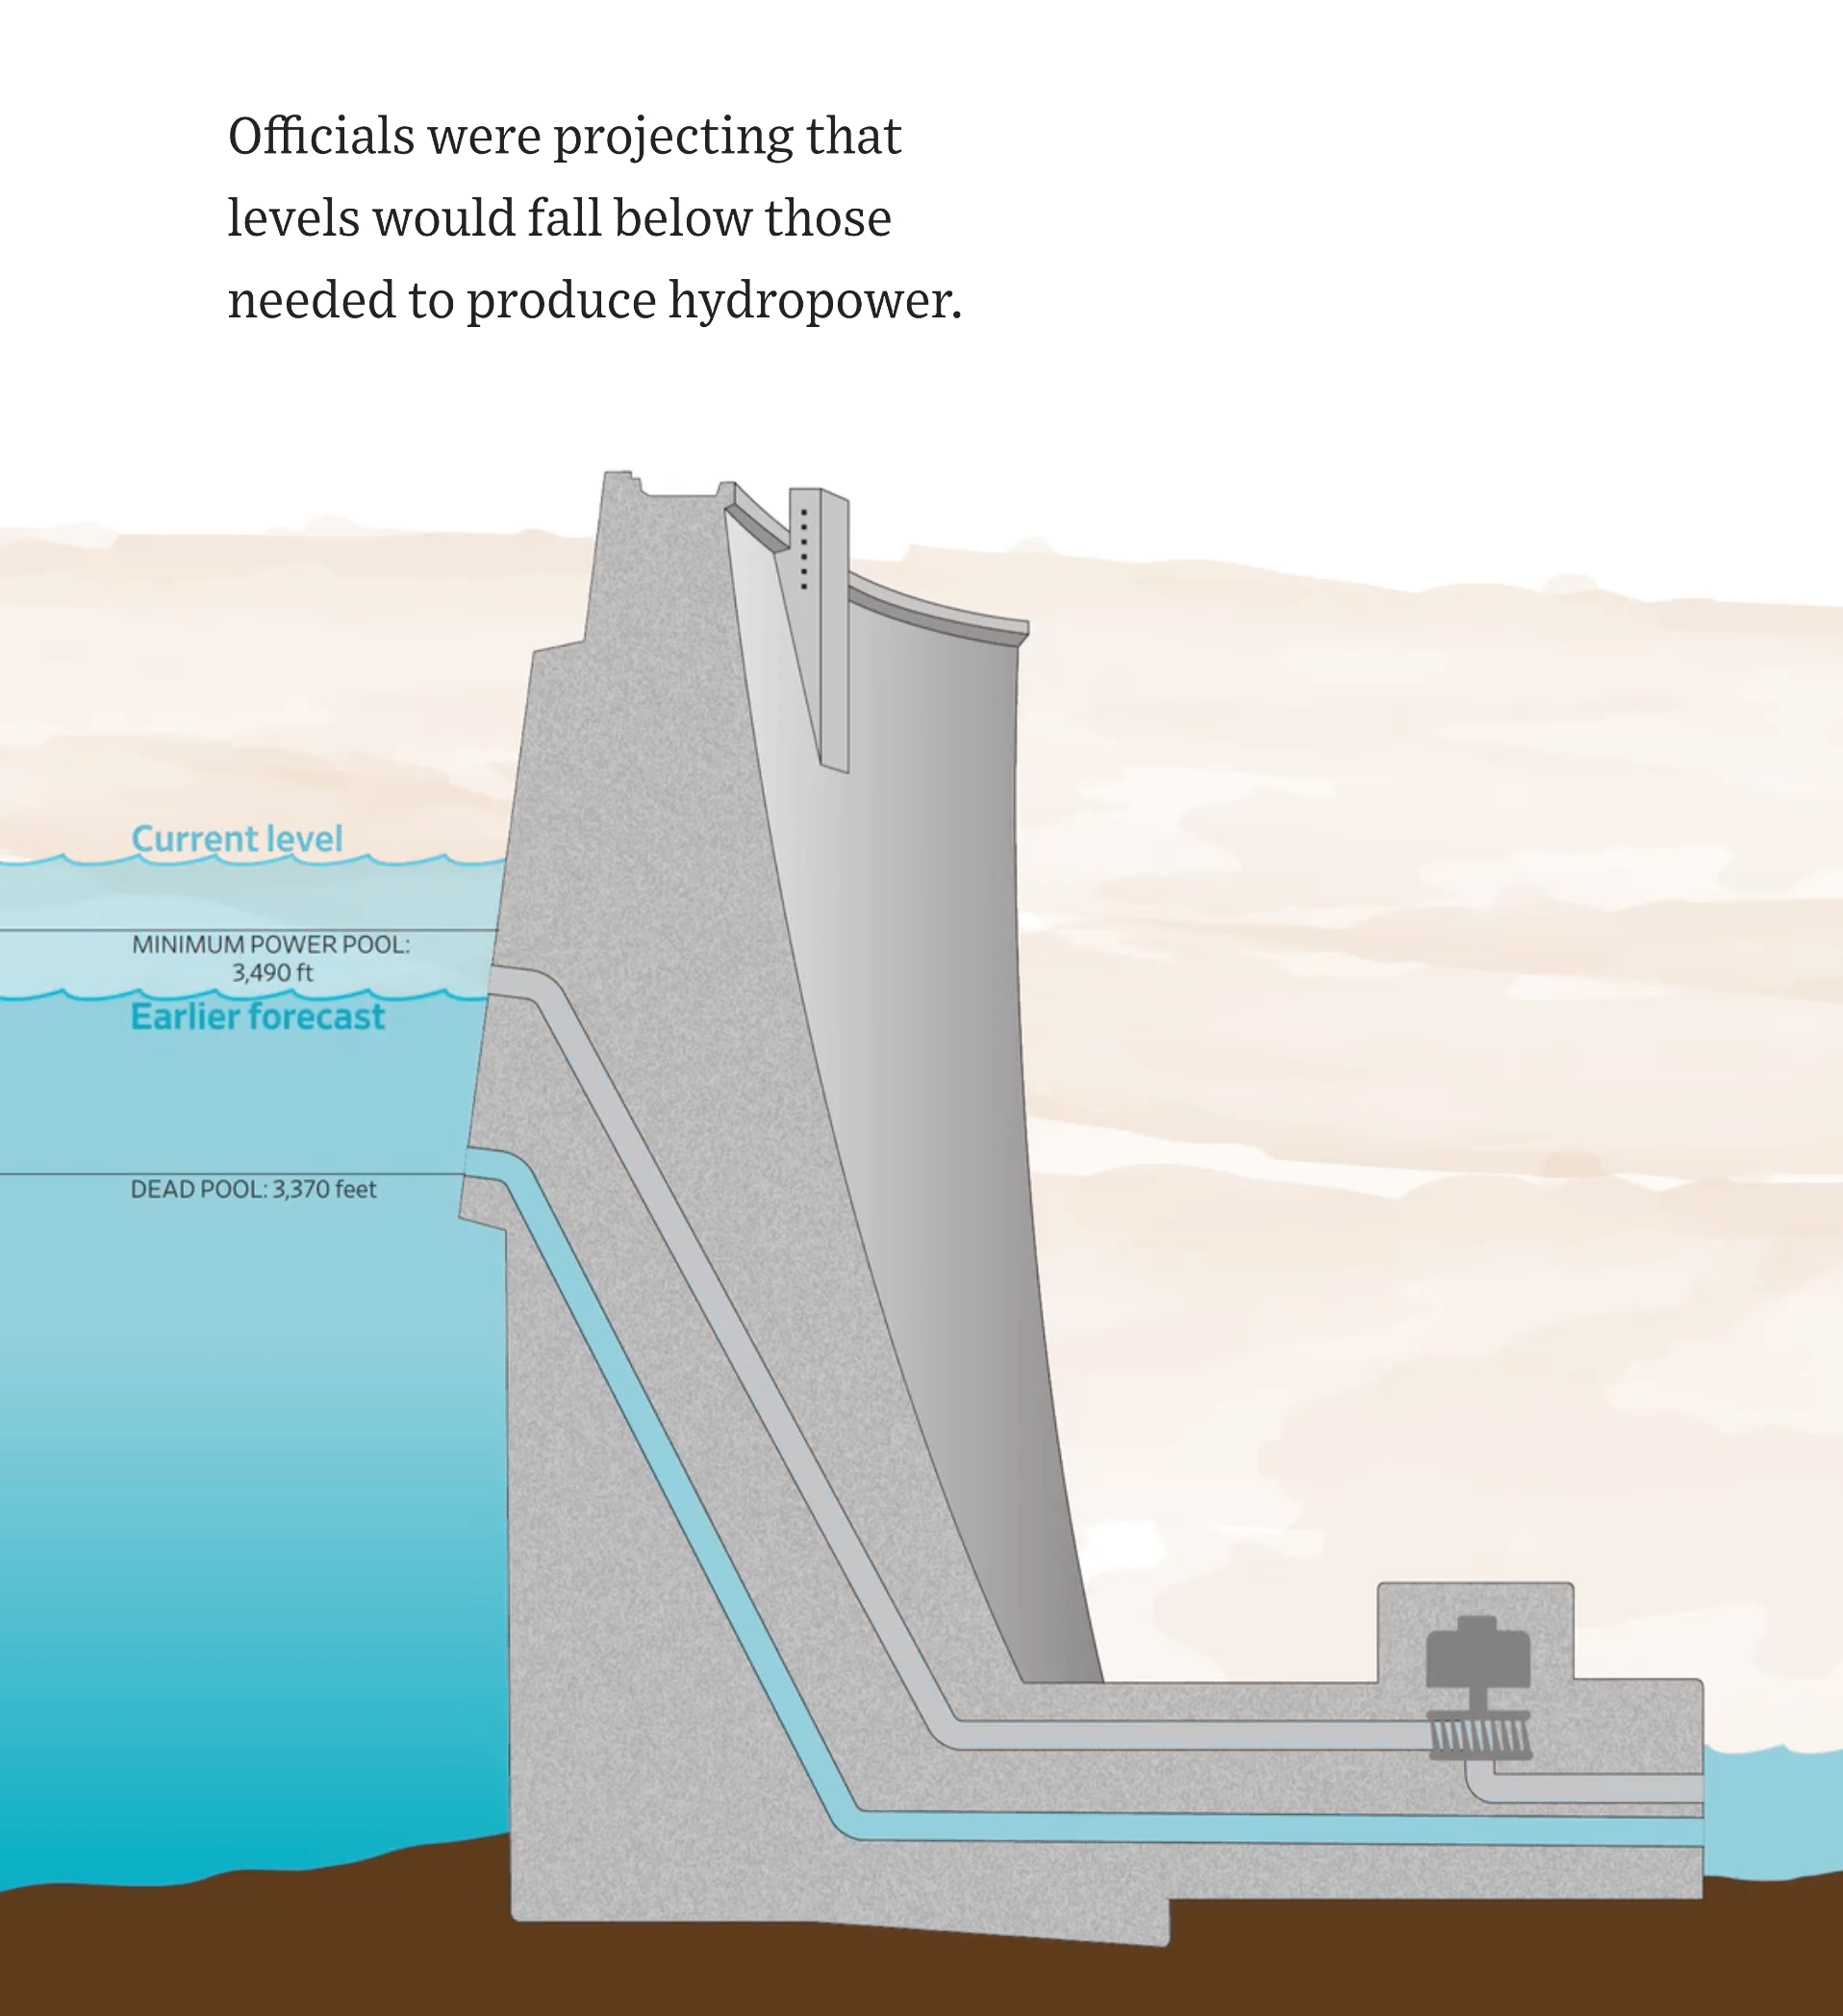
The low water levels in Europe's rivers and US reservoirs remain low. The Wall Street Journal explains the effect on hydropower, and NZZ visualizes what happens to flora and fauna when water gets unusually warm.
![Tagesanzeiger: <a href="https://www.tagesanzeiger.ch/trockenheit-70-schweizer-fluesse-auf-rekordtief-101049882694"><strong>Jeder zweite grosse Fluss mit historisch tiefem Sommer-Pegel</strong></a> <em>[Chart title: Rivers with historically low water levels]</em>, August 12](https://datawrapper.de/cdn-cgi/image/quality=85,width=1702,f=auto,fit=cover/https://kirby.datawrapper.de/media/pages/blog/data-vis-dispatch-august-18-data-art-low-water-levels-health/a80a23805a-1786958632/screenshot_2026-08-17_11-23-29@2x.png)
Rivers weren't the only ones to suffer in Europe's heat. Few households (and train companies) have been prepared for it.
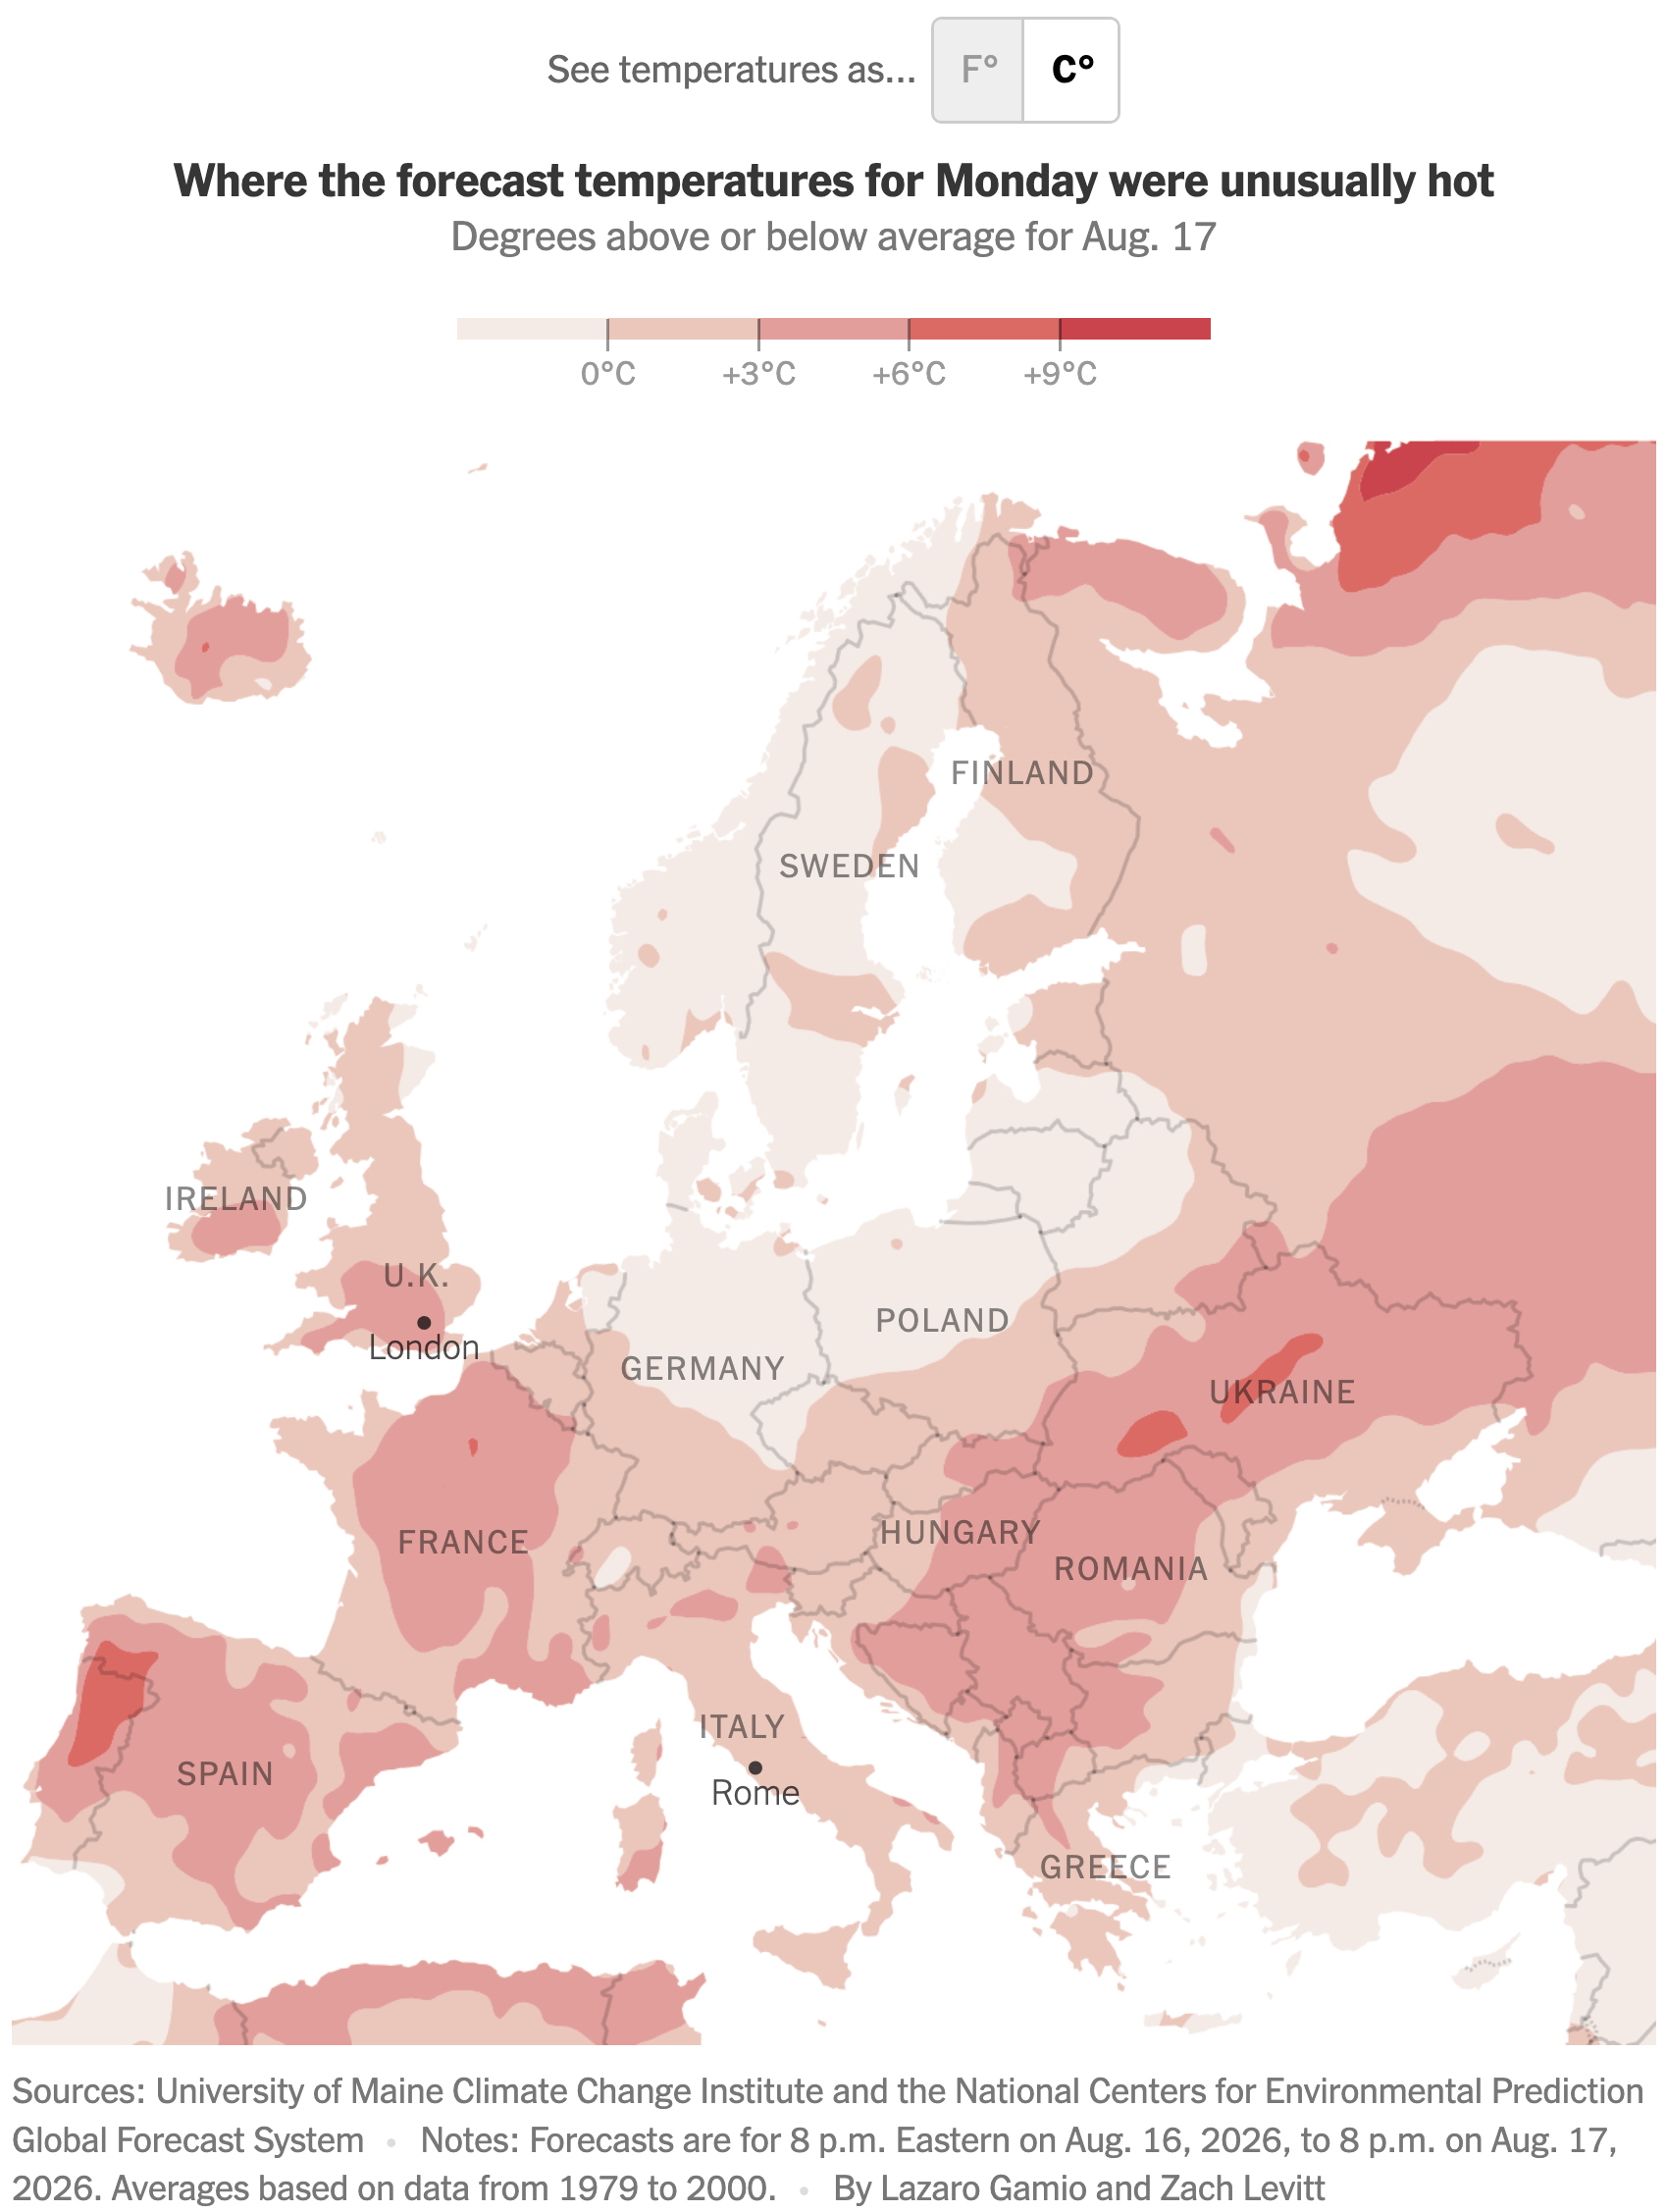
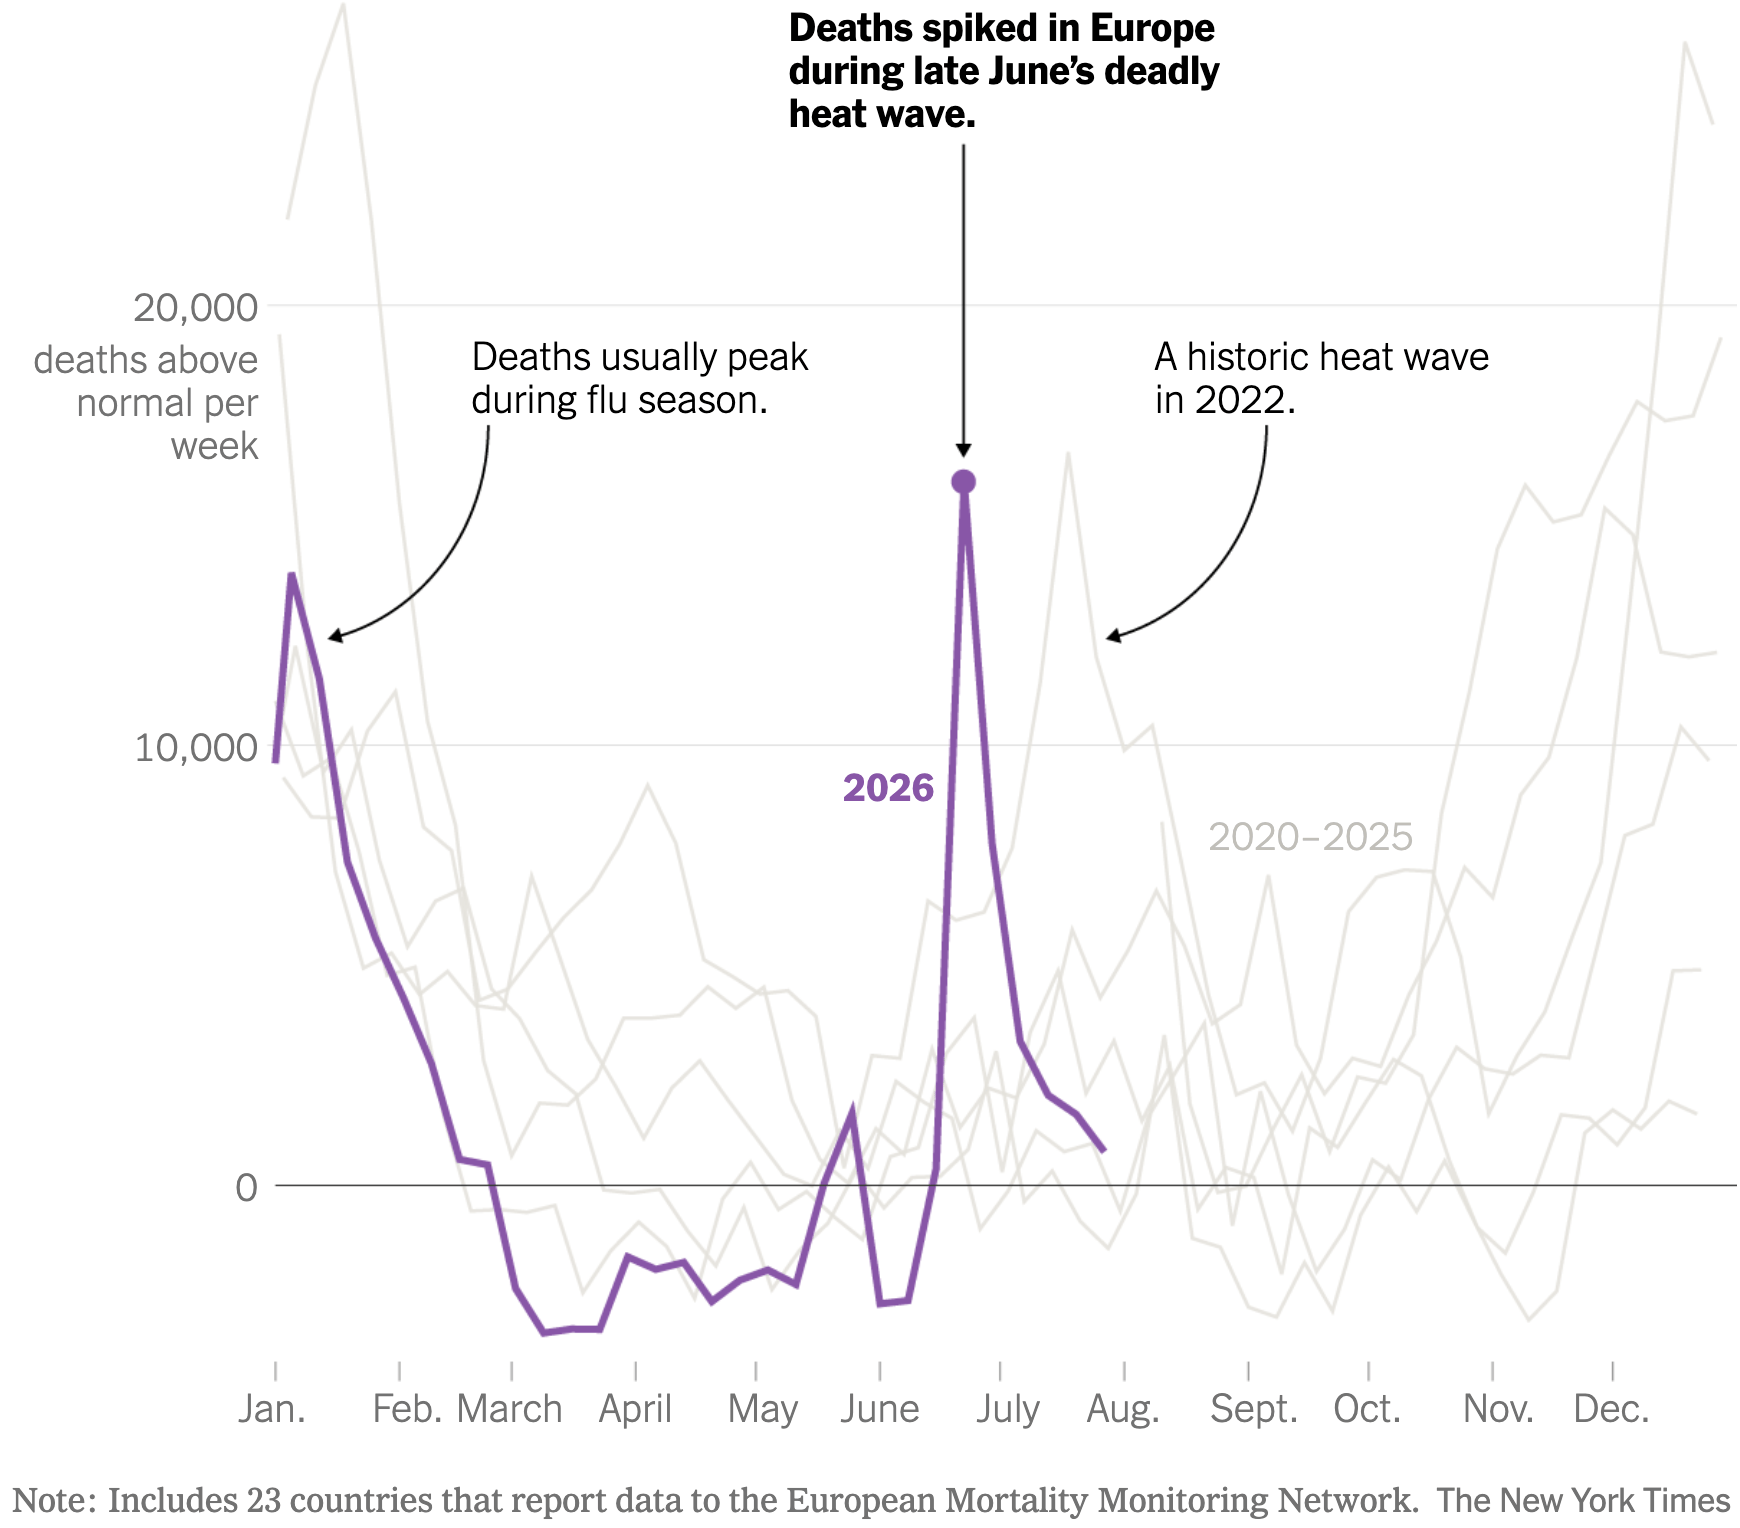
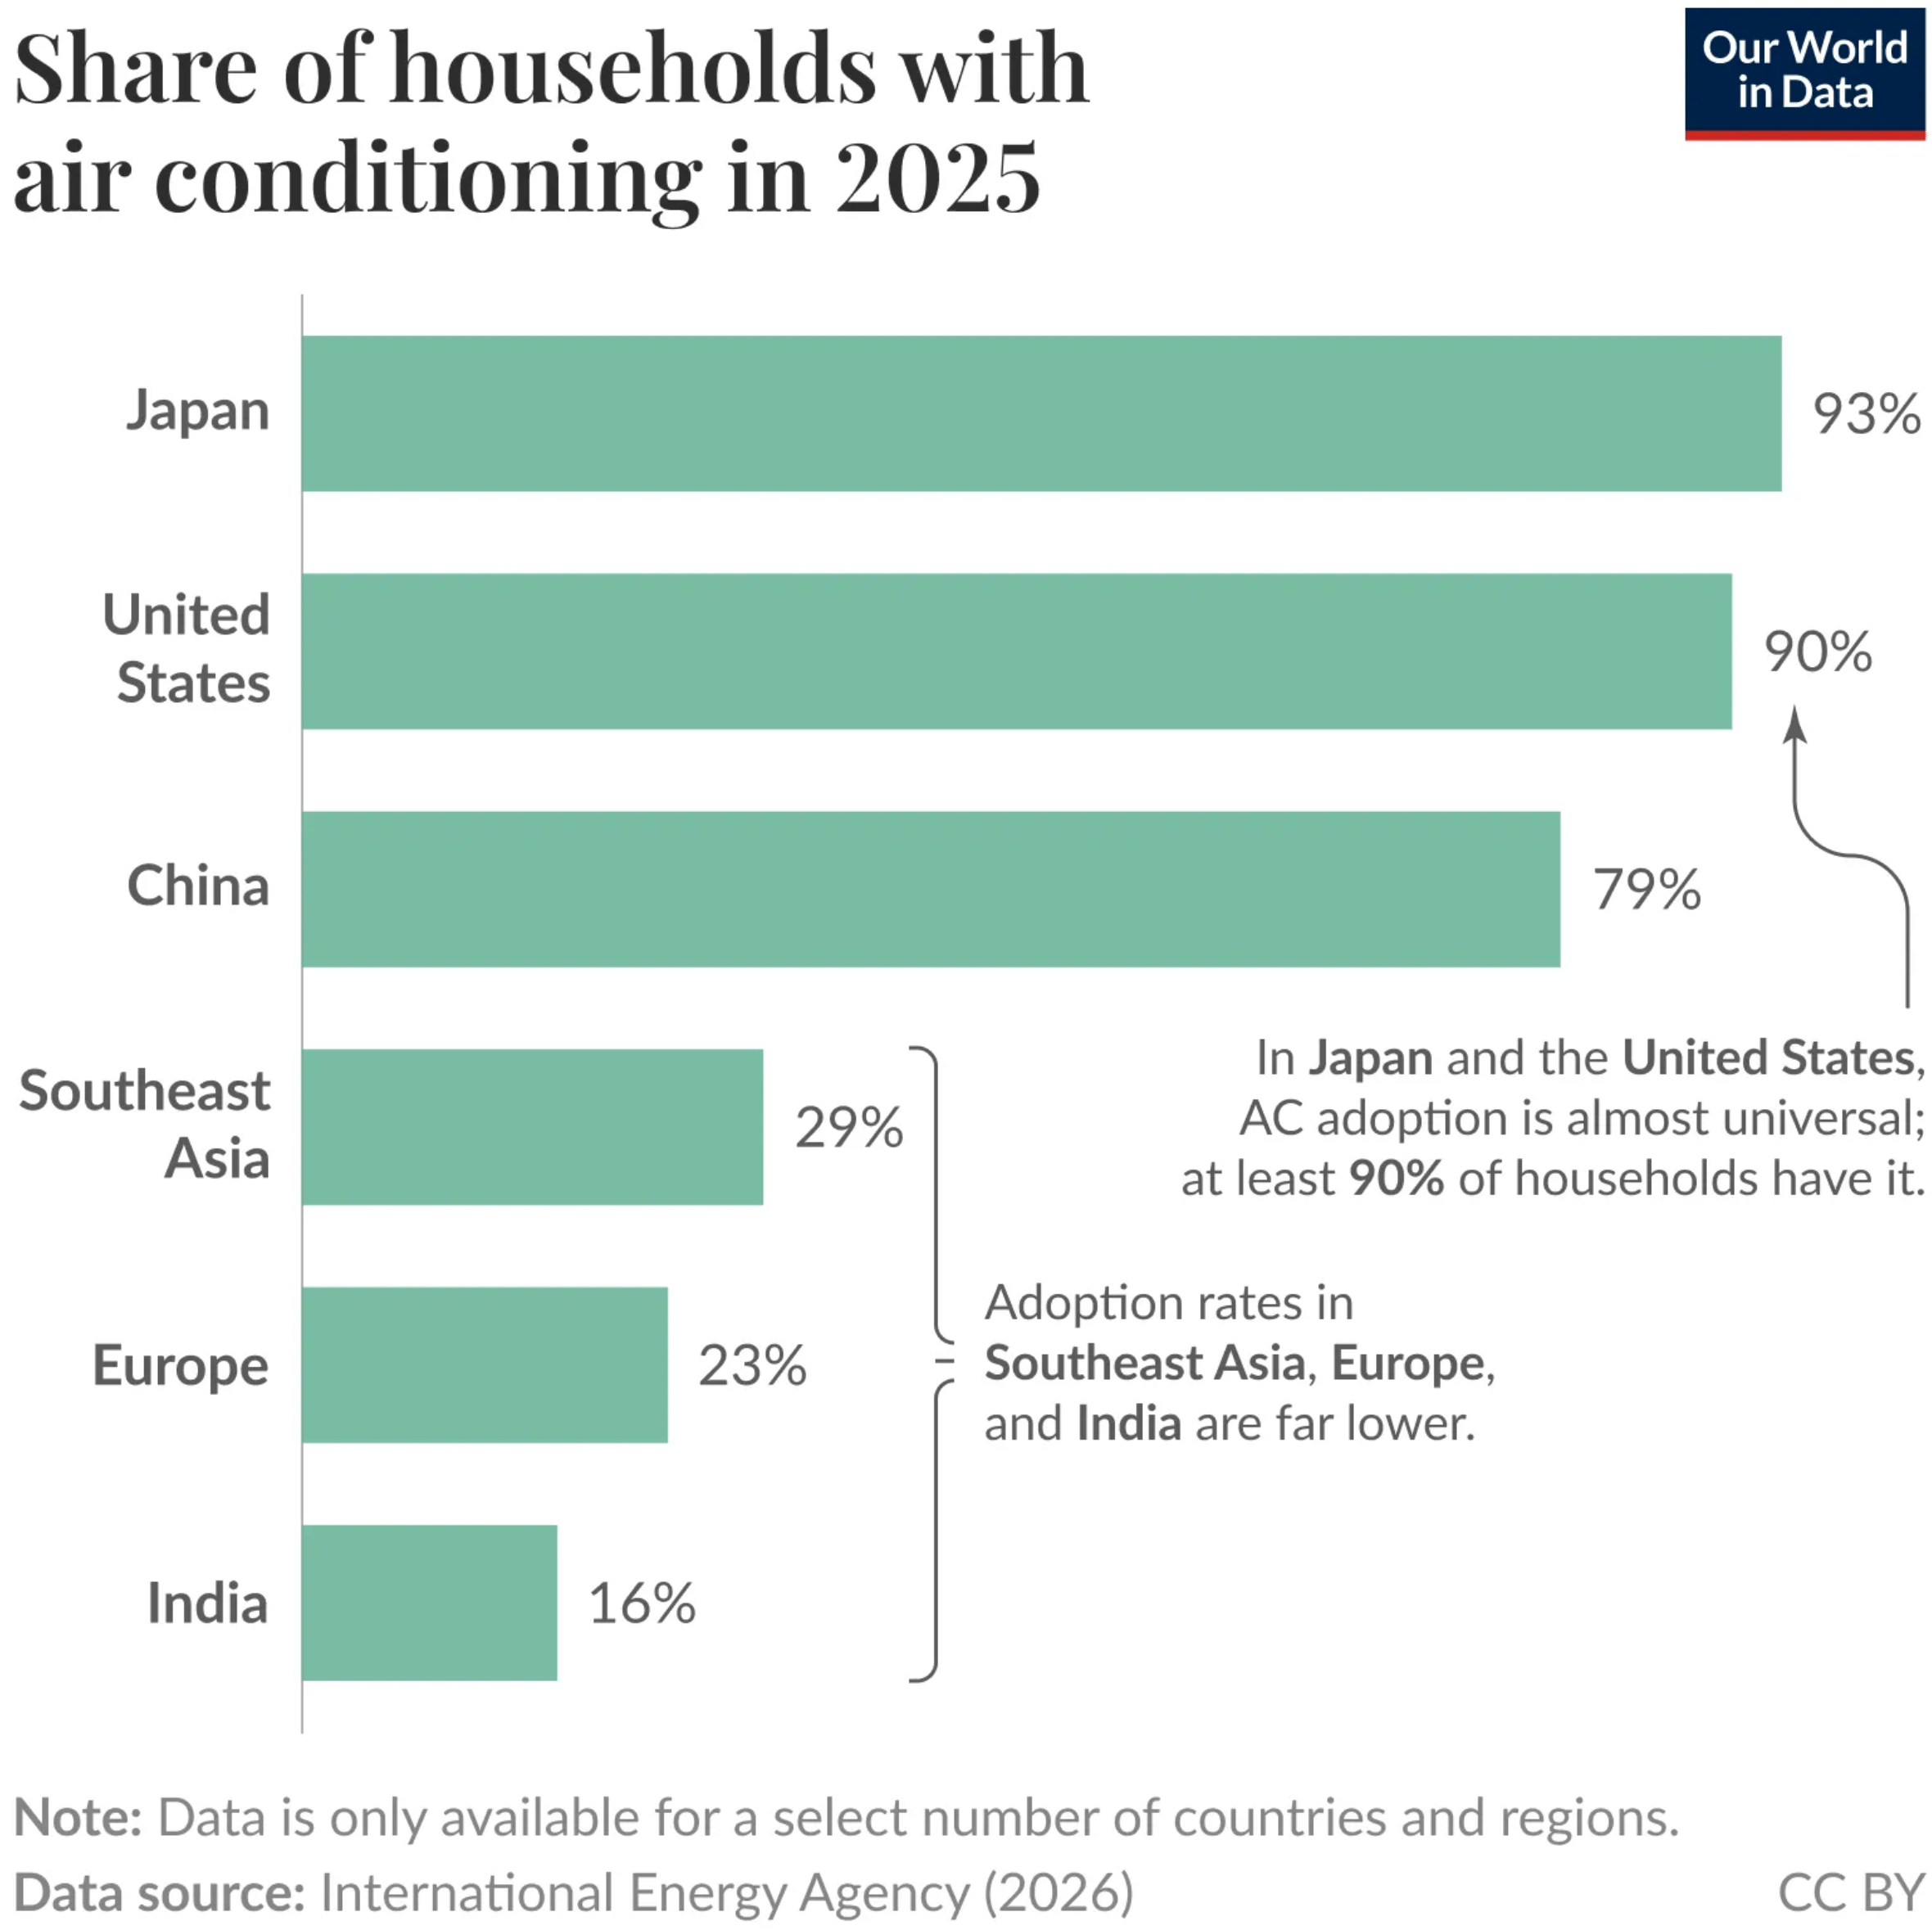
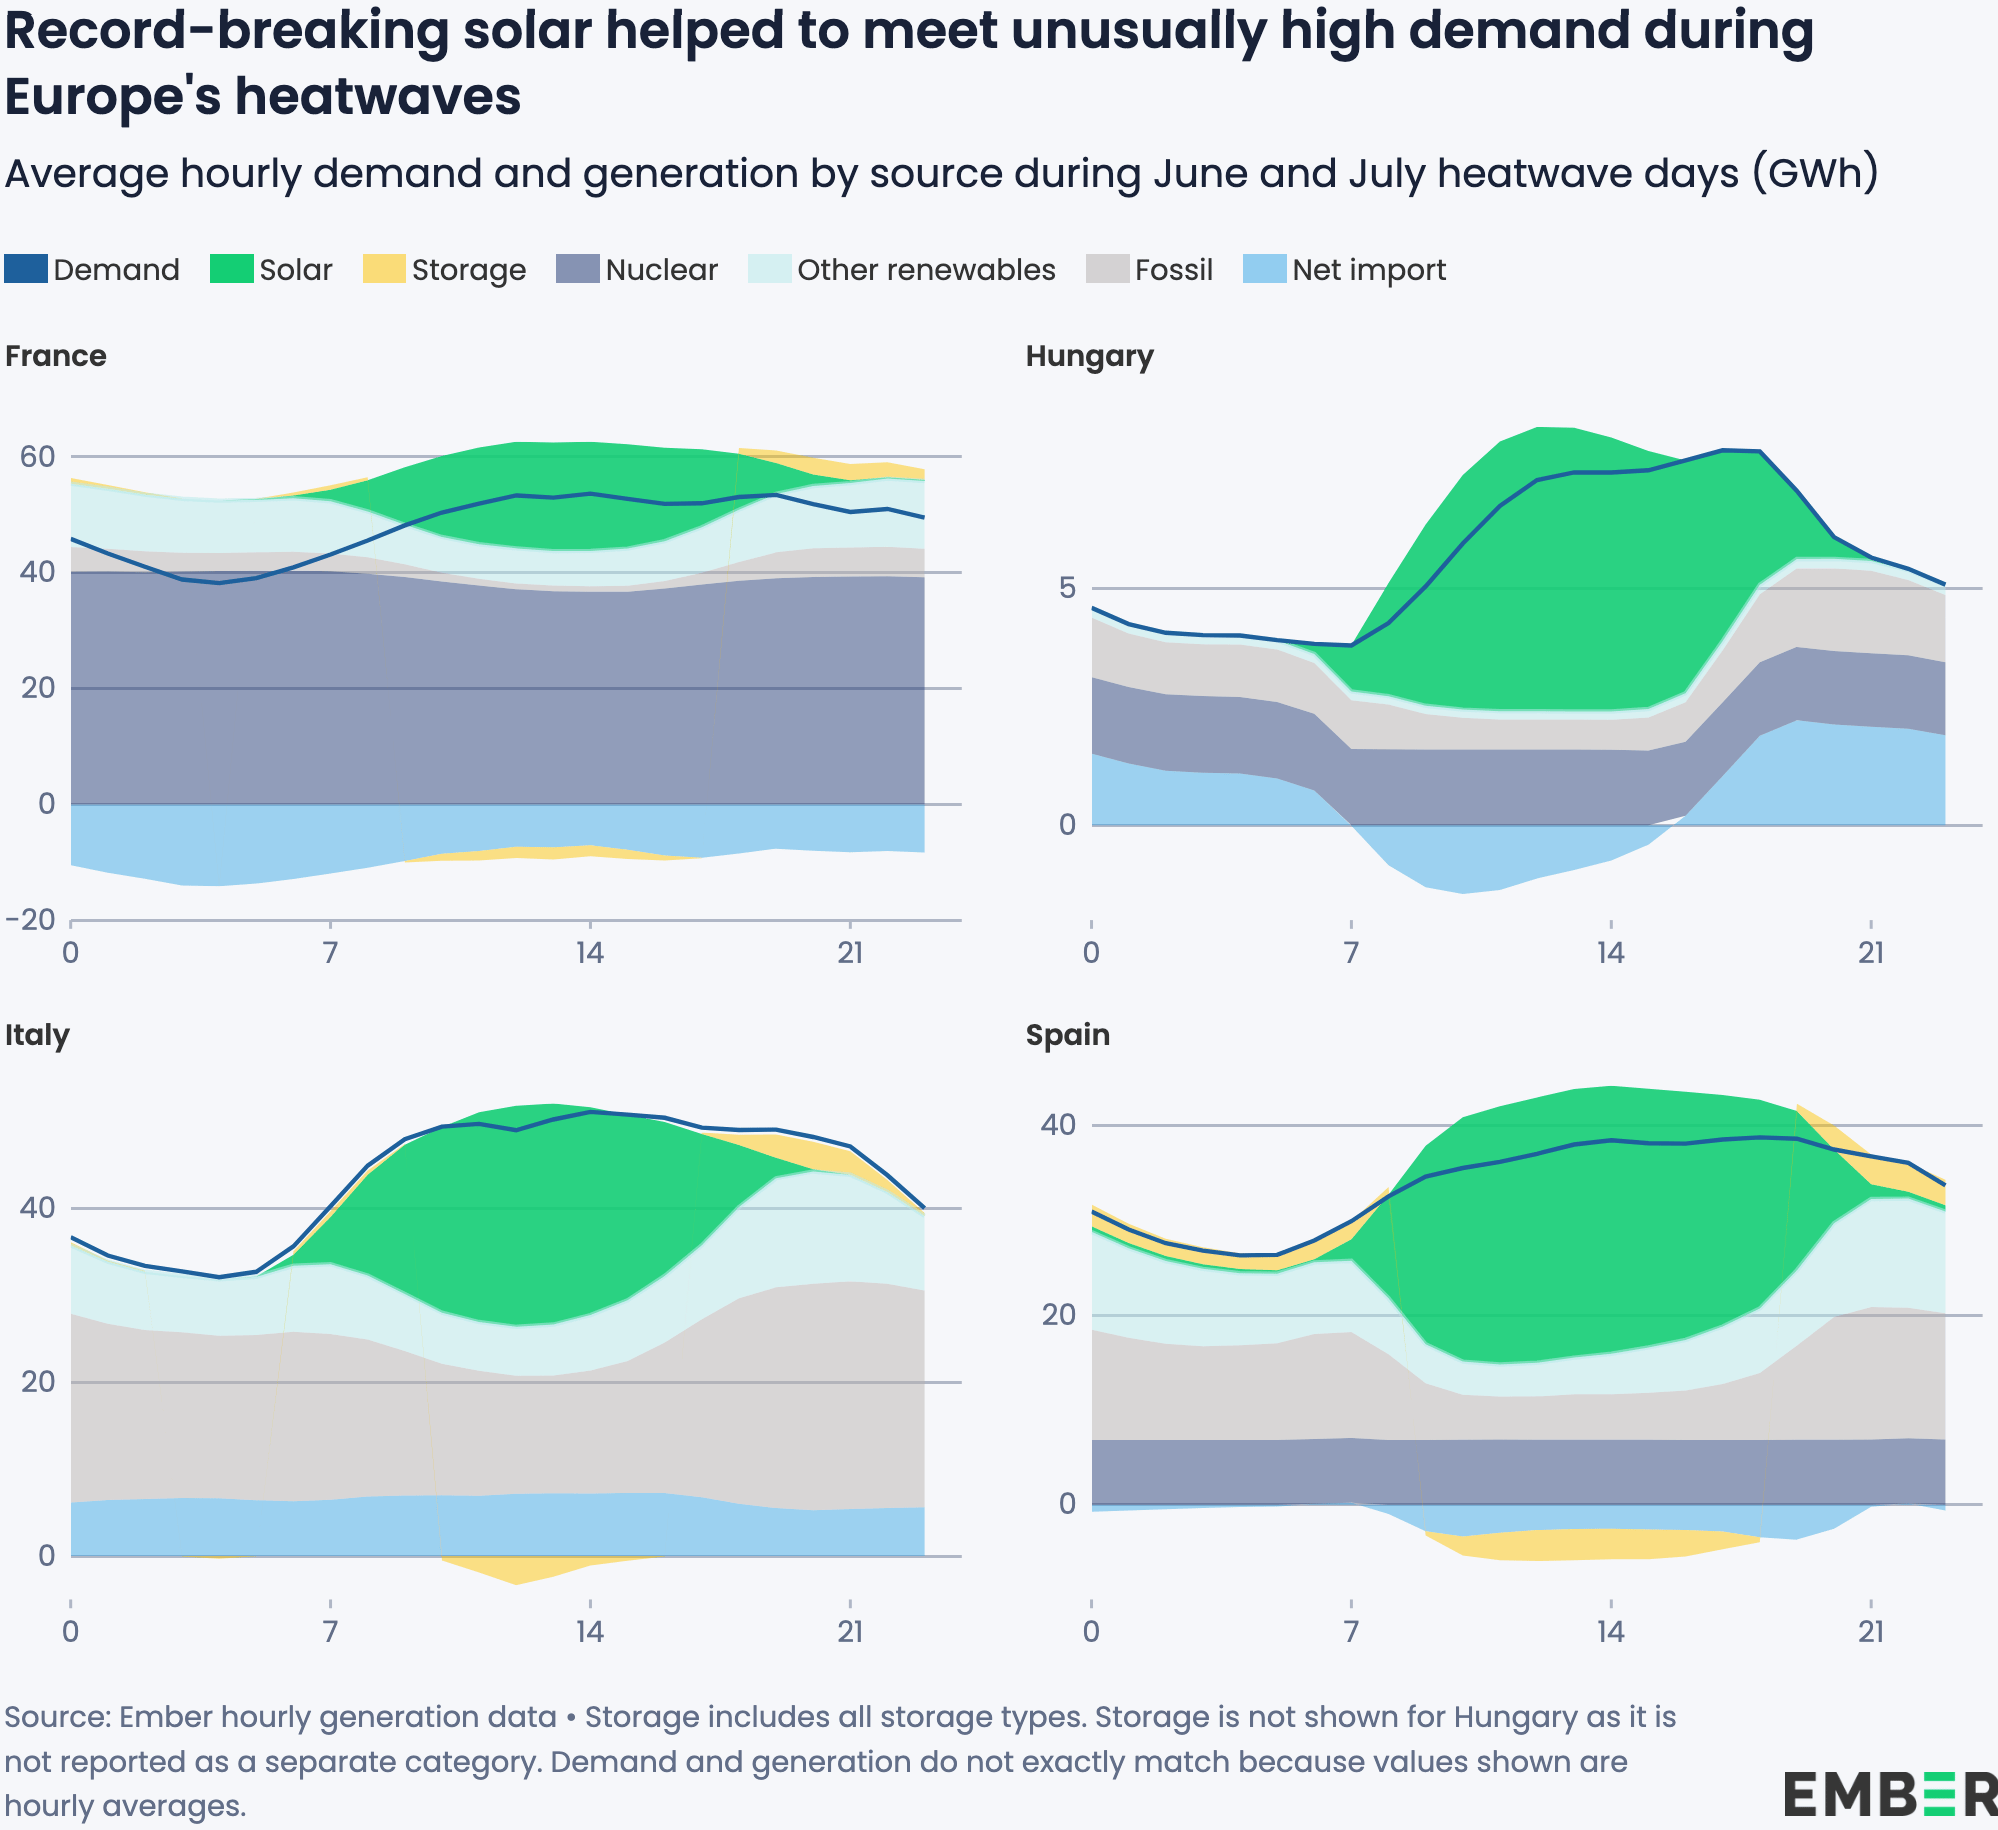
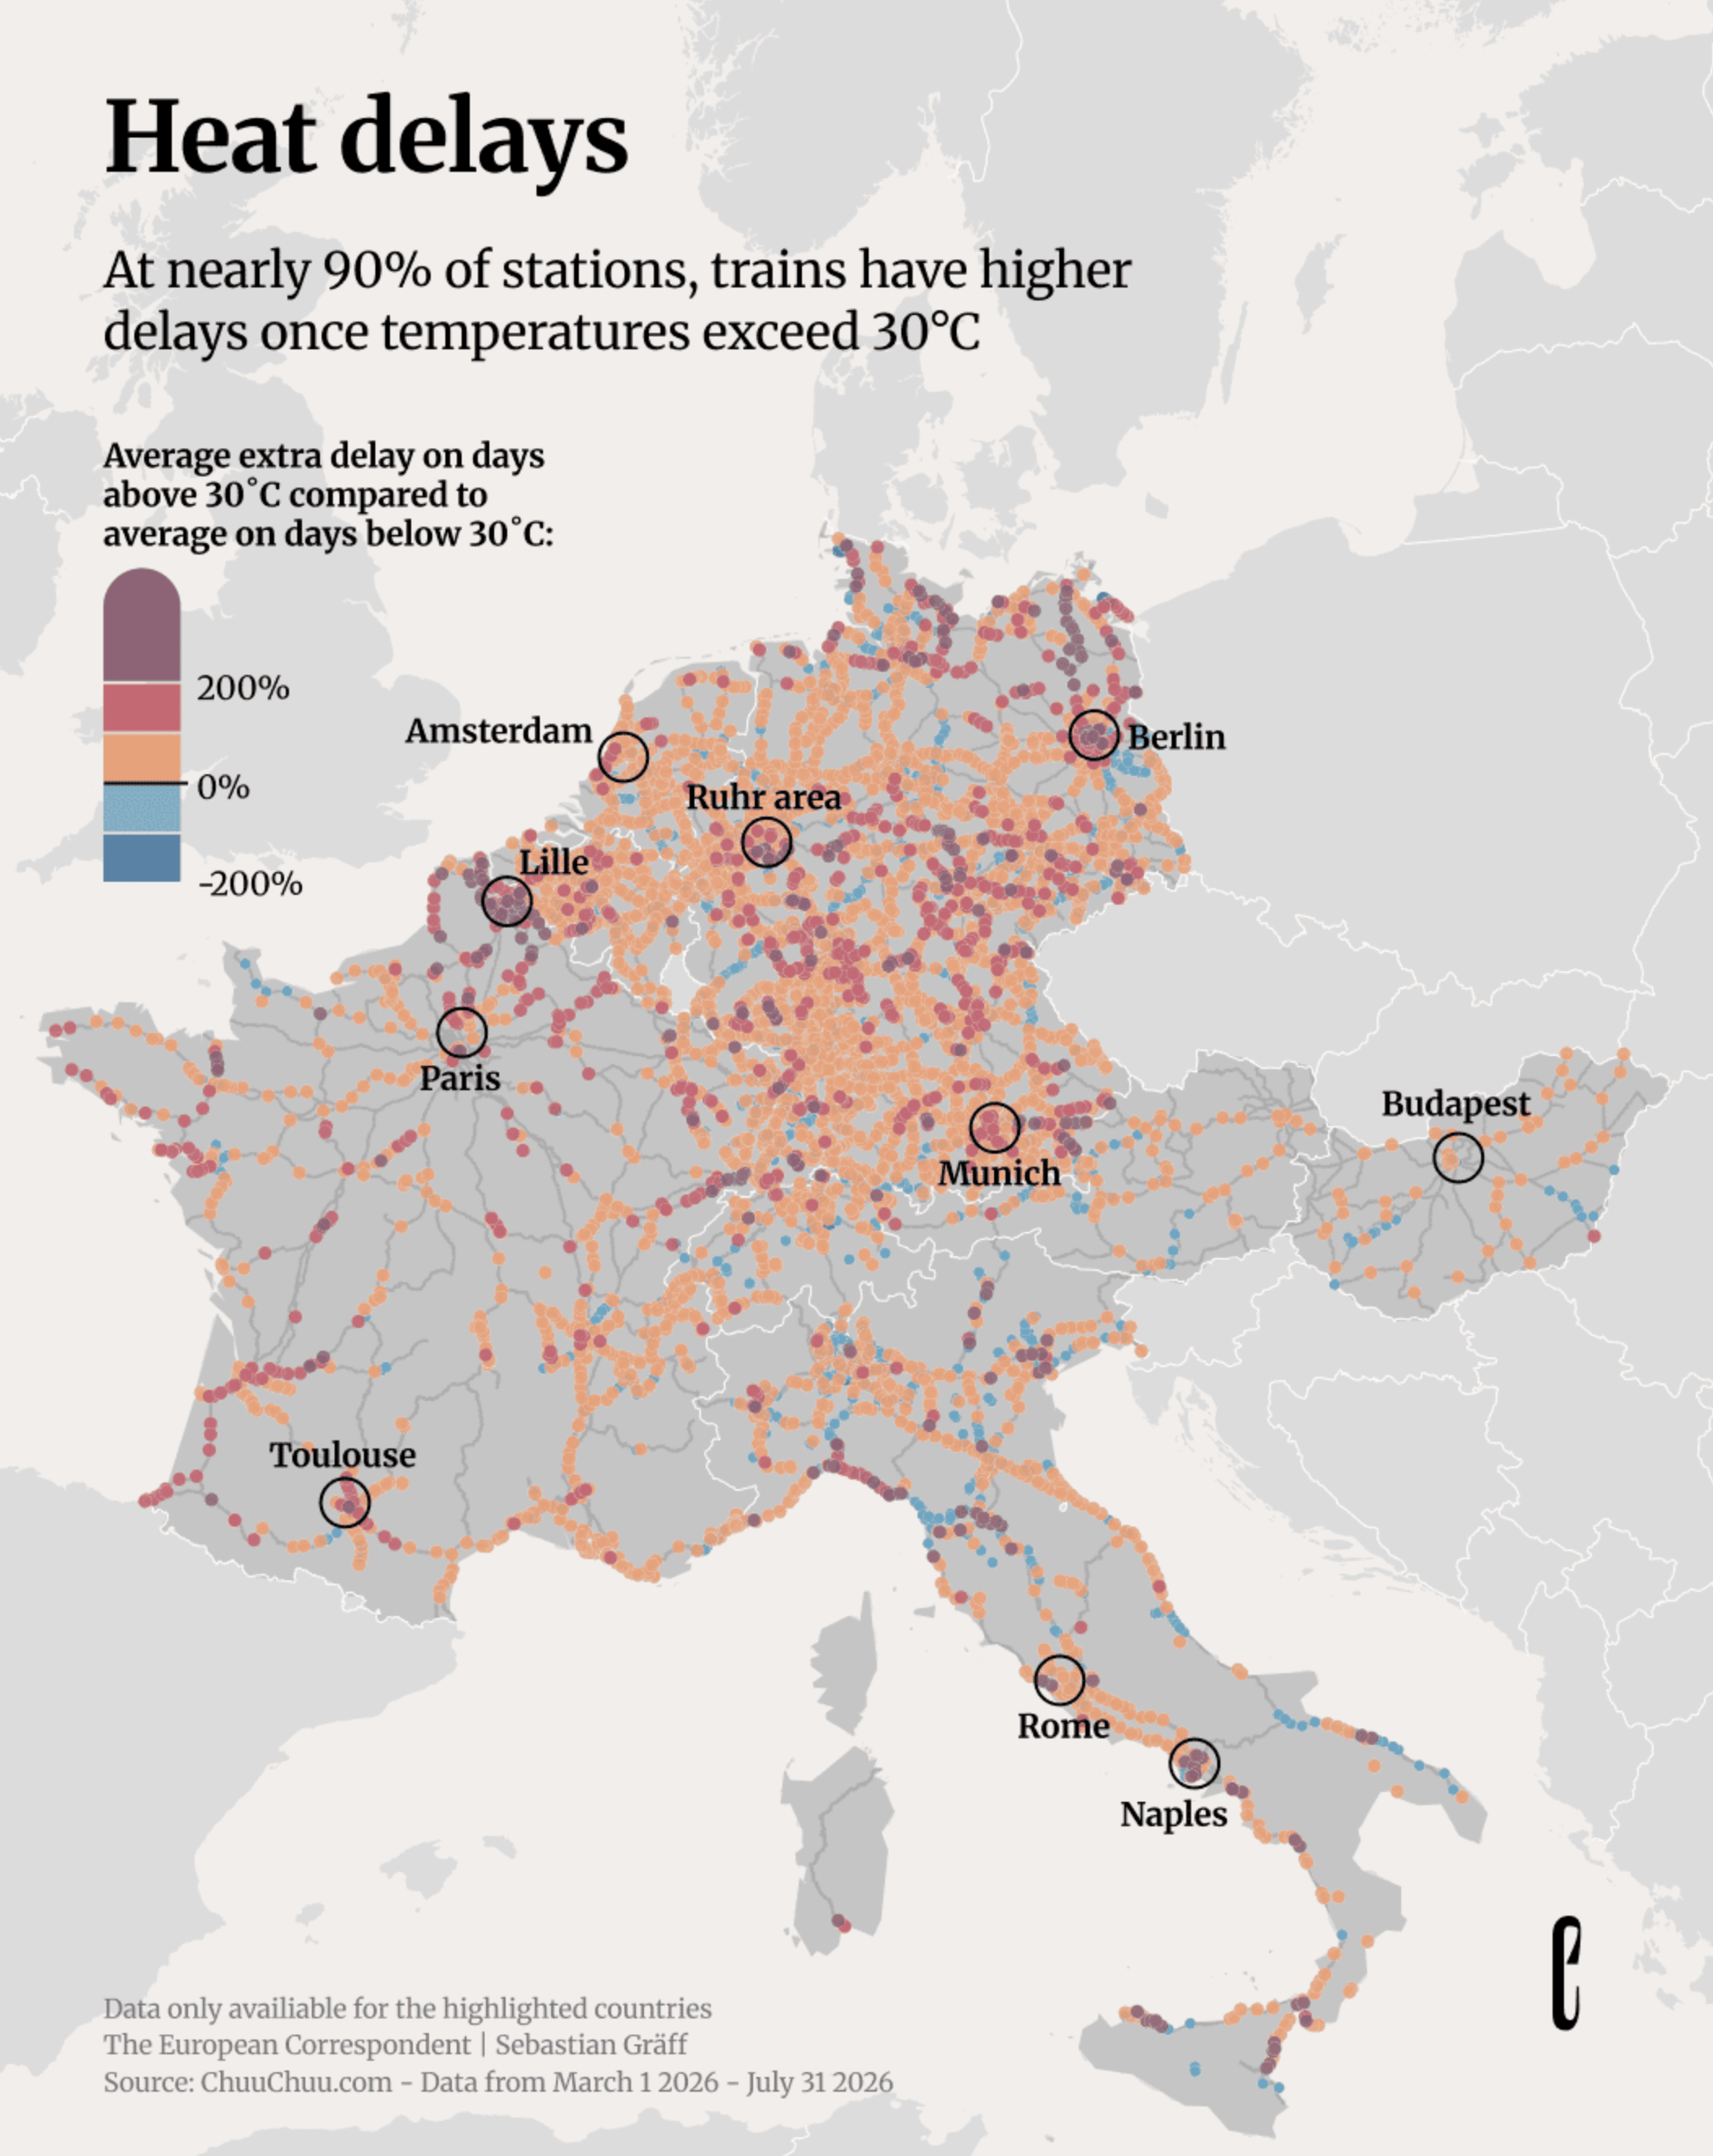
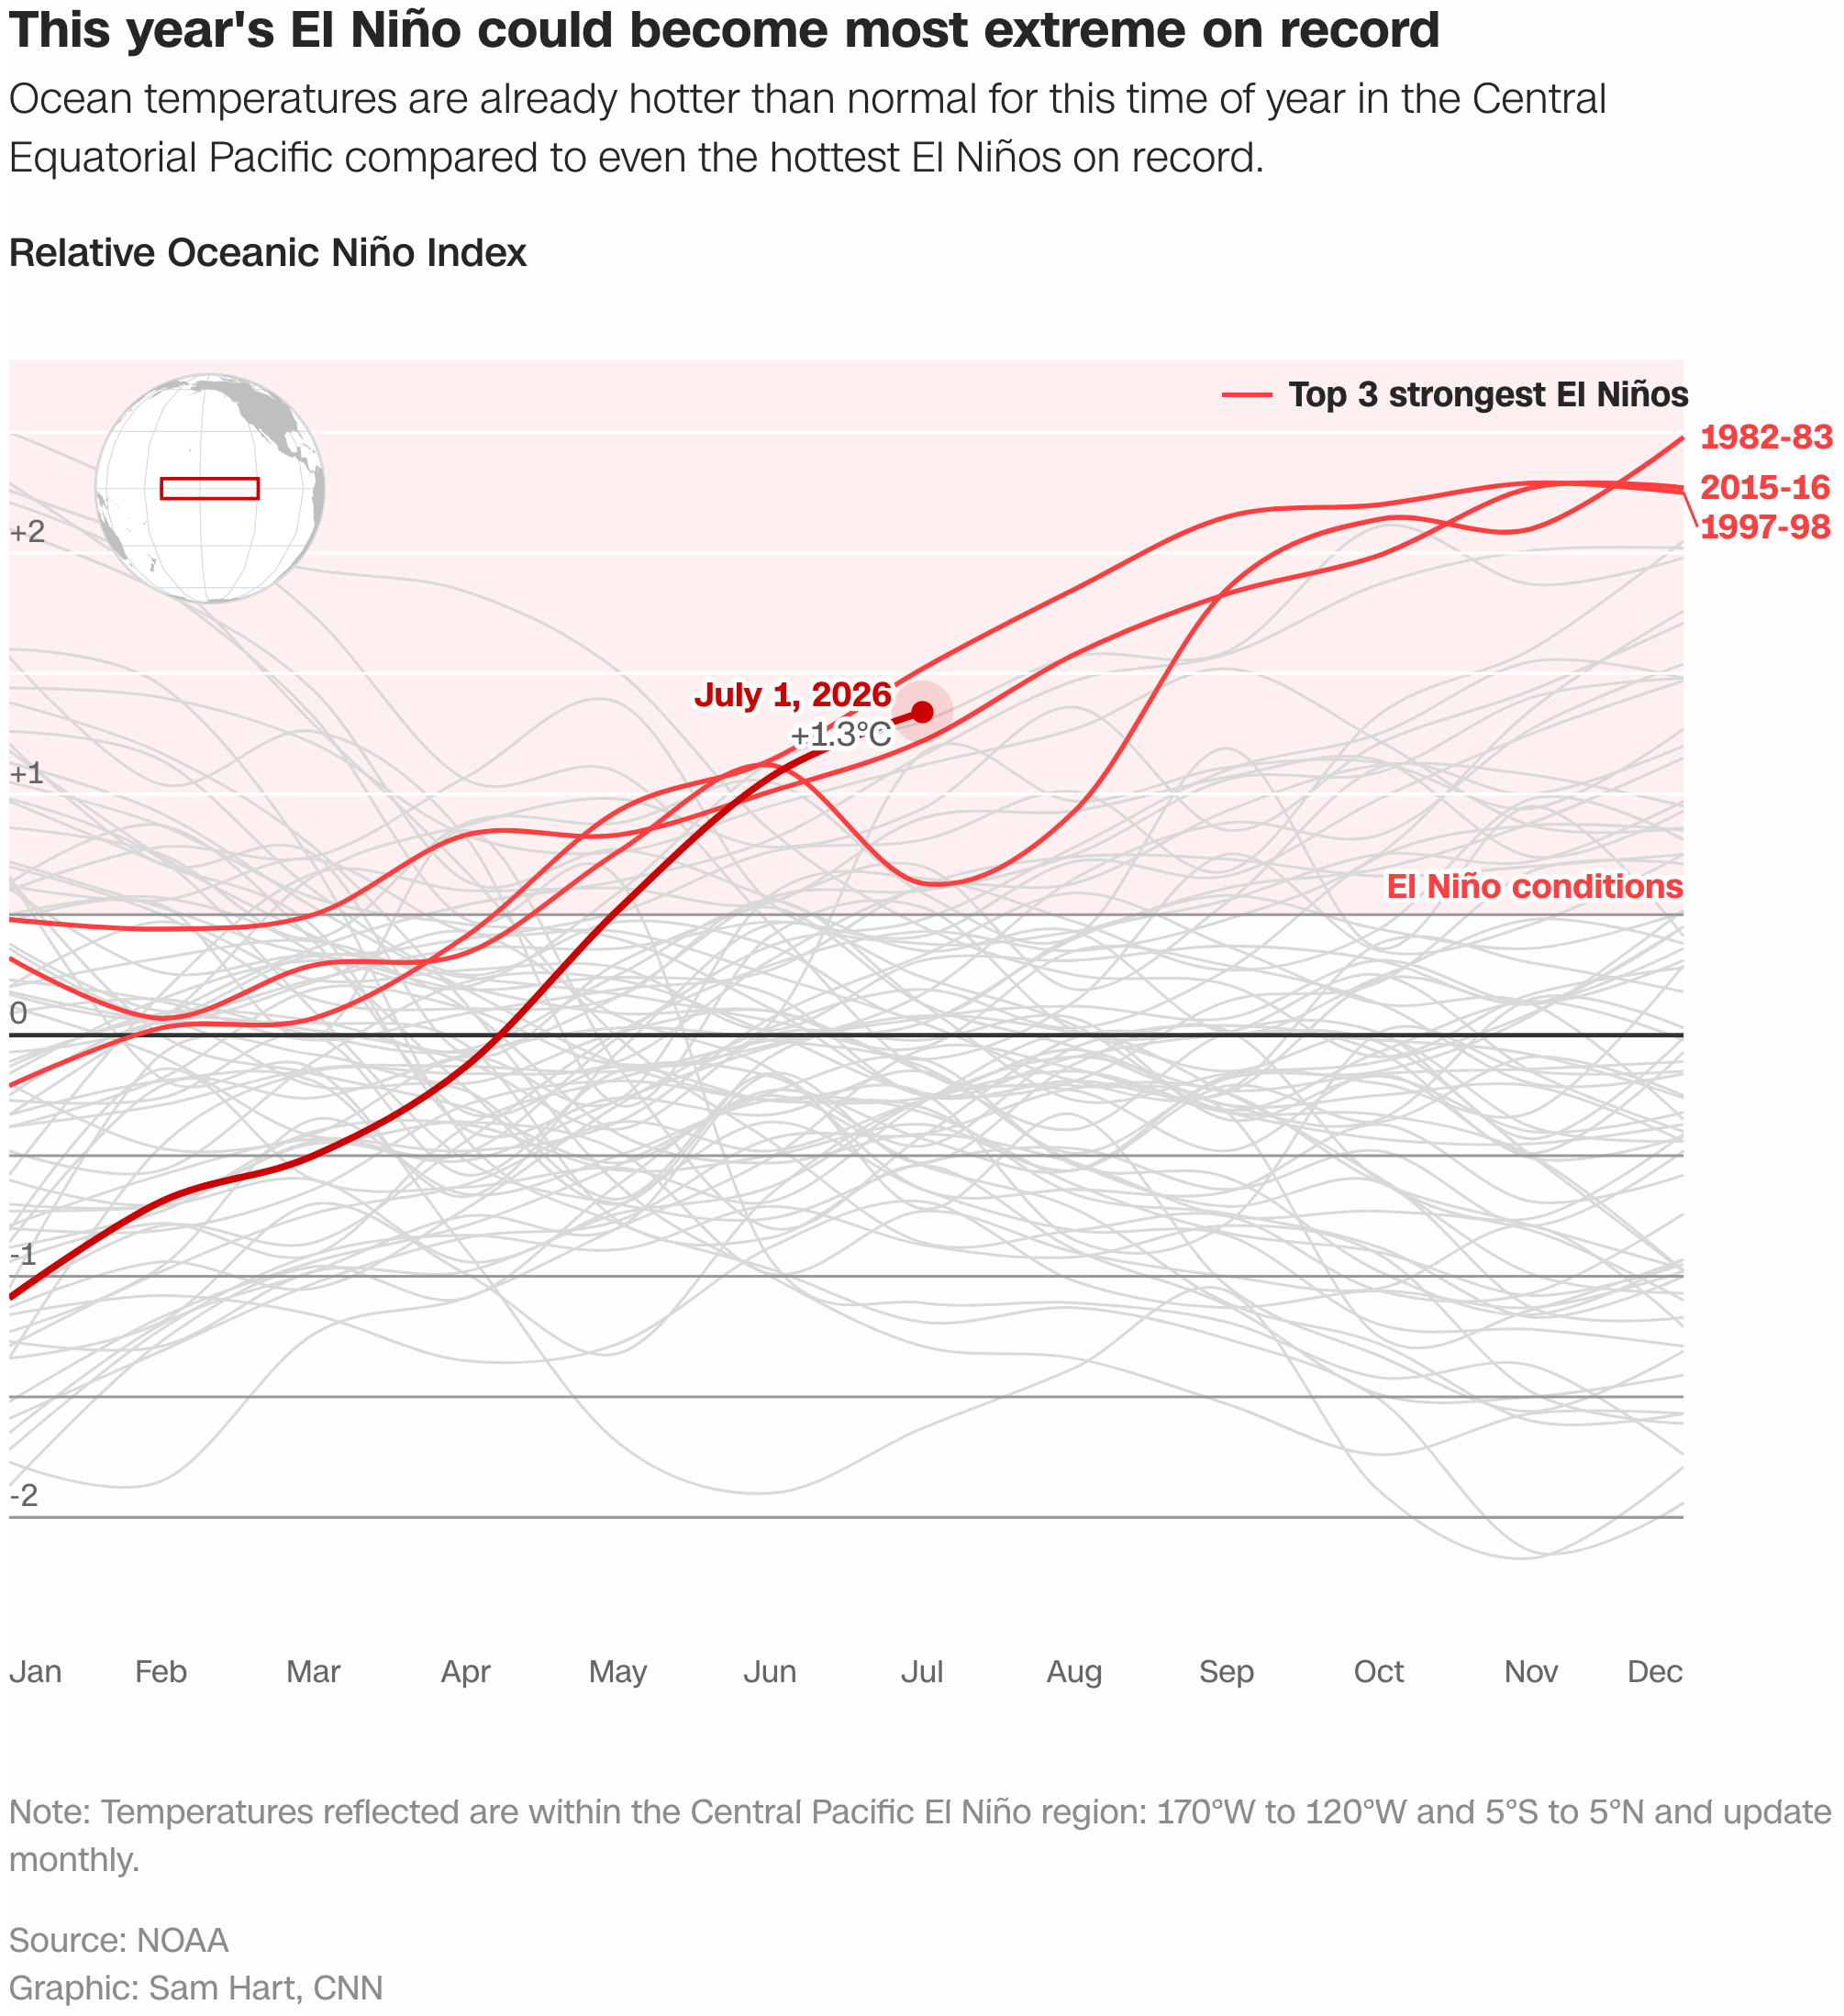
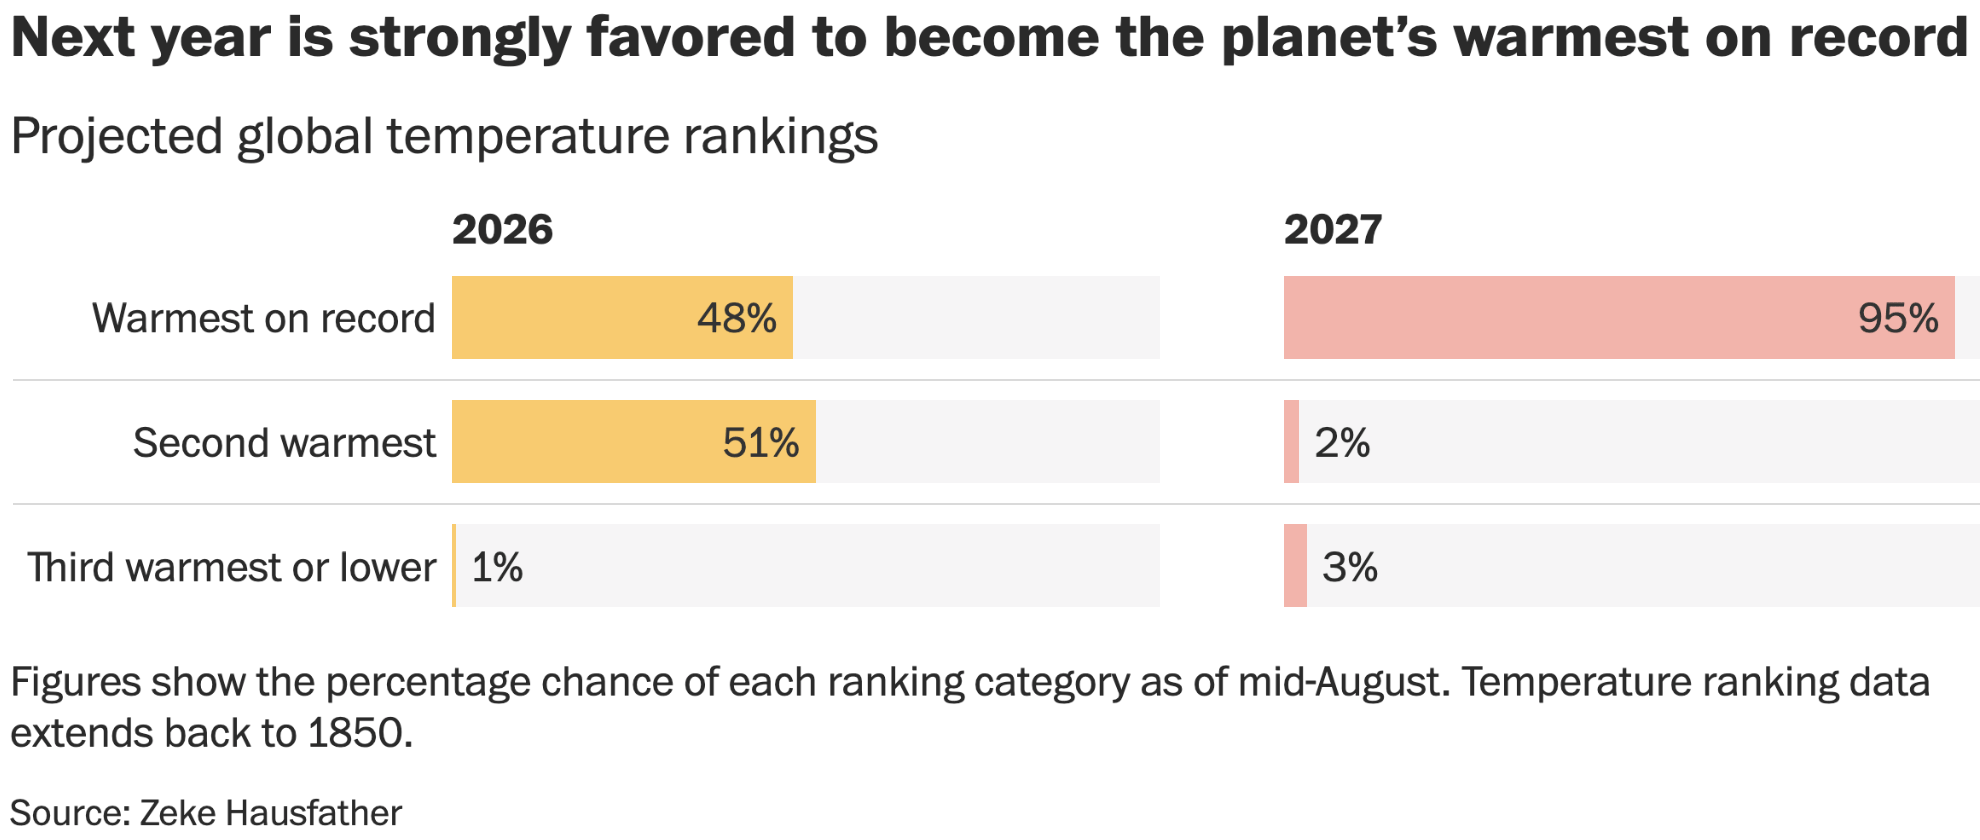
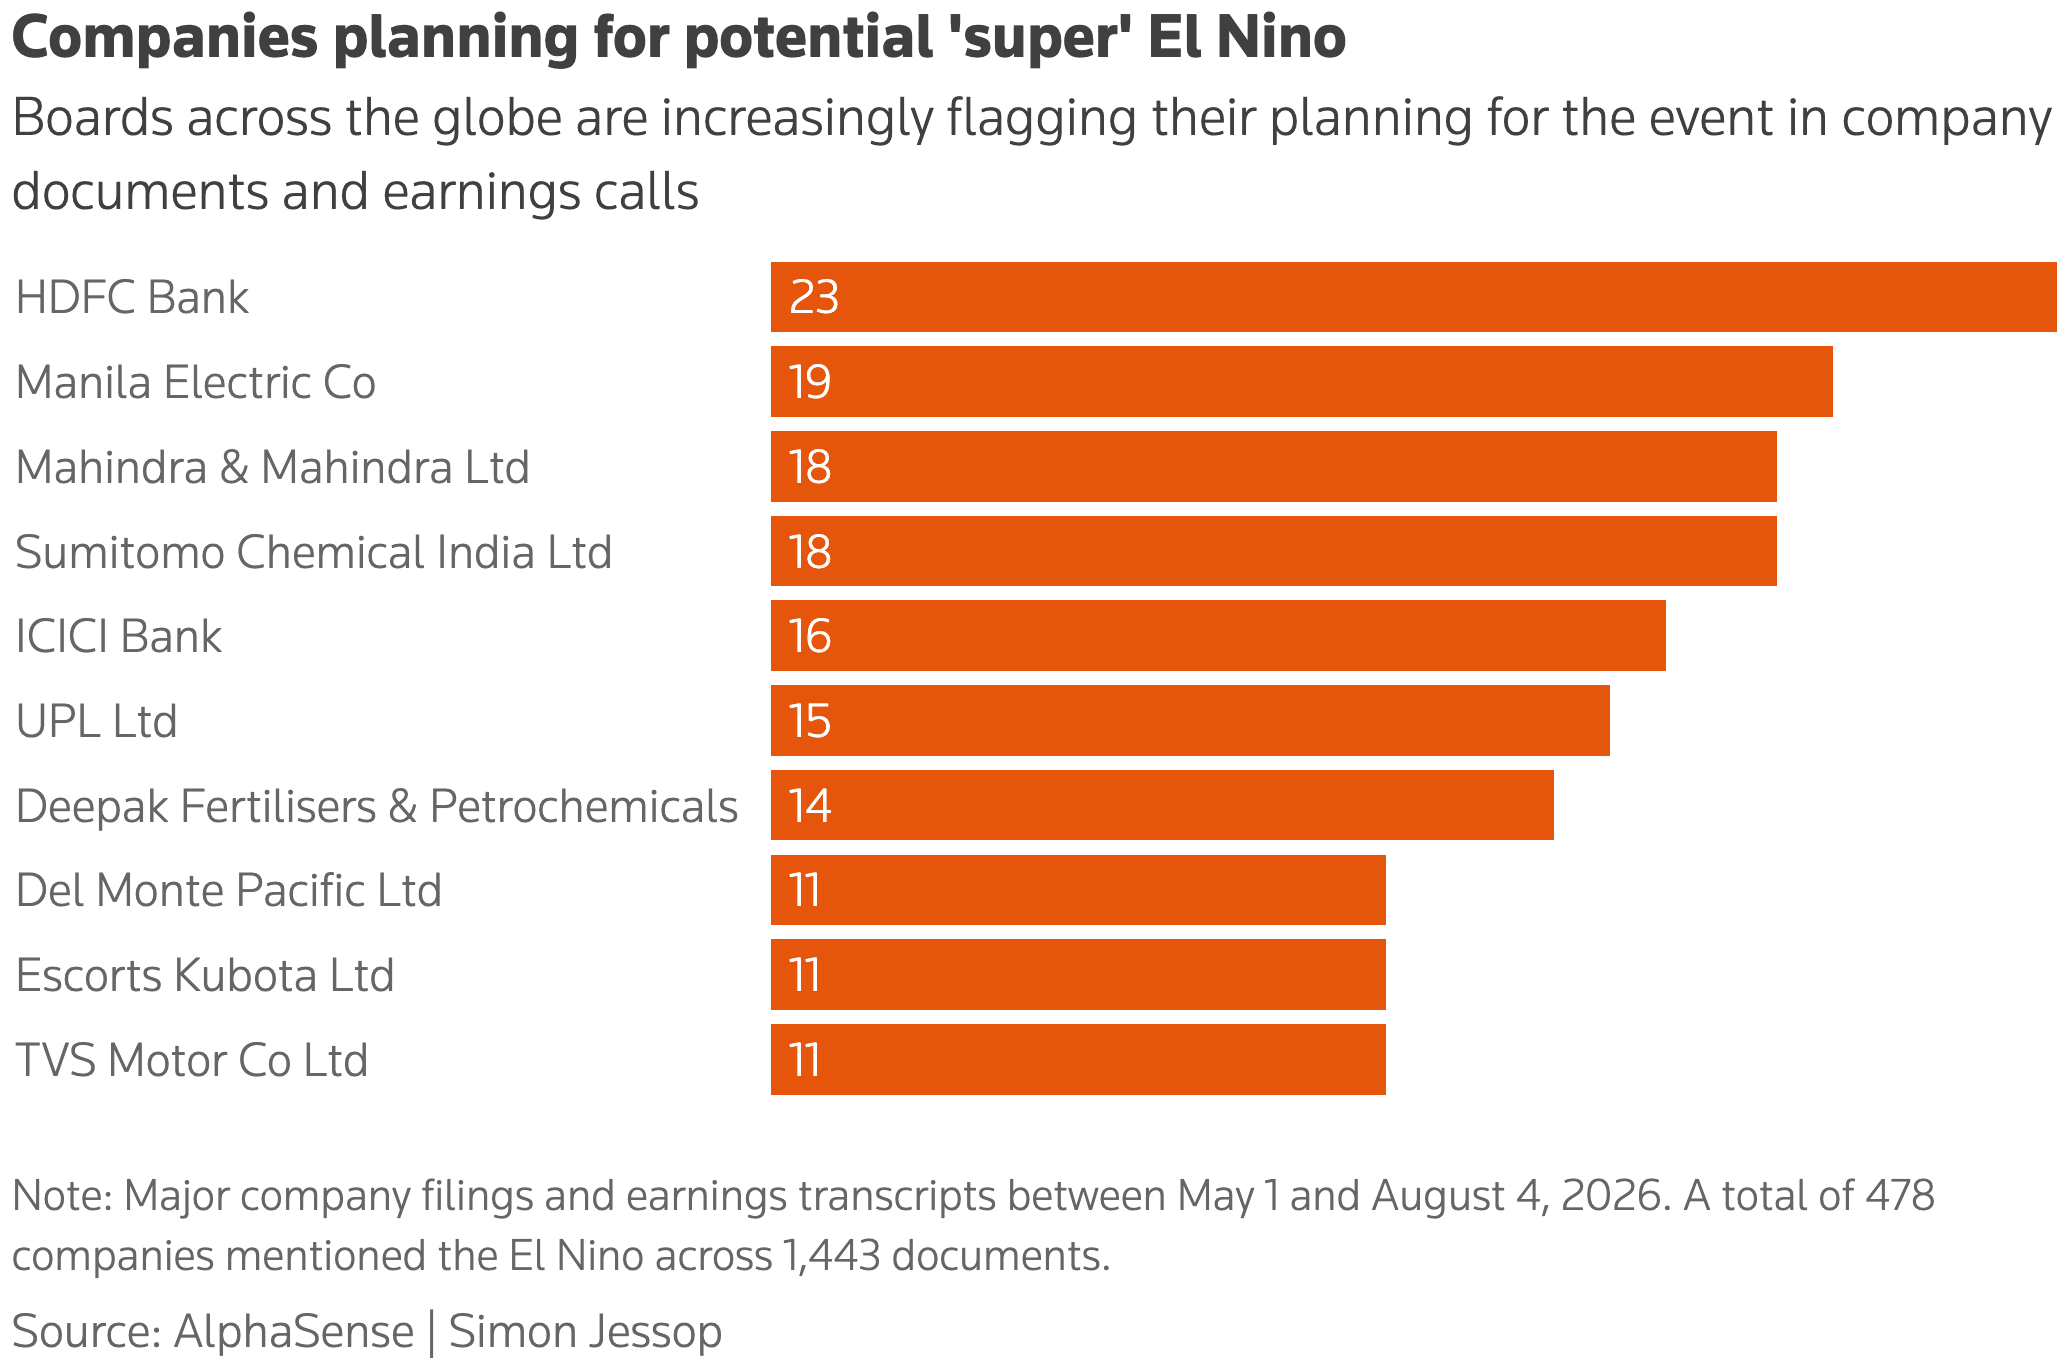
And the heat isn't done yet: a record El Niño is expected to warm the planet over the next few seasons, and companies are starting to prepare for it.

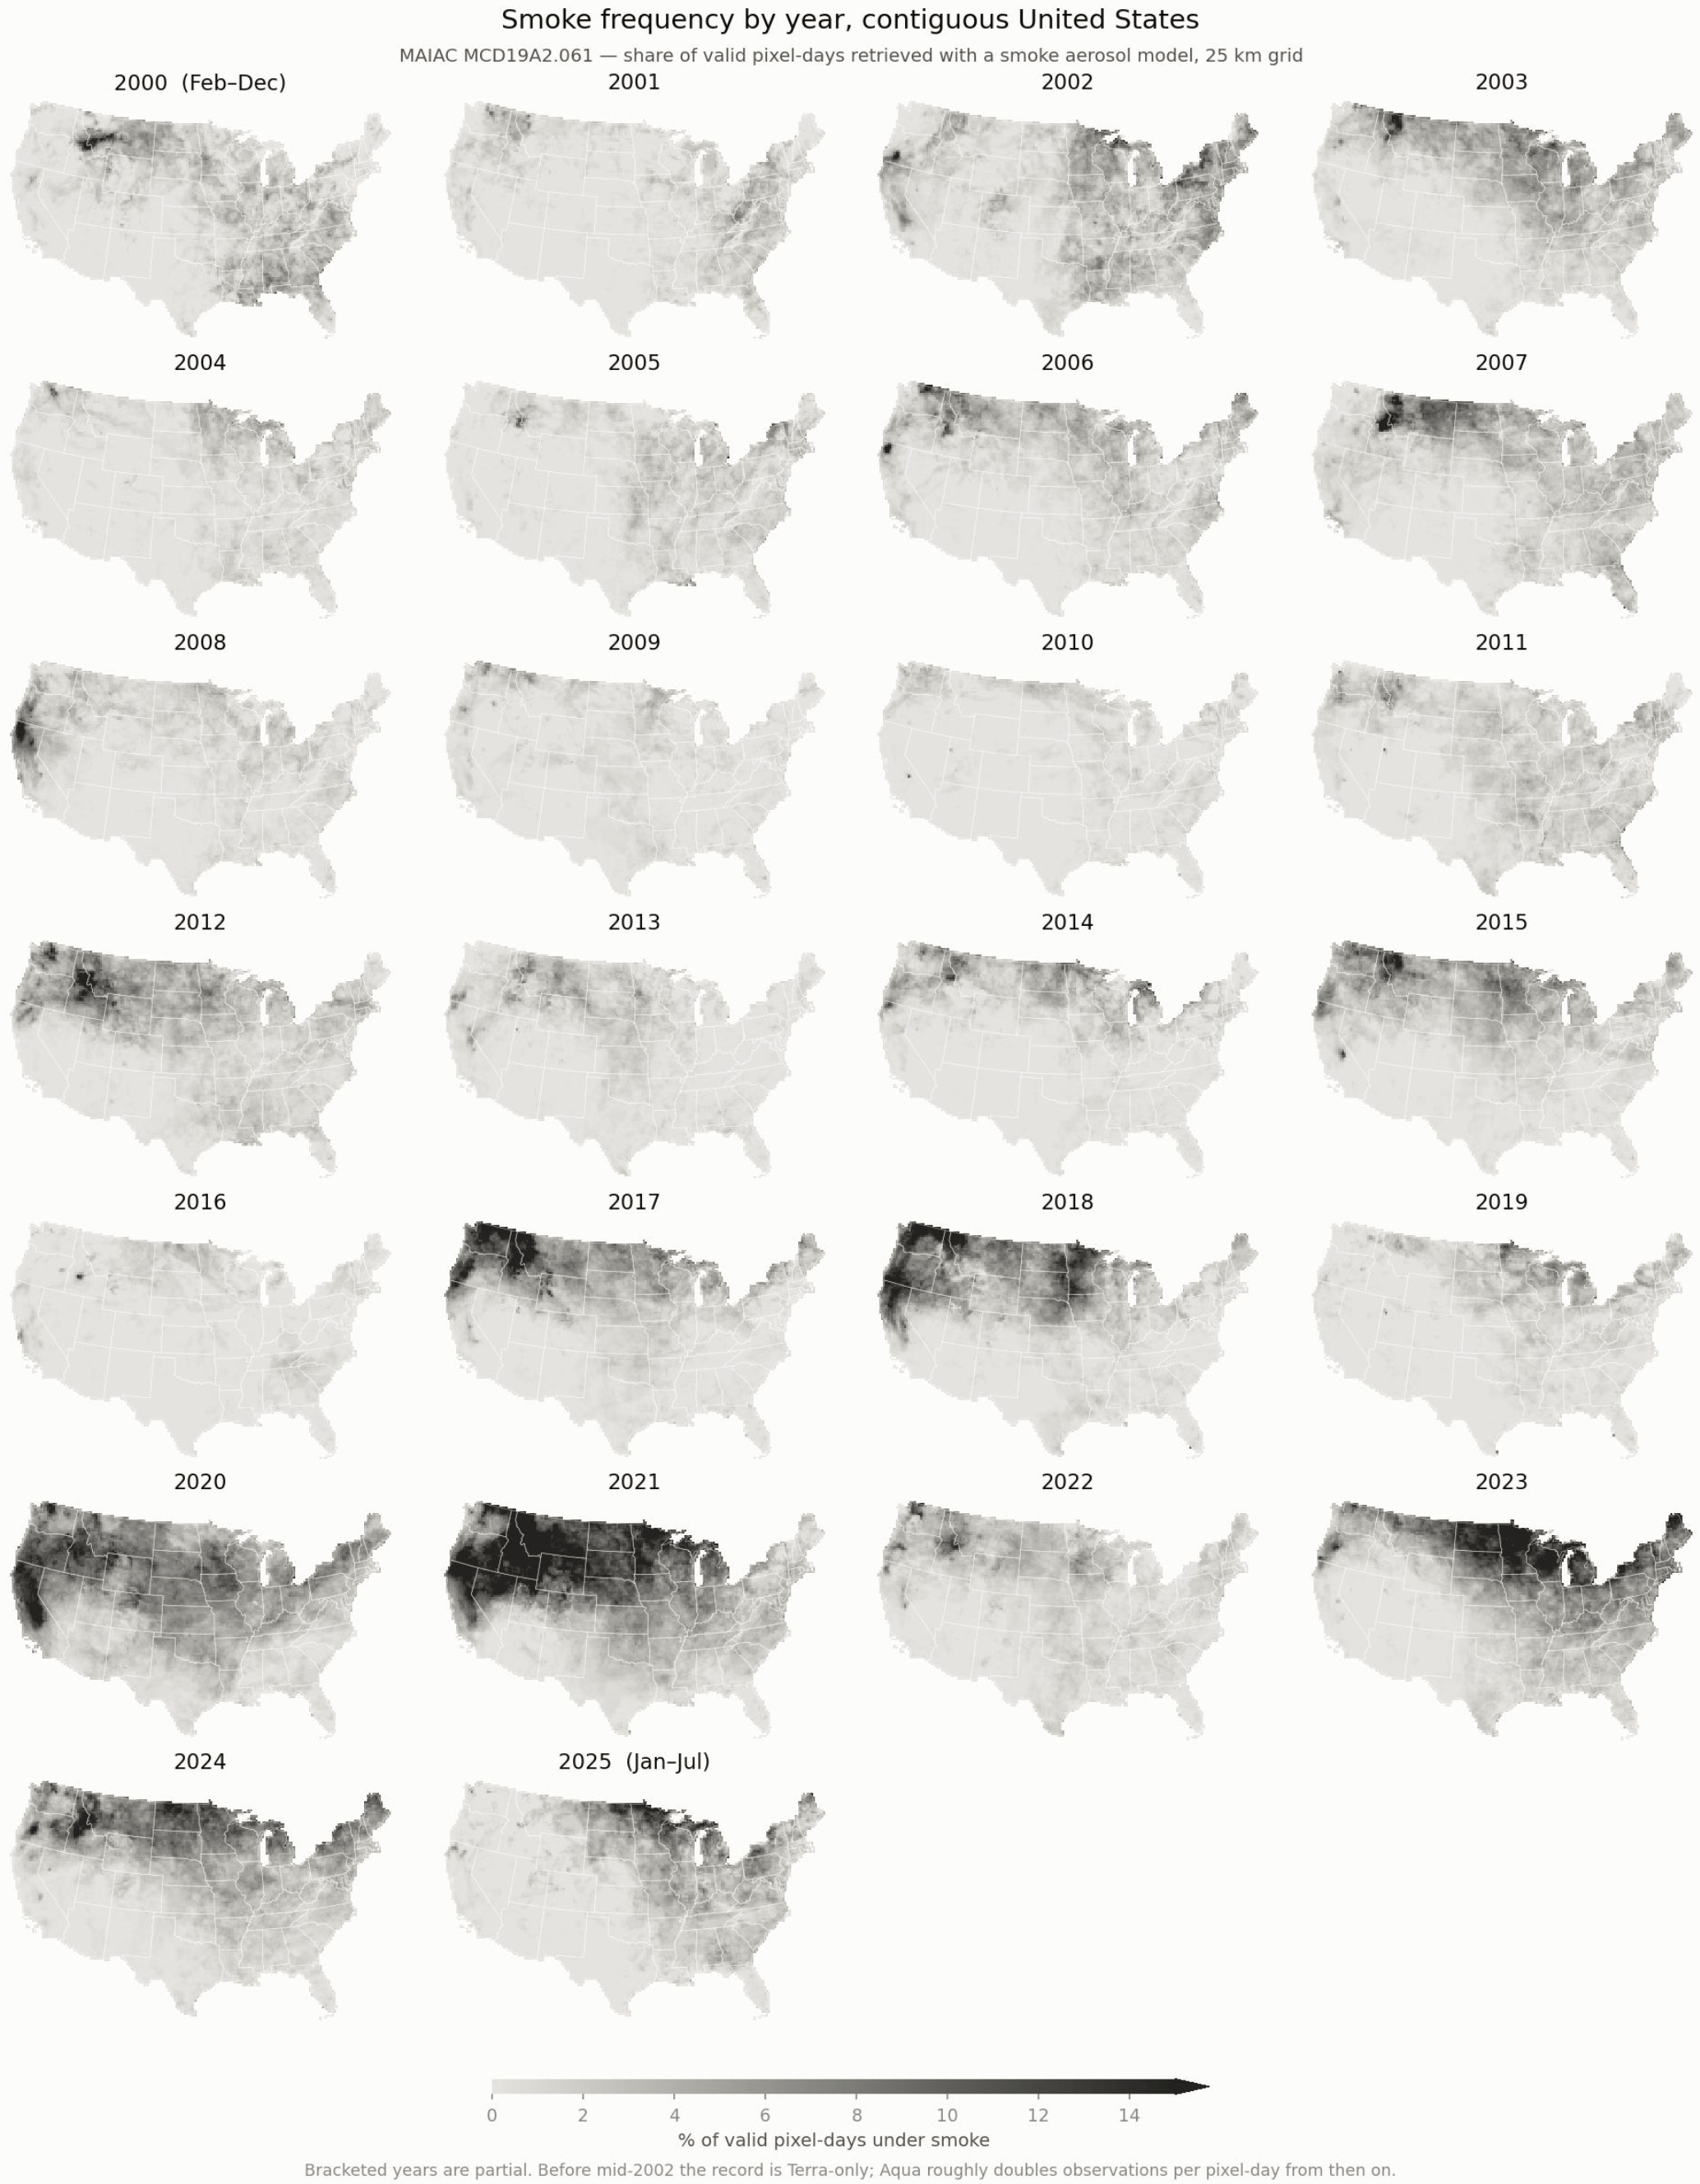
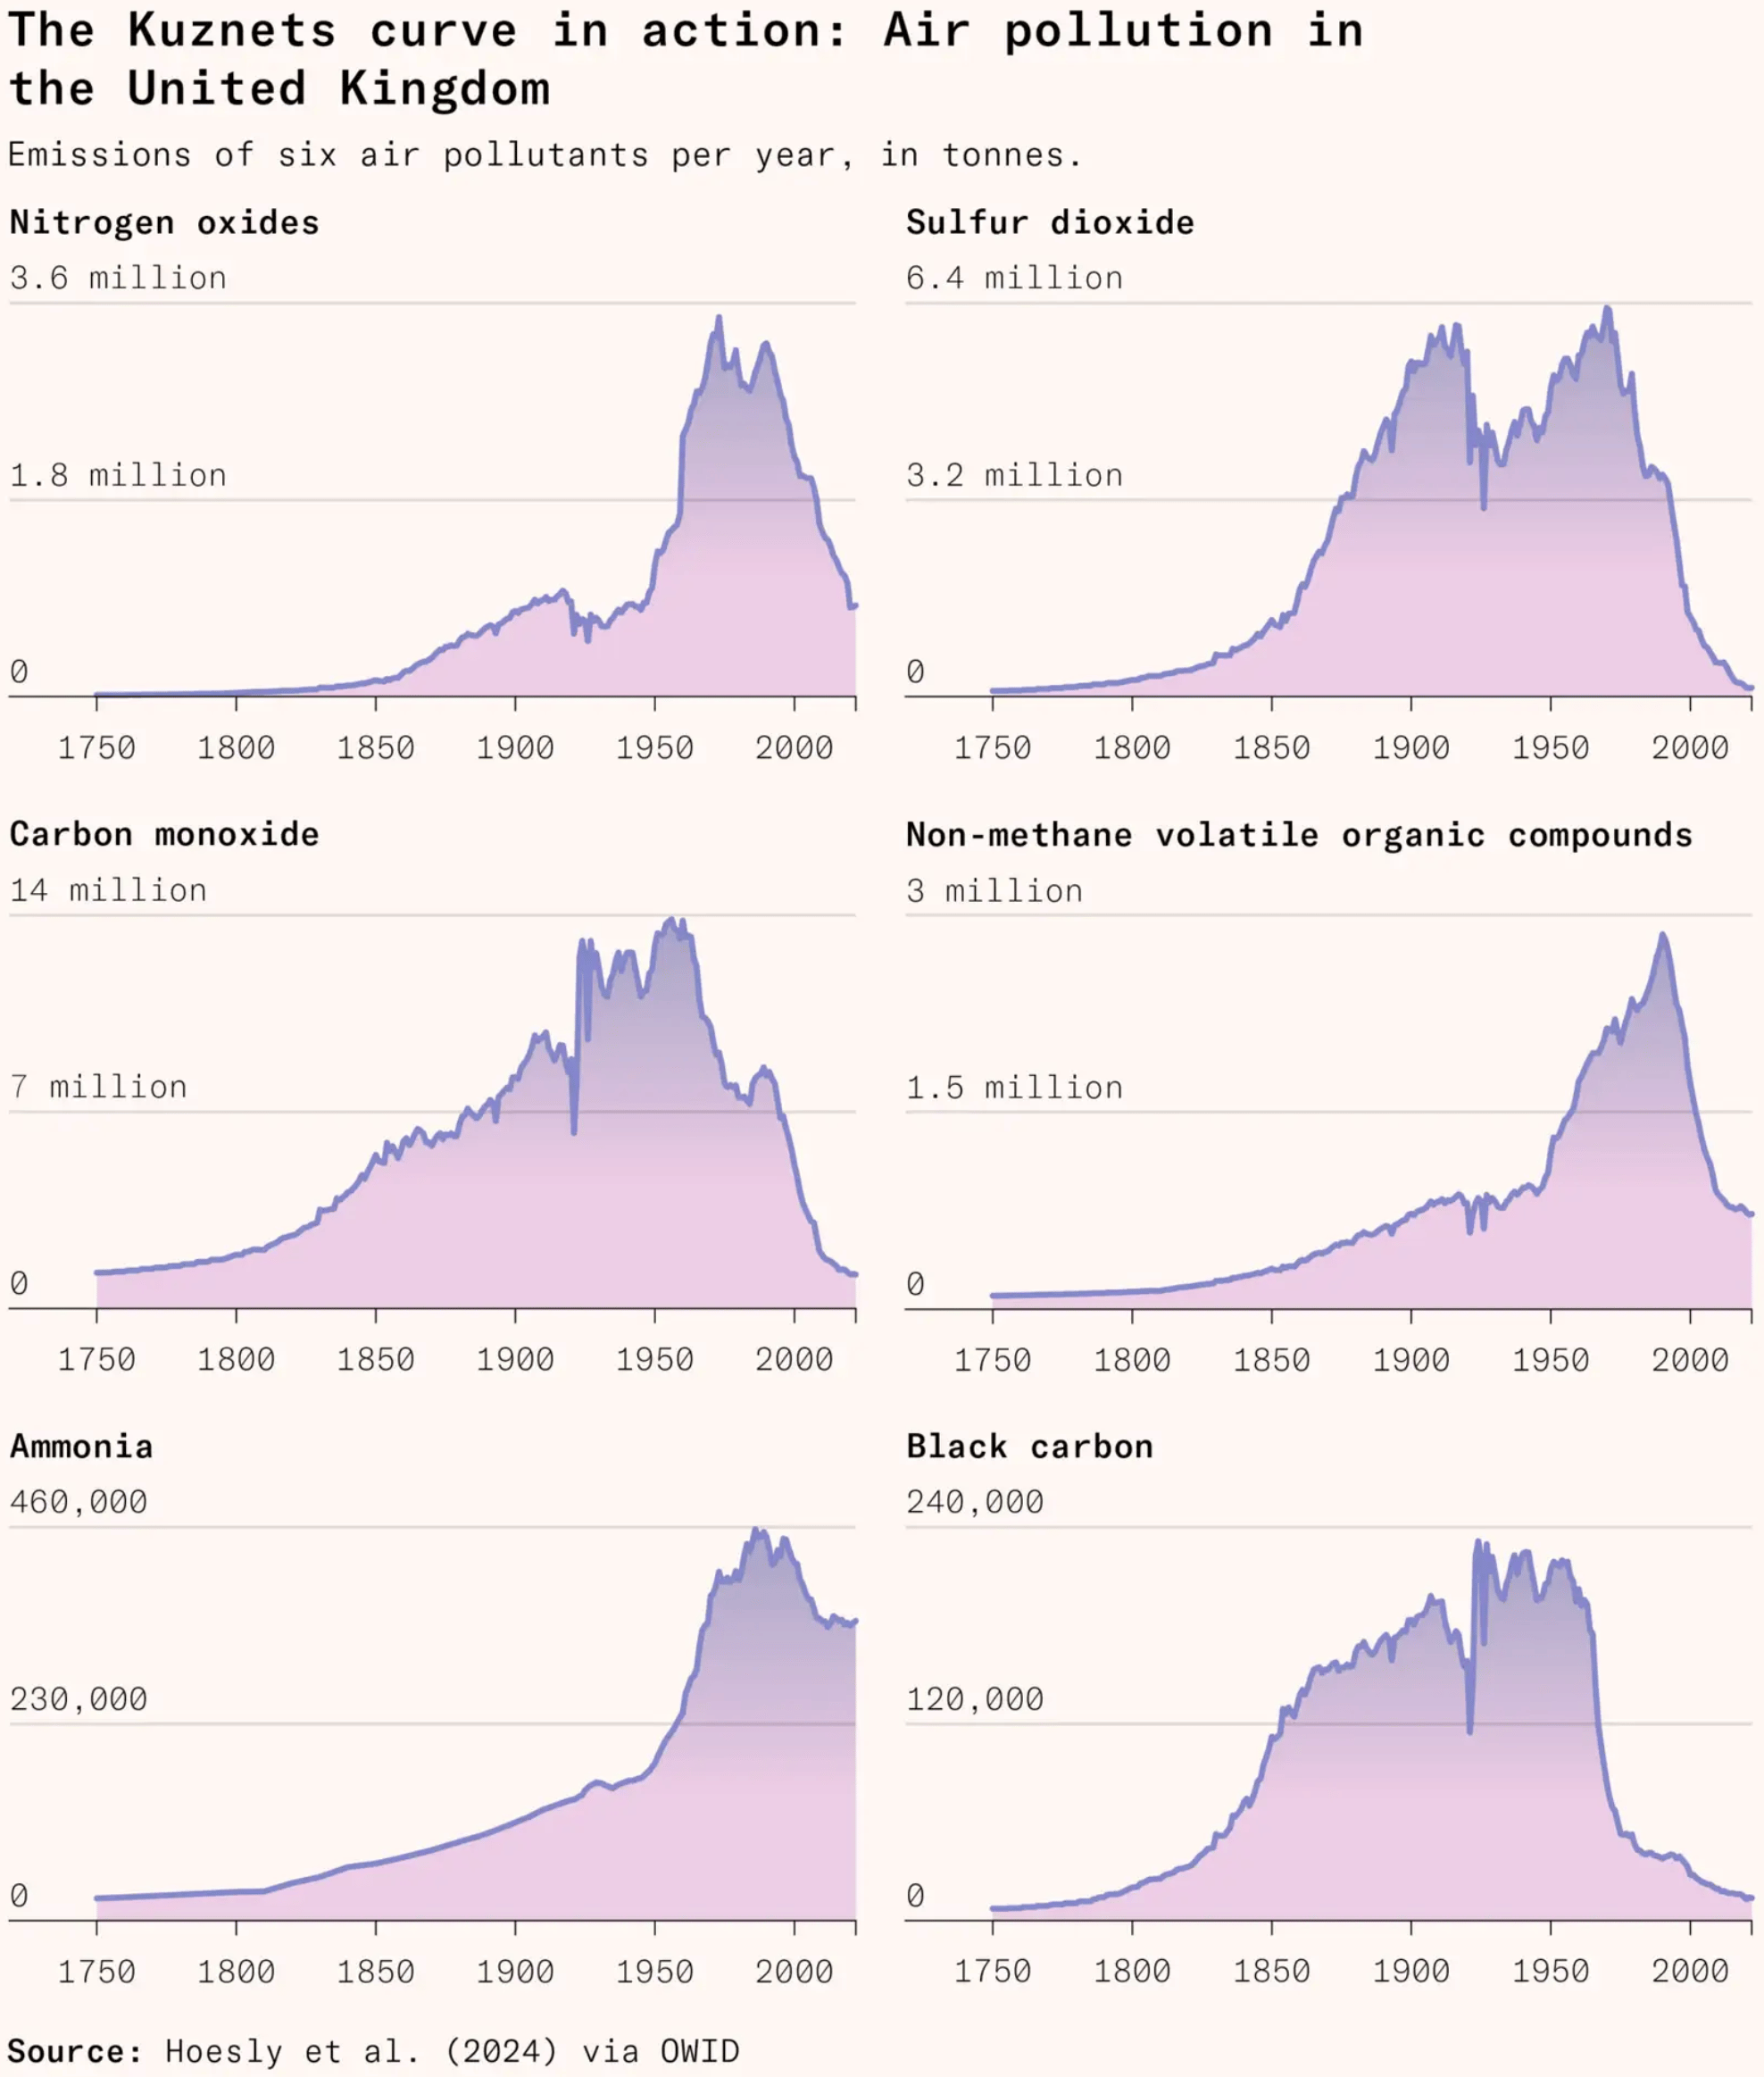
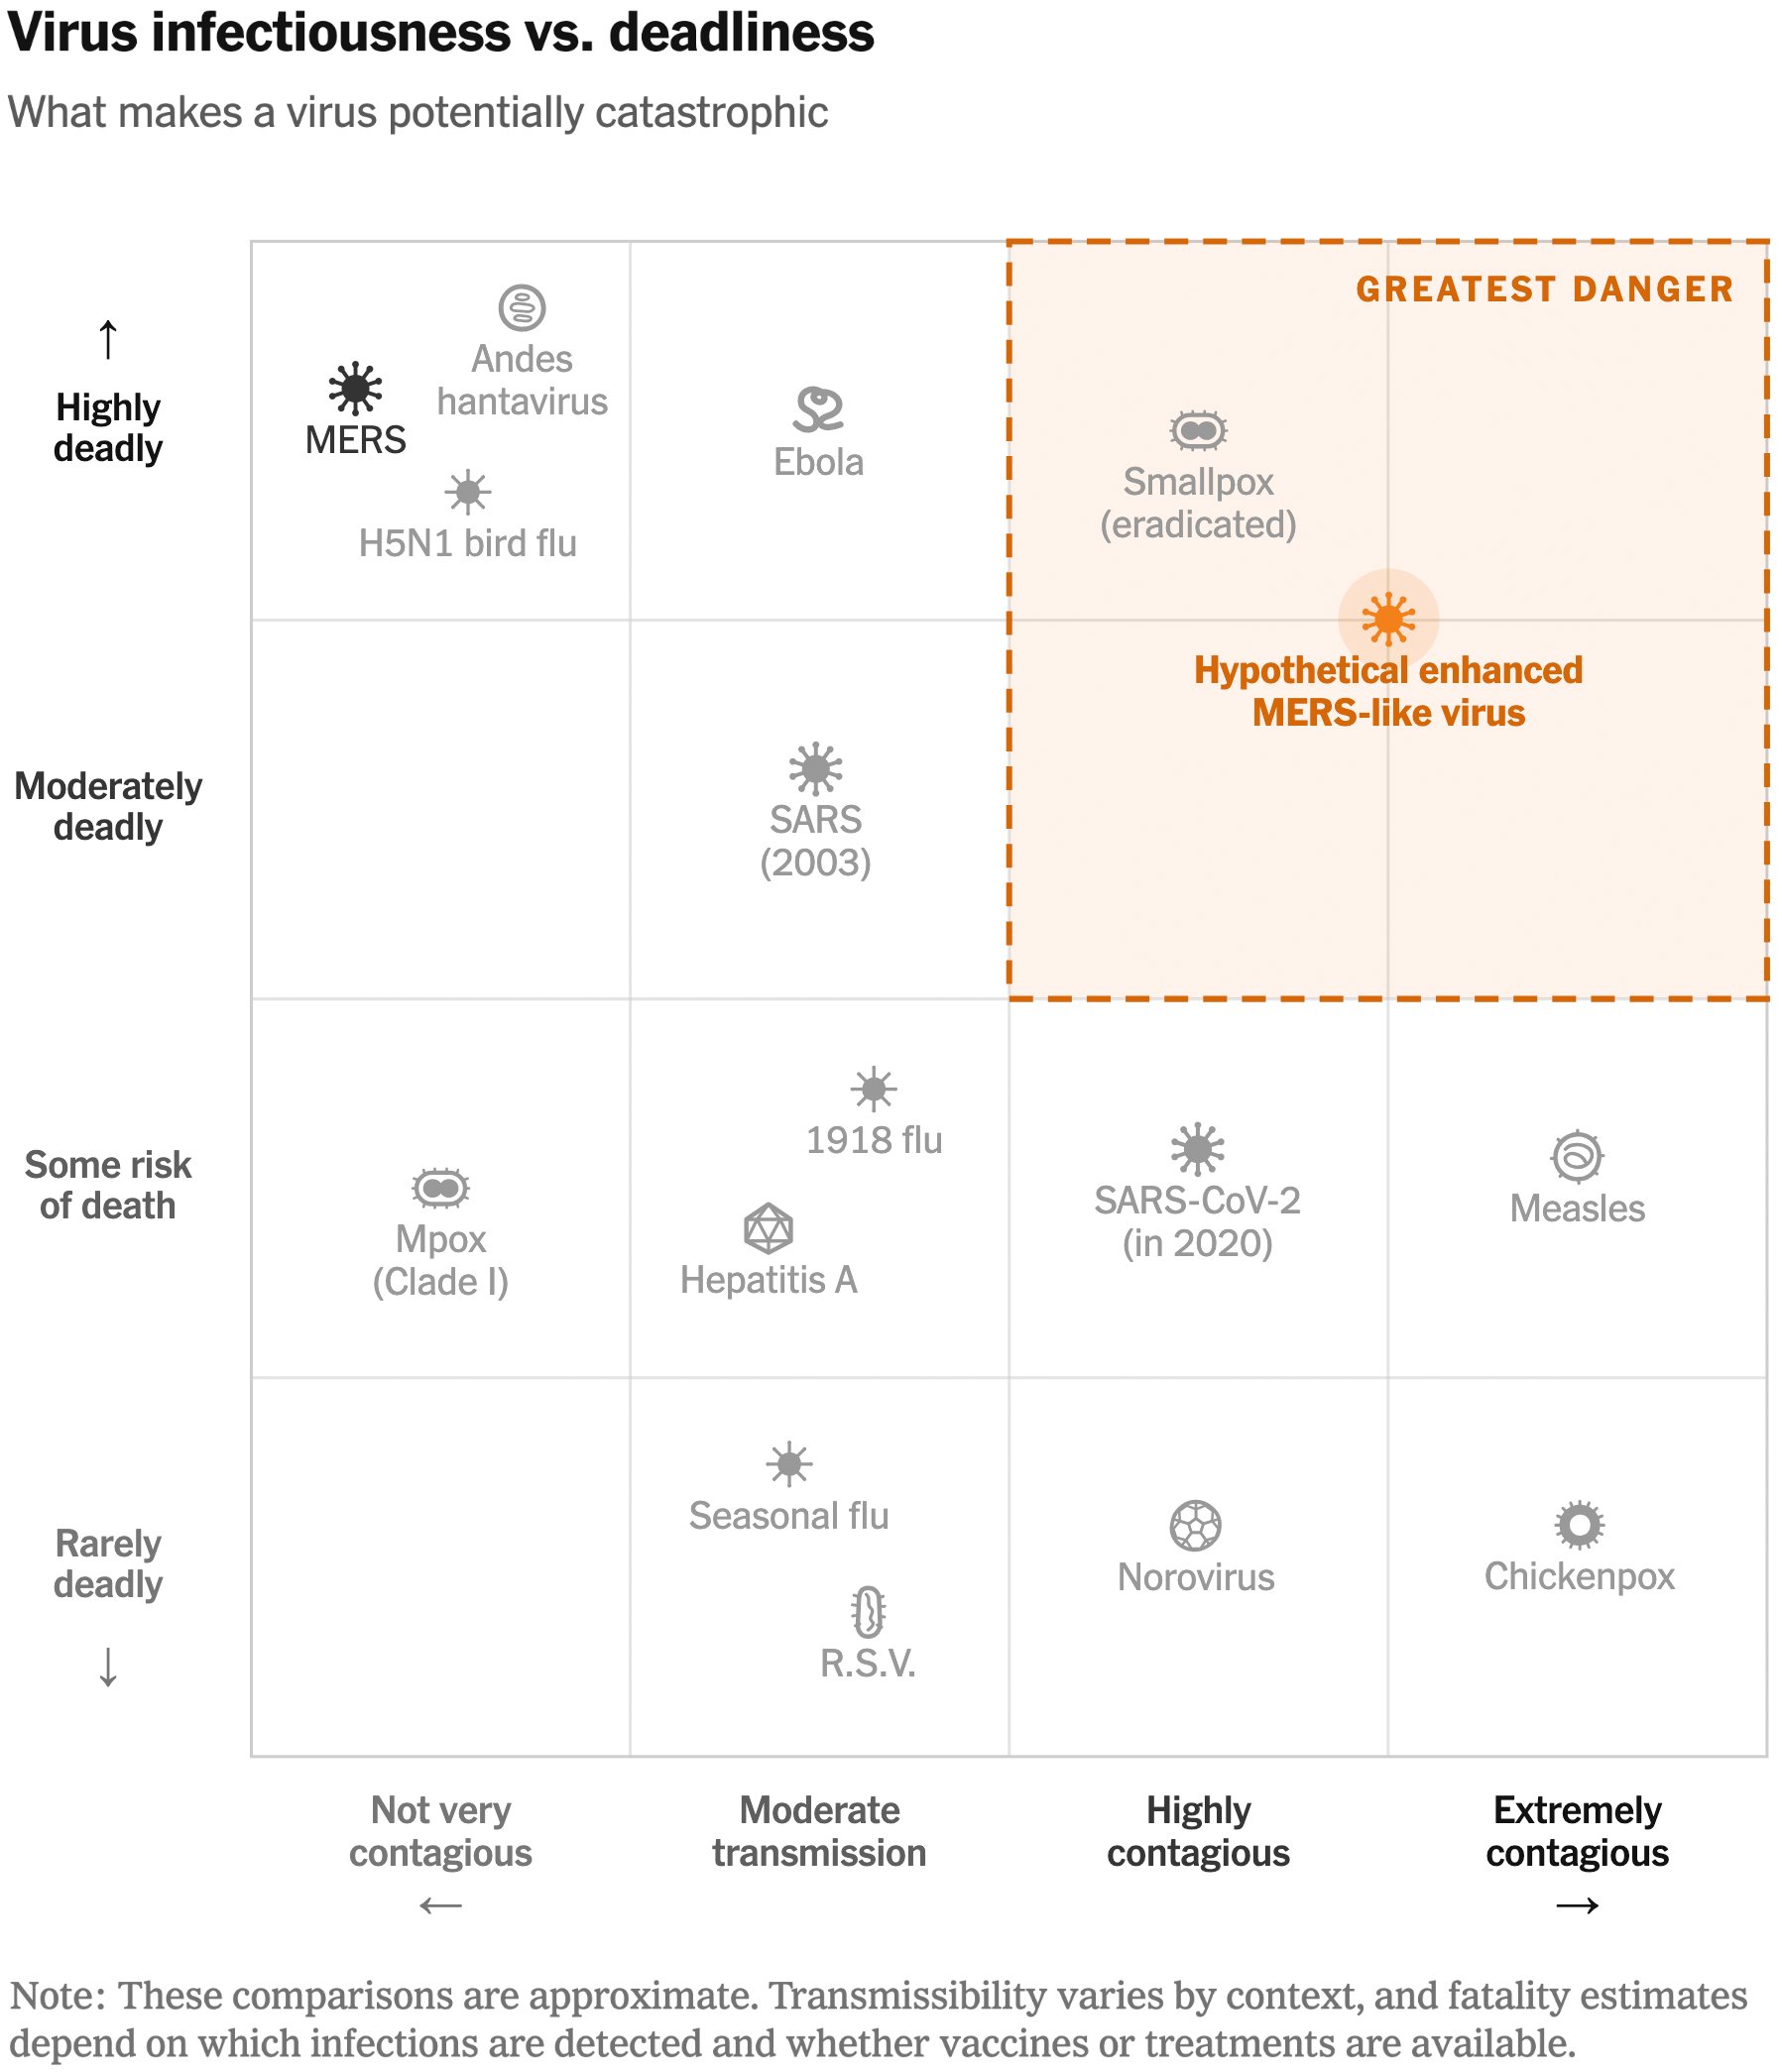
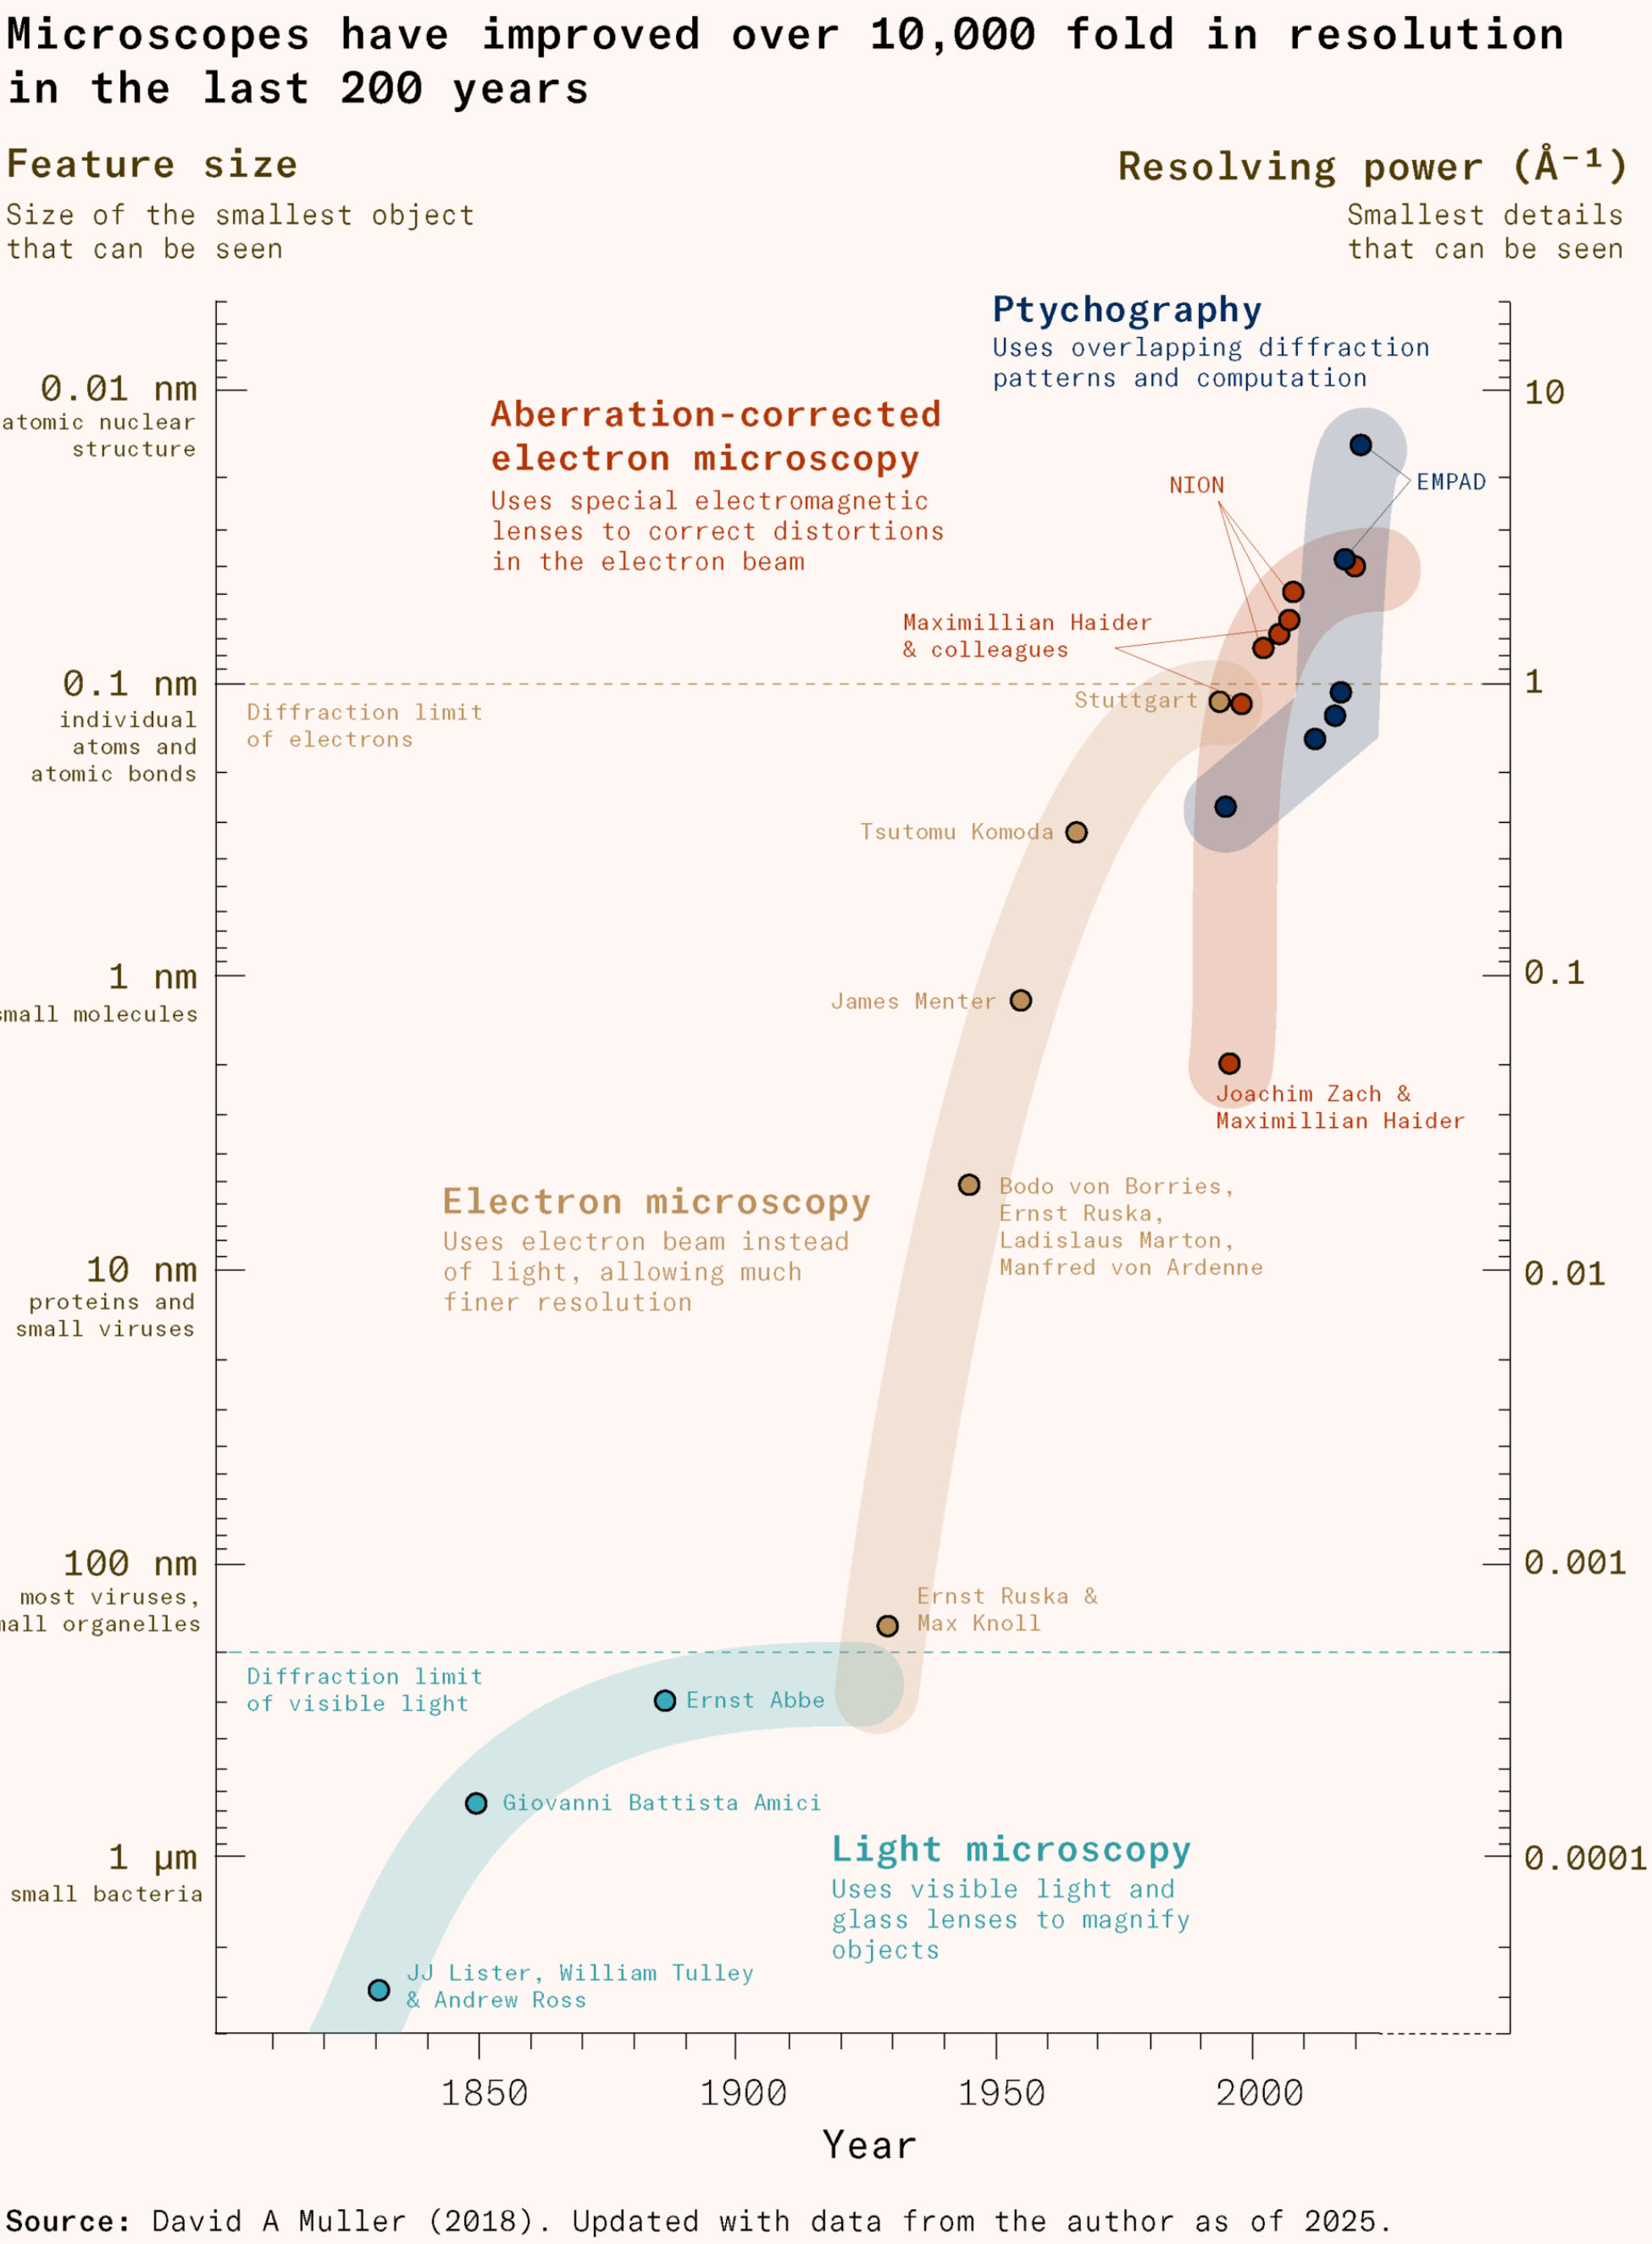
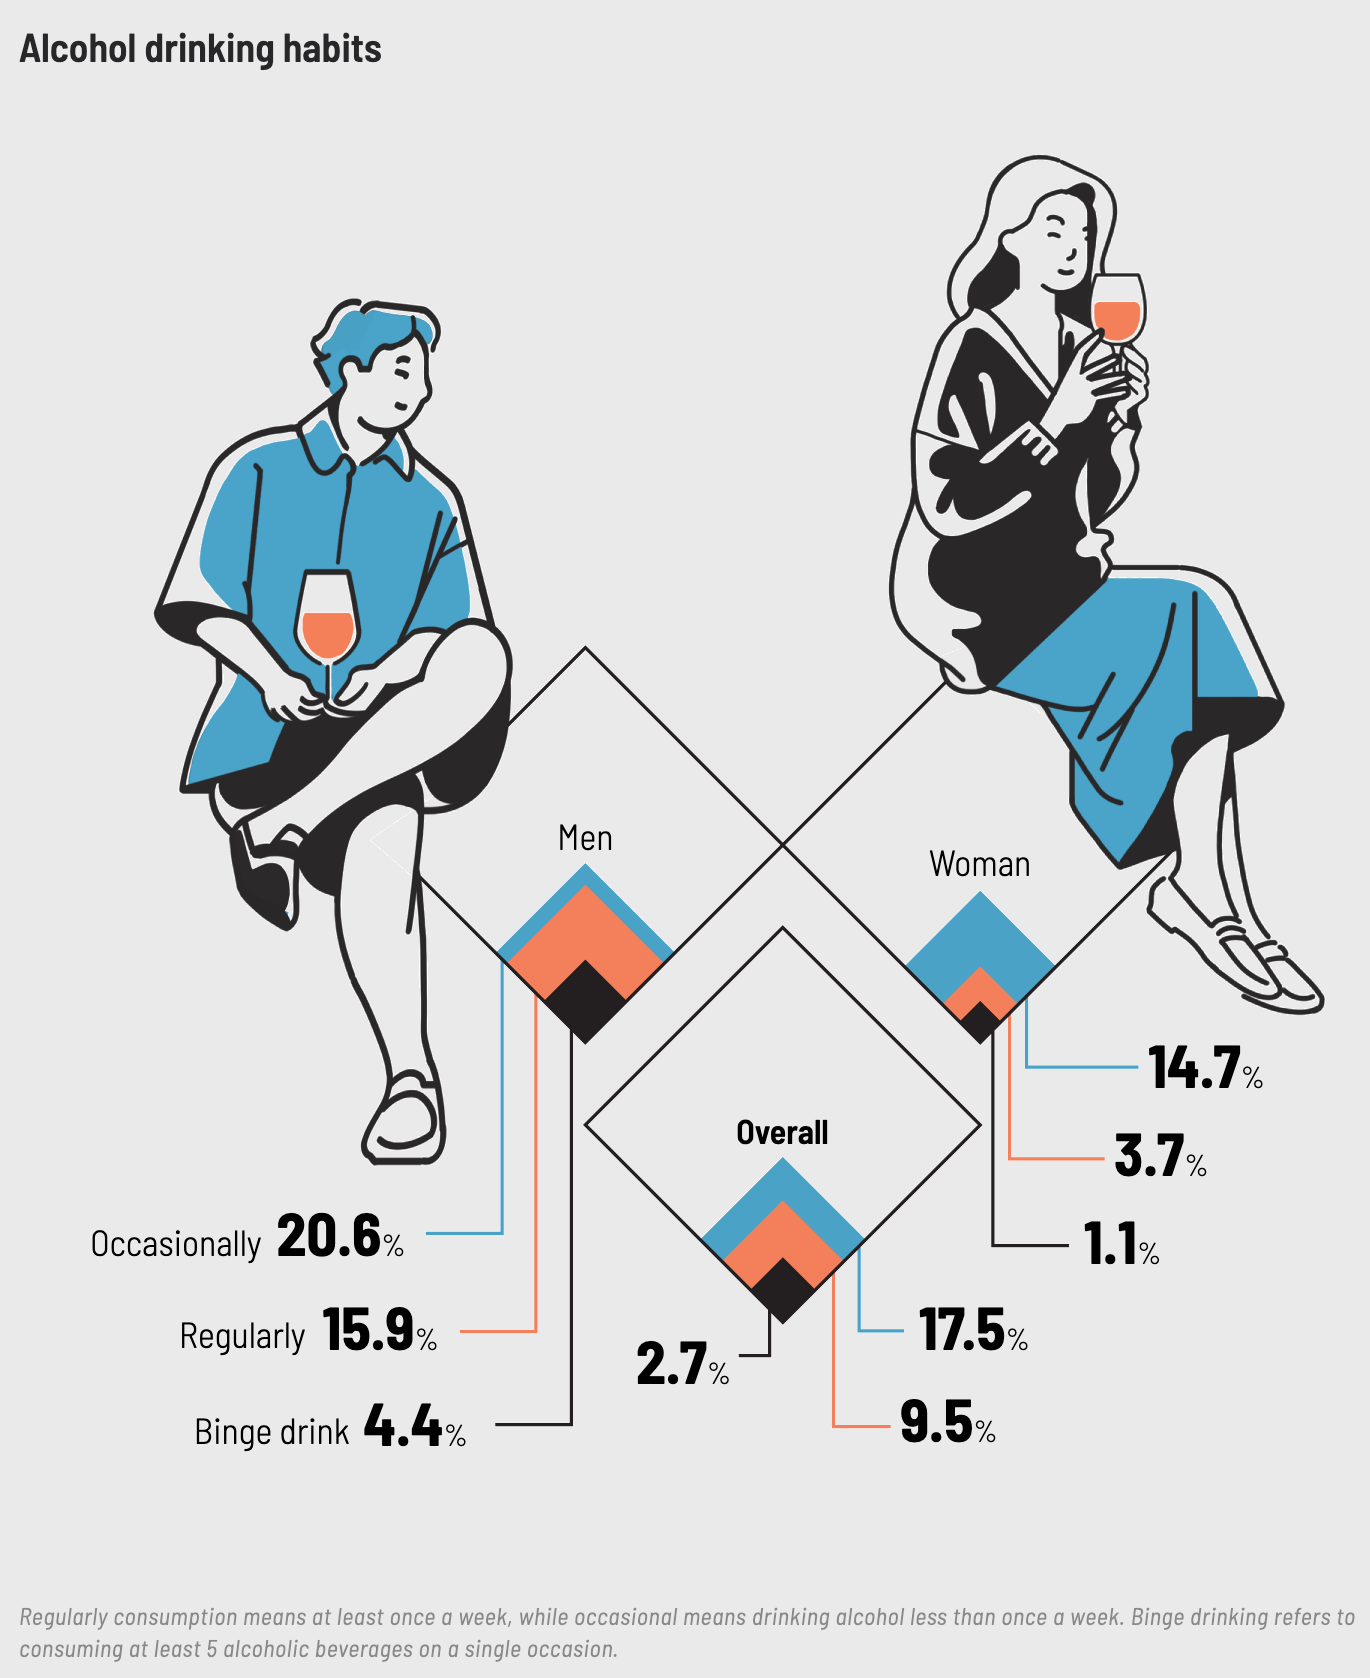
More dry heat means more wildfires, so let's start our section on health charts with small multiples visualizing smoke frequency. Also in here: viruses, microscopes, drinking habits, and mental health.
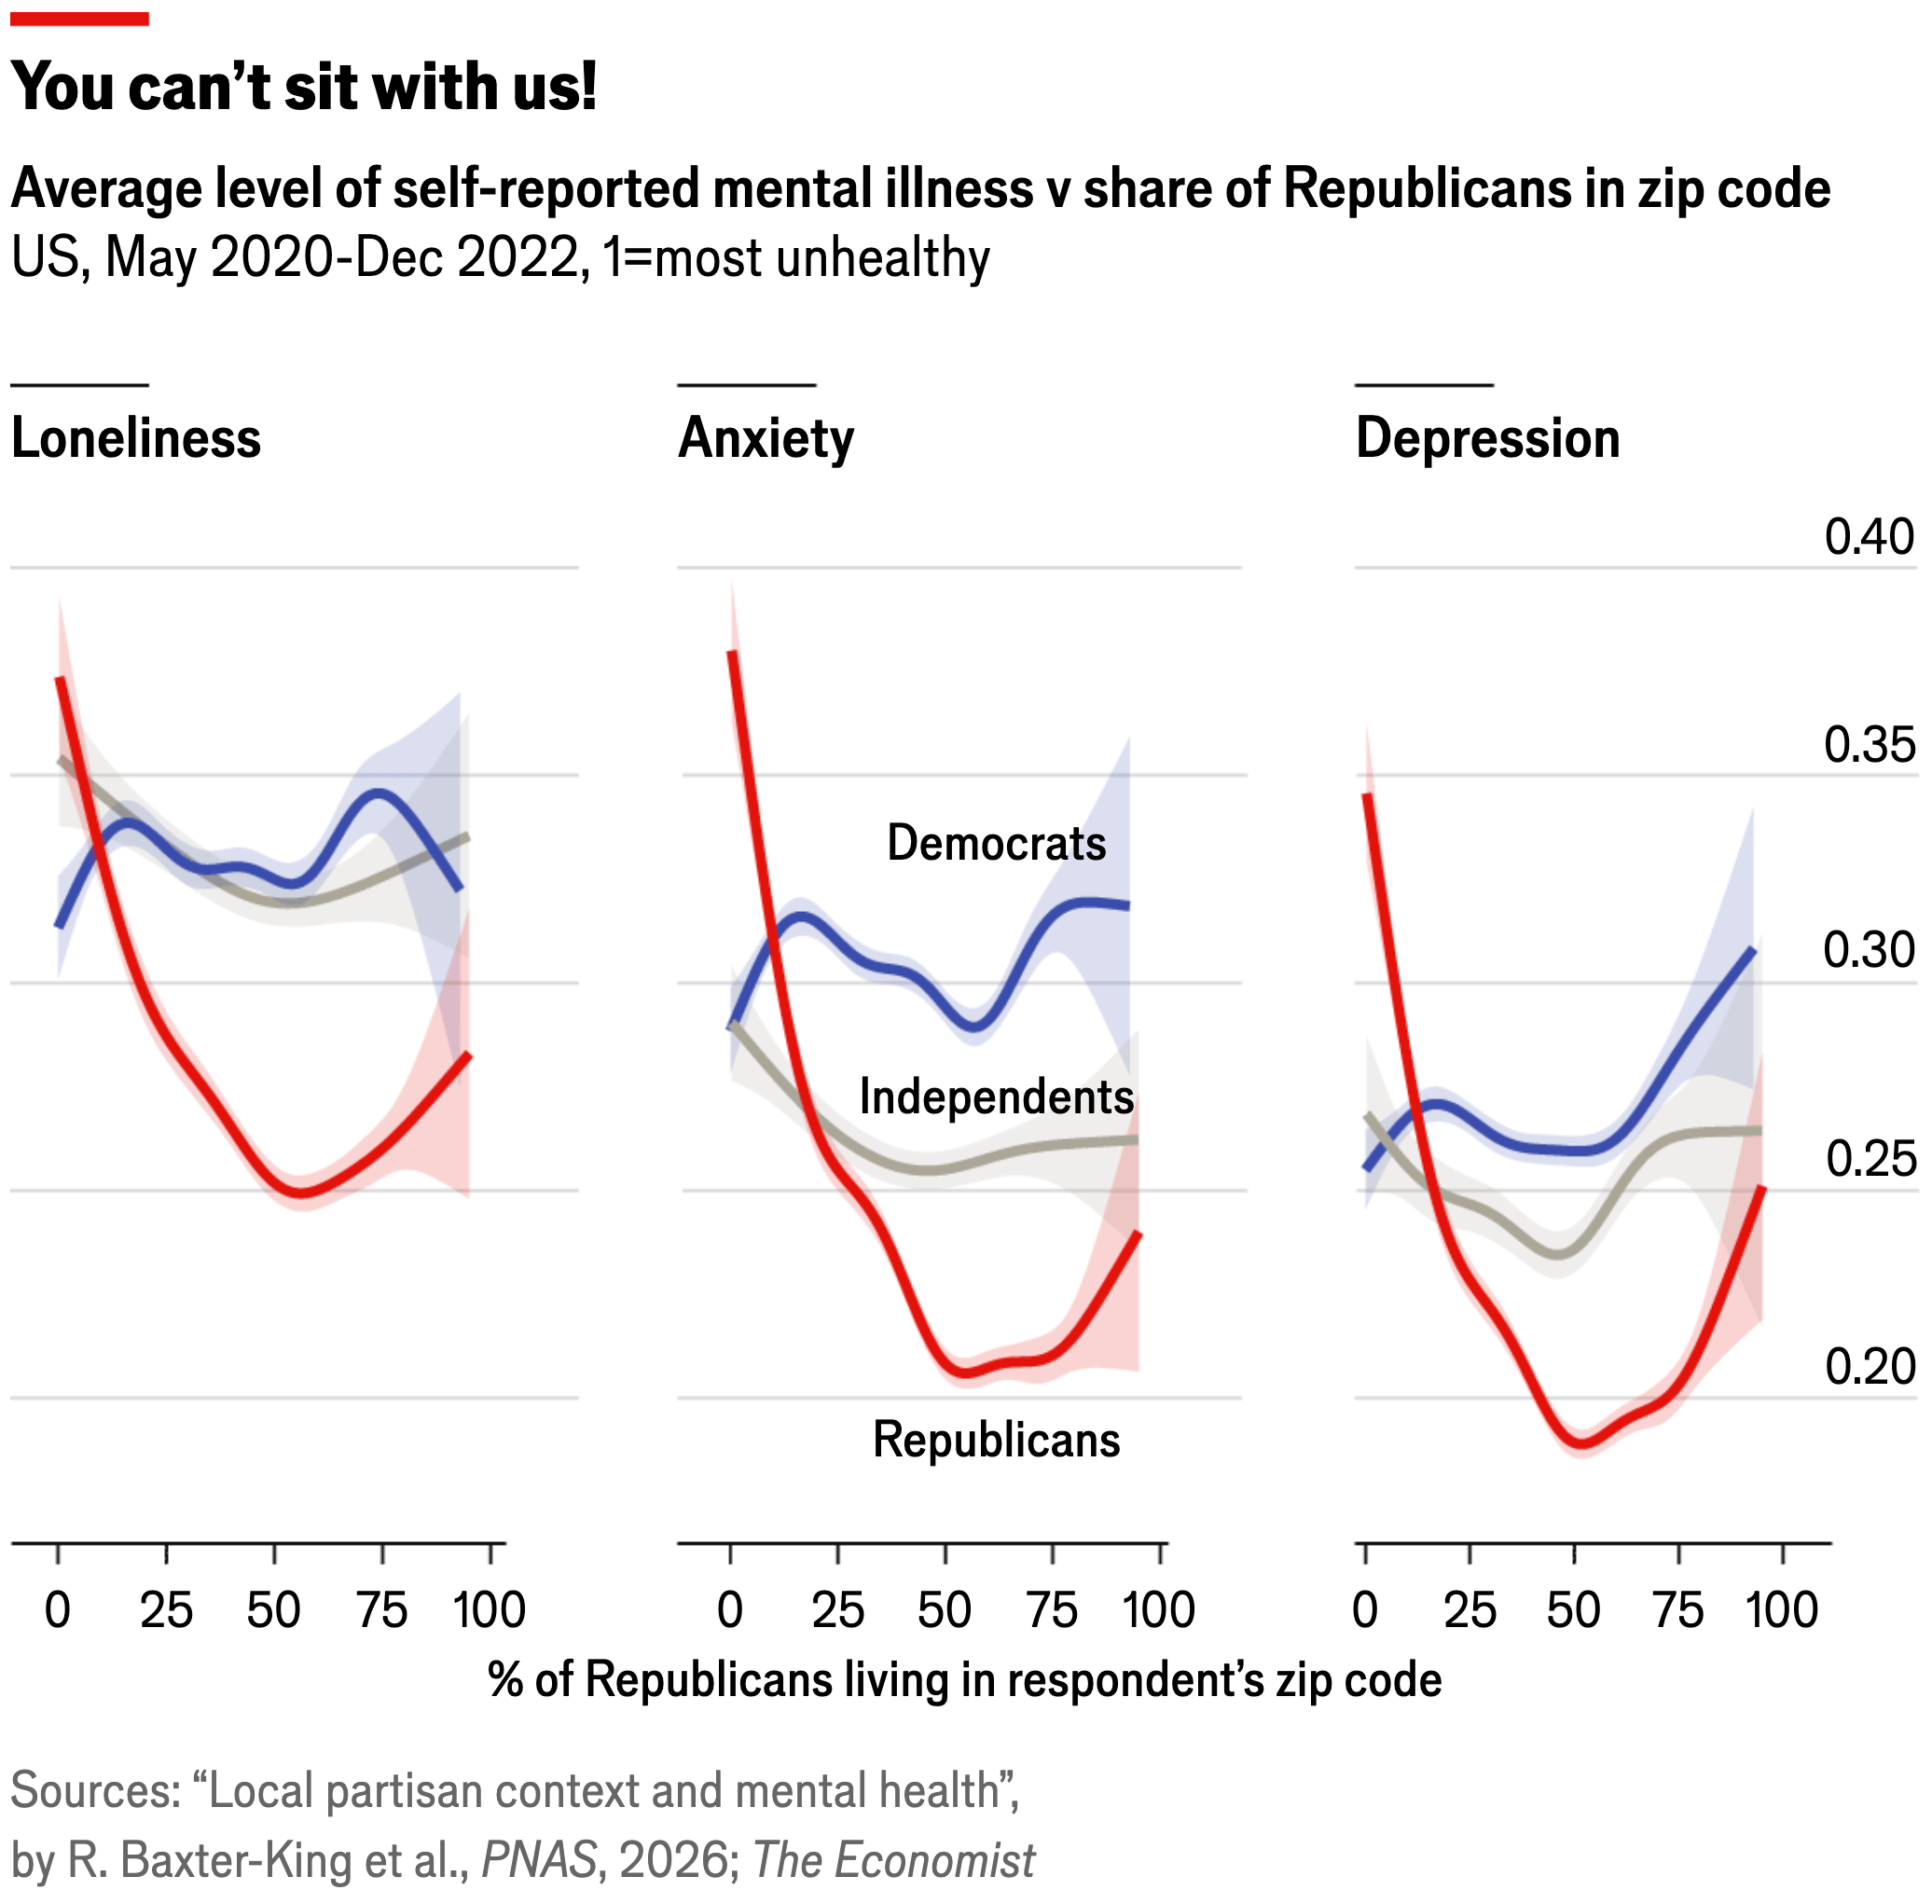
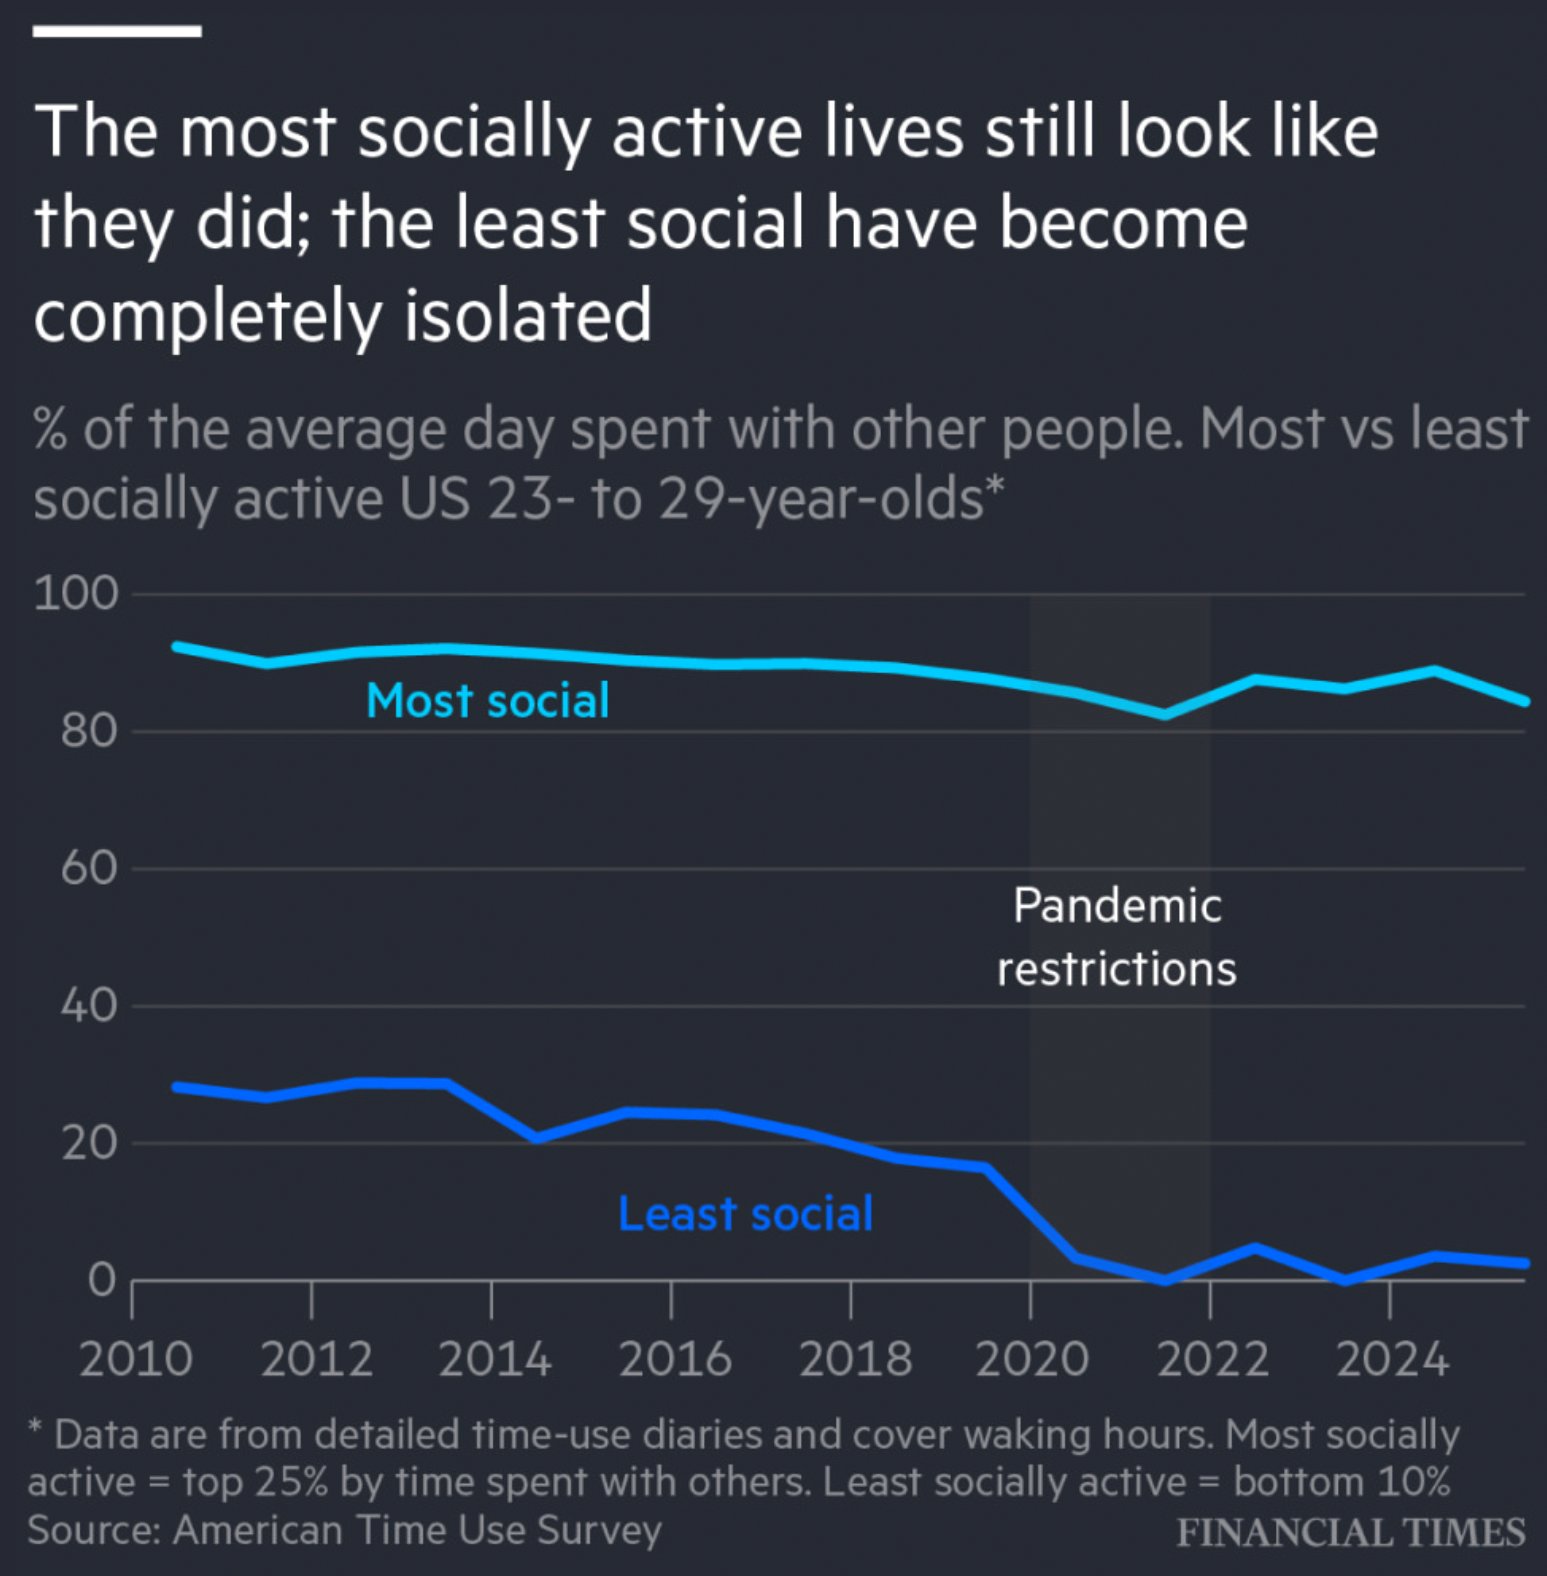
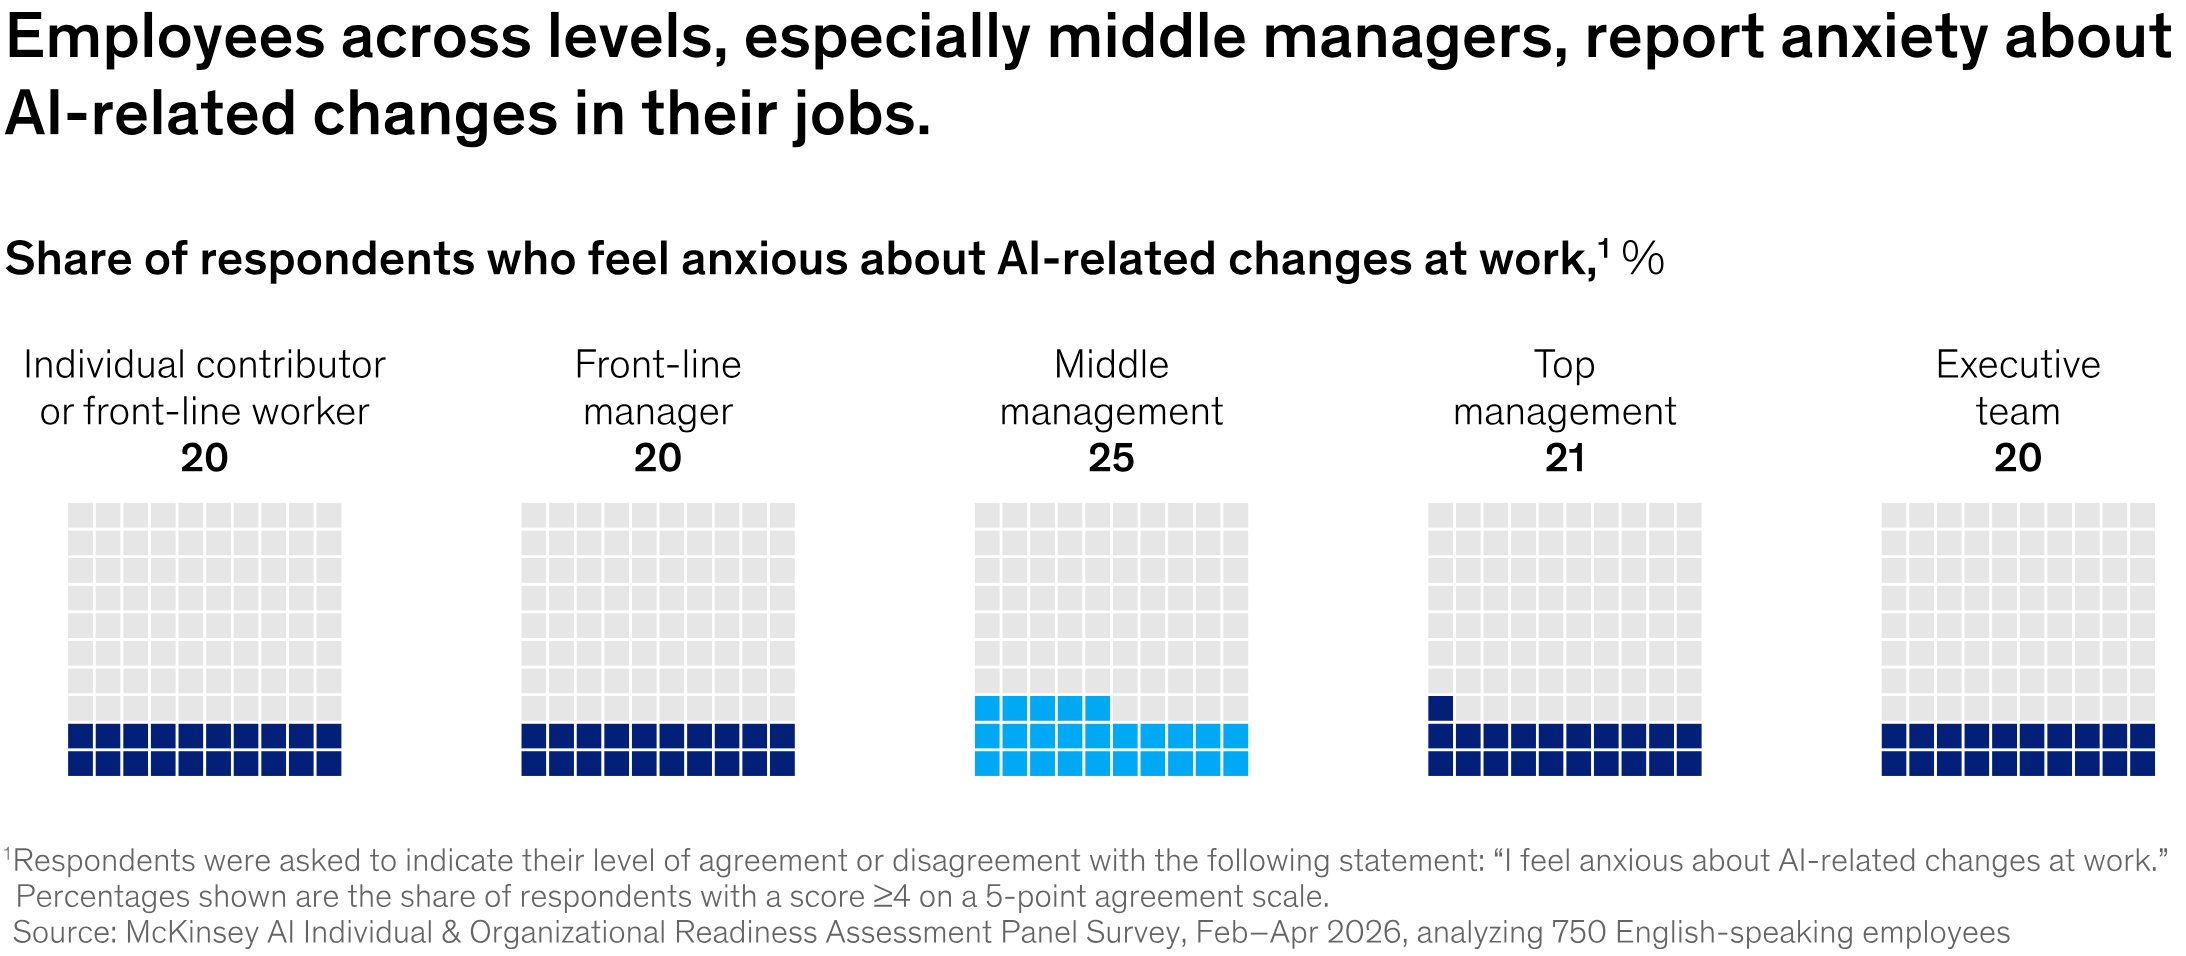
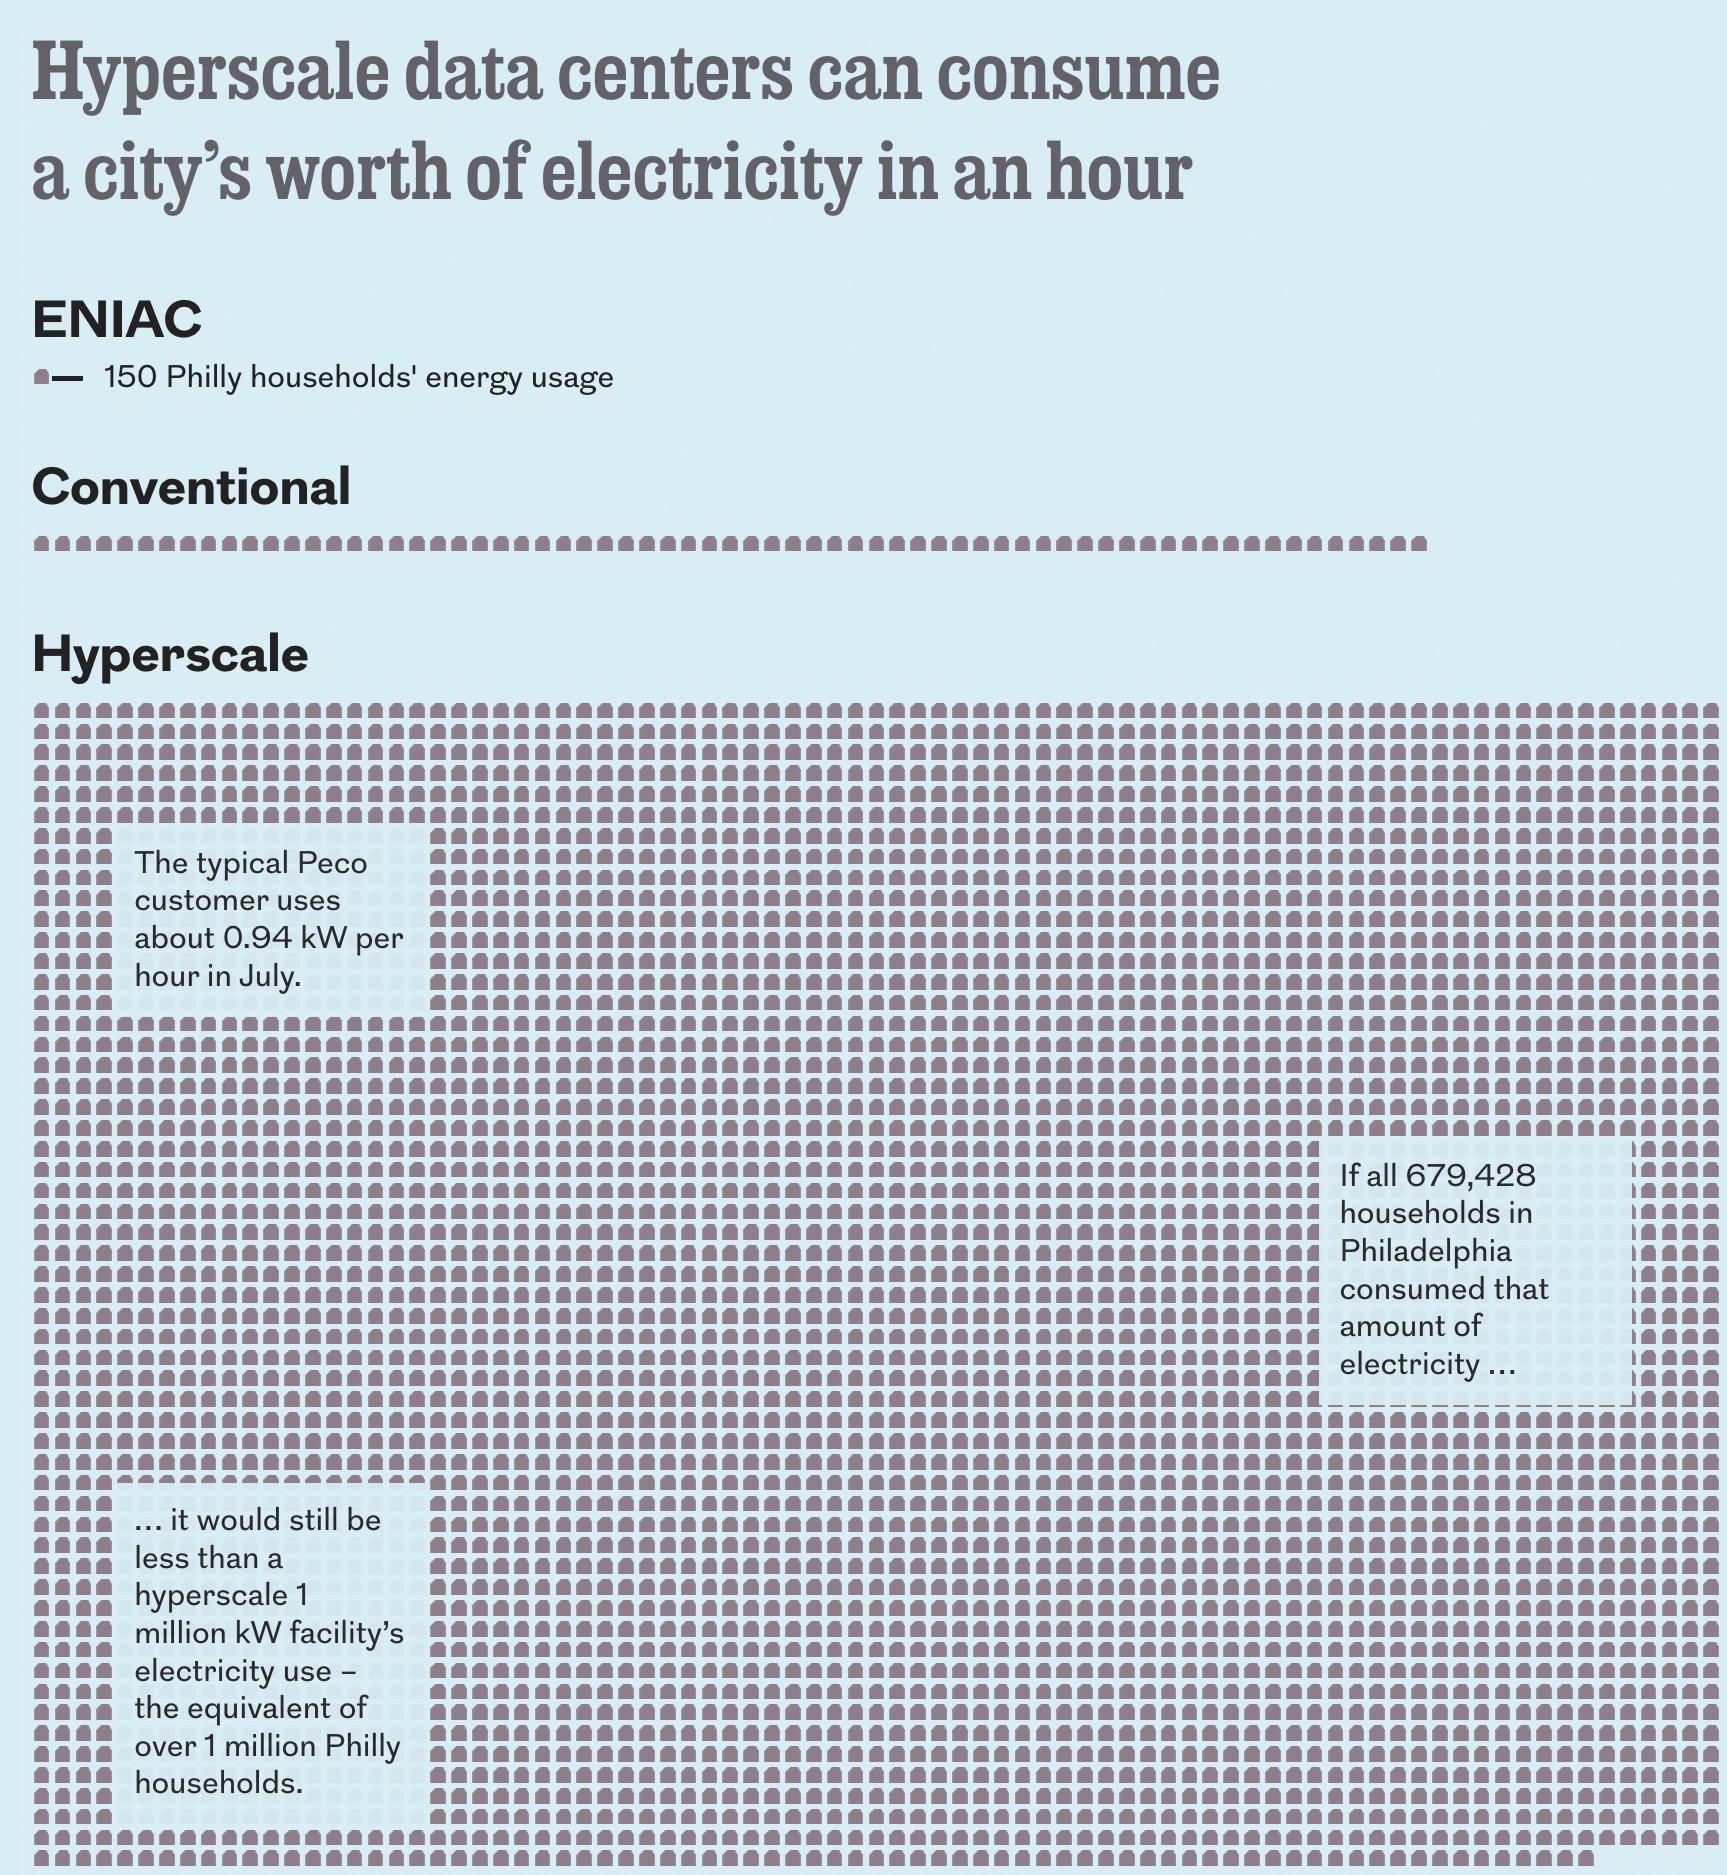
Speaking of mental health: employees feel anxious about what AI is doing to their jobs, but maybe they should worry about what it's doing to their electricity (bill). NZZ found that four AI models wouldn't vote for the right-wing German AfD.
![NZZ: <a href="https://www.nzz.ch/visuals/ki-chat-modelle-wahl-o-mat-sachsen-anhalt-afd-ld.10019466"><strong>Vier KI-Modelle machen den Wahl-O-Mat für Sachsen-Anhalt. Bei einer Partei sind sich alle einig</strong></a> <em>[Four AI models take the Vote-O-Mat for Saxony-Anhalt. Everyone agrees on one party]</em>, August 18](https://datawrapper.de/cdn-cgi/image/quality=85,width=1934,f=auto,fit=cover/https://kirby.datawrapper.de/media/pages/blog/data-vis-dispatch-august-18-data-art-low-water-levels-health/71e0bb0914-1787036041/screenshot-2026-08-18-at-08.53.33.png)
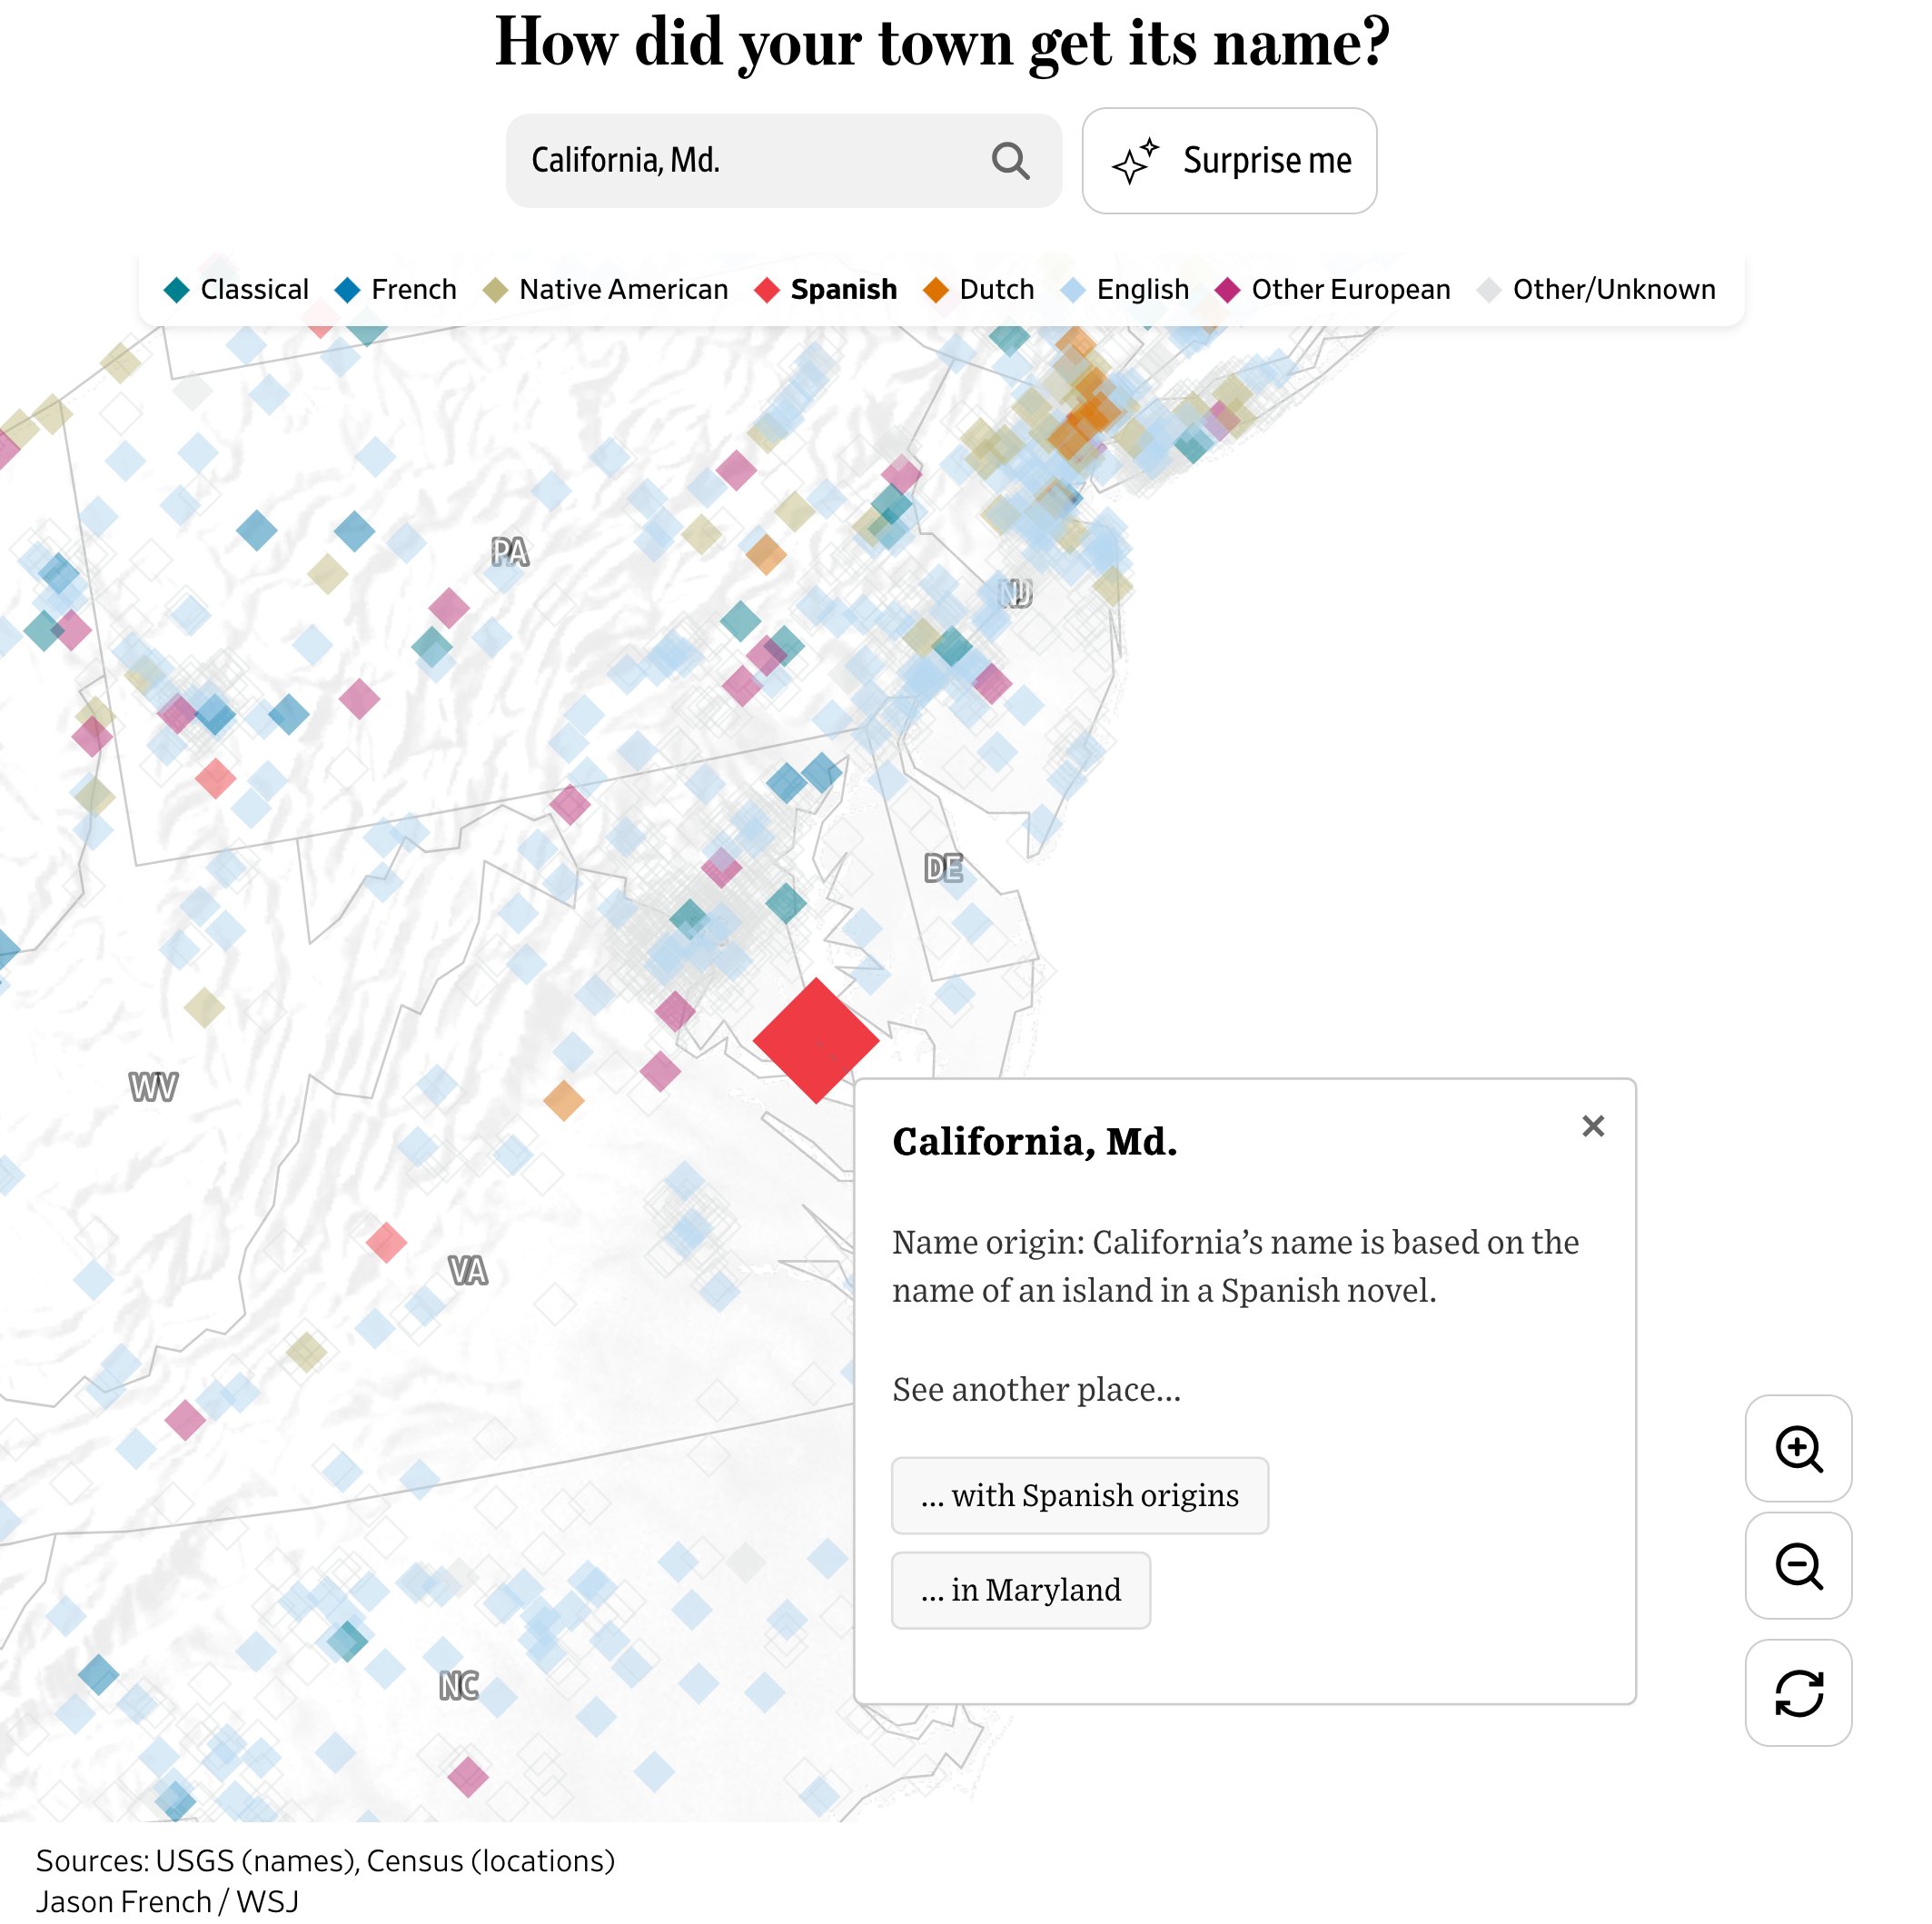
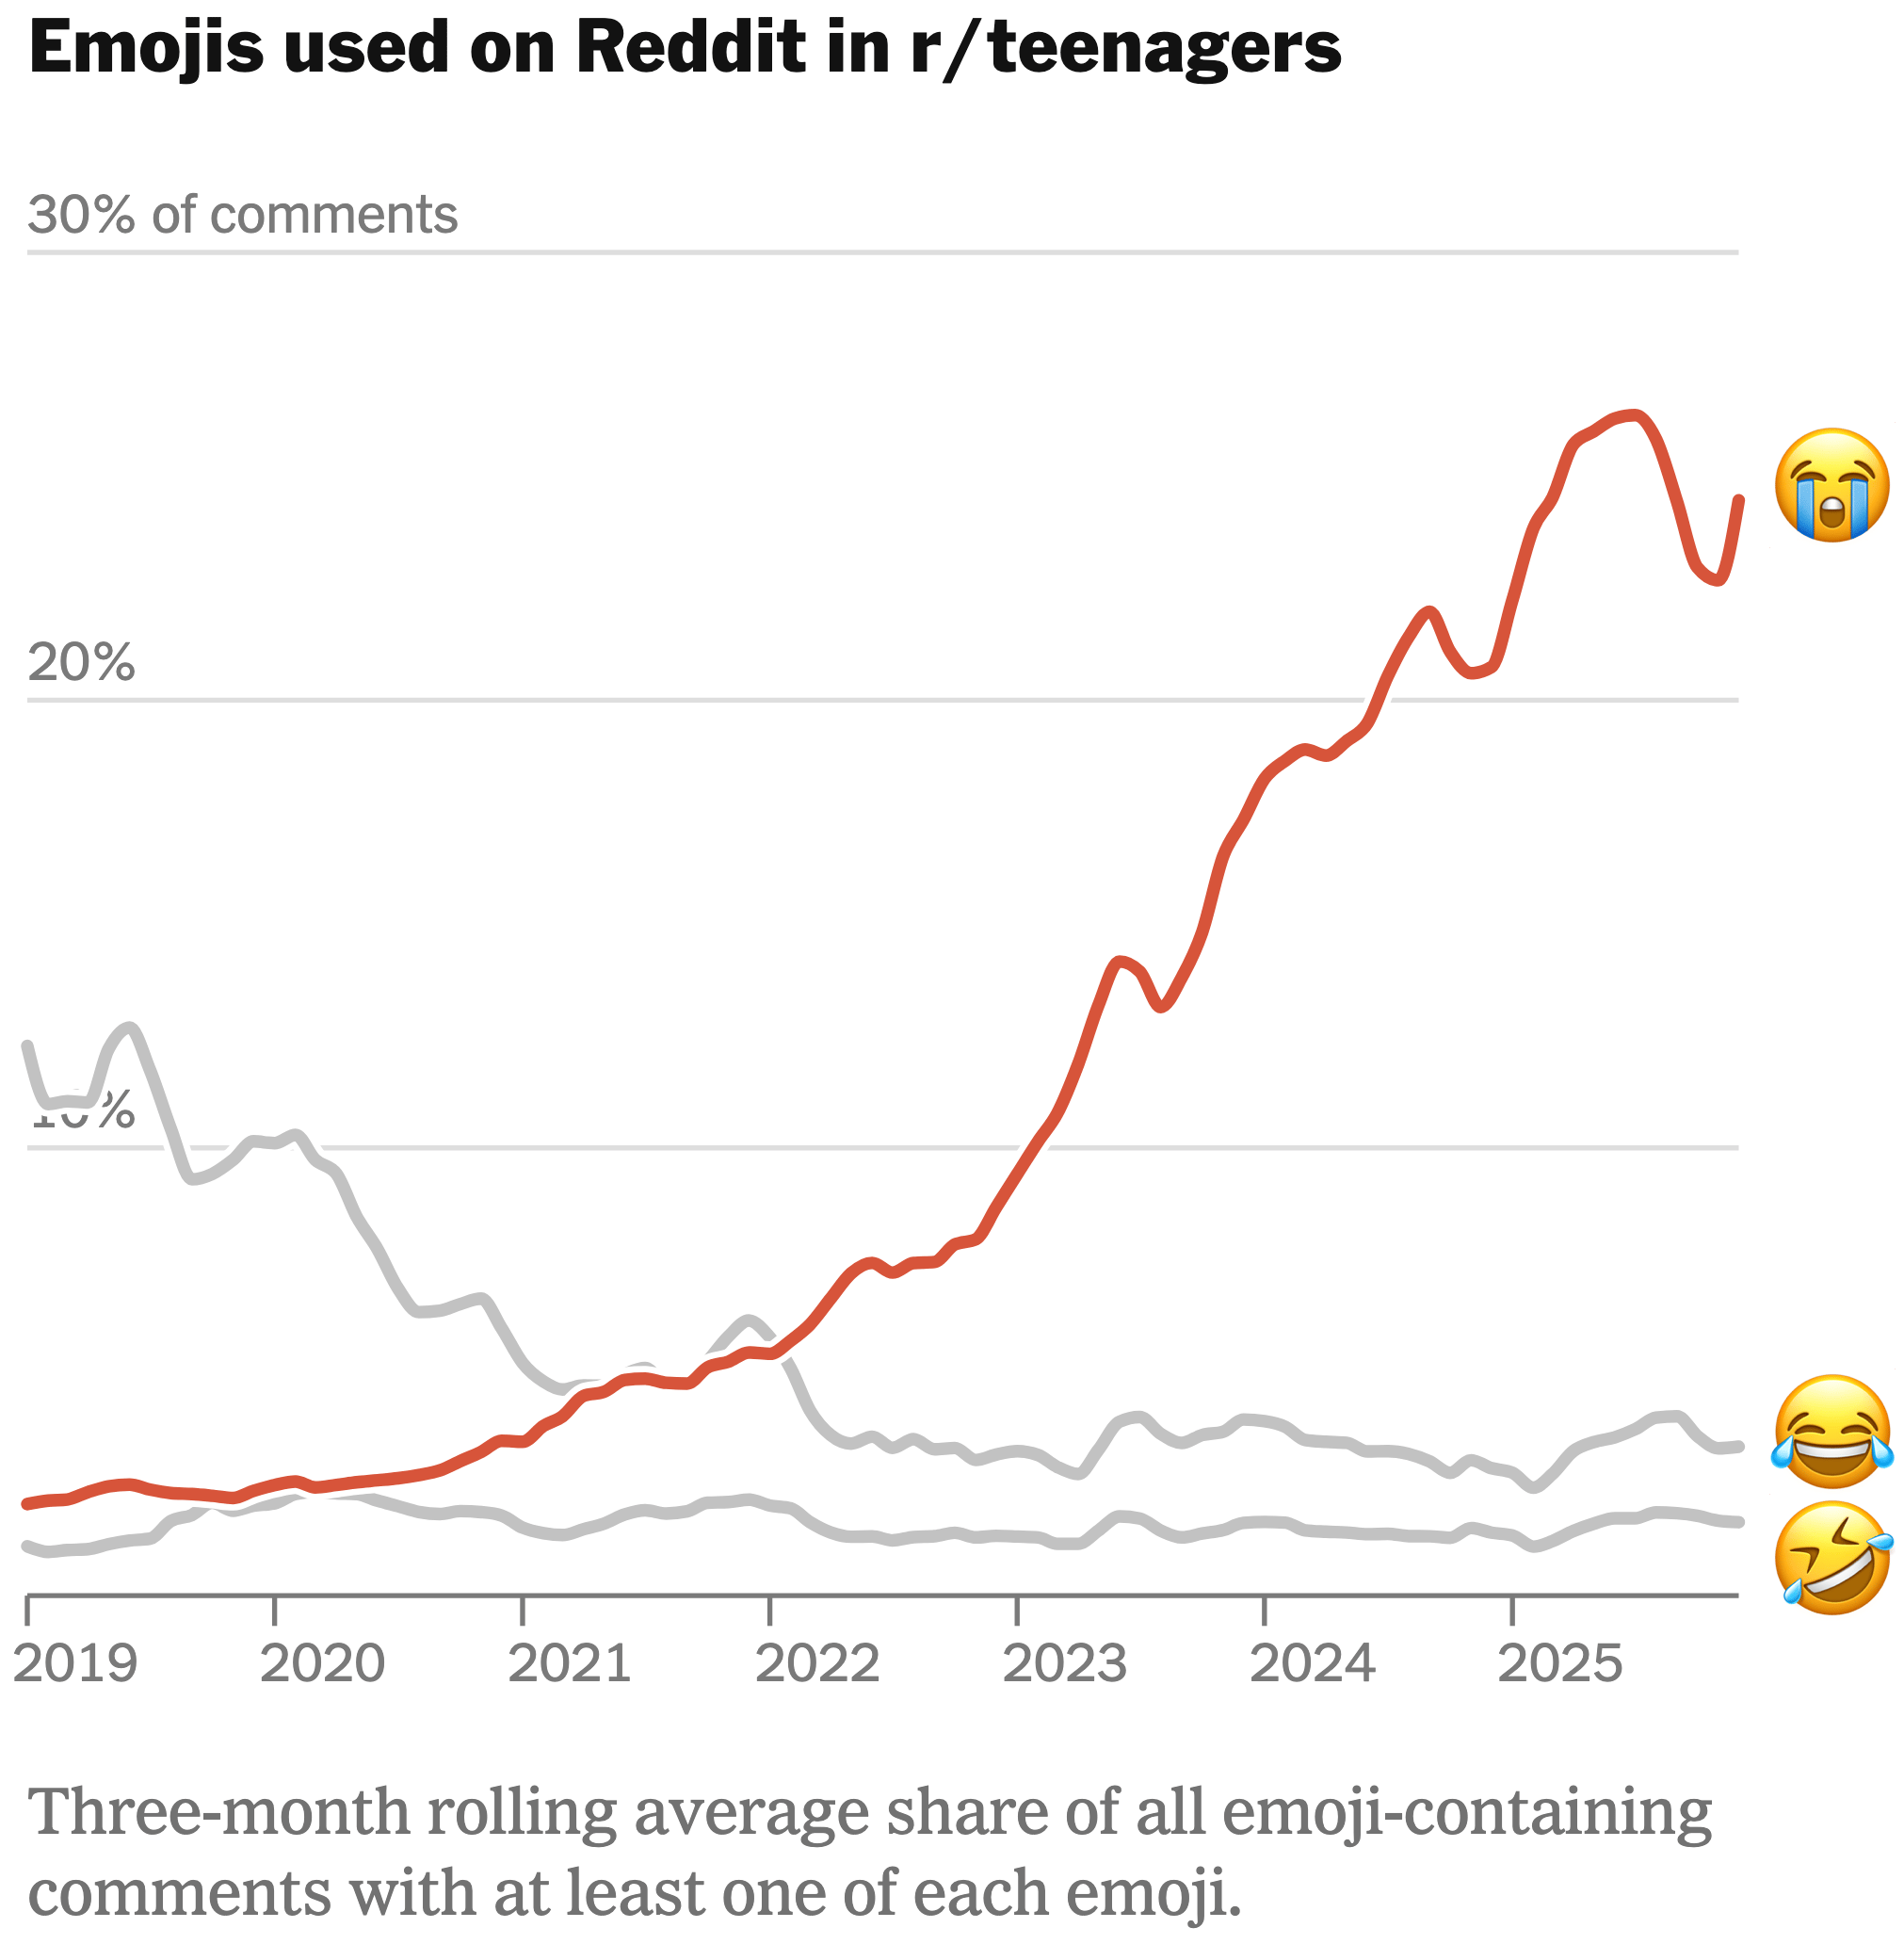
What else we saw this week: choose where to draw the line between the north and the south of the UK, find out why your US town is called the way it is — and whatever you do, don't out yourself as old by using the 😂 emoji.
![Giuseppe Sollazzo: "I've seen a few maps around with 50/50 splits of the UK according to several statistics [...] I've generalised the concept and created this interactive map. Select a dataset (or upload your own), slide/rotate the bar, find how dataset splits North/South (or East/West)," August 13 (<a href="https://lnkd.in/p/dyka3sZp"><strong>LinkedIn</strong></a>, <a href="https://puntofisso.net/MapSplit/"><strong>project</strong></a>)](https://datawrapper.de/cdn-cgi/image/quality=85,width=2000,f=auto,fit=cover/https://kirby.datawrapper.de/media/pages/blog/data-vis-dispatch-august-18-data-art-low-water-levels-health/9abab6804a-1786971262/screenshot-2026-08-17-at-14.54.19.png)

What else we found interesting
Applications are open for…
A Data Visualization Specialist at Complexity Science Hub
A Designer, visual storytelling at The 19th


