How to create a waterfall chart
- Business
- Enterprise
To try out waterfall charts without a Business or Enterprise plan, hover over the chart below and click on Edit this chart.
Also known as bridge or cascade charts, waterfall charts are a variation of the column chart. They're a great choice if you want to show how parts add up to a total – or, to be more precise, how a sequence of positive and/or negative values (the "floating" change columns) incrementally affects an initial value (the first column), ultimately leading to a final total (the last column).
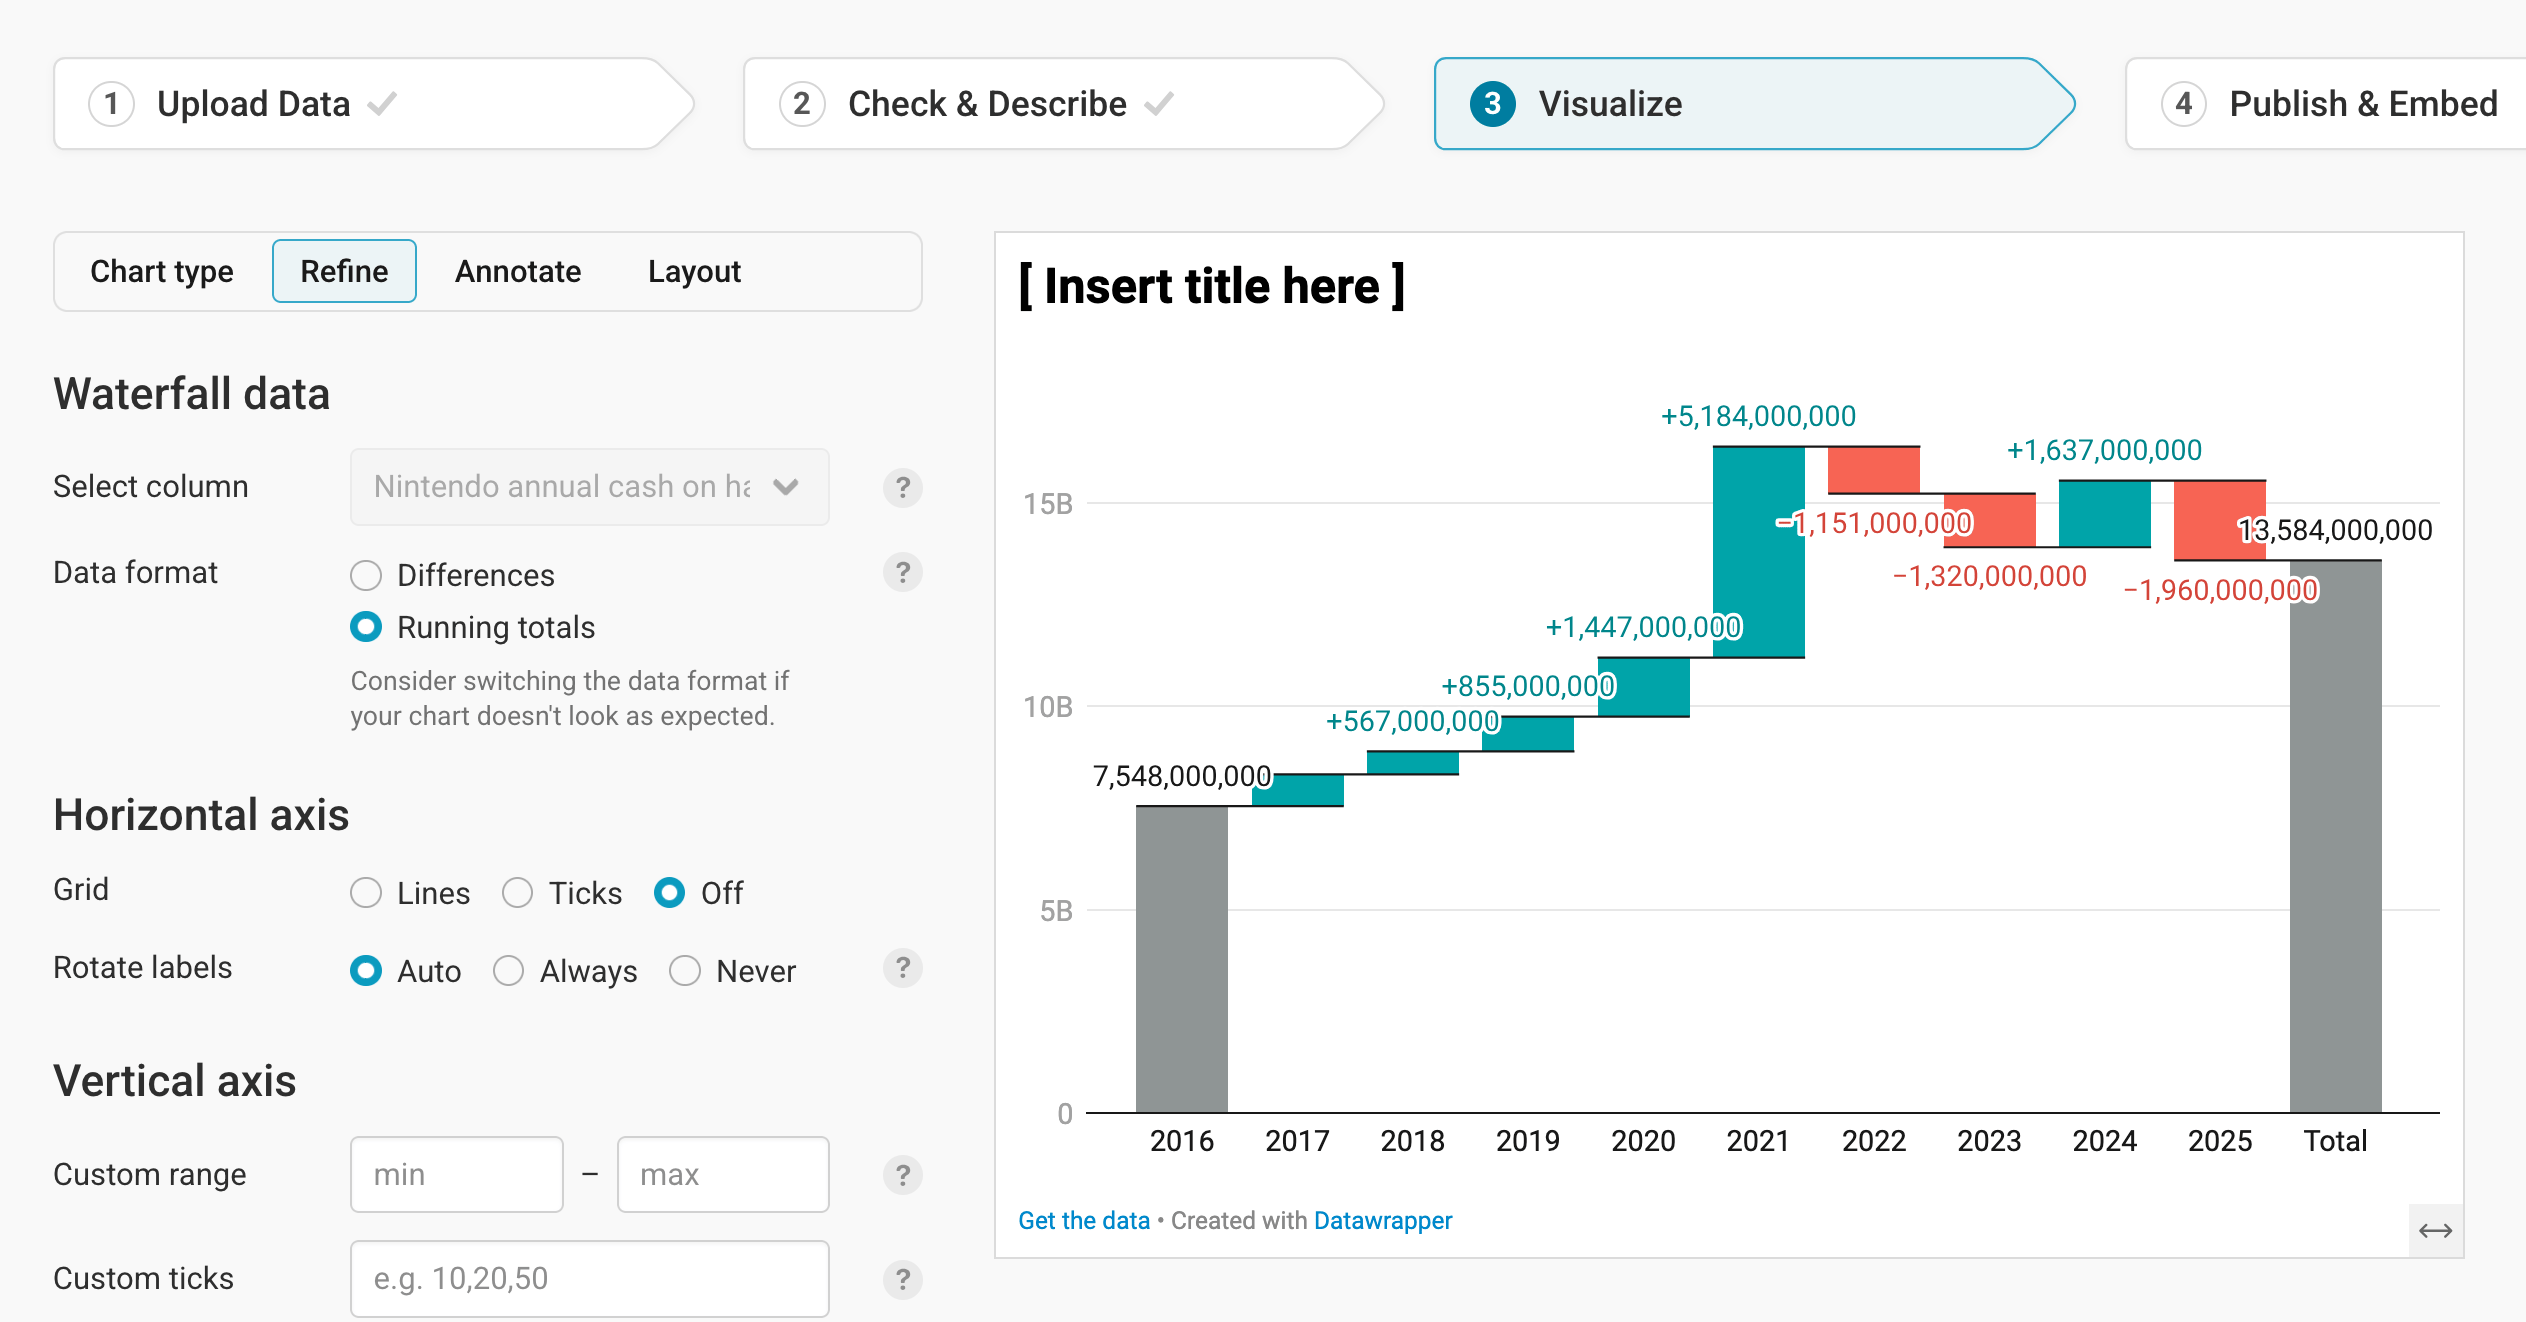
This guide will show you how to create and customize the following chart about Nintendo's cash reserves between 2016 and 2025:

Preparing your data
Formatting your data
To create a waterfall chart, you first need data. For the chart above, the data comes from Macrotrends (this Google Sheet, which you can copy, contains the final dataset we’re using for our chart).
For any waterfall chart, you need the following data structure:
- A header row with column titles. This will make it easier to navigate and work with the dataset in Datawrapper.
- A first column with column labels. These will show up as titles below each column in the chart. These can be dates, too – for a waterfall chart, you often want to show how something changes over time. Our first column contains the years.
- A second column with the differences or absolute values. This column will translate into the ups and downs that you want to visualize. You can either upload the differences (e.g. "$40, -$30, -$70"), or the absolute values per year. For our chart, we choose the latter: Our column contains how much cash Nintendo owned per year, and Datawrapper calculates the differences between each year. You can tell Datawrapper which kind of numbers – differences or absolute values – your data comes in in step 3: Visualize. Whatever you choose, make sure to remove any thousands separators.
- An optional column with categories for subtotals. If you want to group these ups and downs to show a subtotal after the changes, you’ll need an additional column where you assign the changes to a category. We'll explain more about that further down in this article.
This is what the data for our chart looks like:
| Date | Nintendo annual cash on hand |
|---|---|
| 2016 | 7548000000 |
| 2017 | 8325000000 |
| 2018 | 8892000000 |
| 2019 | 9747000000 |
| 2020 | 11194000000 |
| 2021 | 16378000000 |
| 2022 | 15227000000 |
| 2023 | 13907000000 |
| 2024 | 15544000000 |
| 2025 | 13584000000 |
Uploading your data
Once you have prepared your data, create a new chart in Datawrapper. You can do so by going to our homepage and clicking on Start creating. In step 1: Upload, you can copy & paste your dataset, upload it as a .csv or Excel file, or connect to a Google Sheet. It will look like this:
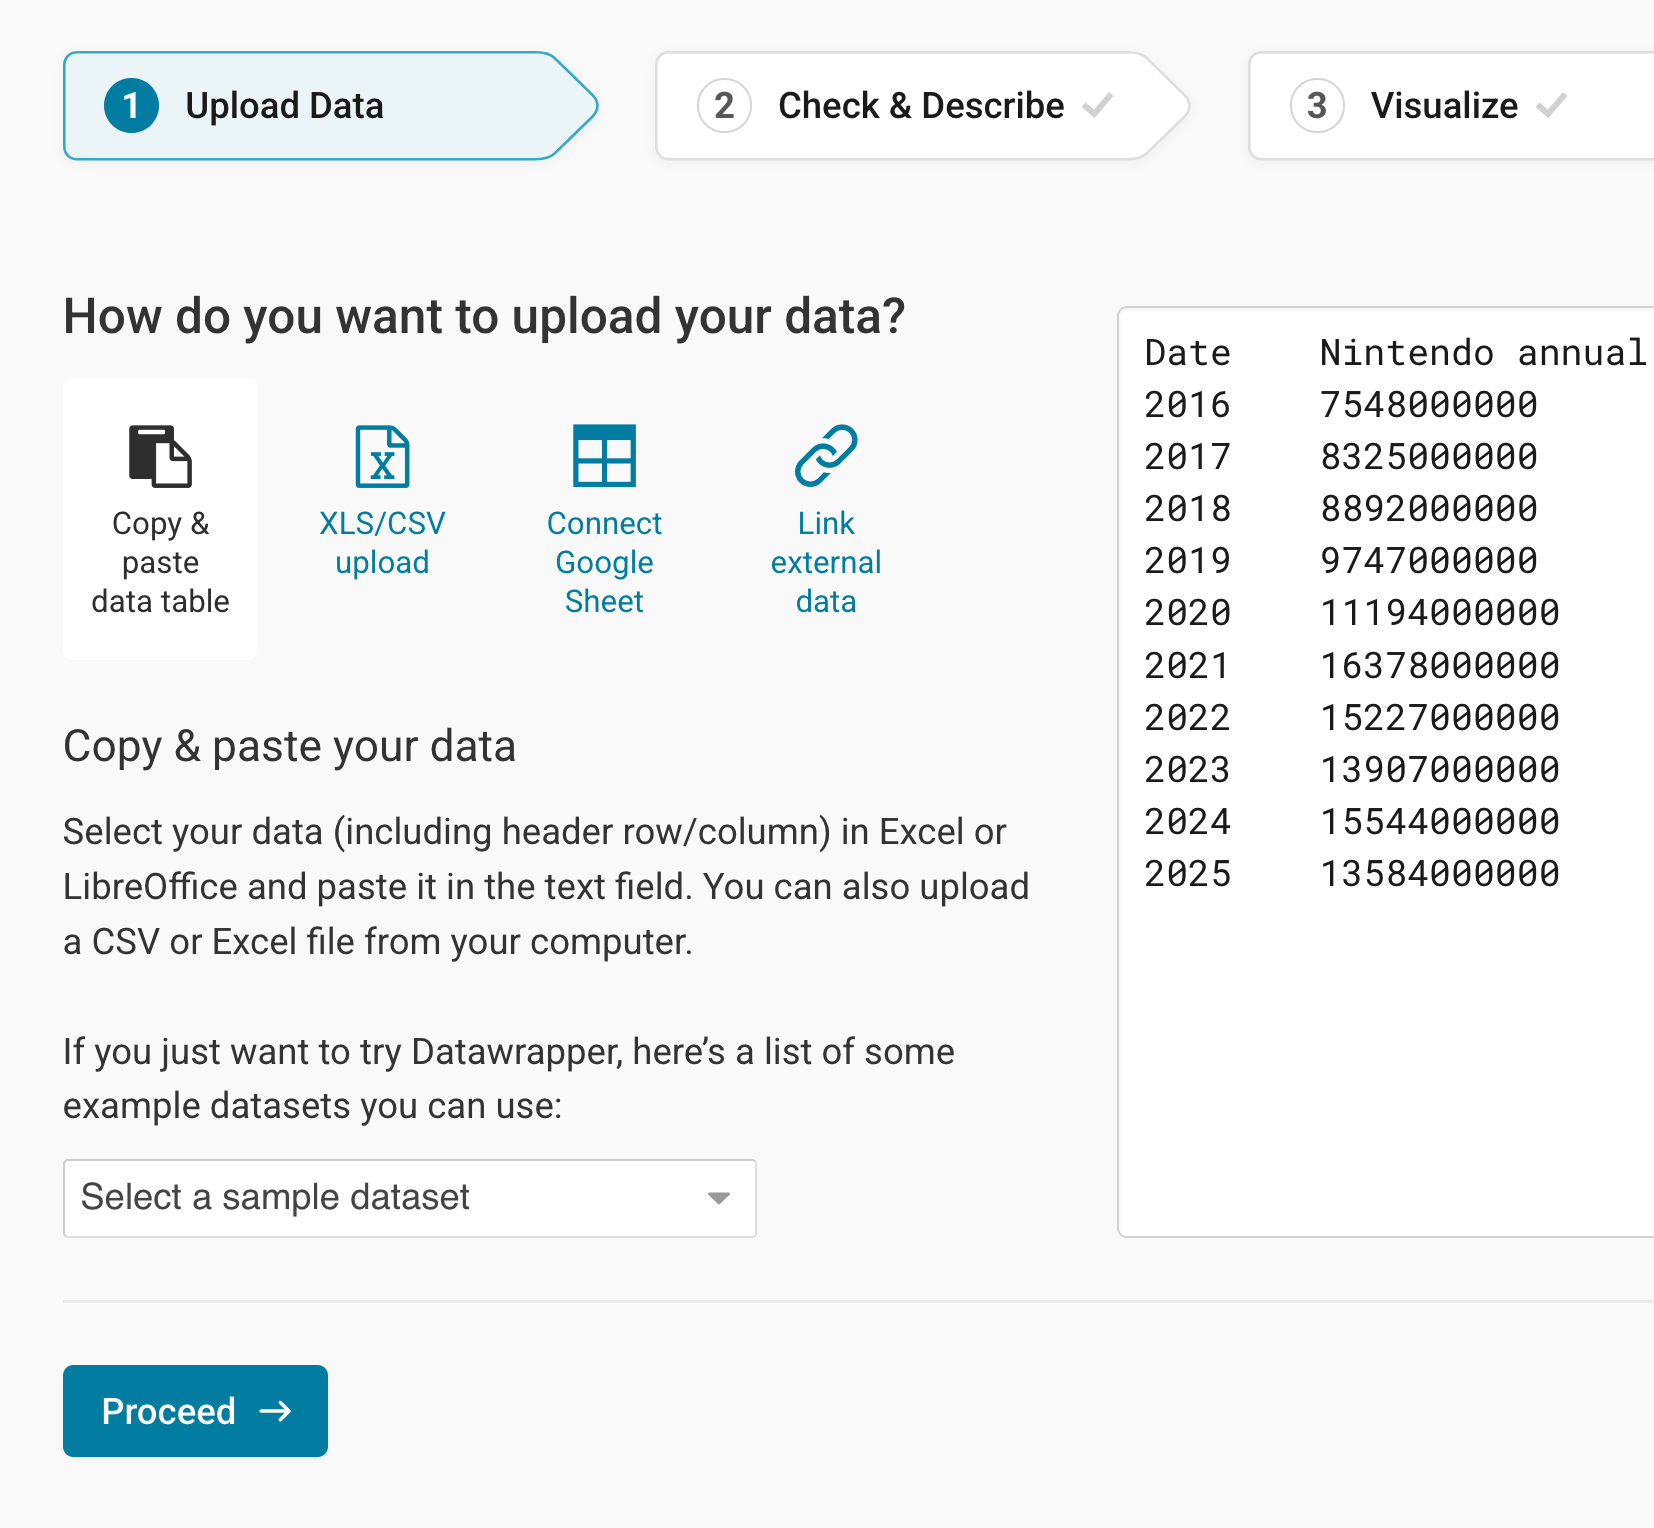
Click on Proceed in the bottom left to go to step 2: Check & Describe.
Checking data and units
In step 2: Check & Describe, you'll see that Datawrapper puts your data into a neat table:
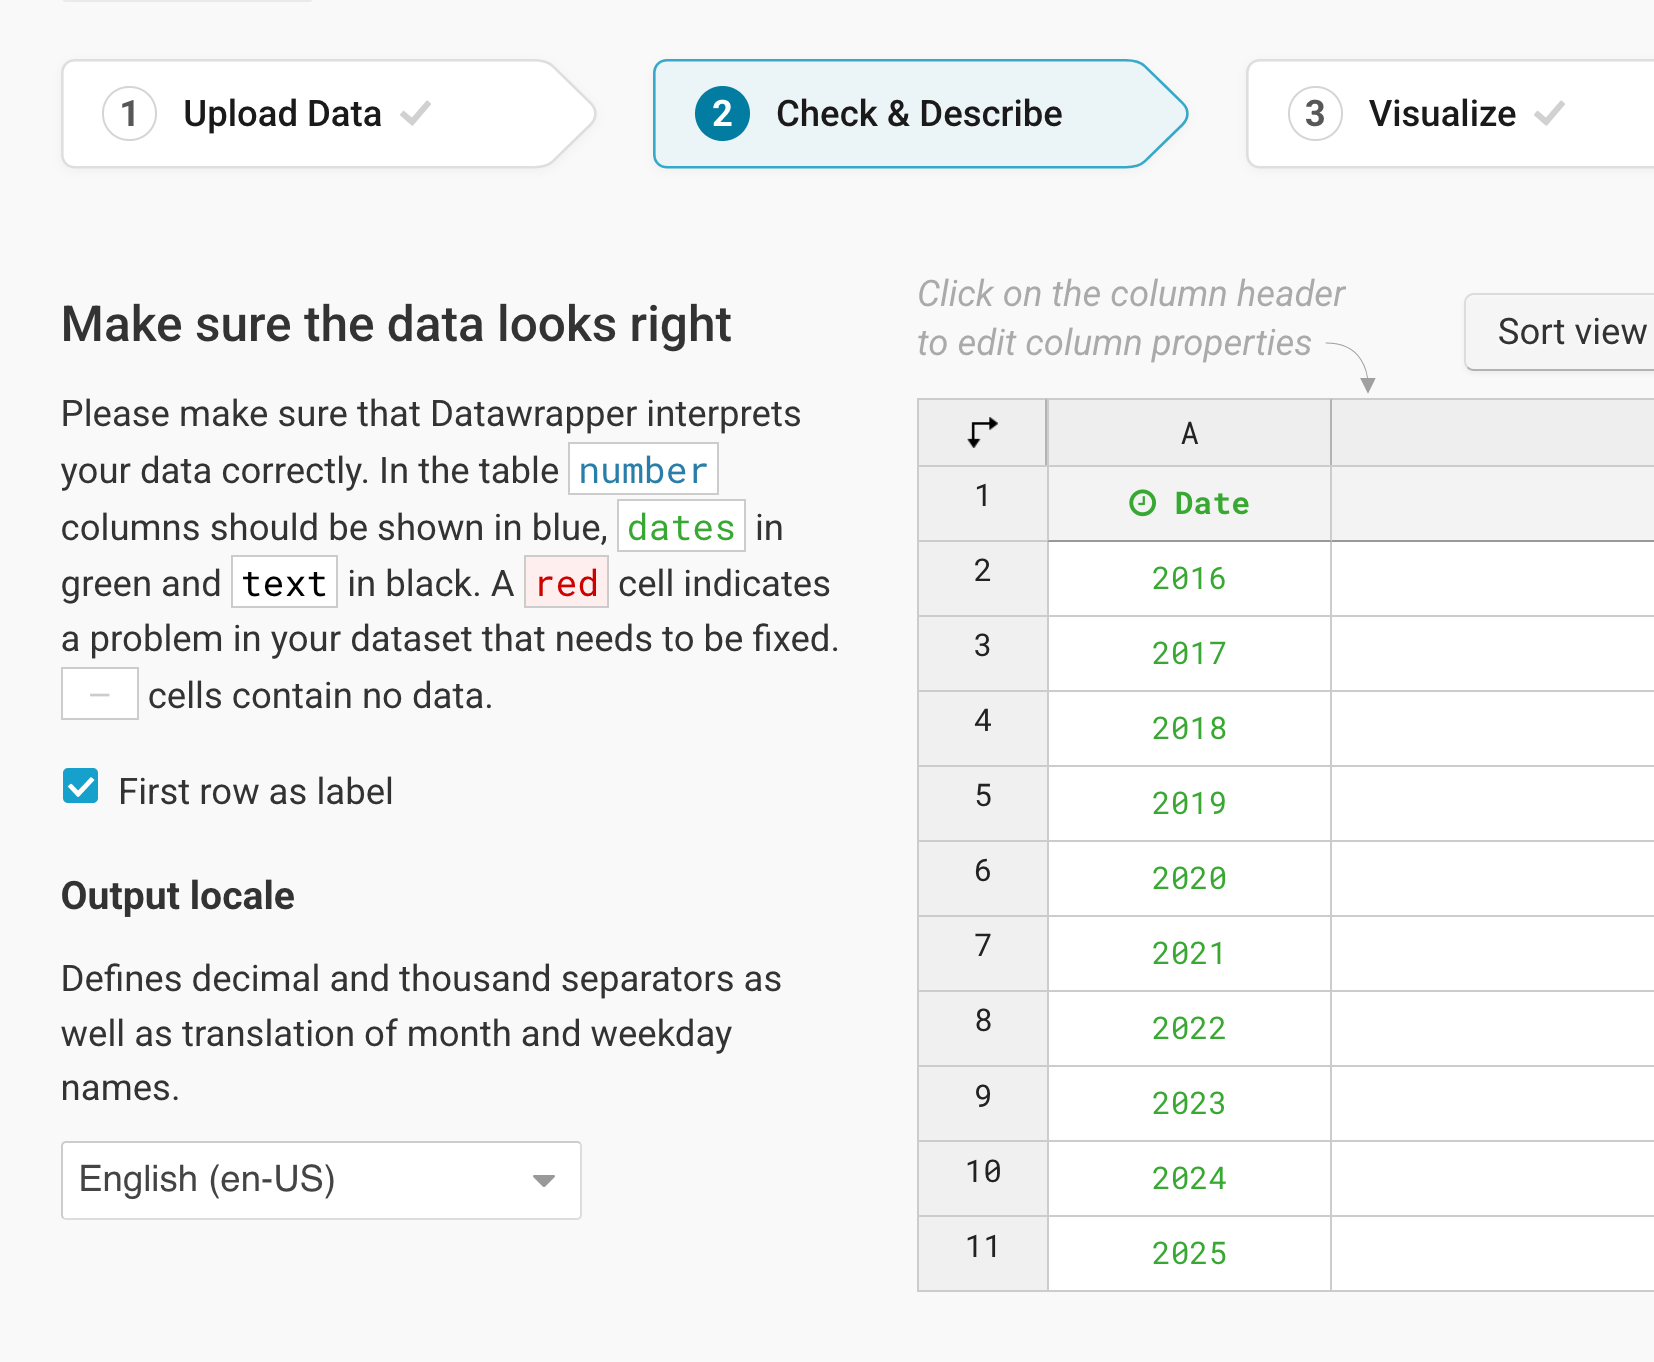
Datawrapper automatically detects data formats (number, dates, or text) and empty cells. In our example, the first column is green – a column with dates. The second column is blue and right-aligned, meaning Datawrapper recognized the cells as numbers. If necessary, you can manually change the data format by clicking on the column header and selecting a different format.
To add a unit (like km/h, kg, inch, $, etc.) to your numbers, click on a column header and then add the unit of your choice to the Prepend/append options on the left. You can learn more about adding units to numbers here.
For now, that looks good, so let's click on step 3: Visualize, to see your data visualized.
Choosing a waterfall chart
In the Visualize step, Datawrapper will almost always show you your data as a line chart to begin with. Click on any of the other chart types to see your data visualized differently. To create a waterfall chart, simply click on Waterfall:
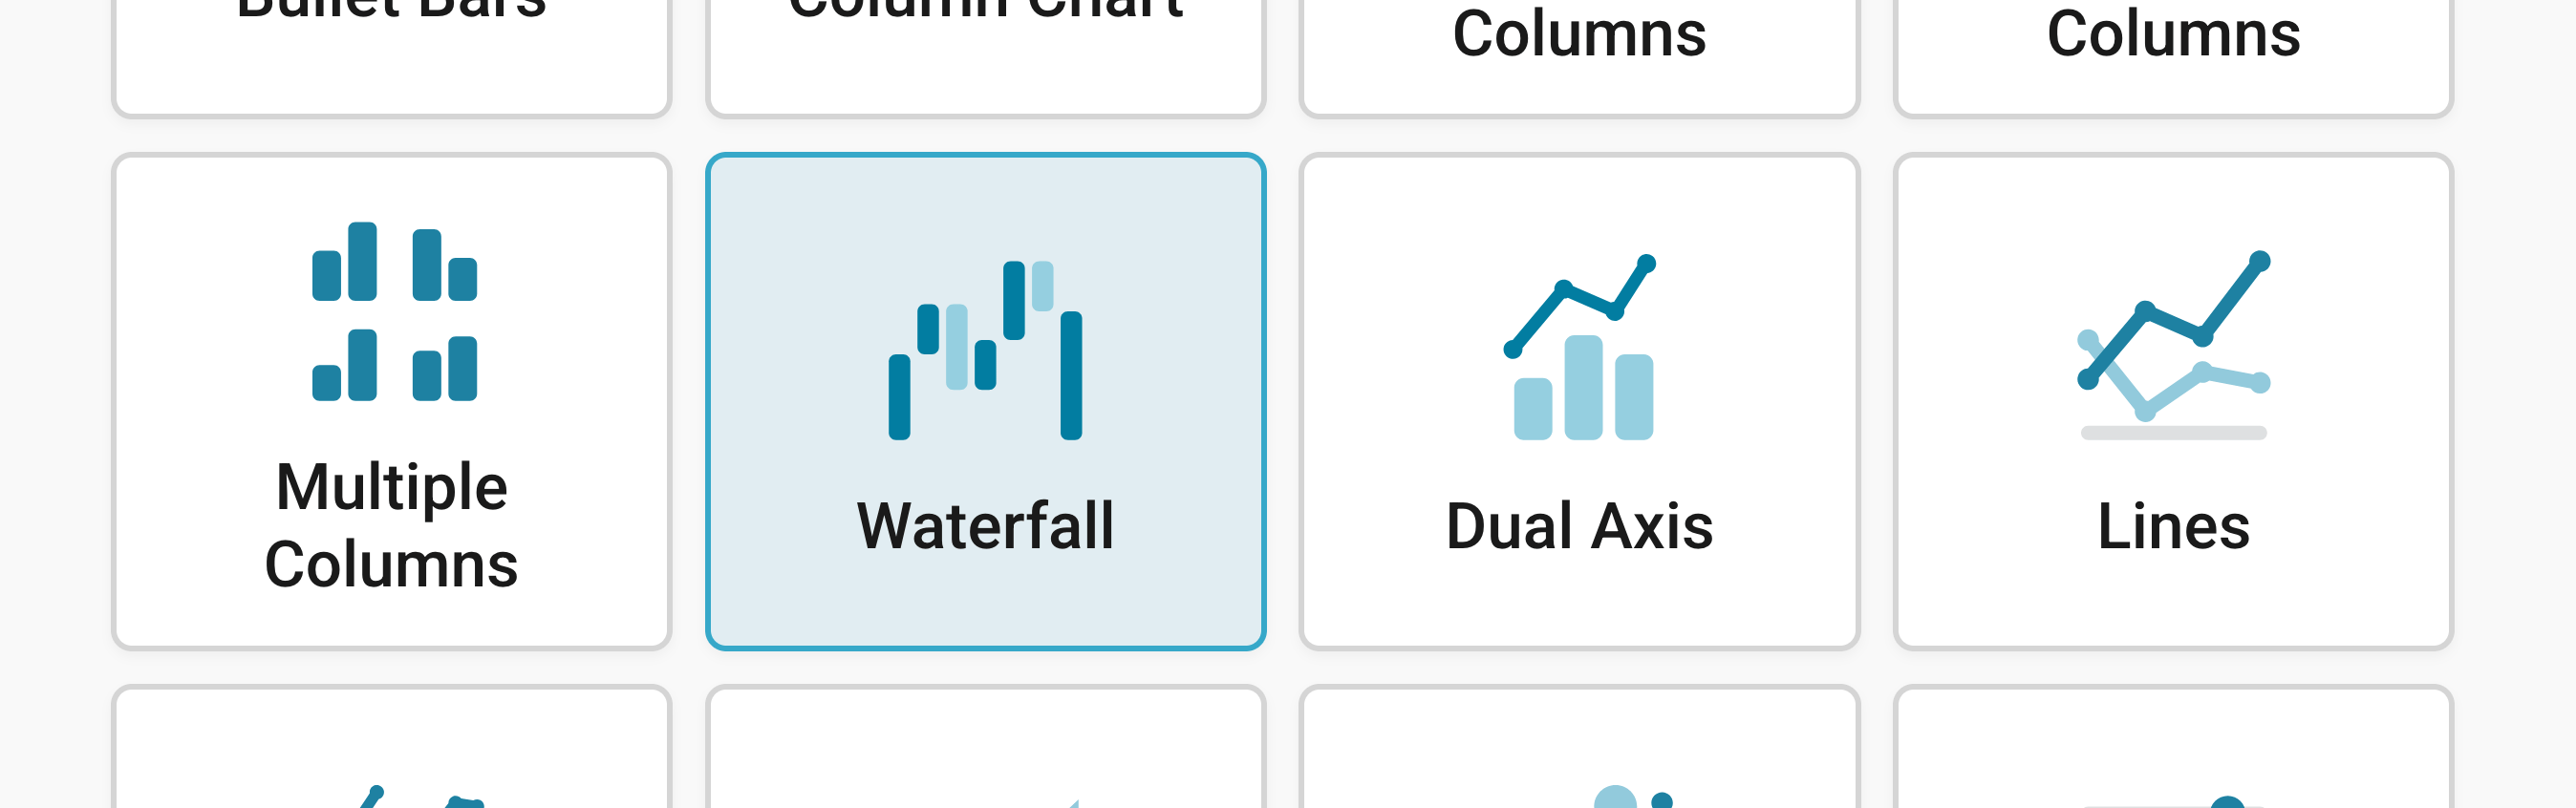
Congratulations! You've successfully created a waterfall chart. Besides Chart type, you'll notice three more tabs in this step: Refine, Annotate, and Layout.
Resizing
In any tab of step 3: Visualize, you can click, hold, and drag the arrow in the lower right corner to scale the chart window or manually determine the dimension of the chart by entering values in the boxes below the chart (Size).
We recommend checking what the chart looks like on different screen sizes multiple times while designing it, by clicking on the little icons (mobile, tablet, and computer) below the chart.
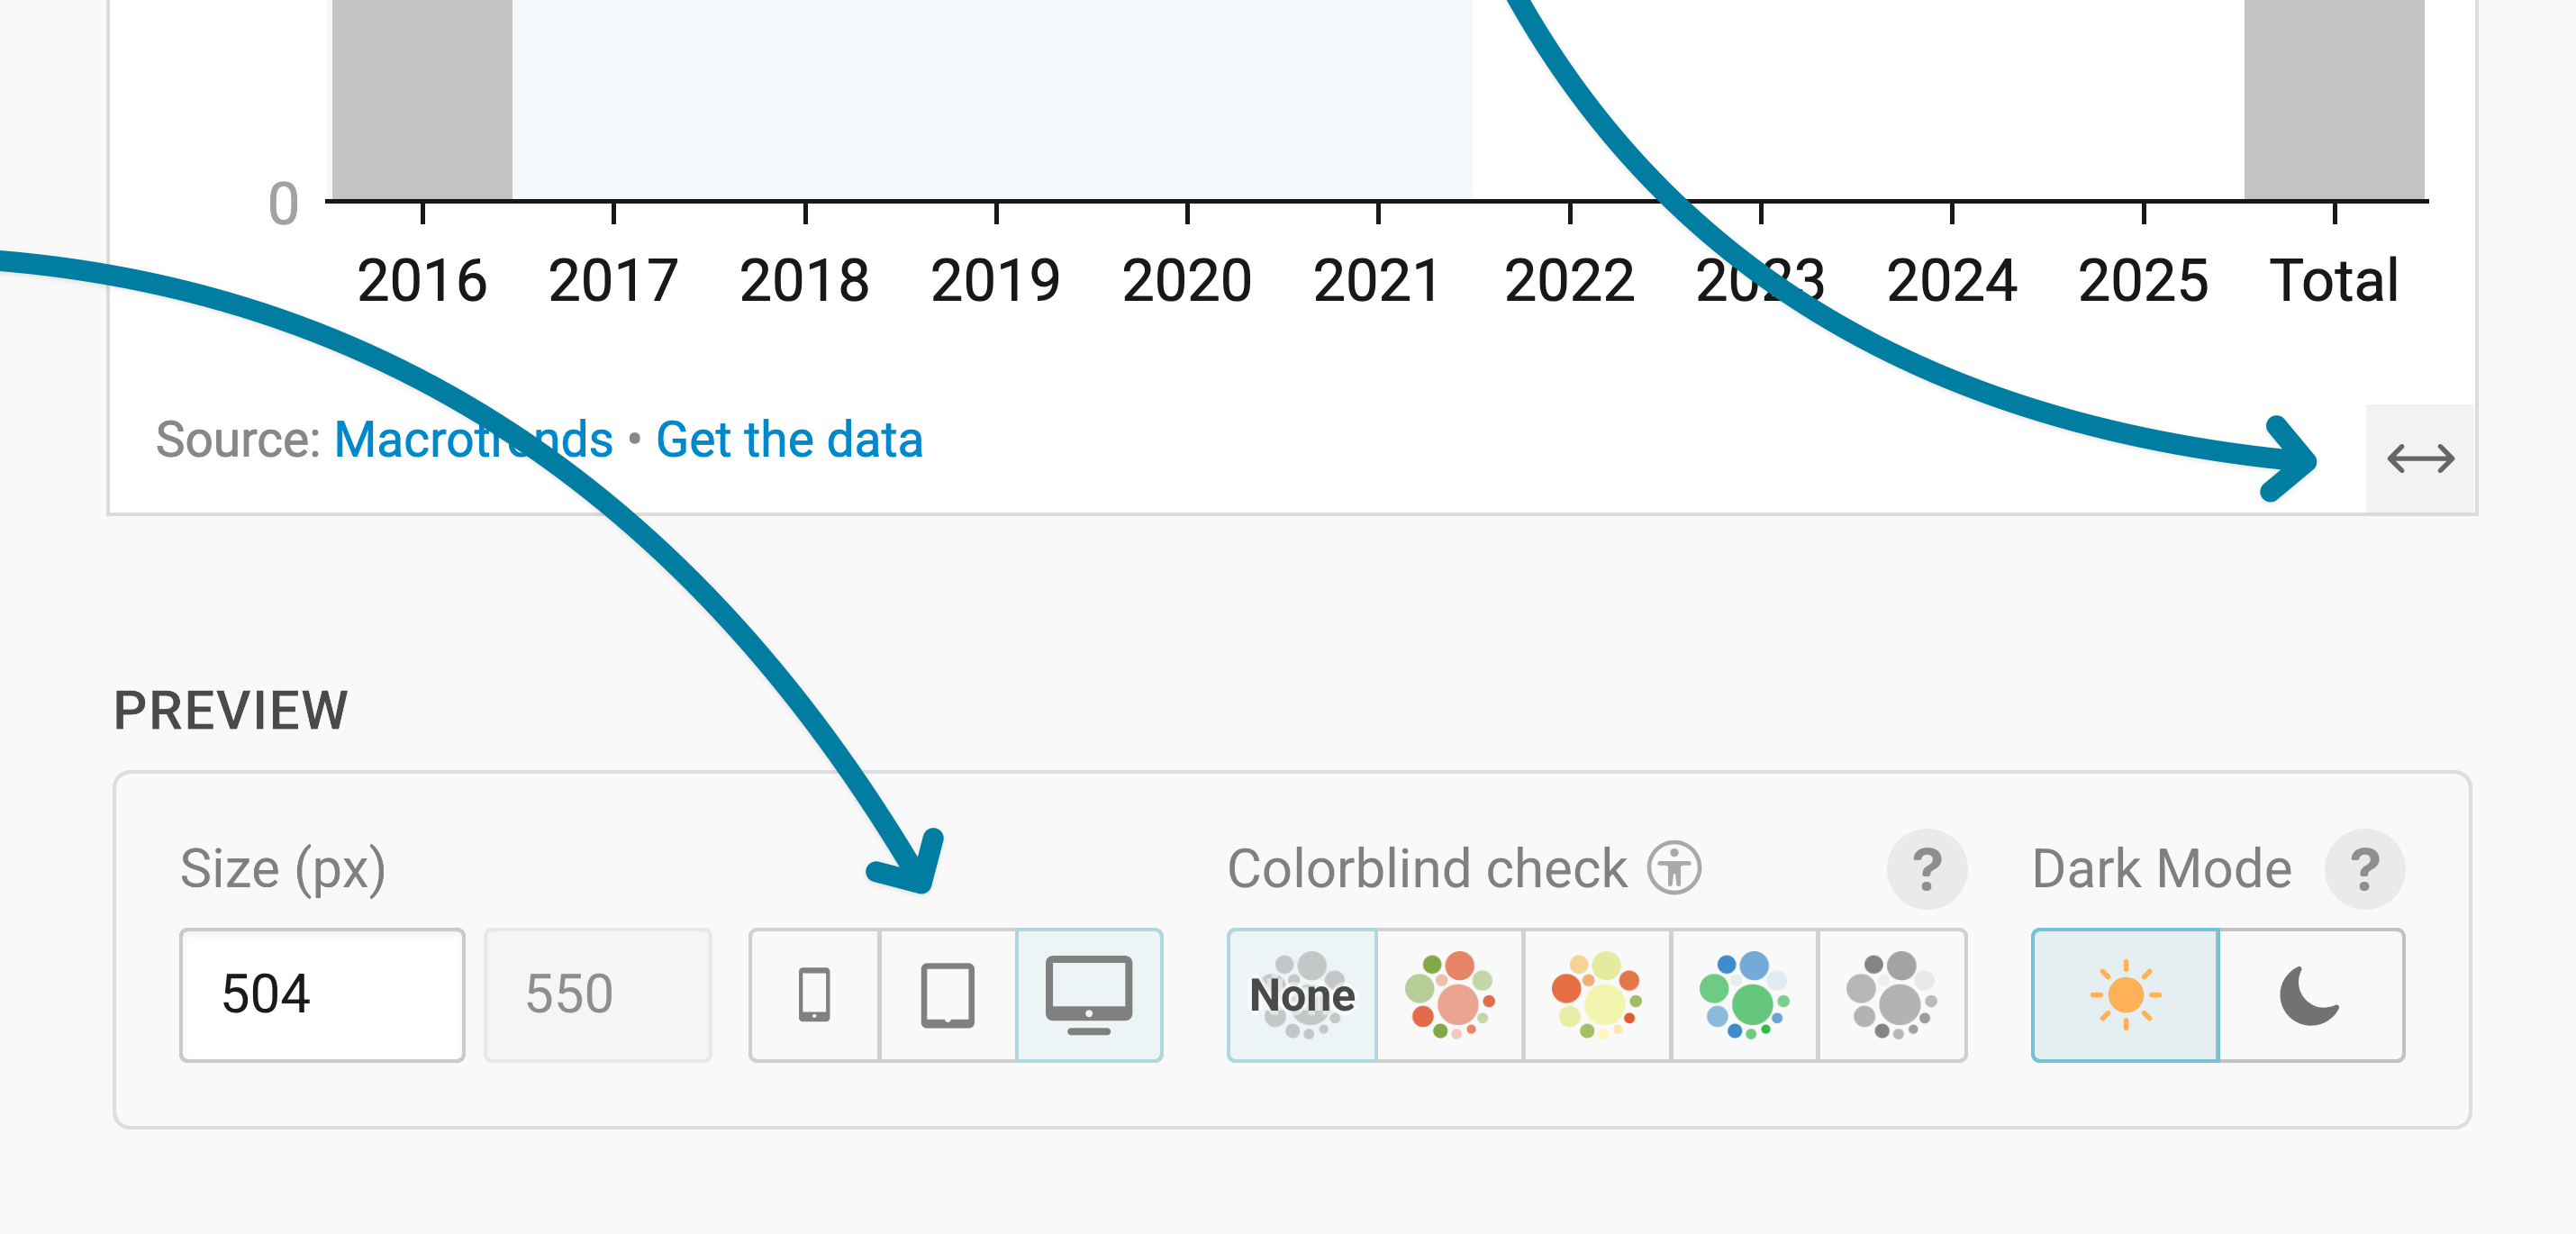
Learn more about changing the width and height of your chart in this article.
Refining your chart
Let's continue with the Refine tab. Here, we see eight panels: Waterfall data, Horizontal axis, Vertical axis, Columns, Labels, Tooltips, Sorting, and Appearance.
Choosing your data (format)
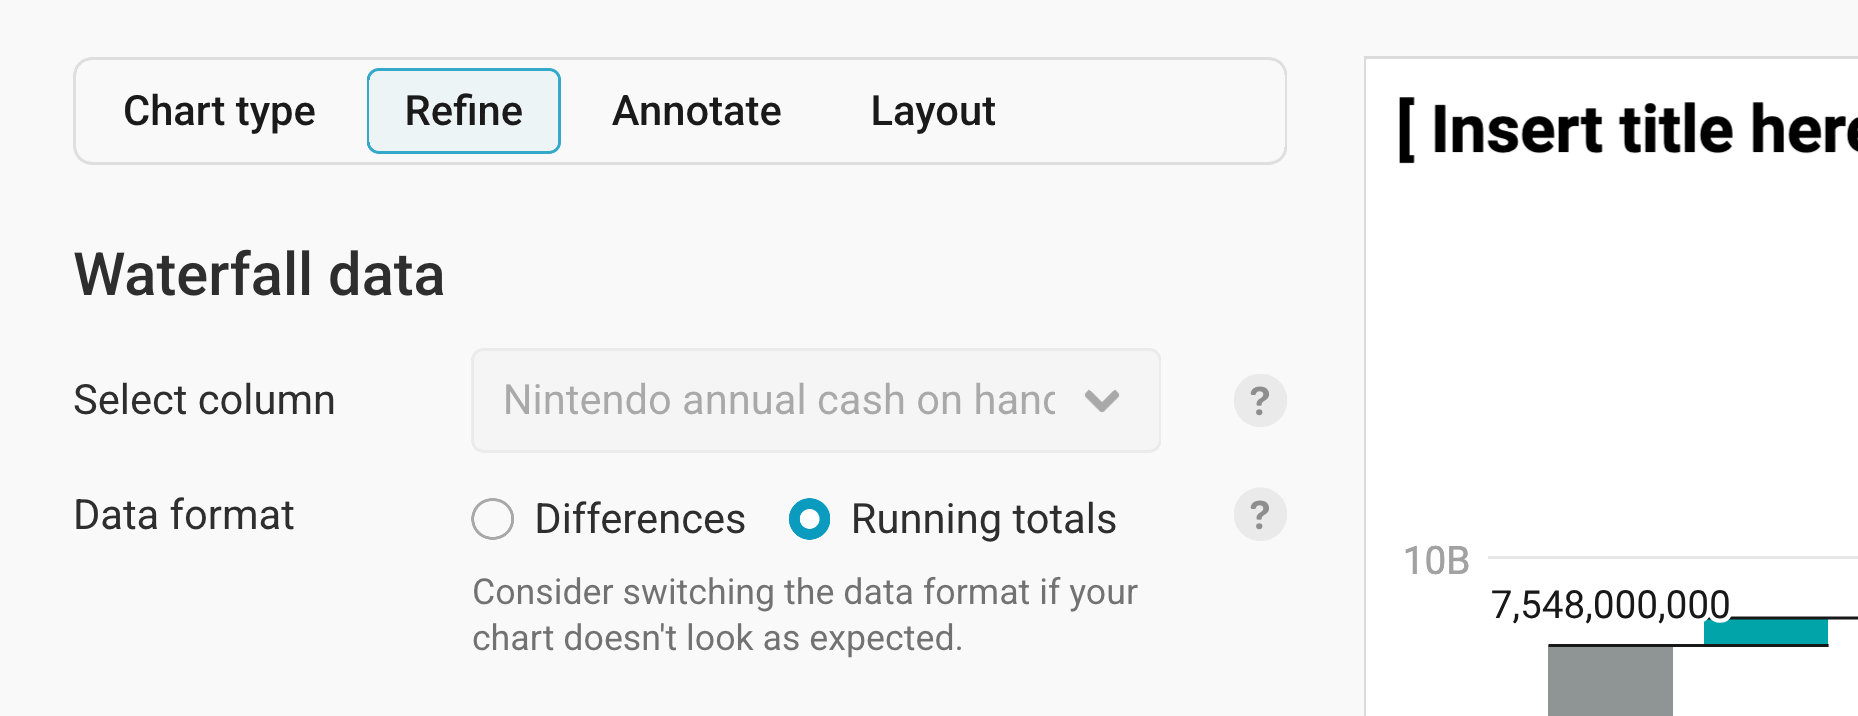
At the very top of the Refine tab, you can set which column of data in your dataset is visualized and also what format that data is in.
- Select column: Select the data column that contains numeric values to be shown in the waterfall chart. If you only uploaded one text or date column – like we did – you see this field grayed out. Datawrapper automatically selects that one text or date column.
- Data format: Let Datawrapper know what your number column contains:
- Differences, meaning your data consists of value changes between rows ("1000, +3000, -2000, -1000," etc.). This is the default.
- Running totals, meaning your data consists of absolute/total values ("1000, 4000, 2000, 1000," etc.). In this case, Datawrapper will calculate the differences between your values. Our dataset consists of running totals, so selecting that as our data format will make the chart look like what we're expecting.
Changing the horizontal axis
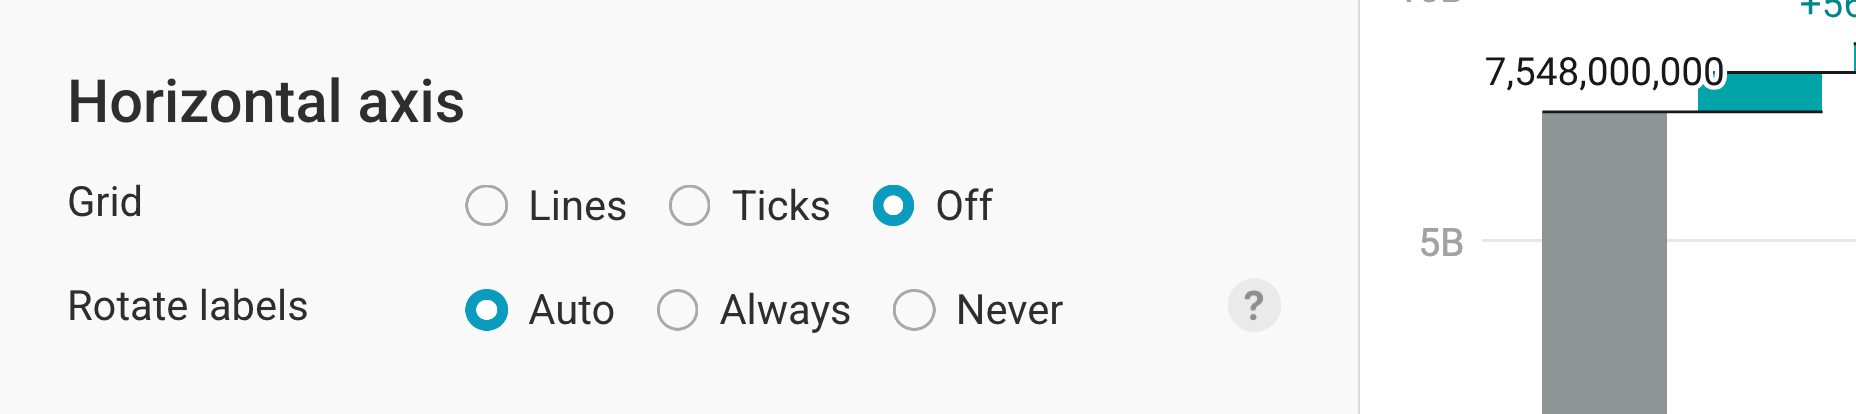
This section lets you change the style of your x-axis.
- Grid: By default, no grid lines are shown. You can decide to show them, or to only show ticks above the grid labels.
- Rotate labels: This setting allows you to rotate the labels of your columns if some of the labels are too long to fit in a horizontal fashion. Here you have the choices of Auto, Always and Never. If set to Auto, labels will only rotate if there isn’t enough space for them to be displayed horizontally (e.g. on narrow screens). Whatever you choose, make sure to check the mobile view of your waterfall chart.
Changing the vertical axis
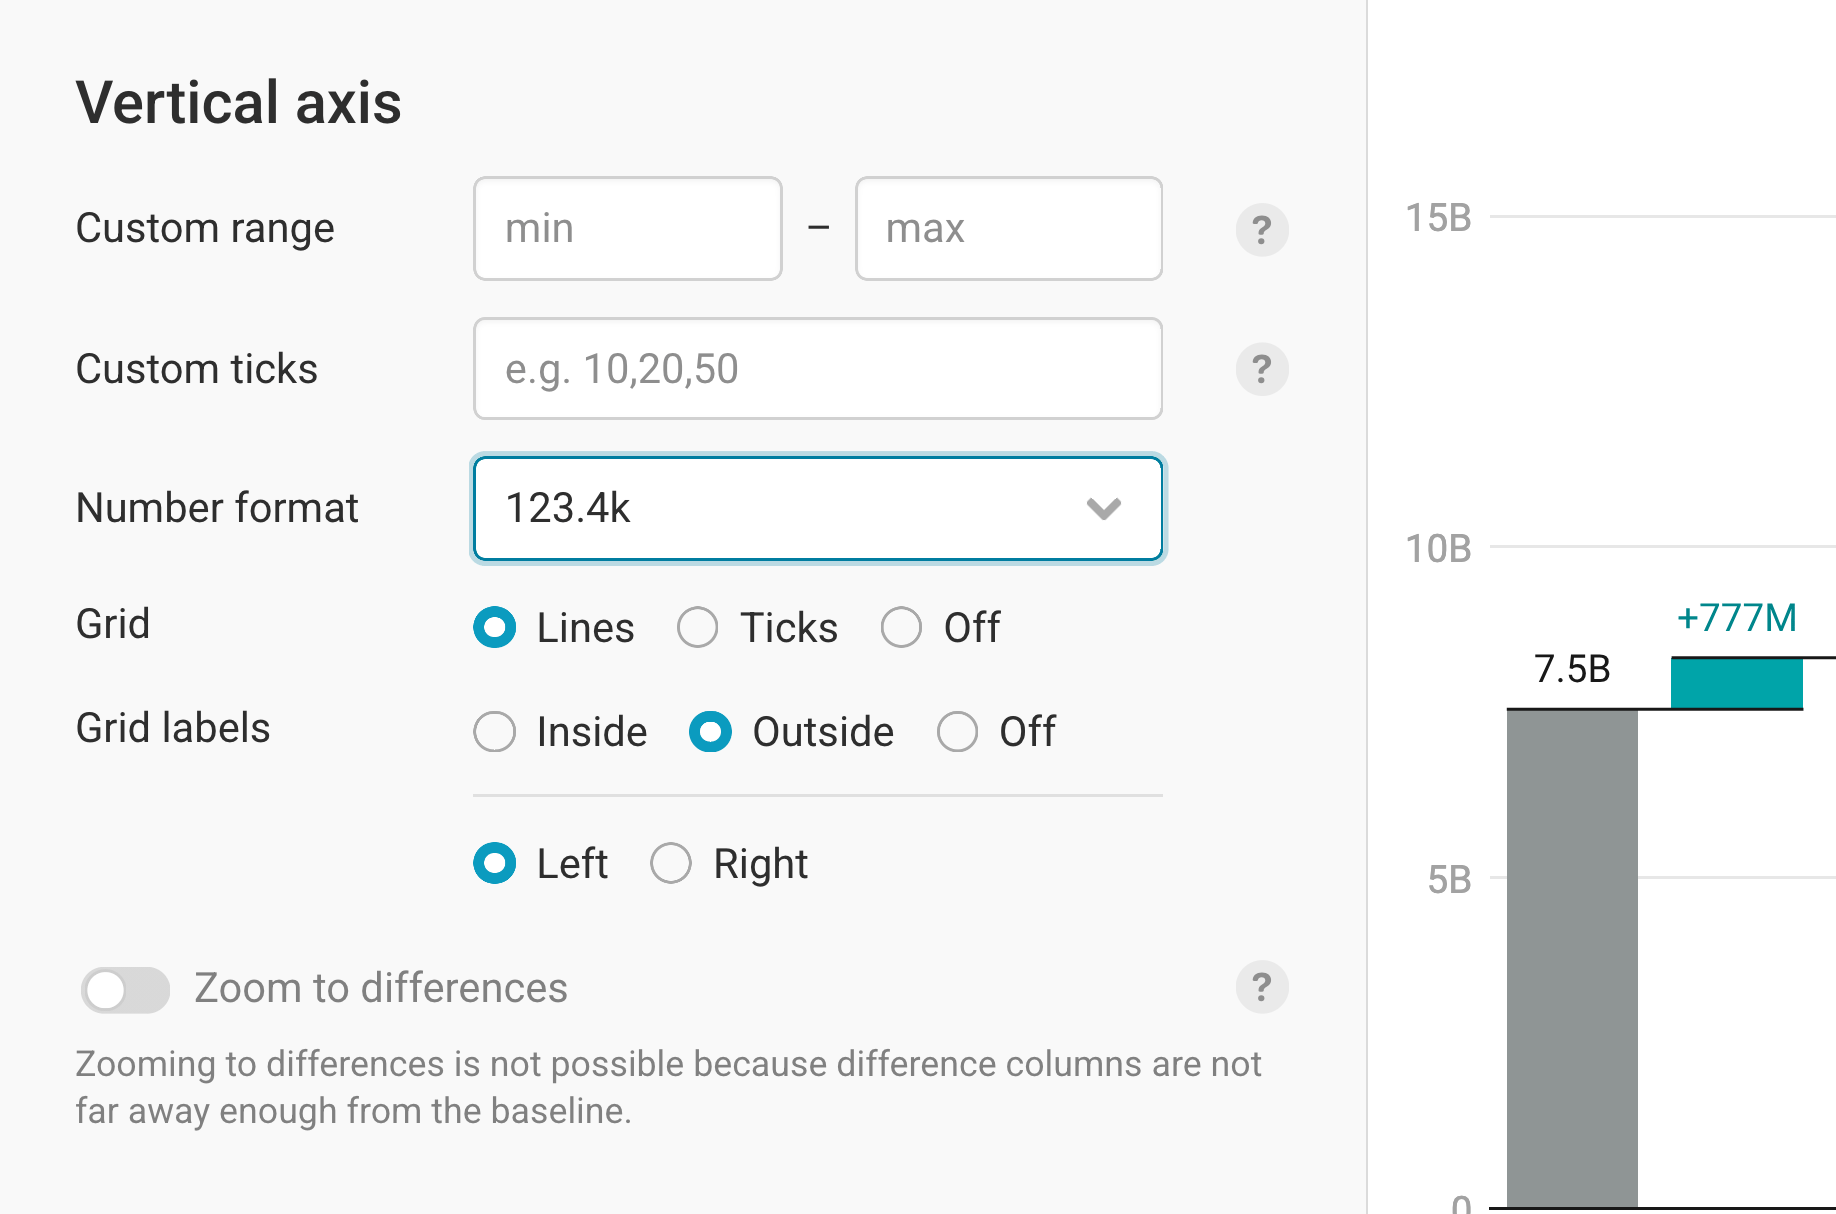
You can modify the following on your y-axis:
- Custom range: By default, the vertical axis spans from the lowest to the highest value – although Datawrapper might extend the chart to the zero baseline if it's close. Using the custom range option, you can extend or cut off the y-axis at the top or bottom. Note that setting a range that cuts off data will be ignored.
Custom ticks: By default, Datawrapper tries to find a good-looking number of grid lines it then labels. You can change that by adding your own values, separated by a comma. Note that values will only be shown if they don’t overlap and fall within the custom range.
Number format: Choose how your numbers should appear (e.g. 200,000 or 200K or 200,000.0%). Learn about the available options in this Docs article. For our chart, we choose the 123.4k format to shorten the long numbers.
Grid: Selecting the Lines option will show grid lines at every column, while Ticks only shows a short tick mark. You can also not show them at all by selecting Off.
Grid labels: You can decide to display your grid labels outside (= to the left, in left-to-right charts) or inside of the chart body. Further down, you can also choose between showing your labels on the right or on the left. Alternatively, you can choose to hide them entirely.
At the bottom of the Vertical axis settings, you'll find the option to Zoom to differences. This will only be available when the distance from the minimum value in your data to zero is greater than the distance from the minimum value to the maximum value in your data. That's not the case for our data (our minimum value is 7.5BN and our maximum value is 16.4BN), so this setting is grayed out.
If you turn on Zoom to differences, Datawrapper crops the vertical axis range to show the differences at full height, and shows the start and end columns as either a point or a column with a gradient. Here's another chart to demonstrate this effect:
Styling the columns
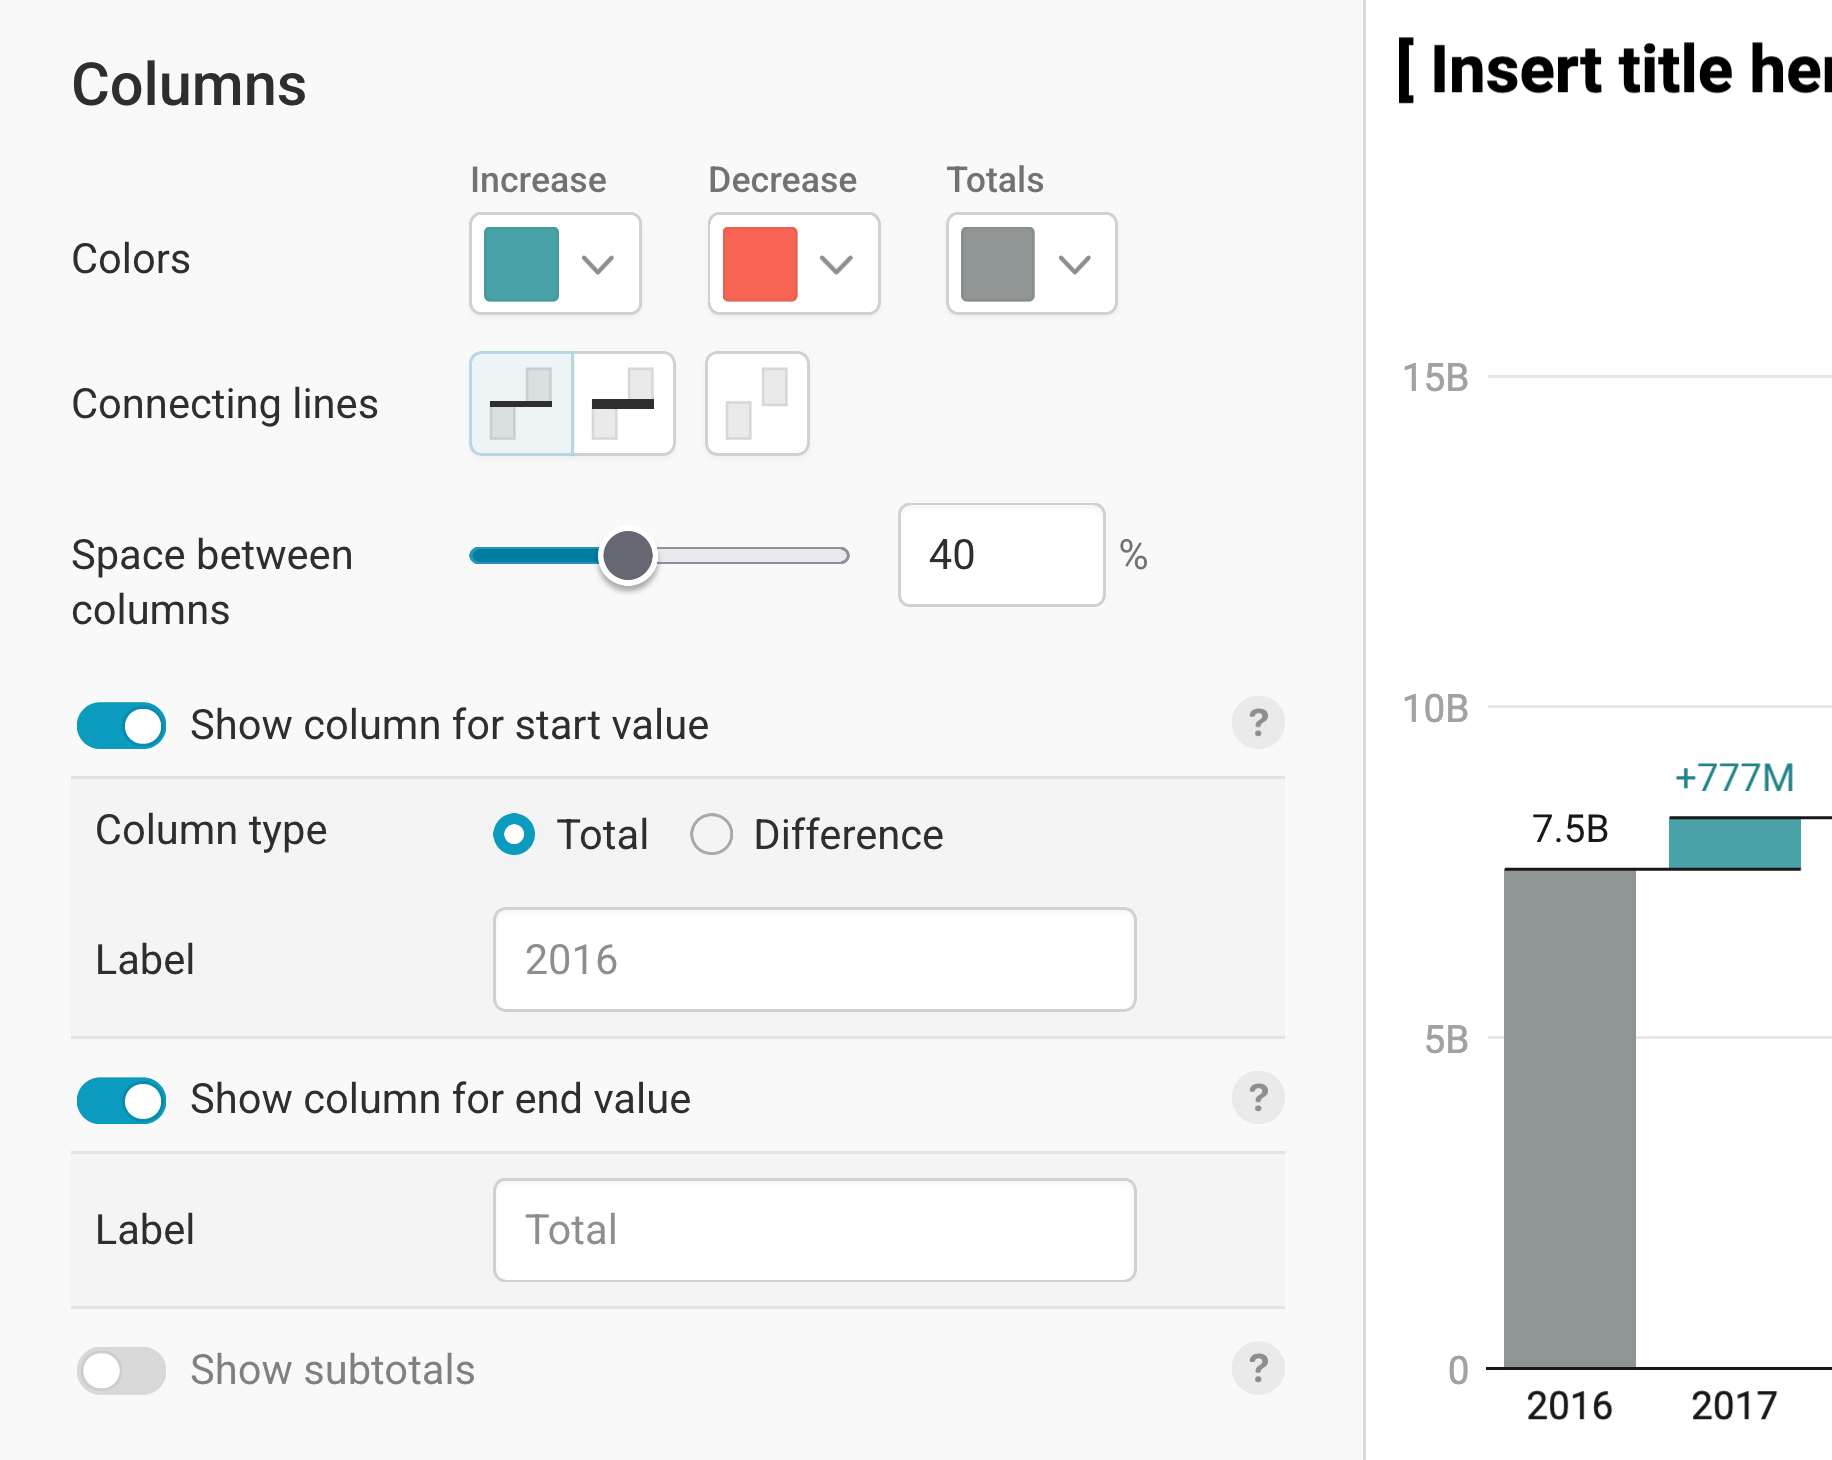
This section lets you change the color and width of your columns, and decide on what information to show.
- Colors: You can control the color of increases, decreases, and (sub)totals. By default, we show a colorblind-friendly green and red.
- Connecting lines: By default, Datawrapper draws thin connecting lines between the columns. Here you can switch to thicker lines, or turn them off entirely. In general, connecting lines can make it easier to track developments as you move horizontally across your chart, but hiding them can look cleaner.
- Space between columns: By default, the gap between columns is 40% of the column width. Here you can change this from 0% (no gap at all) to 100%.
For our chart, we decide to change the color for increases to a Nintendo-like blue, remove the connecting lines, and decrease the gap between the columns:
There are three more options in the Columns section:
- Show column for start value: This toggle lets you show or hide the first column (from zero to the first value). This option is toggled on by default. Note that even when hidden, the start value still sets where the first column begins. You can also indicate if the starting column shows a Total or a Difference and customize the Label text if you wish. While hiding the starting column is less common for most use cases, it can be a helpful option if you want readers to only focus on the differences.
- Show column for end value: Similarly, this toggle shows or hides a column that represents the final value after all differences are added. This option is also toggled on by default, and here too you can customize the Label text.
The last option is Show subtotals: If your dataset contains an additional column where the changes are assigned into categories, you can use this toggle to insert automatically calculated subtotal columns after each category. Here's an example:
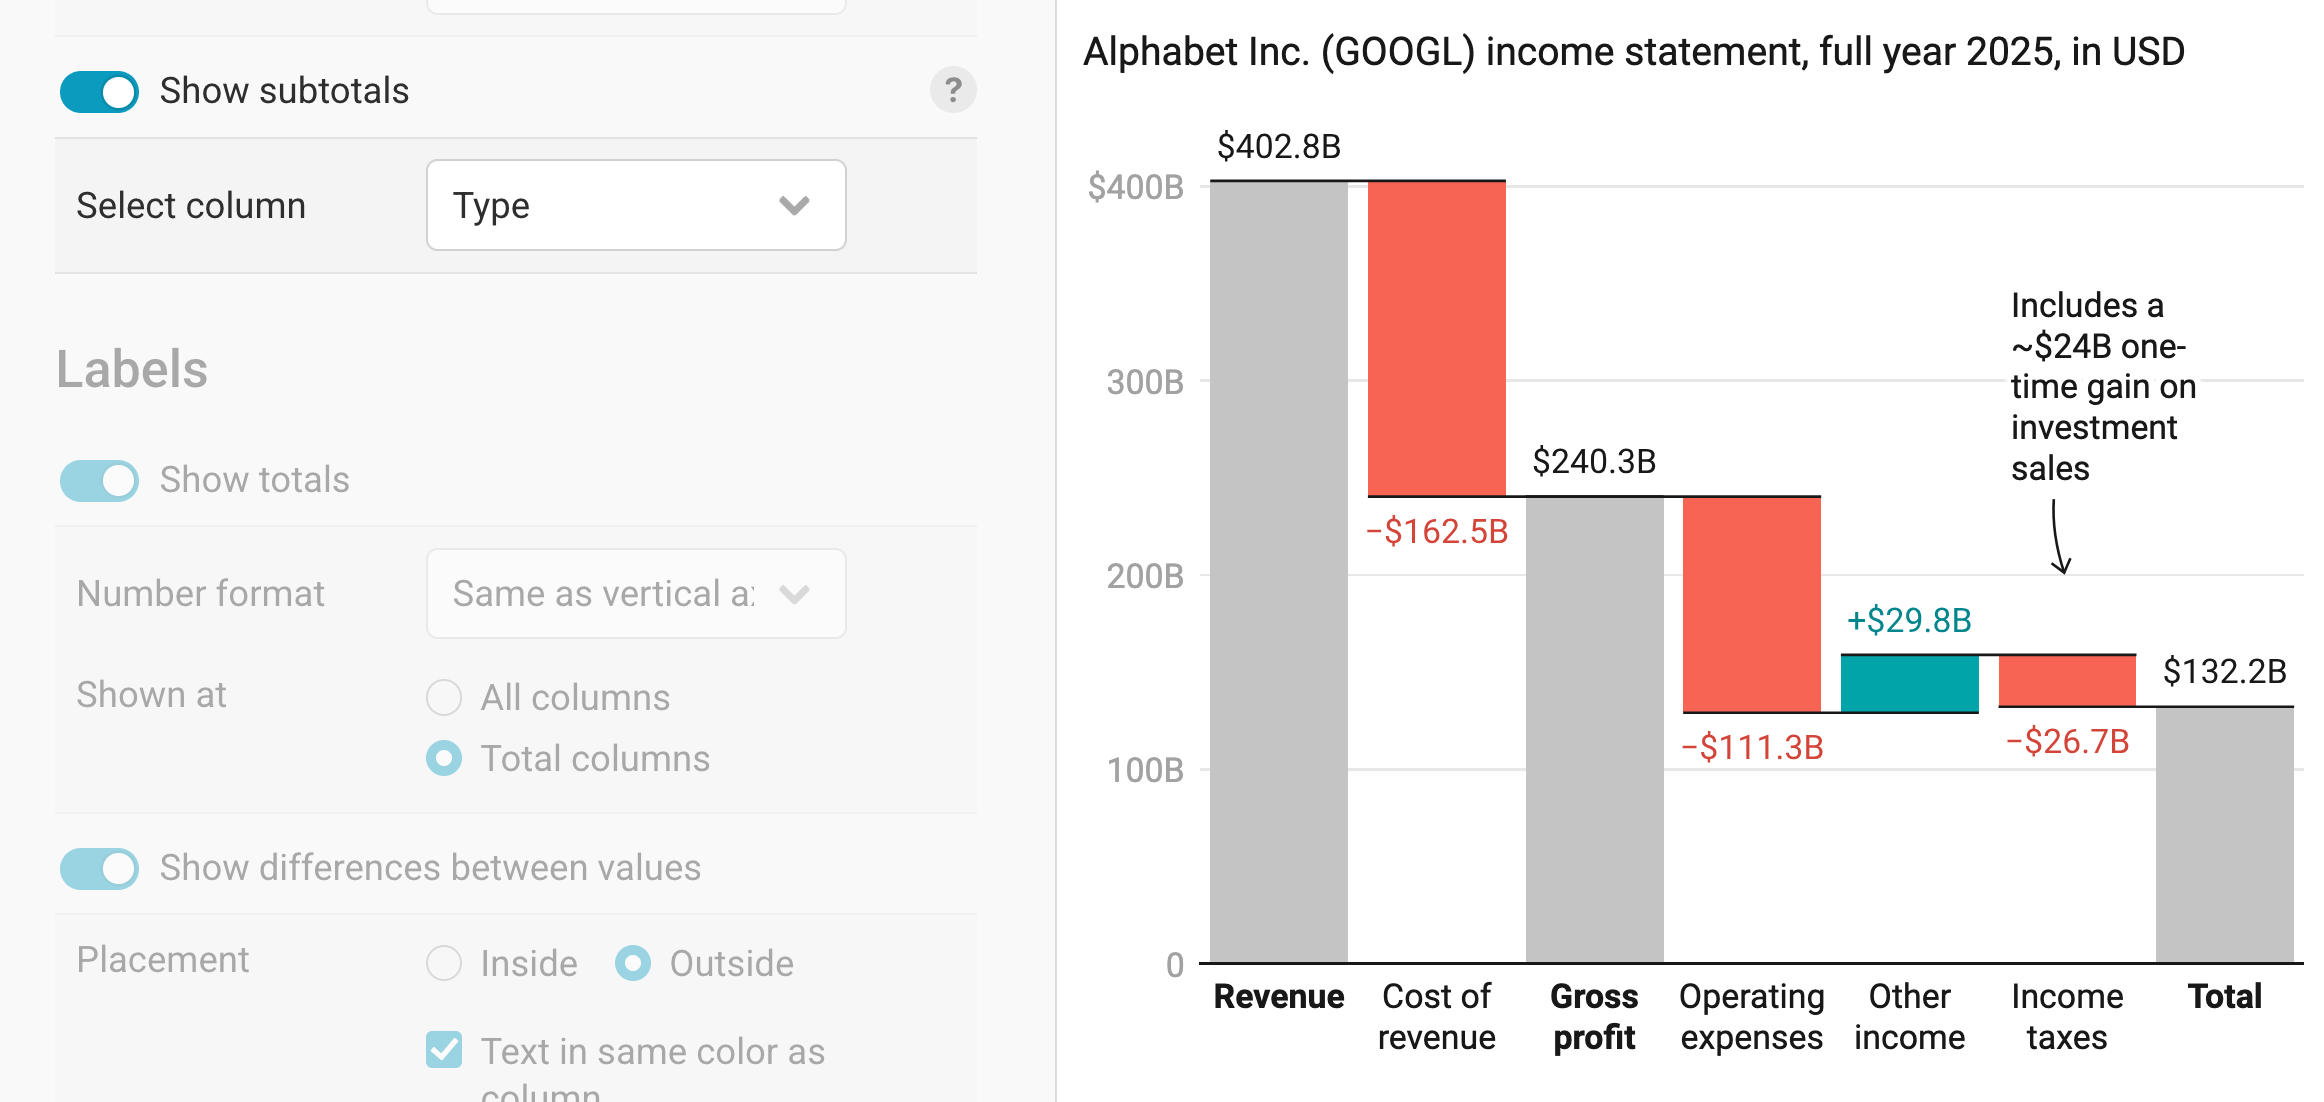
And here's what the dataset looks like for these subtotals:
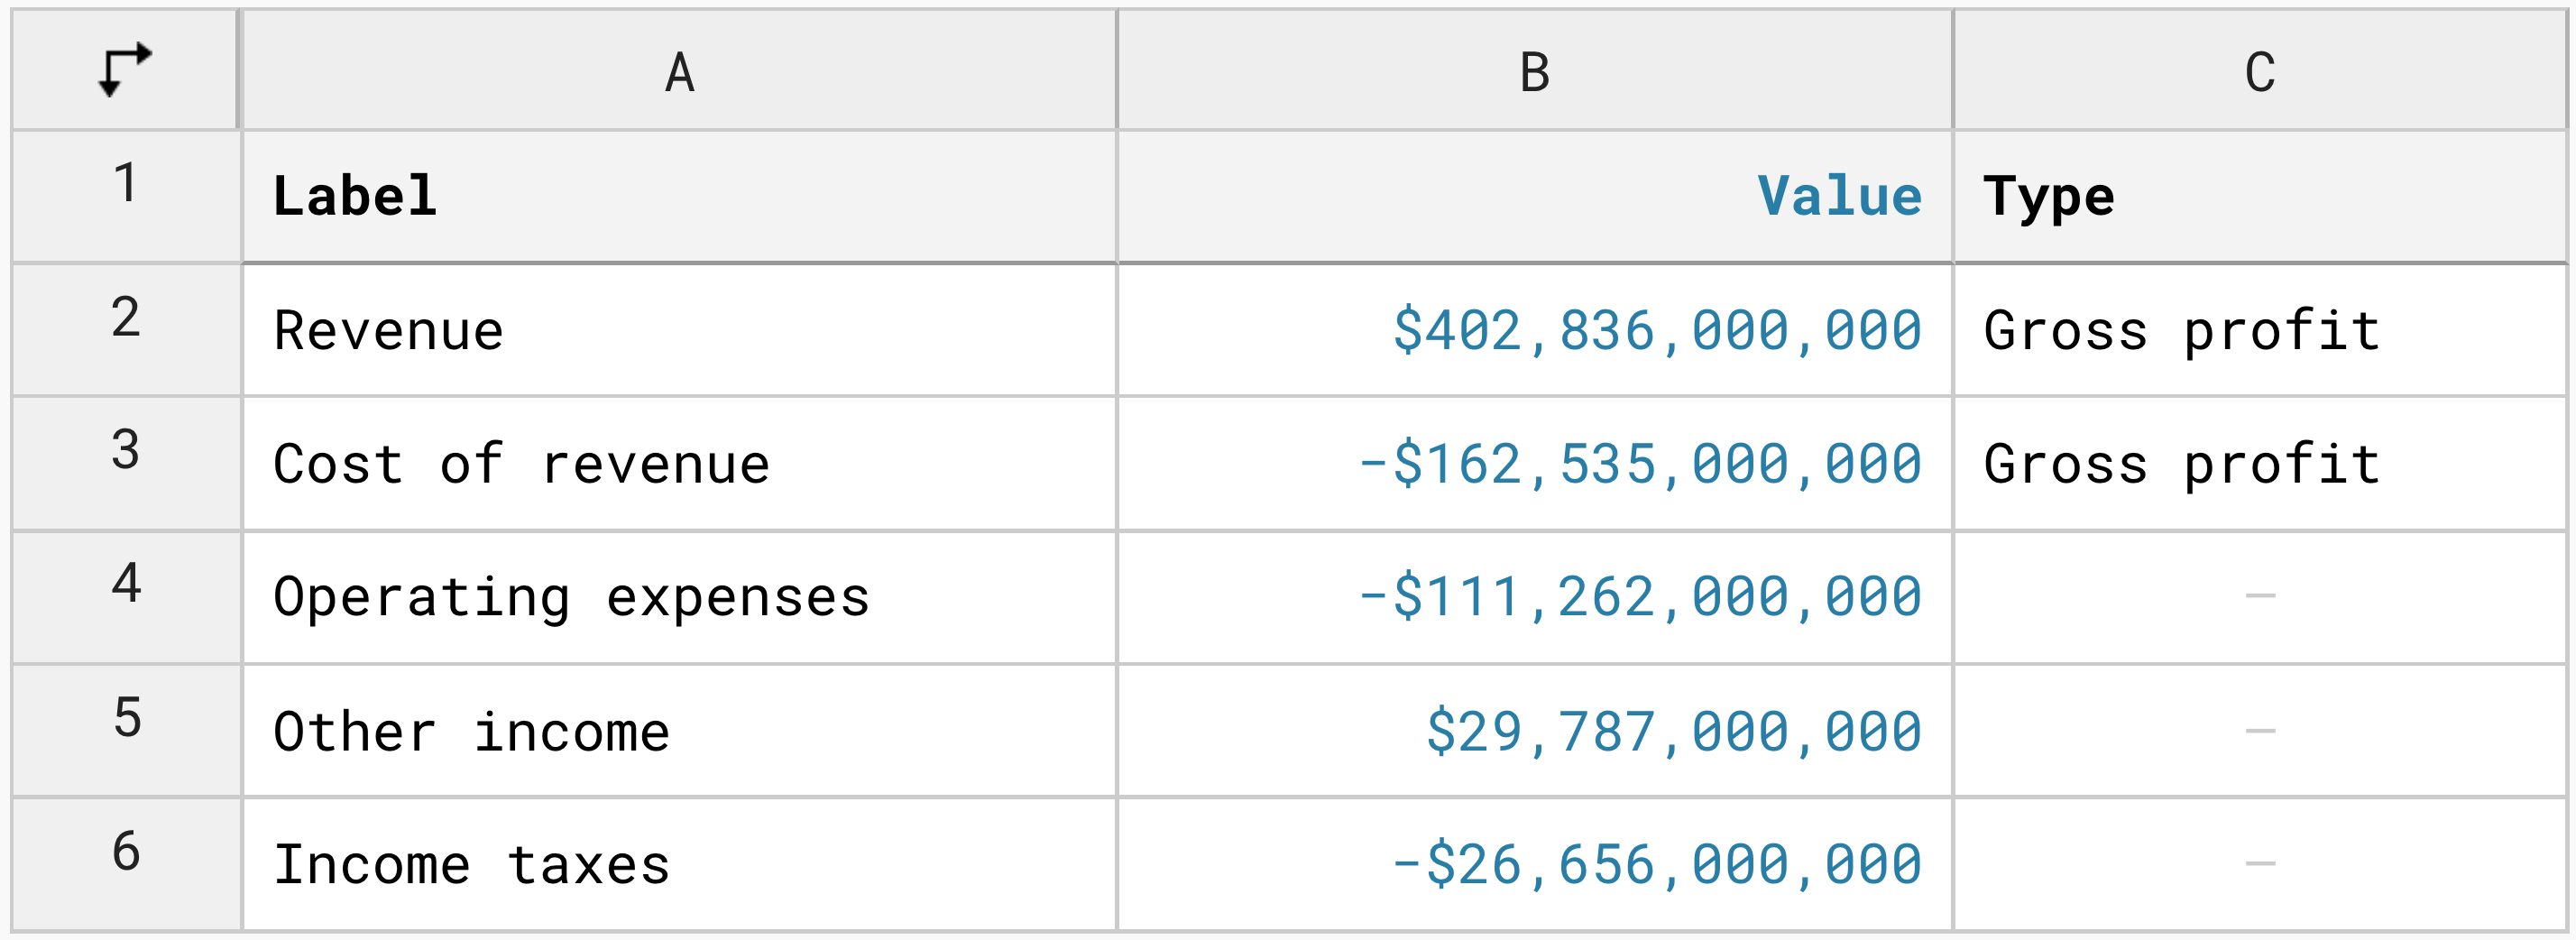
In this case, we only "group" the first and second columns in the chart to show a "Gross profit" subtotal. We could also add more categories in our "Type" data column, to add more subtotals between the start and end columns.
Formatting labels
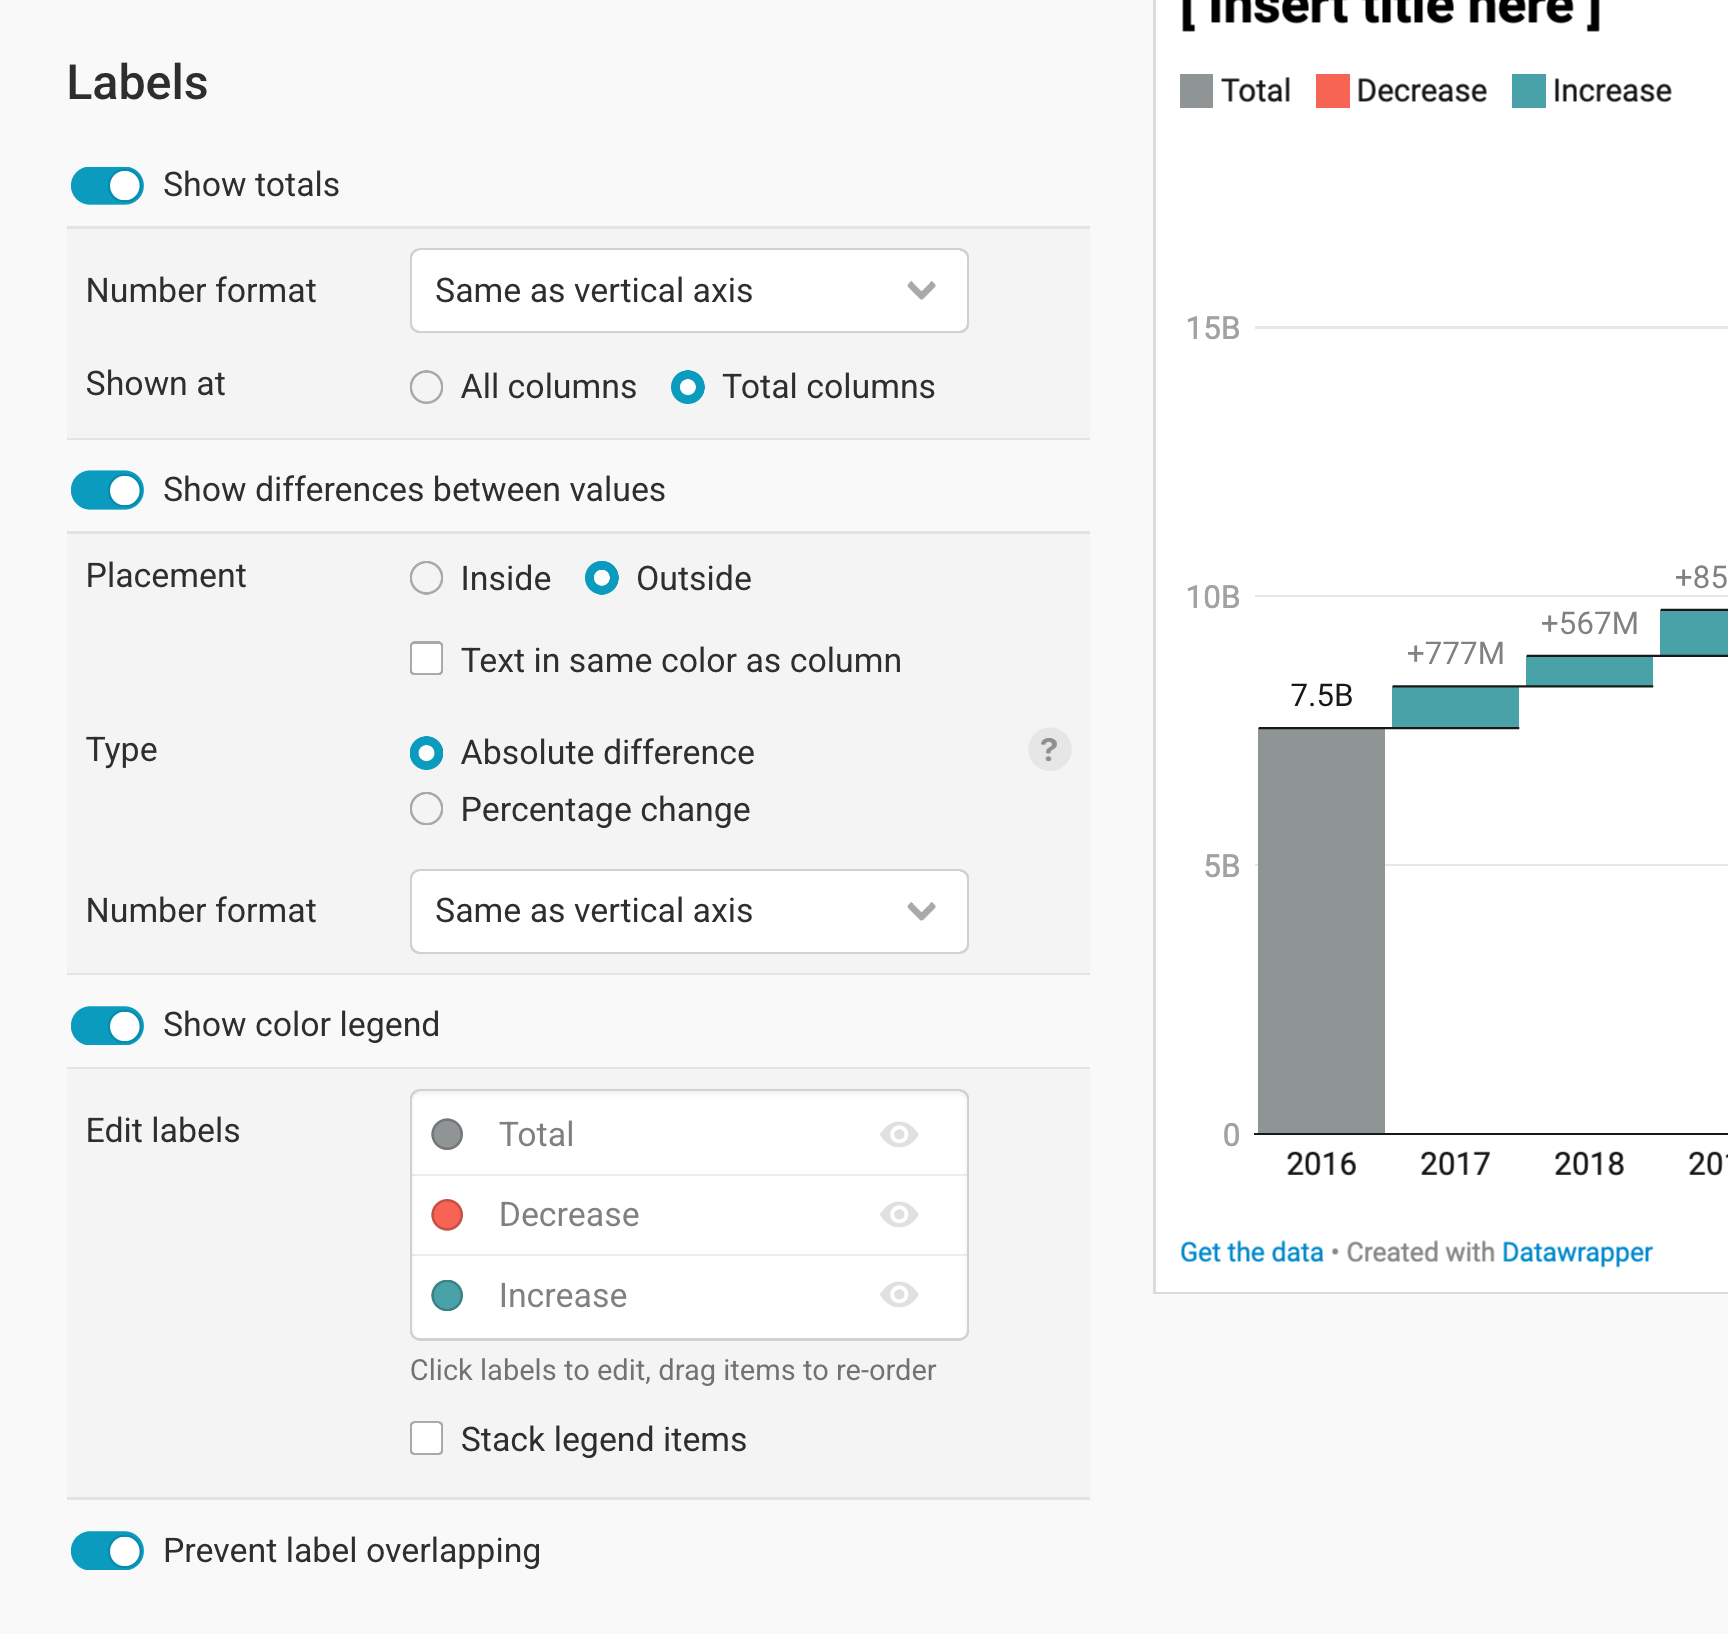
This section lets you change the style of your labels and where they show up.
Show totals controls the appearance and number format of the total labels, as well as whether they should be shown on all columns or only on the (sub)total columns.
Show differences between values allows you to show or hide how much each difference column adds or subtracts from the previous column. This difference can be displayed as either the absolute difference or the percentage change between the values. In terms of styling options, you can set the number format of the labels, place them inside or outside of the columns, and show the label text in the same color as the column.
Show color legend gives you the option to display the color key for your different column categories (e.g. increases, decreases, totals), as well as adjust how they appear. To change the label text, click on the text in the list and start typing. To change the order of color legend items, drag an item in the list around. And to stack the color key items on top of each other – for instance, because you have long labels – click on Stack legend items. By default, the color legend is turned off, since the colors (red for decreases, green for increases) are often self-explanatory.
Prevent label overlapping: In some cases (and most commonly on small screens), column labels can overlap — for example, if two neighboring columns move in the same direction and the difference in value between them is minimal. This toggle gives you the option to automatically hide overlapping labels so they remain legible. By default, this is turned on.
Changing the tooltips
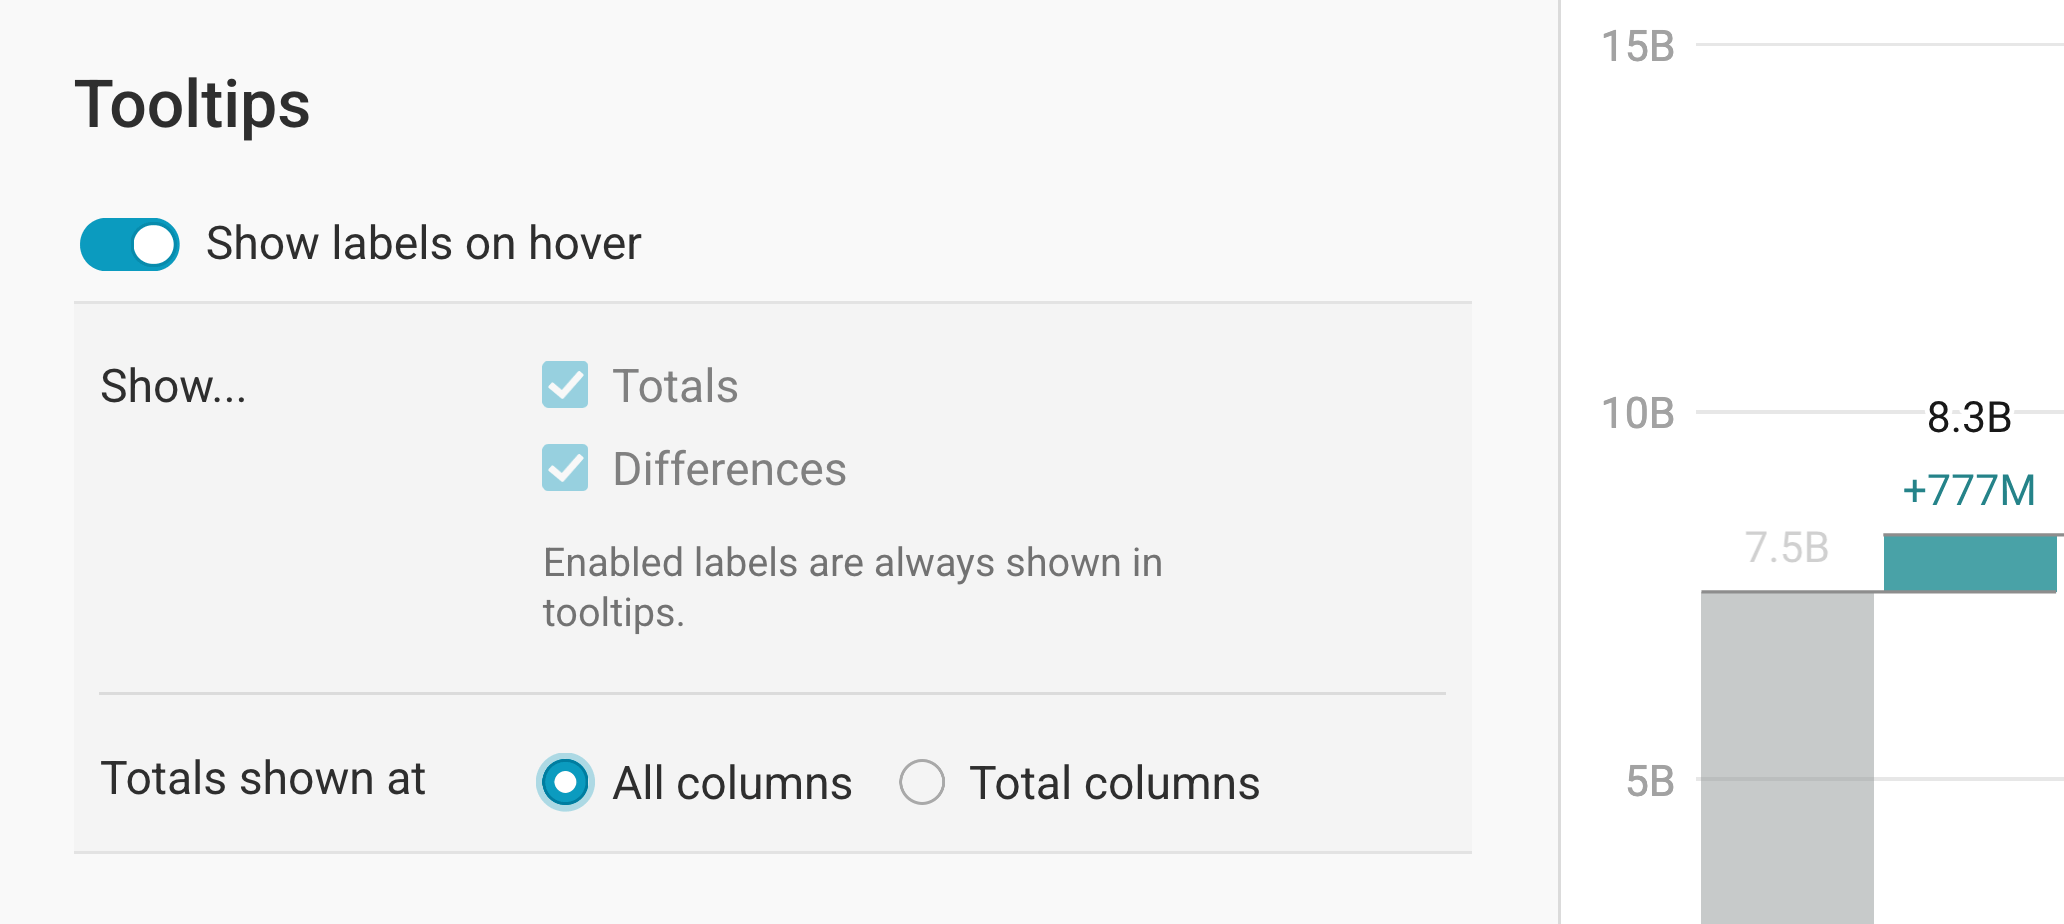
By default, your waterfall chart will show tooltips: if your readers hover over a column in your chart, they will see the underlying values. Here, you can turn that behavior off.
If you have tooltips enabled, note that any labels you have enabled in the Labels section are always shown in tooltips. If you previously opted to not show labels, but decide you want to show them in your tooltips, you will be shown the same label options as in the Show totals and Show differences between values sections.
Sorting the columns
By default, Datawrapper displays your columns in the order in which they appear in your dataset. However, you also have the option to override that and instead sort by increases first or decreases first, in ascending order.
Each subtotal group is sorted independently — except in one case: if the column labels are the same across subtotal groups, Datawrapper assumes you want a consistent order so they're easier to compare, and applies the sort order from the first group to all the others.
Changing height and margin
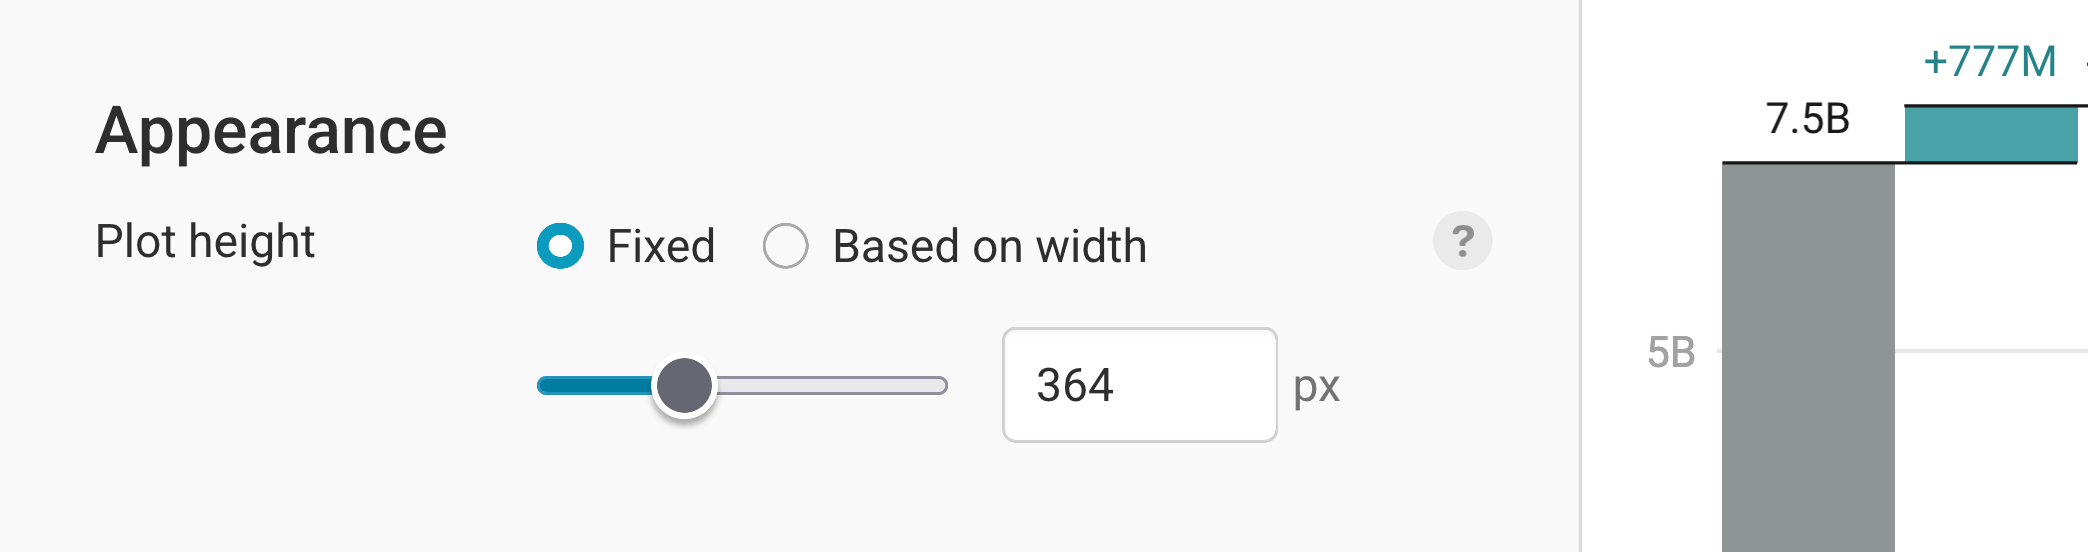
In the last panel of the Refine tab, you can decide on the height and the size of the margin of your chart.
You can set a fixed plot height, or one based on width that scales with the width of your chart. To learn more about the concept of chart resizing and the difference between fixed and width-based plot height, visit this Docs article.
After working through all these options in the Refine tab, let's move on to the next tab: Annotate.
Annotating your chart
Adding a title and source
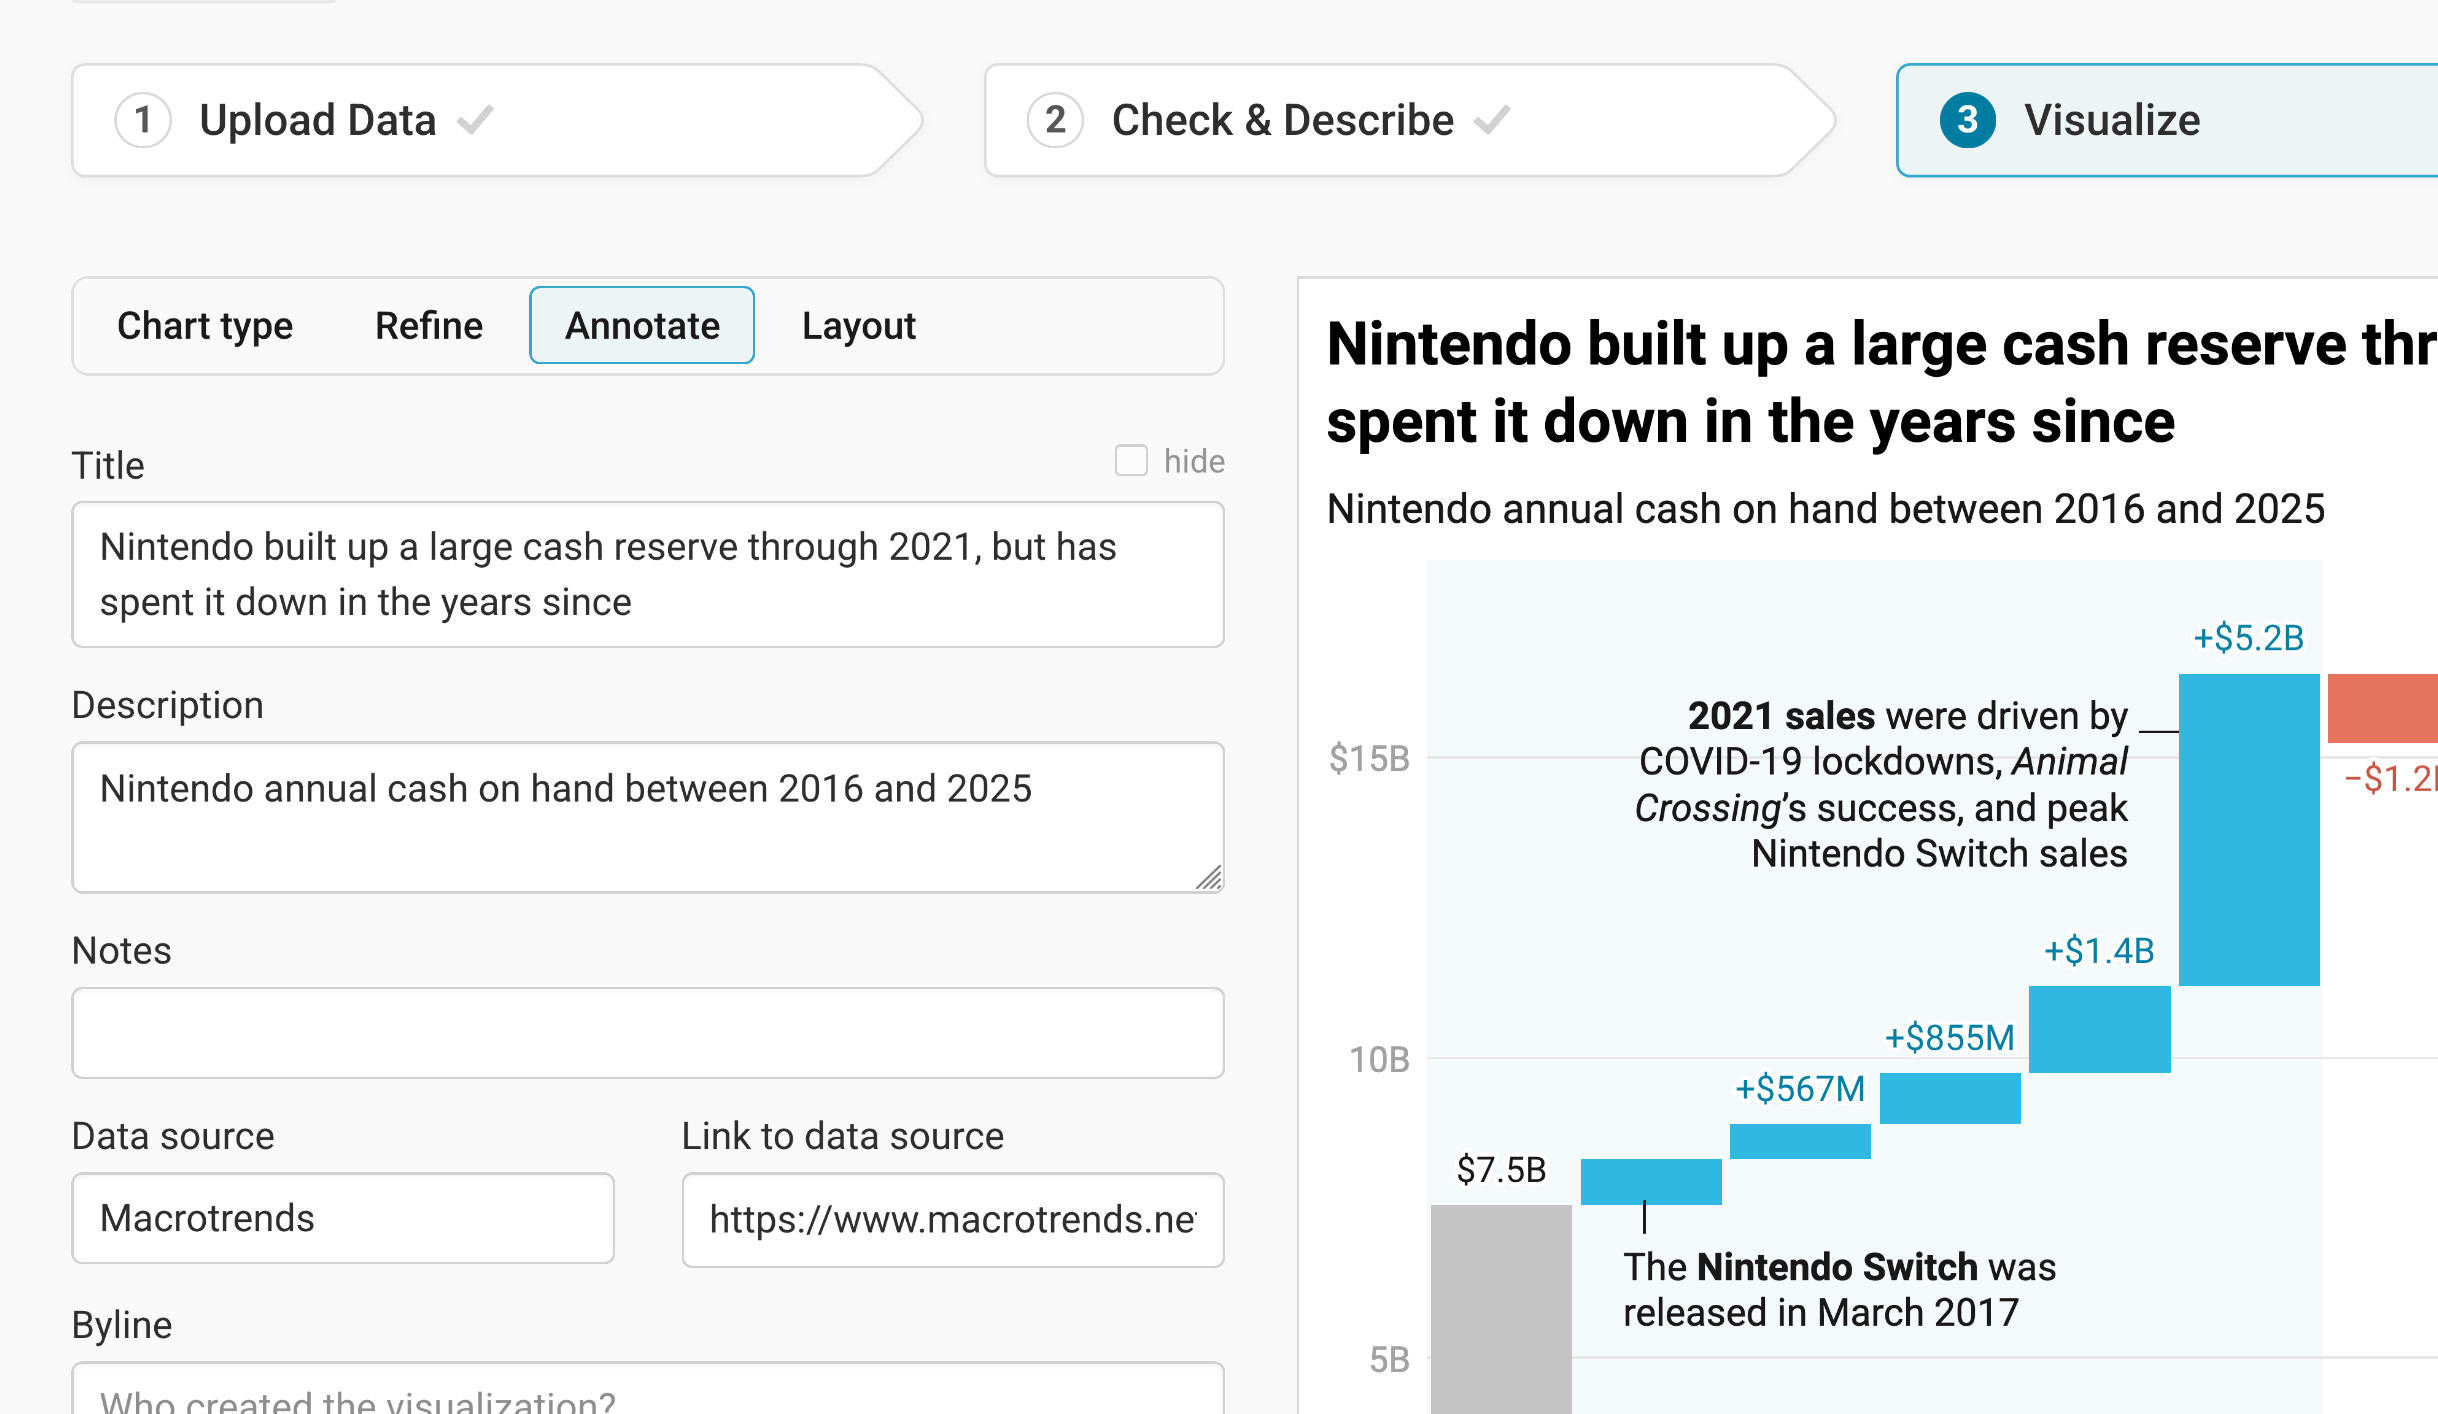
In the Annotate tab, you're first asked to give your visualization a title, description, notes, source, byline, and an alternative description for screen readers. You can find a detailed explanation of all these Annotate options here.
Adding text annotations
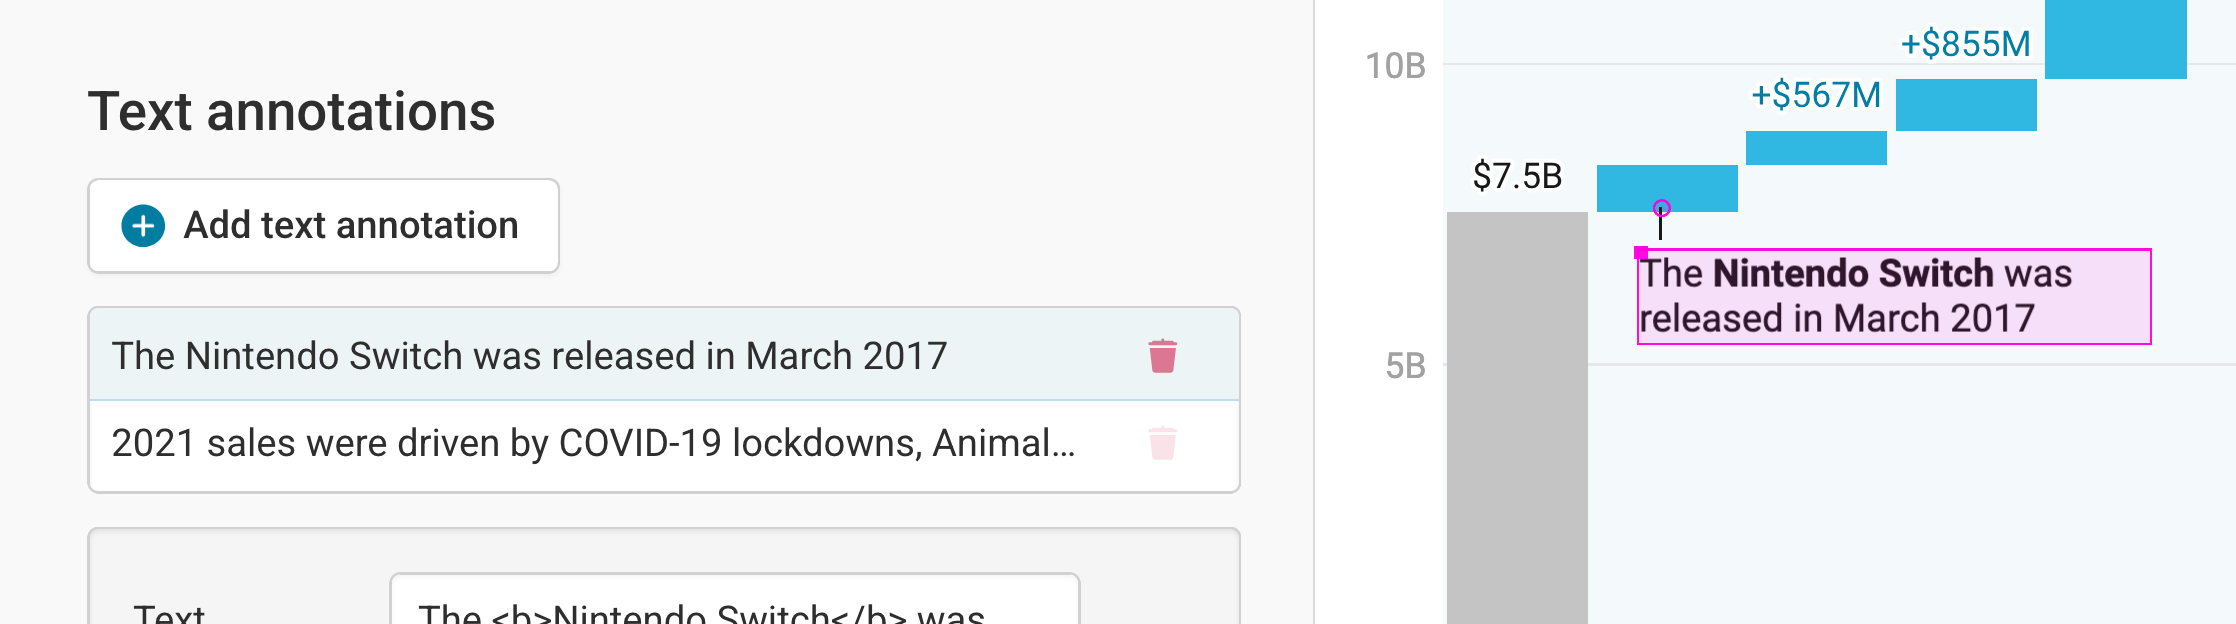
The next section lets you add and customize text annotations anywhere on your waterfall chart. It's a really powerful tool, so we wrote an extra article about it. Learn how to create text annotations here.
Highlighting ranges
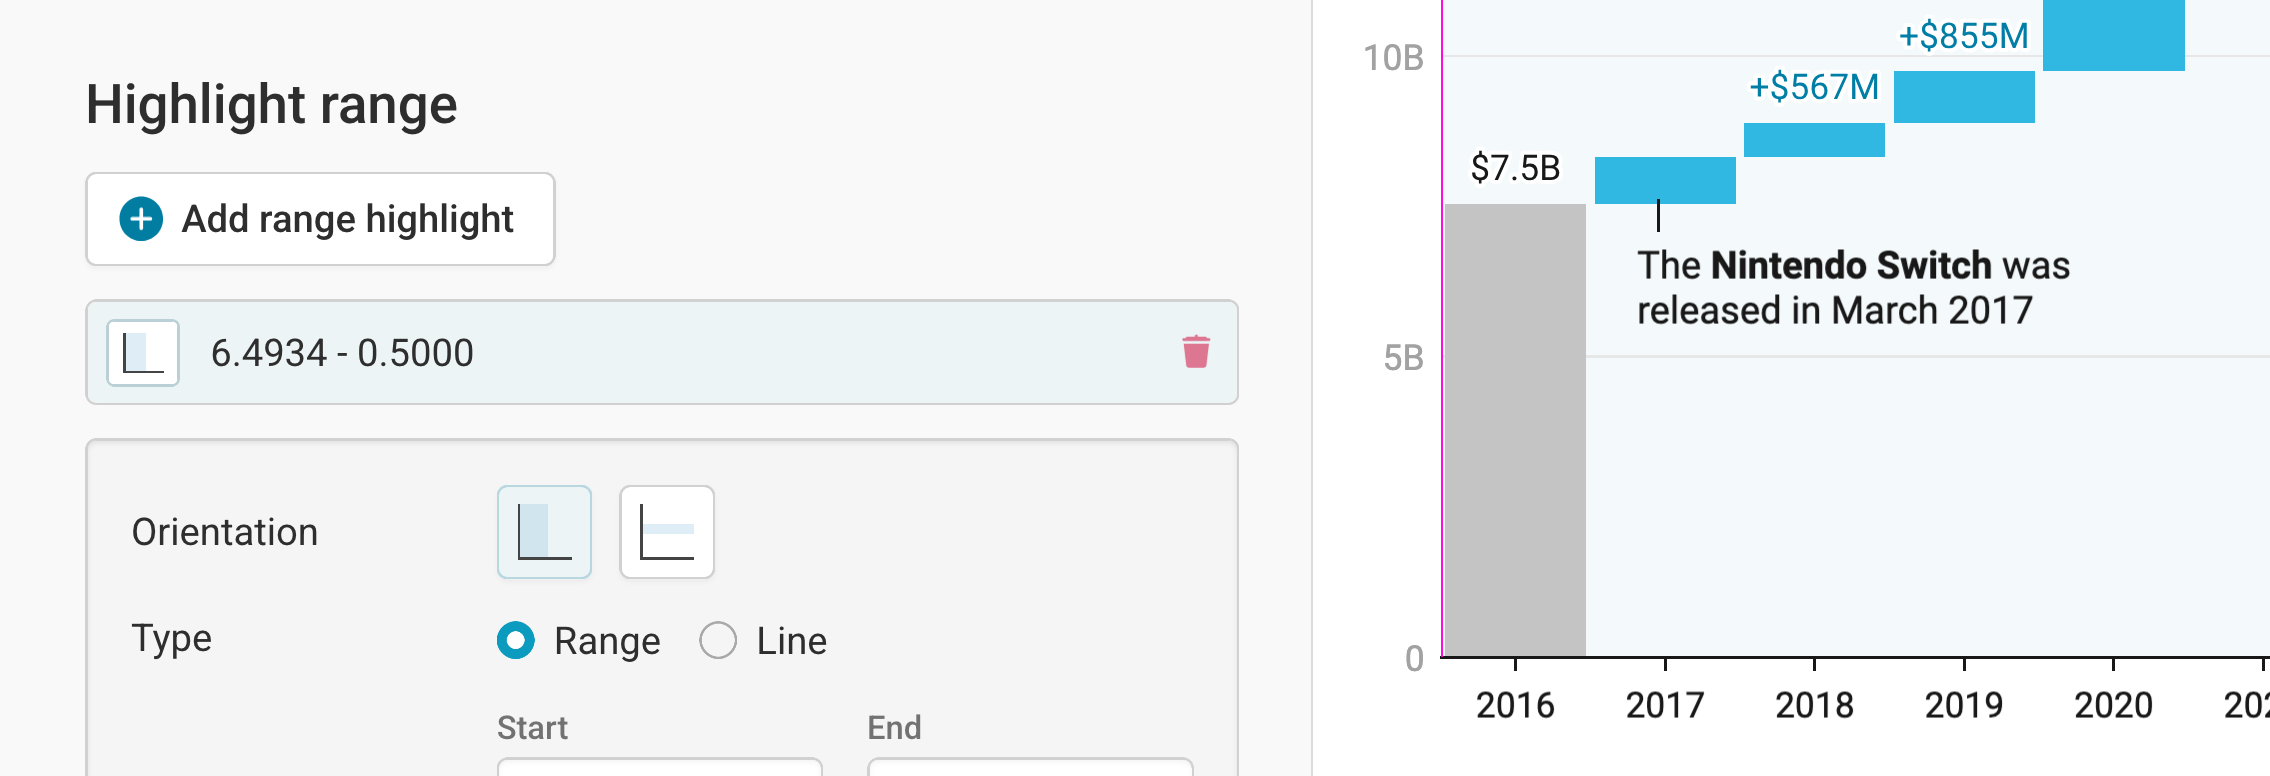
Finally, if you want to draw your reader's attention to one specific time range, the Highlight range tool is perfect. It lets you set semi-transparent colored overlays and lines directly in your chart. To do so, click on Add range highlight. Now select a starting and ending point of the range by clicking in the chart. If you want, you can also change the opacity of the highlighted range. Here's an in-depth explanation of all the options.
Publishing your chart
After adding text to our chart, only one tab is left in step 3: Visualize: the Layout tab. You can find all Layout settings explained in this Docs article.
In step 4: Publish & Embed, you can first publish your chart and then decide how it gets to your readers. We recommend pasting the embed code into your website or CMS, but you can also share the chart's URL. Learn more about both options here. To use your chart somewhere else, download it as a PNG (on any plan) or as an SVG or PDF (on paid plans). See what each plan includes on our pricing page.
And that's it! You've successfully created and customized a waterfall chart.